Determination of trace fluoroquinolones in water solutions and in medicinal preparations by conventional and synchronous fluorescence spectrometry
-
Ting Yao
 und
Ping Wang
und
Ping Wang

Abstract
Simple, rapid and sensitive and synchronous fluorescence spectrometry (SFS) were developed for determination the fluoroquinolones of ciprofloxacin (CIP), norfloxacin (NOR) and enrofloxacin (ENR) separately in water solutions and in medicinal preparations. The optimized wavelength intervals between the emission and excitation wavelengths were 170 nm, 160 nm and 170 nm for CIP, NOR and ENR, respectively. The different experimental parameters affecting the synchronous fluorescence intensities of the three fluoroquinolones were carefully studied. Under the optimal conditions, good linearity was obtained over the range of 0.01 to 1.20 mg/L, 0.005 to 0.45 mg/L and 0.005 to 0.60 mg/L for the CIP, NOR and ENR, and with good relative standard deviations below 1.9% (n=9). In addition, the detection limits for CIP, NOR and ENR were 0.17 μg/L, 0.013 μg/L and 0.055 μg/L, respectively. What is more, compared with the conventional fluorescence spectrometry, the SFS could detect lower concentrations of each fluoroquinolone. Moreover, the proposed SFS were validated and successfully applied for the quantitative assay of each fluoroquinolone in medicinal preparations.
1 Introduction
Fluoroquinolones (FQs), such as ciprofloxacin (CIP) norfloxacin (NOR) and enrofloxacin (ENR) are a group of synthetic antibacterial agents with broad-spectrum activity for both of gram positive and negative bacteria through inhibition of DNA gyrase [1, 2, 3]. Thus, they are commonly selected as antibacterial medicines to treat many diseases [4, 5]. However, they can act as toxic substances that cause direct toxicity or allergic reactions in hypersensitive individuals. In addition, microorganism resistance to these drugs can occur [6, 7, 8]. The widespread occurrence of FQs as contaminants in the aquatic environment has garnered increased attention in recent years. Consequently, attention has been paid to their determination in various environmental waters, e.g., waste water, surface water, ground water and drinking water [9, 10, 11, 12].
Several methods such as spectrophotometry [13], UV [14, 15], CE with ECL detection [16, 17], voltammetry [18], HPLC [19, 20, 21], HPLC-FLD [22], and NMR have been reported to determine the FQs [23]. Still, most of the above methods are time-consuming and quite tedious which need large volumes of organic solvents with sophisticated instrumentation. Among these methods, the fluorescence spectrometry assay is comparatively simple, time-saving, and especially suitable for the detection with many analytes in a trace amount [24, 25, 26, 27, 28]. fluorescence spectrometry has a growing importance in medicine analysis. The main advantage of fluorescence spectrometry is its high sensitivity and selectivity as compared to other spectroscopic methods [29]. Synchronous fluorescence spectrometry was first introduced by Lloyd [30]. And the synchronous fluorescence spectra, acquired by scanning excitation and emission monochromators simultaneously, can be modeled by Gaussian distributions of intensity versus energy [31]. Synchronous fluorescence spectrometry (SFS) has several advantages over conventional fluorescence spectrometry, including simple spectra and low interference. In addition, the SFS is a simple modification of the conventional fluorescence method that affords a higher selectivity by narrowing the spectral bands and simplifying the spectra [31]. Synchronous fluorescence spectra are measured using both excitation and emission monochromators locked together at a fixed wavelength interval (Δλ, Δλ=λem-λex) and simultaneous scanning. In this method, the selectivity is increased, and a high sensitivity is maintained [32, 33].
To the best of our knowledge, few studies have focused on the determination of FQs using SFS. The current study aimed to establish new SFS to determine typical FQs in water solutions by selecting CIP, NOR, and ENR as the model compounds (Figure 1). In addition, under the optimal experimental conditions, the CIP, NOR and ENR contents in medicinal preparations dissolved in water solutions were separately determined using the new SFS.
Chemical structures of CIP, NOR and ENR (A) CIP (B) NOR (C) ENR.
2 Experimental
2.1 Reagents and chemicals
The chemicals of CIP, NOR and ENR were obtained from Sigma-Aldrich. Stock solutions of each FQ were prepared by dissolving the solutes in ultrapure water and stored in a refrigerator. The working solutions of the individual CIP, NOR and ENR were prepared by appropriate dilution of the stock solutions of each FQ in ultrapure water before use. Other chemicals used were of analytical reagent grade.
In this experiment, two kinds of each FQ in the medicinal preparations were investigated. There were two CIP tablets called A (Hangzhou Minsheng Pharmaceutical Co., Ltd.) and B (Zhejiang Jingxin Pharmaceutical Co., Ltd.), two NOR tablets called C (Hangzhou Minsheng Pharmaceutical Co., Ltd.) and D (Jiangxi Tianzhihai Pharmaceutical Co., Ltd.) and two ENR injections called E (Sichuan Jixing Animal Pharmaceutical Co., Ltd.) and F (Shanxi Ruicheng Animal Pharmaceutical Co., Ltd.), respectively.
2.2 Apparatus
All the fluorescence measurements were recorded with a luminescence spectrometer (Hitachi F-4600, Japan), equipped with a xenon arc lamp, grating excitation and emission monochromators and a Hitachi F-4600 recorder. Fluorescence measurements were performed using the standard 1×1 cm2 quartz cells. The excitation and emission slits of each FQ were set to 5 nm. The scan speed was 1200 nm min-1, and the PMT voltage was 700 V.
2.3 Selection of the optimal Δλ for each FQ by the SFS
The working solutions of each FQ were added into the fluorescence spectrophotometer. In addition, the synchronous fluorescence spectra of each FQ was collected by simultaneously scanning the excitation and emission monochromators in the range of 200 to 500 nm at room temperature. The optimal value of each FQ in this study was investigated by changing the Δλ in the range of 10 to 190 nm in an interval of 10 nm. Finally, the optimal Δλ for each FQ was selected based on which wavelength showed the strongest fluorescence intensity and the best synchronous fluorescence spectrum. The synchronous fluorescence measurements were performed in triplicate for each sample.
2.4 Analysis of each FQ by the SFS in the medicinal preparations
In this study, the experimental methods for processing the tablets of CIP and NOR comprised the following steps: (1) An accurately weighed amount of A, B, C and D were separately transferred into a clean dry 100 ml flask and about 80 ml ultrapure water was added. (2) The flasks for each of the tablet were centrifuged for approximately 10 min at a speed of 4000 rpm. (3) The supernatants of the individual A and B were determined by the established SFS and the established conventional spectrometry for CIP, respectively. And the supernatants of the individual C and D were determined by the established SFS and the established conventional spectrometry for NOR, respectively. All the experiments were repeated three times at room temperature.
In this work, the processing methods for the ENR injections were as follows. A certain volume of E and F were separately diluted with ultrapure water into a clean dry 100 ml volumetric. Then, the solutions of the individual E and F were determined by the established SFS and the established conventional spectrometry for ENR, respectively. All the experiments were repeated three times at room temperature.
Ethical approval: The conducted research is not related to either human or animal use.
3 Results and Discussion
3.1 Fluorescence excitation and emission spectra of CIP, NOR and ENR in water solutions
In this work, the conventional fluorescence excitation and emission spectra of CIP, NOR and ENR in water solutions were obtained, respectively. The experimental results indicated that the fluorescence excitation and emission spectra of CIP, NOR and ENR were basically identical, because of their similar molecular structures (Figure 1). It was found that each FQ showed two different excitation peaks and only one emission peak. In addition, the maximum excitation wavelengths of CIP, NOR and ENR were 277 nm, 276 nm and 277 nm, and the emission wavelengths of CIP, NOR and ENR were 445 nm, 444 nm and 444 nm, respectively.
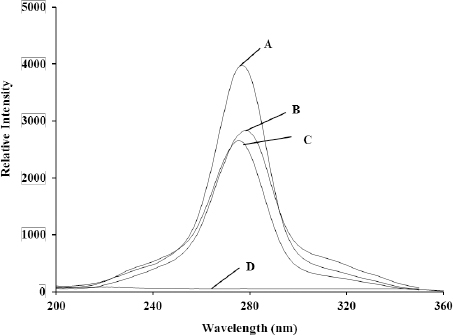
For this study, the working solutions of CIP, NOR and ENR were diluted by their stock solutions, respectively. In addition, the CIP was selected as the example, and the conventional fluorescence excitation and emission spectra of CIP in water solutions were shown in Figure 2. As can be seen in Figure 2, the autofluorescence of the solvent (C and D) was very weak and did not affect the results of CIP determination. Moreover, the same experimental results were also obtained that the autofluorescence of the solvent was very weak and did not affect the determinations of NOR and ENR, respectively. Thus, a series of the standard solutions of each FQ, in which the concentration of one component was variable and the other was fixed, were prepared and determined under the instrumental parameters. As shown in Table 1, a good linear relationship was obtained for each FQ, between the fluorescence intensity and the concentration of the analyte. Finally, new conventional fluorescence spectrometry for the separate determination of CIP, NOR and ENR in water solutions were established, respectively.
Performance data for the determination of CIP, NOR and ENR concentrations in water solutions.
| Method | Linear Range (mg/L) | Calibration Equation | Correlation Coefficient | Detection Limit (μg/L) |
|---|---|---|---|---|
| 1 | 0.01~1.20 | y[a] = 8047x[d] + 162.49 | 0.9989 | 0.17 |
| 2 | 0.10~1.0 | y = 8198.6x – 323.89 | 0.9995 | 0.25 |
| 3 | 0.005~0.45 | y = 19696x + 199.07 | 0.9979 | 0.013 |
| 4 | 0.025~0.35 | y = 27732x + 51.378 | 0.9997 | 0.022 |
| 5 | 0.005~0.60 | y = 18243x + 173.08 | 0.9987 | 0.055 |
| 6 | 0.05~0.80 | y = 18153x + 49.048 | 0.9992 | 0.062 |
1: Synchronous spectrometric method for determination of CIP in water solutions.
2: Conventional spectrometric method for determination of CIP in water solutions.
3: Synchronous spectrometric method for determination of NOR in water solutions.
4: Conventional spectrometric method for determination of NOR in water solutions.
5: Synchronous spectrometric method for determination of ENR in water solutions.
6: Conventional spectrometric method for determination of ENR in water solutions.
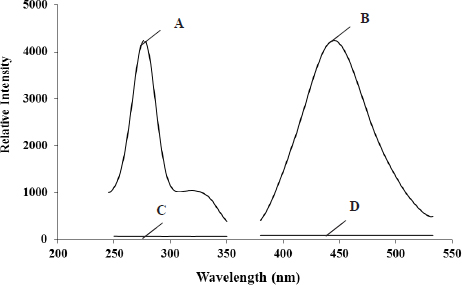
The conventional fluorescence excitation (A) and emission (B) spectra of CIP in water solutions. (A) Fluorescence excitation spectrum of CIP in water solutions; (B) Fluorescence emission spectrum of CIP in water solutions; (C) Fluorescence excitation spectrum of solvent; (D) Fluorescence emission spectrum of solvent.
3.2 Synchronous fluorescence spectra of CIP, NOR and ENR in water solutions
It is well known that the selection of Δλ is an important parameter to obtain a good sensitivity and selectivity [29, 30, 31]. In SFS both the excitation and emission monochromators are scanned simultaneously in such a manner that a constant wavelength interval (Δλ) is kept between emission and excitation wavelengths [32]. In this study, it was investigated by changing Δλ in the range from 0 to 190 nm in an interval of 10 nm (A: 10 nm, 20 nm, 30 nm, 40 nm, 50 nm, 60 nm; B: 70 nm, 80 nm, 90 nm, 100 nm, 110 nm, 120 nm; C: 130 nm, 140 nm, 150 nm, 160 nm, 170 nm, 180 nm, 190 nm). The experimental results indicated that the optimized Δλ for CIP, NOR and ENR were also basically identical in water solutions. They were 170 nm for CIP, 160 nm for NOR and 170 nm for ENR, respectively. In addition, each FQ had only one synchronous fluorescence peak in their optimized Δλ. They were 277 nm for CIP, 276 nm for NOR and 275 nm for ENR, respectively. In this experiment, the CIP was selected as the example to show its synchronous fluorescence spectrum with the different Δλ (Figure 3). In addition, experimental results also showed that the synchronous fluorescence intensity of the solvent was notably weak in the optimized Δλ and did not interfere with the spectra of CIP, NOR and ENR in water solutions. Moreover, the synchronous fluorescence intensities of each FQ in the optimized Δλ were also basically identical to their conventional fluorescence intensities. Furthermore, the width of the half-wide spectral band for the synchronous fluorescence spectra became much narrower than that of the conventional emission spectra for each FQ. Figure 4 showed the synchronous fluorescence spectrum and the emission spectrum of CIP in water solutions. Thus, the experimental results demonstrated the potential to use SFS to determine the concentrations of CIP, NOR and ENR in water solutions, respectively.
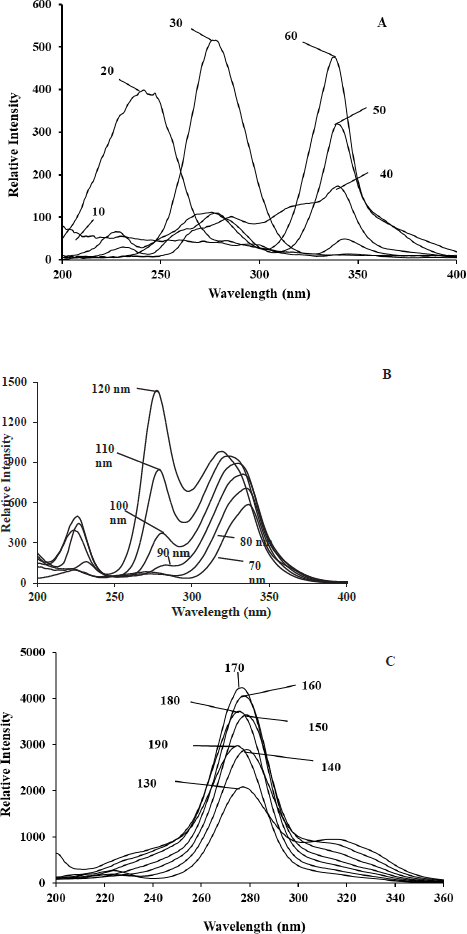
Synchronous fluorescence spectra of CIP in water with different Δλ. (A) Δλ=(10 nm, 20 nm, 30 nm, 40 nm, 50 nm, 60 nm); (B) Δλ=(70 nm, 80 nm, 90 nm, 100 nm, 110 nm, 120 nm); (C) Δλ=(130 nm, 140 nm, 150 nm, 160 nm, 170 nm, 180 nm, 190 nm).
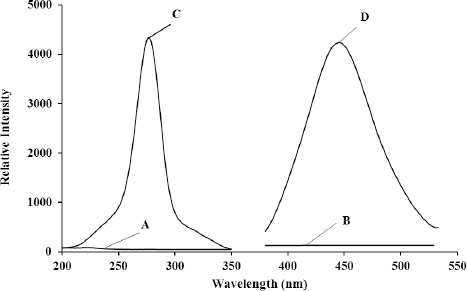
The synchronous fluorescence spectrum and the emission spectrum of the conventional fluorescence for CIP in water solutions. (A) Synchronous fluorescence spectrum of solvent; (B) Emission spectrum of solvent; (C) Synchronous fluorescence spectrum of CIP in water solutions; (D) Emission spectrum of CIP in water solutions.
In the study above, the optimized Δλ for each FQ was observed. Then, further studies were investigated the synchronous fluorescence properties of different concentrations of each FQ for their optimal Δλ. Under identical experimental conditions, the synchronous fluorescence intensities varied with the various concentrations of each FQ. In addition, within a certain range, the fluorescence intensities linearly increased when the exposure quantities of CIP, NOR and ENR increased. Thus, the new SFS to directly determine CIP, NOR and ENR in water solutions were successfully established, respectively. Moreover, the calibration equations, linear ranges, correlation coefficients, and detection limits of the established methods for each FQ were shown in Table 1. Compared with the conventional fluorescence spectrometry for the determination of each FQ in water solutions, the SFS had lower limits of detection. Furthermore, the linear ranges of the SFS for determination of each FQ were much larger than that of the conventional fluorescence spectrometry (Table1).
3.3 Using SFS for direct determination the contents of CIP, NOR and ENR in medical preparations
In this research, the established SFS and the established conventional spectrometry were tried to directly determine the contents of CIP, NOR and ENR in medical preparations. In order to contrast, two types of CIP tablets (A and B), NOR tablets (C and D) and ENR injections (E and F) were able to opt for further studies. After being pretreated with different ways, the water solutions of A, B, C, D, E and F were obtained, firstly. Secondly, the synchronous fluorescence spectra of the water solutions for each FQ were determined in the optimal Δλ. The experimental results demonstrated that the optimal Δλ was 170 for A and B, 160 for C and D, and 170 for E and F. In addition, they were generally identical to the standard solutions of CIP, NOR and ENR, respectively. Further results also indicated that the other ingredients mixed in each medical preparation did not produce synchronous fluorescence signals in the optimal Δλ. The CIP was also selected as the example in this study. And the synchronous fluorescence spectra of the standard solution of CIP, A and B in the optimal Δλ were shown in Figure 5.
The synchronous fluorescence spectra of the standard CIP (277 nm) and two types of CIP tablets (A: 278 nm; B: 276 nm) mixed in water solution. (A) Synchronous fluorescence spectrum of the standard CIP; (B) Synchronous fluorescence spectrum of the CIP tablet of A; (C) Synchronous fluorescence spectrum of the CIP tablet of B; (D) Synchronous fluorescence spectrum of the other ingredients in water solution.
As can be seen from the Figure 5, the synchronous fluorescence intensities of the other ingredients mixed in A and B were notably weak with no distractions of the synchronous fluorescence spectra of standard solution of CIP, A and B in water solutions (Figure 5). Finally, the contents of A, B, C, D, E and F were separately determined using the newly established SFS. The following were the results of the experiment: (1) The quantities of CIP in one tablet of A and B were 0.27 g and 0.28 g, respectively, and the values were basically identical to the contents from the medical instructions (0.25 g and 0.25 g). (2) The quantities of NOR in one tablet of C and D were 0.09 g and 0.12 g, respectively, which agreed with the contents from the medical instructions (0.10 g and 0.10 g). (3) The quantities of ENR in one bottle of injection of E and F were 0.10 g/ml and 0.11 g/ml, respectively, which were very consistent with the medical instructions (0.10 g/ml and 0.10 g/ml). Therefore, the proposed SFS successfully extended to applying into calculation the concentrations of CIP, NOR and ENR in medical preparations, respectively. In addition, the established conventional spectrometric methods were also used to determine the quantities of CIP, NOR and ENR in their medical preparations, respectively. And the results also indicated that the values of each FQ determined by the conventional spectrometric methods were basically identical to the contents from their medical instructions.
4 Conclusions
The SFS is a technique used to analyse dissolved fluorescent substances in water samples with satisfactory recoveries. This method is rapid, sensitive, and inexpensive and does not necessitate complicated sample pretreatment with large amounts of organic solvents. In this study, The SFS were utilized for direct determination the content of each FQ in water solutions. Experimental results also indicated that the SFS could determine lower concentrations of CIP, NOR and ENR in water solutions compared with the conventional fluorescence spectrometry. Finally, the newly established SFS methods were successfully applied to determine the contents of CIP, NOR and ENR in medical preparations. In conclusion, the SFS might have great potential for development as in situ techniques to determine FQs in the aquatic environmental in which the other ingredients do not produce synchronous fluorescence signals. They also might be convenient methods to investigate the fluorescence behaviors of FQs in the aquatic environmental and simultaneous determination of two or more FQ components in the near future.
Conflicts of Interest: We declared that we have no conflicts of interest to this work.
Acknowledgements
We would like to thank “American Journal Experts” for their help to this manuscript. Many thanks to the staff in the College of the Environment and Ecology of Xiamen University for their support in the field experiments and for facilitating the work on their estate. Thanks to the support by Natural Science Foundation of Zhejiang Province (LY15B070011) and the National Natural Science Foundation of China (21207103).
References
[1] Guven M., Barnouin K., Snijders A.P.L., Karran P., Photosensitized UVA-induced cross-linking between human DNA repair and replication proteins and DNA revealed by proteomic analysis, J. Proteome. Res., 2016, 15, 4612-4623.10.1021/acs.jproteome.6b00717Suche in Google Scholar PubMed PubMed Central
[2] Pokrovskaya V., Belakhov V., Hainrichson M., Yaron S., Baasov T., Design, synthesis, and evaluation of novel fluoroquinolone-aminoglycoside hybrid antibiotics, J. M. Chem., 2009, 52, 2243-2254.10.1021/jm900028nSuche in Google Scholar PubMed
[3] Pinacho D.G., Sánchez-Baeza F., Marco M.P., Molecular modeling assisted hapten design to produce broad selectivity antibodies for Fluoroquinolone antibiotics, Anal. Chem., 2012, 84, 4527-4534.10.1021/ac300263mSuche in Google Scholar PubMed
[4] Gorokhova E., Rivetti C., Furuhagen S., Edlund A., Ekand K., Breitholtz M., Bacteria-Eediated effects of antibiotics on daphnia nutrition, Environ. Sci. Technol., 2015, 49, 5779-5787.10.1021/acs.est.5b00833Suche in Google Scholar PubMed
[5] Otvos L., Wade J.D., Lin F., Condie B.A., Hanrieder J., Hoffmann R., Designer antibacterial peptides kill fluoroquinolone-resistant clinical isolates, J. M. Chem., 2005, 48, 5349-5359.10.1021/jm050347iSuche in Google Scholar PubMed
[6] Aristilde L., Melis A., Sposito G., Inhibition of photosynthesis by a fluoroquinolone antibiotic, Environ. Sci. Technol., 2010, 44, 1444-1450.10.1021/es902665nSuche in Google Scholar PubMed
[7] Drlica K., Mustaev A., Towle T., Gan L., Kerns R.J., Berger J.M., Bypassing fluoroquinolone resistance with Quinazolinediones: studies of Drug-Gyrase-DNA complexes having implications for drug design, Acs. Chem. Biol., 2014, 9, 2895-2904.10.1021/cb500629kSuche in Google Scholar PubMed PubMed Central
[8] Renau T.E., Léger R., Flamme E.M., Sangalang J., She M.W., Yen R., et al, Inhibitors of efflux pumps in pseudomonas aeruginosa potentiate the activity of the fluoroquinolone antibacterial levofloxacin, J. M. Chem., 1999, 42, 4928-4931.10.1021/jm9904598Suche in Google Scholar PubMed
[9] Golet E.M., Alder A.C., Hartmann A., Ternes T.A., Giger W., Trace determination of fluoroquinolone antibacterial agents in urban wastewater by Solid-Phase extraction and liquid chromatography with fluorescence detection, Anal. Chem., 2001, 73, 3632-3638.10.1021/ac0015265Suche in Google Scholar PubMed
[10] Golet E.M., Alder A.C., Giger W., Environmental exposure and risk assessment of fluoroquinolone antibacterial agents in wastewater and river water of the Glatt Valley Watershed, Switzerland, Environ. Sci. Technol., 2002, 36, 3645-3651.10.1021/es0256212Suche in Google Scholar PubMed
[11] Rodríguez E., Navarrovilloslada F., Benitopeña E., Marazuela M.D., Morenobondi M.C., Multiresidue determination of ultratrace levels of fluoroquinolone antimicrobials in drinking and aquaculture water samples by automated online molecularly imprinted solid phase extraction and liquid chromatography, Anal. Chem., 2011, 83, 2046-2055.10.1021/ac102839nSuche in Google Scholar
[12] Seifrtováa M., Novákováa L., Linob C., Penab A., Solicha P., An overview of analytical methodologies for the determination of antibiotics in environmental waters, Anal. Chim. Acta., 2009, 649, 158-179.10.1016/j.aca.2009.07.031Suche in Google Scholar
[13] Adhikari L., Jagadev S., Sahu S., Moitra S.K., Murthy P.N., Derivative spectrophotometric determination of adapalene in its bulk and pharmaceutical dosage form, Asian. J. Chem., 2012, 24, 1094-1096.Suche in Google Scholar
[14] Kassab N.M., Amaral M.S., Singh A.K., Santoro M.I.R.M., Development and validation of UV spectrophotometric method for determination of Levofloxacin in pharmaceutical dosage forms, Quim. Nova., 2010, 33, 968-971.10.1590/S0100-40422010000400037Suche in Google Scholar
[15] Cazedey L., Cristina E., Salgado N., Refina H., Development and validation of UV spectrophotometric method for Orbifloxacin assay and dissolution studies, Braz. J. Pharm. Sci., 2014, 50, 457-465.10.1590/S1984-82502014000300003Suche in Google Scholar
[16] Hernández M., Aguilar C., Borrull F., Calull M., Determination of Ciprofloxacin, Enrofloxacin and Flumequine in pig plasma samples by capillary Isotachophoresis-capillary zone electrophoresis, J. Chromatogr. B., 2012, 772, 163-172.10.1016/S1570-0232(02)00071-5Suche in Google Scholar
[17] Hernández M., Borrull F., Calull M., Study of on-line stacking procedures for analyzing marbofloxacin by capillary zone electrophoresis, 2012, Chromatographia., 55, 585-590.10.1007/BF02492905Suche in Google Scholar
[18] Trindade M.A.G., Silva G.M., Ferreira V.S., Determination of moxifloxacin in tablets and human urine by square-wave adsorptive voltammetry. Microchem. J., 2005, 81, 209-216.10.1016/j.microc.2005.06.002Suche in Google Scholar
[19] Patel R.B., Patel M.R., Chaudhari M.D., Stability indicating high performance liquid chromatographic method for estimation of adapalene in tablet formulation, J. Liq. Chromatogr. Rt., 2014, 37, 379-390.10.1080/10826076.2012.745142Suche in Google Scholar
[20] Shaikh S., Thusleem O.A., Muneera M.S., Akmal J., Kondaguli A.V., Ruckmani K., A simple and rapid high-performance liquid chromatographic method for the determination of bisoprolol fumarate and hydrochlorothiazide in a tablet dosage form, J. Pharmaceut. Biomed., 2008, 48, 1055-1057.10.1016/j.jpba.2008.08.009Suche in Google Scholar
[21] Liang H., Kays M.B., Sowinski K.M., Separation of Levofloxacin, Ciprofloxacin, Gatifloxacin, Moxifloxacin, Trovafloxacin and Cinoxacin by high-performance liquid chromatography, application to Levofloxacin determination in human plasma, J. Chromatogr., 2002, 772, 53-63.10.1016/S1570-0232(02)00046-6Suche in Google Scholar
[22] Chan K.P., Chu K.O., Lai W.W.K., Choy K.W., Wang C.C., Lam D.S.C., et al, Determination of ofloxacin and moxifloxacin and their penetration in human aqueous and vitreous humor by using high-performance liquid chromatography fluorescence detection, Anal. Biochem., 2006, 353, 30-36.10.1016/j.ab.2006.03.016Suche in Google Scholar
[23] Andrzej C., Analytical methods for determining third and fourth generation fluoroquinolones, A Review, Chromatographial, 2017, 80, 181-200.10.1007/s10337-016-3224-8Suche in Google Scholar
[24] Peña D.L., Mansilla A.E., Gómez D.G., Olivieri A.C., Goicoechea H.C., Interference-Free analysis using three-way fluorescence data and the parallel factor model determination of fluoroquinolone antibiotics in human serum, Anal. Chem., 2003, 75, 2640-2646.10.1021/ac026360hSuche in Google Scholar
[25] Yin S.N., Yao T., Wu T.H., Zhang Y., Wang P., Novel metal nanoparticle-enhanced fluorescence for determination of trace amounts of fluoroquinolone in aqueous solutions, Talanta, 2017, 174, 14-20.10.1016/j.talanta.2017.05.053Suche in Google Scholar
[26] Wang P., Zou Y.J., Zhang Y., Wang X.D., Investigation of the effect of nano silver on fluorescence properties of Norfloxacin, Nanosci. Nanotech. Let., 2012, 4, 854-858.10.1166/nnl.2012.1423Suche in Google Scholar
[27] Ulu S.T., Rapid and sensitive spectrofluorimetric determination of Enrofloxacin, Levofloxacin and Ofloxacin with 2,3,5,6-tetrachloro-p-benzoquinone, Spectrochimica Acta Part A, Spectrochim. Acta. A., 2009, 72, 1038-1042.10.1016/j.saa.2008.12.046Suche in Google Scholar
[28] Hang R., Su Y.T., Guo X.H., Rapid optimization of spore production from Bacillus amyloliquefaciens in submerged cultures based on dipicolinic acid fluorimetry assay, AMB. Express., 2018, 8, 21.10.1186/s13568-018-0555-xSuche in Google Scholar
[29] Sikorska E., Gliszcynskaswiglo A., Khmelinskii A.L., Sikorski M., Synchronous fluorescence spectroscopy of edible vegetable oils quantification of tocopherols, J. Agr. Food. Chem., 2005, 53, 6988-6994.10.1021/jf0507285Suche in Google Scholar
[30] Lloyd J. B. F., The nature and evidential value of the luminescence of automobile engine oils and related materials. I. Synchronous excitation of fluorescence emission, J. Foren. Sci. Soci., 1971, 11, 83-94.10.1016/S0015-7368(71)70633-1Suche in Google Scholar
[31] Siriwardana K., Nettles C.B., Vithanage B.C.N., Zhou Y., Zou S., Zhang D., On-Resonance fluorescence, resonance rayleigh scattering, and ratiometric resonance synchronous spectroscopy of molecular and quantum Dot-Fluorophores, Anal. Chem., 2016, 88, 9199-9206.10.1021/acs.analchem.6b02420Suche in Google Scholar PubMed
[32] Salvetat R., Juneau P., Popovic R., Measurement of chlorophyll fluorescence by synchronous detection in integrating sphere: a modified analytical approach for the accurate determination of photosynthesis parameters for whole plants, Environ. Sci. Technol., 1998, 32, 2640-2645.10.1021/es971039fSuche in Google Scholar
[33] Li X.Y., Li N., Luo H.D., Lin L.R., Zou Z.X., Jia Y.Z., et al, A novel synchronous fluorescence spectroscopic approach for the rapid determination of three Polycyclic Aromatic Hydrocarbons in tea with simple microwave-assisted pretreatment of sample, J. Agr. Food, Chem., 2011, 59, 5899-5905.10.1021/jf104873gSuche in Google Scholar PubMed
© 2018 Ting Yao et al., published by De Gruyter
This work is licensed under the Creative Commons Attribution-NonCommercial-NoDerivatives 4.0 License.
Artikel in diesem Heft
- Regular Articles
- The effect of CuO modification for a TiO2 nanotube confined CeO2 catalyst on the catalytic combustion of butane
- The preparation and antibacterial activity of cellulose/ZnO composite: a review
- Linde Type A and nano magnetite/NaA zeolites: cytotoxicity and doxorubicin loading efficiency
- Performance and thermal decomposition analysis of foaming agent NPL-10 for use in heavy oil recovery by steam injection
- Spectroscopic (FT-IR, FT-Raman, UV, 1H and 13C NMR) insights, electronic profiling and DFT computations on ({(E)-[3-(1H-imidazol-1-yl)-1-phenylpropylidene] amino}oxy)(4-nitrophenyl)methanone, an imidazole-bearing anti-Candida agent
- A Simplistic Preliminary Assessment of Ginstling-Brounstein Model for Solid Spherical Particles in the Context of a Diffusion-Controlled Synthesis
- M-Polynomials And Topological Indices Of Zigzag And Rhombic Benzenoid Systems
- Photochemical Transformation of some 3-benzyloxy-2-(benzo[b]thiophen-2-yl)-4Hchromen-4-ones: A Remote Substituent Effect
- Dynamic Changes of Secondary Metabolites and Antioxidant Activity of Ligustrum lucidum During Fruit Growth
- Studies on the flammability of polypropylene/ammonium polyphosphate and montmorillonite by using the cone calorimeter test
- DSC, FT-IR, NIR, NIR-PCA and NIR-ANOVA for determination of chemical stability of diuretic drugs: impact of excipients
- Antioxidant and Hepatoprotective Effects of Methanolic Extracts of Zilla spinosa and Hammada elegans Against Carbon Tetrachlorideinduced Hepatotoxicity in Rats
- Prunus cerasifera Ehrh. fabricated ZnO nano falcates and its photocatalytic and dose dependent in vitro bio-activity
- Organic biocides hosted in layered double hydroxides: enhancing antimicrobial activity
- Experimental study on the regulation of the cholinergic pathway in renal macrophages by microRNA-132 to alleviate inflammatory response
- Synthesis, characterization, in-vitro antimicrobial properties, molecular docking and DFT studies of 3-{(E)-[(4,6-dimethylpyrimidin-2-yl)imino]methyl} naphthalen-2-ol and Heteroleptic Mn(II), Co(II), Ni(II) and Zn(II) complexes
- M-Polynomials and Topological Indices of Dominating David Derived Networks
- Human Health Risk Assessment of Trace Metals in Surface Water Due to Leachate from the Municipal Dumpsite by Pollution Index: A Case Study from Ndawuse River, Abuja, Nigeria
- Analysis of Bowel Diseases from Blood Serum by Autofluorescence and Atomic Force Microscopy Techniques
- Hydrographic parameters and distribution of dissolved Cu, Ni, Zn and nutrients near Jeddah desalination plant
- Relationships between diatoms and environmental variables in industrial water biotopes of Trzuskawica S.A. (Poland)
- Optimum Conversion of Major Ginsenoside Rb1 to Minor Ginsenoside Rg3(S) by Pulsed Electric Field-Assisted Acid Hydrolysis Treatment
- Antioxidant, Anti-microbial Properties and Chemical Composition of Cumin Essential Oils Extracted by Three Methods
- Regulatory mechanism of ulinastatin on autophagy of macrophages and renal tubular epithelial cells
- Investigation of the sustained-release mechanism of hydroxypropyl methyl cellulose skeleton type Acipimox tablets
- Bio-accumulation of Polycyclic Aromatic Hydrocarbons in the Grey Mangrove (Avicennia marina) along Arabian Gulf, Saudi Coast
- Dynamic Change of Secondary Metabolites and spectrum-effect relationship of Malus halliana Koehne flowers during blooming
- Lipids constituents from Gardenia aqualla Stapf & Hutch
- Effect of using microwaves for catalysts preparation on the catalytic acetalization of glycerol with furfural to obtain fuel additives
- Effect of Humic Acid on the Degradation of Methylene Blue by Peroxymonosulfate
- Serum containing drugs of Gua Lou Xie Bai decoction (GLXB-D) can inhibit TGF-β1-Induced Epithelial to Mesenchymal Transition (EMT) in A549 Cells
- Antiulcer Activity of Different Extracts of Anvillea garcinii and Isolation of Two New Secondary Metabolites
- Analysis of Metabolites in Cabernet Sauvignon and Shiraz Dry Red Wines from Shanxi by 1H NMR Spectroscopy Combined with Pattern Recognition Analysis
- Can water temperature impact litter decomposition under pollution of copper and zinc mixture
- Released from ZrO2/SiO2 coating resveratrol inhibits senescence and oxidative stress of human adipose-derived stem cells (ASC)
- Validated thin-layer chromatographic method for alternative and simultaneous determination of two anti-gout agents in their fixed dose combinations
- Fast removal of pollutants from vehicle emissions during cold-start stage
- Review Article
- Catalytic activities of heterogeneous catalysts obtained by copolymerization of metal-containing 2-(acetoacetoxy)ethyl methacrylate
- Antibiotic Residue in the Aquatic Environment: Status in Africa
- Regular Articles
- Mercury fractionation in gypsum using temperature desorption and mass spectrometric detection
- Phytosynthetic Ag doped ZnO nanoparticles: Semiconducting green remediators
- Epithelial–Mesenchymal Transition Induced by SMAD4 Activation in Invasive Growth Hormone-Secreting Adenomas
- Physicochemical properties of stabilized sewage sludge admixtures by modified steel slag
- In Vitro Cytotoxic and Antiproliferative Activity of Cydonia oblonga flower petals, leaf and fruit pellet ethanolic extracts. Docking simulation of the active flavonoids on anti-apoptotic protein Bcl-2
- Synthesis and Characterization of Pd exchanged MMT Clay for Mizoroki-Heck Reaction
- A new selective, and sensitive method for the determination of lixivaptan, a vasopressin 2 (V2)-receptor antagonist, in mouse plasma and its application in a pharmacokinetic study
- Anti-EGFL7 antibodies inhibit rat prolactinoma MMQ cells proliferation and PRL secretion
- Density functional theory calculations, vibration spectral analysis and molecular docking of the antimicrobial agent 6-(1,3-benzodioxol-5-ylmethyl)-5-ethyl-2-{[2-(morpholin-4-yl)ethyl] sulfanyl}pyrimidin-4(3H)-one
- Effect of Nano Zeolite on the Transformation of Cadmium Speciation and Its Uptake by Tobacco in Cadmium-contaminated Soil
- Effects and Mechanisms of Jinniu Capsule on Methamphetamine-Induced Conditioned Place Preference in Rats
- Calculating the Degree-based Topological Indices of Dendrimers
- Efficient optimization and mineralization of UV absorbers: A comparative investigation with Fenton and UV/H2O2
- Metabolites of Tryptophane and Phenylalanine as Markers of Small Bowel Ischemia-Reperfusion Injury
- Adsorption and determination of polycyclic aromatic hydrocarbons in water through the aggregation of graphene oxide
- The role of NR2C2 in the prolactinomas
- Chromium removal from industrial wastewater using Phyllostachys pubescens biomass loaded Cu-S nanospheres
- Hydrotalcite Anchored Ruthenium Catalyst for CO2 Hydrogenation Reaction
- Preparation of Calcium Fluoride using Phosphogypsum by Orthogonal Experiment
- The mechanism of antibacterial activity of corylifolinin against three clinical bacteria from Psoralen corylifolia L
- 2-formyl-3,6-bis(hydroxymethyl)phenyl benzoate in Electrochemical Dry Cell
- Electro-photocatalytic degradation of amoxicillin using calcium titanate
- Effect of Malus halliana Koehne Polysaccharides on Functional Constipation
- Structural Properties and Nonlinear Optical Responses of Halogenated Compounds: A DFT Investigation on Molecular Modelling
- DMFDMA catalyzed synthesis of 2-((Dimethylamino)methylene)-3,4-dihydro-9-arylacridin-1(2H)-ones and their derivatives: in-vitro antifungal, antibacterial and antioxidant evaluations
- Production of Methanol as a Fuel Energy from CO2 Present in Polluted Seawater - A Photocatalytic Outlook
- Study of different extraction methods on finger print and fatty acid of raw beef fat using fourier transform infrared and gas chromatography-mass spectrometry
- Determination of trace fluoroquinolones in water solutions and in medicinal preparations by conventional and synchronous fluorescence spectrometry
- Extraction and determination of flavonoids in Carthamus tinctorius
- Therapeutic Application of Zinc and Vanadium Complexes against Diabetes Mellitus a Coronary Disease: A review
- Study of calcined eggshell as potential catalyst for biodiesel formation using used cooking oil
- Manganese oxalates - structure-based Insights
- Topological Indices of H-Naphtalenic Nanosheet
- Long-Term Dissolution of Glass Fibers in Water Described by Dissolving Cylinder Zero-Order Kinetic Model: Mass Loss and Radius Reduction
- Topological study of the para-line graphs of certain pentacene via topological indices
- A brief insight into the prediction of water vapor transmissibility in highly impermeable hybrid nanocomposites based on bromobutyl/epichlorohydrin rubber blends
- Comparative sulfite assay by voltammetry using Pt electrodes, photometry and titrimetry: Application to cider, vinegar and sugar analysis
- MicroRNA delivery mediated by PEGylated polyethylenimine for prostate cancer therapy
- Reversible Fluorescent Turn-on Sensors for Fe3+ based on a Receptor Composed of Tri-oxygen Atoms of Amide Groups in Water
- Sonocatalytic degradation of methyl orange in aqueous solution using Fe-doped TiO2 nanoparticles under mechanical agitation
- Hydrotalcite Anchored Ruthenium Catalyst for CO2 Hydrogenation Reaction
- Production and Analysis of Recycled Ammonium Perrhenate from CMSX-4 superalloys
- Topical Issue on Agriculture
- New phosphorus biofertilizers from renewable raw materials in the aspect of cadmium and lead contents in soil and plants
- Survey of content of cadmium, calcium, chromium, copper, iron, lead, magnesium, manganese, mercury, sodium and zinc in chamomile and green tea leaves by electrothermal or flame atomizer atomic absorption spectrometry
- Biogas digestate – benefits and risks for soil fertility and crop quality – an evaluation of grain maize response
- A numerical analysis of heat transfer in a cross-current heat exchanger with controlled and newly designed air flows
- Freshwater green macroalgae as a biosorbent of Cr(III) ions
- The main influencing factors of soil mechanical characteristics of the gravity erosion environment in the dry-hot valley of Jinsha river
- Free amino acids in Viola tricolor in relation to different habitat conditions
- The influence of filler amount on selected properties of new experimental resin dental composite
- Effect of poultry wastewater irrigation on nitrogen, phosphorus and carbon contents in farmland soil
- Response of spring wheat to NPK and S fertilization. The content and uptake of macronutrients and the value of ionic ratios
- The Effect of Macroalgal Extracts and Near Infrared Radiation on Germination of Soybean Seedlings: Preliminary Research Results
- Content of Zn, Cd and Pb in purple moor-grass in soils heavily contaminated with heavy metals around a zinc and lead ore tailing landfill
- Topical Issue on Research for Natural Bioactive Products
- Synthesis of (±)-3,4-dimethoxybenzyl-4-methyloctanoate as a novel internal standard for capsinoid determination by HPLC-ESI-MS/MS(QTOF)
- Repellent activity of monoterpenoid esters with neurotransmitter amino acids against yellow fever mosquito, Aedes aegypti
- Effect of Flammulina velutipes (golden needle mushroom, eno-kitake) polysaccharides on constipation
- Bioassay-directed fractionation of a blood coagulation factor Xa inhibitor, betulinic acid from Lycopus lucidus
- Antifungal and repellent activities of the essential oils from three aromatic herbs from western Himalaya
- Chemical composition and microbiological evaluation of essential oil from Hyssopus officinalis L. with white and pink flowers
- Bioassay-guided isolation and identification of Aedes aegypti larvicidal and biting deterrent compounds from Veratrum lobelianum
- α-Terpineol, a natural monoterpene: A review of its biological properties
- Utility of essential oils for development of host-based lures for Xyleborus glabratus (Coleoptera: Curculionidae: Scolytinae), vector of laurel wilt
- Phenolic composition and antioxidant potential of different organs of Kazakh Crataegus almaatensis Pojark: A comparison with the European Crataegus oxyacantha L. flowers
- Isolation of eudesmane type sesquiterpene ketone from Prangos heyniae H.Duman & M.F.Watson essential oil and mosquitocidal activity of the essential oils
- Comparative analysis of the polyphenols profiles and the antioxidant and cytotoxicity properties of various blue honeysuckle varieties
- Special Issue on ICCESEN 2017
- Modelling world energy security data from multinomial distribution by generalized linear model under different cumulative link functions
- Pine Cone and Boron Compounds Effect as Reinforcement on Mechanical and Flammability Properties of Polyester Composites
- Artificial Neural Network Modelling for Prediction of SNR Effected by Probe Properties on Ultrasonic Inspection of Austenitic Stainless Steel Weldments
- Calculation and 3D analyses of ERR in the band crack front contained in a rectangular plate made of multilayered material
- Improvement of fuel properties of biodiesel with bioadditive ethyl levulinate
- Properties of AlSi9Cu3 metal matrix micro and nano composites produced via stir casting
- Investigation of Antibacterial Properties of Ag Doped TiO2 Nanofibers Prepared by Electrospinning Process
- Modeling of Total Phenolic contents in Various Tea samples by Experimental Design Methods
- Nickel doping effect on the structural and optical properties of indium sulfide thin films by SILAR
- The effect mechanism of Ginnalin A as a homeopathic agent on various cancer cell lines
- Excitation functions of proton induced reactions of some radioisotopes used in medicine
- Oxide ionic conductivity and microstructures of Pr and Sm co-doped CeO2-based systems
- Rapid Synthesis of Metallic Reinforced in Situ Intermetallic Composites in Ti-Al-Nb System via Resistive Sintering
- Oxidation Behavior of NiCr/YSZ Thermal Barrier Coatings (TBCs)
- Clustering Analysis of Normal Strength Concretes Produced with Different Aggregate Types
- Magnetic Nano-Sized Solid Acid Catalyst Bearing Sulfonic Acid Groups for Biodiesel Synthesis
- The biological activities of Arabis alpina L. subsp. brevifolia (DC.) Cullen against food pathogens
- Humidity properties of Schiff base polymers
- Free Vibration Analysis of Fiber Metal Laminated Straight Beam
- Comparative study of in vitro antioxidant, acetylcholinesterase and butyrylcholinesterase activity of alfalfa (Medicago sativa L.) collected during different growth stages
- Isothermal Oxidation Behavior of Gadolinium Zirconate (Gd2Zr2O7) Thermal Barrier Coatings (TBCs) produced by Electron Beam Physical Vapor Deposition (EB-PVD) technique
- Optimization of Adsorption Parameters for Ultra-Fine Calcite Using a Box-Behnken Experimental Design
- The Microstructural Investigation of Vermiculite-Infiltrated Electron Beam Physical Vapor Deposition Thermal Barrier Coatings
- Modelling Porosity Permeability of Ceramic Tiles using Fuzzy Taguchi Method
- Experimental and theoretical study of a novel naphthoquinone Schiff base
- Physicochemical properties of heat treated sille stone for ceramic industry
- Sand Dune Characterization for Preparing Metallurgical Grade Silicon
- Catalytic Applications of Large Pore Sulfonic Acid-Functionalized SBA-15 Mesoporous Silica for Esterification
- One-photon Absorption Characterizations, Dipole Polarizabilities and Second Hyperpolarizabilities of Chlorophyll a and Crocin
- The Optical and Crystallite Characterization of Bilayer TiO2 Films Coated on Different ITO layers
- Topical Issue on Bond Activation
- Metal-mediated reactions towards the synthesis of a novel deaminolysed bisurea, dicarbamolyamine
- The structure of ortho-(trifluoromethyl)phenol in comparison to its homologues – A combined experimental and theoretical study
- Heterogeneous catalysis with encapsulated haem and other synthetic porphyrins: Harnessing the power of porphyrins for oxidation reactions
- Recent Advances on Mechanistic Studies on C–H Activation Catalyzed by Base Metals
- Reactions of the organoplatinum complex [Pt(cod) (neoSi)Cl] (neoSi = trimethylsilylmethyl) with the non-coordinating anions SbF6– and BPh4–
- Erratum
- Investigation on Two Compounds of O, O’-dithiophosphate Derivatives as Corrosion Inhibitors for Q235 Steel in Hydrochloric Acid Solution