Long-Term Dissolution of Glass Fibers in Water Described by Dissolving Cylinder Zero-Order Kinetic Model: Mass Loss and Radius Reduction
-
Andrey E. Krauklis
 and
Andreas T. Echtermeyer
and
Andreas T. Echtermeyer

Abstract
Glass fibers are degraded when they are exposed to water. In this work, a model is developed that uses zero-order kinetics for predicting a decreasing glass fiber radius. The model is used to describe experimental test results of almost half a year long-term dissolution of R-glass fibers. The model is able to predict both mass loss and radius reduction kinetics using the same four parameters: initial fiber radius (r0), rate constants for both short-term degradation
1 Introduction
Glass fibers are widely used as reinforcement in structural composite materials. They are produced from raw materials, which are virtually unlimited in supply [1]. The fibers have high hardness and such desirable reinforcement properties as high strength and stiffness in fiber direction [1, 2]. It is known that, glass fibers are hydrophilic and are susceptible to a relatively slow degradation when exposed to water environments [3]. Hydrolytic degradation of glass fibers can significantly reduce mechanical strength and leads to corrosion-induced defects [4].
The term degradation is used in the present work to denote all processes which lead to or affect the mass loss of the glass material by interacting with water. This includes the complex nature of several processes occurring in parallel, such as dissolution of glass matrix constituents, gel layer formation, neoformation of solid reaction products, alkaline and alkaline earth ion exchange. Some of these reactions occur while maintaining the glassy state, while others lead to leaching of the reaction products into the water environment [5].
The long-term environmental degradation of glass materials, described by chemical kinetics, has been extensively studied with respect to nuclear waste applications [5, 6]. More recently, there has been an increasing interest in environmental degradation of composite laminates, where R-glass is often used as reinforcement [7, 8, 9, 10]. However, studies on environmental degradation of composites are usually concerned with deterioration of the mechanical properties, and the kinetics of chemical degradation tend to be overlooked [8, 9, 10]. A number of studies exist that explain general mechanisms of environmental degradation of glass materials using various approaches that are based on surface reactions, chemical affinity and diffusion [3, 11, 12, 13, 14]. A process-driven approach was described by Geisler-Wierwille et al., involving the congruent dissolution of the glass coupled to the precipitation and growth of an amorphous silica layer at an inwardly moving reaction interface [12]. More recently, a combination of chemical affinity for controlling the distribution of Si among different alteration phases and the diffusion barrier for the release rate of glass modifiers was implemented by Ma et al. [14]. Dissolution experiments in existing studies are mainly performed with bulk silicate glasses, and fibers are not studied often.
Open Access. © 2018 Andrey E. Krauklis, Andreas T. Echtermeyer, published by De Gruyter. This work is licensed under the Creative Commons Attribution-NonCommercial-NoDerivatives 4.0 License.
Few studies exist on the kinetics of glass fiber dissolution. Mišíková et al. have studied the E-glass fiber leaching kinetics in distilled water at different temperatures [15]. Bashir et al. studied the kinetics of the dissolution of E-glass fibres in alkaline solutions by immersing single fibers and measuring the diameter change [16]. They concluded that the rate limiting step was either the diffusion of hydroxide ions through the solution or the glass fibre etching itself [16]. Krauklis and Echtermeyer presented a model that predicts Si loss kinetics during long-term hygrothermal aging of fiber-reinforced composites [17]. Glass fibers formulated with significant amounts of various metal oxides, such as R-glass (often used in composites), are rarely studied [16]. Thus, this work is concerned with the dissolution kinetics of R-glass fibers in water.
The degradation is divided into two distinct kinetic regions: (1) short-term non-steady-state and (2) long-term steady-state degradation. In the short-term region, the degradation is complex and involves such processes as ion exchange, gel formation and dissolution [5]. When the long-term steady-state is reached, the dissolution becomes dominant [5, 18] and the degradation follows zero-order reaction kinetics. Such kinetics depend on the glass surface area in contact with water, which is proportional to the fiber radius. As the dissolution continues, the radius decreases resulting in the mass loss deceleration.
The aim of this work is twofold: (1) to study the long-term dissolution behaviour of R-glass fibers in water and (2) to develop a model that describes the mass loss and fiber radius reduction kinetics during dissolution.
2 Theory – dissolution kinetic models
Different models are used for describing dissolution kinetics of various materials such as zero-order, first-order, advection/dispersion/reaction, GRAAL (Glass Reactivity with Allowance for the Alteration Levels), Noyes-Whitney, Hixson-Crowell, Hopfenberg and Korsmeyer-Peppas models, as well as similar in concept shrinking or contracting cylinder models [5, 16, 18, 19, 20]. Much of the confusion related to the modelling of degradation of glass fibers is due to the fact that dissolution is not the only process involved in degradation. The discrepancies between models are, however, mostly dominant in the short-term [5]. The whole degradation versus time curve is not linear as long as the complex processes take place. The model reported in this work is similar in concept to an existing solid-state model called the contracting cylinder [20] or shrinking cylinder [16], which relates the evolution of conversion to time. However, the novel model presented in this work differentiates between the complex short-term and dissolution-dominated long-term processes. Furthermore, the novel model describes both dissolution and radius reduction kinetics without the necessity for introducing additional terms such as a conversion factor. Rate constants are often given in relation to the surface area of a material, thus describing dissolution behaviour from a unit of the material’s surface area [14]. Surface area-based constants are used throughout this work.
3 Experimental
3.1 Materials
Boron-free and fluorine-free HiPer-tex W2020 glass fiber (GF) bundles were used. These are classified as high strength, high modulus R-glass (defined by an international standard [21]). The density is 2.54 g/cm3; the mean filament diameter is 17 ± 2 μm [22].
Deionized water (0.5-1.0 MΩ·cm) was used for conditioning of the glass fibers. It was produced by using the water purification system Aquatron A4000 (Cole-Parmer, USA). The pH of the deionized water was determined to be 5.65, which is lower than neutral due to dissolved CO2 (in equilibrium).
3.2 Determination of number of fibers in the sample
The amount of fibers is denoted as n. The length of fibers is l = 0.1 m; the initial mass of a fiber bundle is m0=5.8 g; the mean initial radius is r0=8.5∙ 10-6 m. The amount of fibers was calculated using Equation 1:
The amount of fibers in the sample n was determined to be 100602.
3.3 Determination of surface area of the sample
Since a surface reaction is of interest, it is important to identify the specific surface area of the glass material. The external surface area of glass fibers was evaluated from geometrical considerations as a product of number, circumference and length of fibers. The specific surface area of a studied sample can be calculated using Equation 2:
Specific surface area
3.4 Dissolution experiments
Dissolution in water experiments of glass fibers were conducted using a batch system. Basically, infinite water availablity conditions were ensured by using fresh deionized water for each separate measurement. The ion release with time (dissolution) was obtained as the cumulative result of the individual ion release measurements.
The dissolution of ions was accelerated by conditioning the fibers at an elevated temperature of 60 °C, since the dissolution reaction is an exothermic reaction [5, 6, 18]. The temperature of 60°C is often used for conditioning fiber-reinforced composites, and this fact provided an additional justification for choosing this particular temperature. The water´s temperature was controlled via PID-controlled heating, giving an accuracy of ± 1°C. Two-stage heating system was used in order to ensure that there is no contact of the sample water with other potential ion release sources, such as the heating element itself.
Samples were weighed using analytical scales AG204 (± 0.1 mg; Mettler Toledo, USA) before the experiments. Experiments were performed with 3 parallels.
The concentration of the dissolved ions in the water bach was measured by high resolution inductively coupled plasma mass spectrometry (HR-ICP-MS). Analyses were performed using a double focusing magnetic sector field ICP-MS Finnigan ELEMENT 2 (Thermo-Scientific), equipped with a sample introduction system PrepFAST (ESI/Elemental Scientific) and a pretreatment/digestion UltraClave (Milestone). Acidification of samples was performed using ultra-pure grade HNO3 SubPur (Milestone) to avoid adsorption of ions to the wall of the sample vials.
The benefit of HR-ICP-MS versus gravimetric analysis is that the model can be applied to obtain the rate constant (K0) of each ion separately, as well as for the total mass loss
where
3.5 Radius reduction measurements
R-glass fibers were immersed in deionized water for prolonged periods of time, carefully dried with a paper tissue, and the fiber diameter was measured using a digital microscope RH-2000 (Hirox, Japan). The radii of around five fibers were measured at each time, and for each fiber, measurements of radii were made at three different locations, similarly as was done in another work [16].
Ethical approval: The conducted research is not related to either human or animal use.
4 Results and Discussion
4.1 Elements released and respective chemical reactions
The HR-ICP-MS method identified the following elements as being released during glass fiber degradation in deionized water: Na, K, Ca, Mg, Fe, Al, Si, Cl. Release of B and Zn was found to be insignificant at less than 0.8 ppm, if the elements were present at all.
Chemical reactions involved in the degradation of the studied glass fibers for the identified released elements are shown in Chemical reactions (a)-(l) [5, 18, 23]:
Combining chemical reactions (h) and (i), a summary reaction can be written as Chemical reaction (j):
4.2 Zero-order kinetic model of a dissolving cylinder
A schematic representation of a fiber bundle and important dimensions for the model are shown in Figure 1. The number of fibers is n (-); the initial radius of the fibers is r0 (m); the length of fibers is l (m).
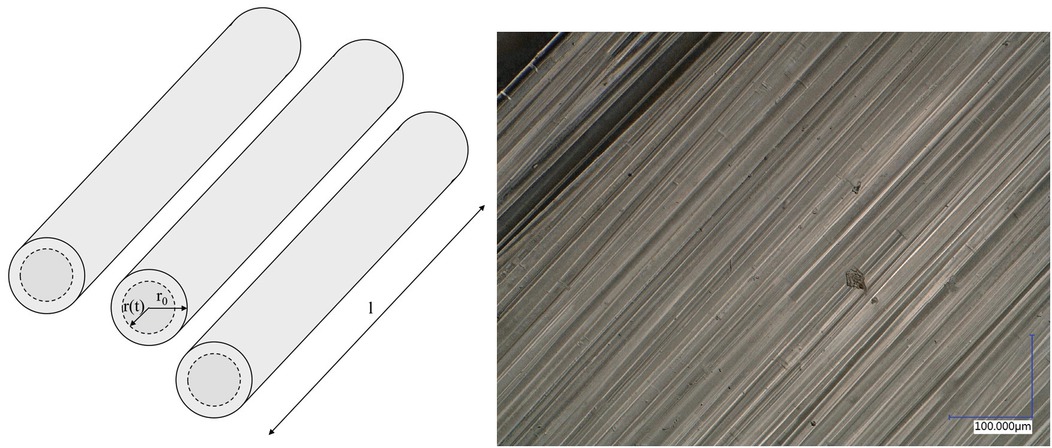
Left: Schematic representation of a fiber bundle and geometrical dimensions. Right: micrograph of a fiber bundle.
The model involves the following assumptions. As a simplification, this model is deterministic and all fibers are assumed to have the same initial radius, which is r0; and the cross-sectional surface area at the end of the fibres is assumed to be negligible in calculations of the surface area. The length of the long fibers l is assumed to be constant during the whole dissolution process. During the whole degradation process, the density of the glass material stays constant
Dissolution is a surface reaction. In a general case, the rate of the dissolution is dependent on the constant describing the rate of the reaction (K0), the glass surface area exposed to water (S), the availability of water
In case of infinite availability of water, the rate of reaction becomes independent of the reactant (water) concentration, and the reaction order nreaction becomes 0. In infinite water availability conditions, the surface reaction can be well-described with zero-order kinetics [16, 24], which can then be represented by a differential Equation 5:
where m(g) is a total cumulative mass dissolved after time t (s), K0 (g/m2∙s) is a zero-order reaction kinetic constant and S (m2) is the glass surface area in contact with water.
As the reaction proceeds, the radius of the fibers is reduced and the total surface area (S) is decreased, thus leading to a decrease in the rate of mass loss as seen in Equation 5. The overall ion release rate decreases proportionally to the decrease in total surface area or a decrease in fiber radius.
It can be seen that
The volume of a single fiber is πr2 l, where l is the cylinder length and r is the cylinder radius. For n fibers, the volume is πr2 l and mass is
Substituting then r2 with the following z = r2,
where
Both sides are then integrated with respect to t,
Integrating and solving for
where c’ and c’’ are arbitrary constants after integration. Substituting r2 back into the equation:
It can be seen that the radius reduction is linear with time, where the proportionality is given by the zero-order kinetic constant K0 (g/m2∙s) and the density of the glass (g/m3). A linear radius reduction of fibers with time was previously experimentally observed in another work [16]. Since the radius reduction depends on the initial radius r0 of the fibers (m), the arbitrary constant c’’ (m) is equal to the initial radius.
The kinetic model equation for fiber radius reduction then becomes as shown in Equation 16:
Returning to the mass loss kinetics (Equation 5),
Substituting r for the radius reduction kinetic Equation 28, the final mass loss kinetic model equation in differential form is obtained (Equation 17):
Integrating the obtained Equation 17 over time t, the integral model equation is obtained, describing the cumulative mass loss (ion release):
Definite integral solution is then the following (Equation 19):
The final mass loss model kinetic equation in the integral form is then the following (Equation 20):
The solution of Equation 20 is then checked using an alternative approach. Based on the mass conservation principle, mass loss in integral form can be also written as Equation 21:
Combining Equations 16 and 21,
The obtained Equation 22 is the same mass loss kinetic equation in the integral form as Equation 20. The use of two alternative mathematical ways to obtain Equations 20 and 22 by the integration and by the mass conservation principle, respectively, has proven the mathematical consistency of the model. The fact that the model is adequate and physical was demonstrated by its ability to explain the experimentally observed dissolution phenomena as described later.
4.3 The model extended to short-term and long-term degradation
The reaction kinetics described above apply for a dissolution-dominated process. As shown in the Chemical reactions (a)-(l), various competing reactions happen simultaneously. Initially these reactions happen at independent rates, later one process becomes limiting and dominates the behaviour. Therefore, the degradation process should be divided into a short-term non-steady-state process and a long-term steady-state process since the subprocesses involved follow individual kinetics and are likely interdependent contributing to the complexity of the short-term region. In the non-steady-state region the process is rather complex, involving in addition to dissolution also other competing leaching mechanisms such as ion exchange and gel formation, and thus cannot be properly described with only one kinetic equation [5, 18]. The complexity and varying rates of the competing processes in the short-term make this stage of the degradation to be non-linear non-steady-state. In the long-term hygrothermal degradation of glass fibers, however, dissolution kinetics become dominant [5, 18] and the process becomes then steady-state following the
zero-order kinetics. In the long-term degradation, kinetic equations described above become physical.
When long-term degradation is of most interest, such as in this work, the shape of the non-linear short-term part is not important, an approximate solution can then be used to describe also the short-term non-steady-state stage with dissolving cylinder zero-order kinetic model. In case when short-term degradation is of most importance, kinetic models for each individual subprocesses (dissolution, ion exchange, gel formation) taking place in the short-term non-steady-state should be studied and implemented, and their influence on each other should be understood.
The fiber radius decreases at a constant rate (linearly) in time. However, the induction period before the linear regime is often observed [16], which can be explained with the complexity of the short-term non-steady-state process and, to the best knowledge of the authors, was not explained before.
The whole process can be divided into two regions as shown in Figure 2 and can be described via four parameters:
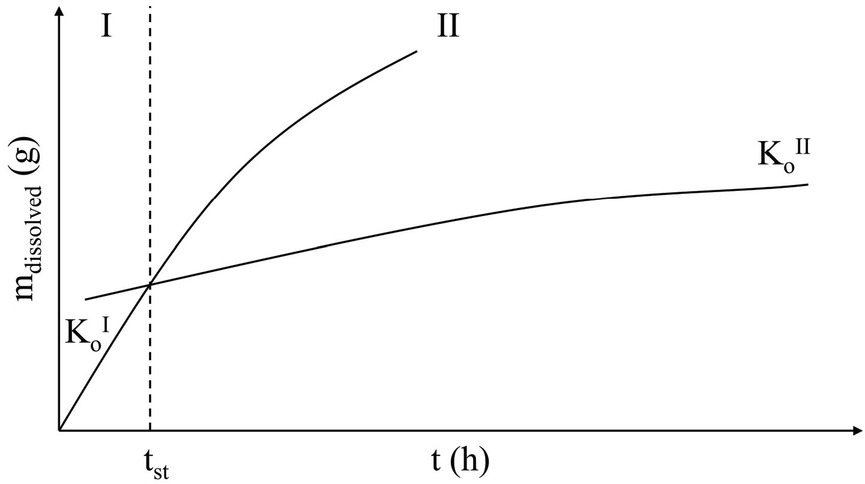
Separation of mass loss or cumulative ion release curves into (I) short-term non-steady-state and (II) long-term steady-state regions.
The final model equations combining approximated non-steady-state short-term and physically-correct steady-state long-term dissolution kinetics are proposed.
The radius reduction kinetic model based on Equation 16 is shown in Equation 23:
The mass loss kinetic model based on Equation 20 is shown in Equation 24:
where
4.4 Dissolution of R-glass fibers explained with the model
Experimentally m dissolved was measured as a sum of all ions’ release quantified with HR-ICP-MS cumulatively over time. Alternatively, a gravimetric analysis over time can be used to obtain m dissolved. Both kinetic parameters
Ions released from the studied glass material are the following: Na, K, Ca, Mg, Fe, Al, Si, Cl. The total mass of all ions released is the cumulative mass loss, as shown by Equation 25:
The total mass loss is described by four parameters
From the cumulative data of ions released altogether (mdissolved), the kinetic model parameters
Model parameters and fit to experimental data (total mass loss mdissolved).
| tst (h) | R2 | R2 | ||
|---|---|---|---|---|
| (t ≤ tst) | (t > tst) | |||
| 3.00∙10-9 | 6.68∙10-10 | 166 | 0.8069 | 0.9653 |
Using the obtained tst, these parameters are included in the model for each individual ion release (Na, K, Ca, Mg, Fe, Al, Si, Cl).
Model parameters for individual released ions and fit to experimental data.
| R2 | R2 | |||
|---|---|---|---|---|
| (t ≤ t st) | (t > t st) | |||
| Na | 6.80∙10-11 | 1.80∙10-11 | 0.5326 | 0.9578 |
| K | 4.85∙10-11 | 9.80∙10-12 | 0.5583 | 0.9211 |
| Ca | 8.72∙10-10 | 9.70∙10-11 | 0.7256 | 0.9310 |
| Mg | 4.85∙10-10 | 1.02∙10-10 | 0.7164 | 0.9898 |
| Fe | 2.20∙10-12 | 4.40∙10-13 | 0.9261 | 0.8963 |
| Al | 1.45∙10-10 | 4.68∙10-11 | 0.7596 | 0.9272 |
| Si | 1.10∙10-9 | 3.80∙10-10 | 0.9177 | 0.9781 |
| Cl | 7.80∙10-11 | 2.28∙10-11 | 0.6605 | 0.9572 |
Experimental data and modelled curves for individual ion release and total mass loss are shown in Figure 3. Experimentally mass loss was obtained from HR-ICP-MS measurements for separate ions being released.
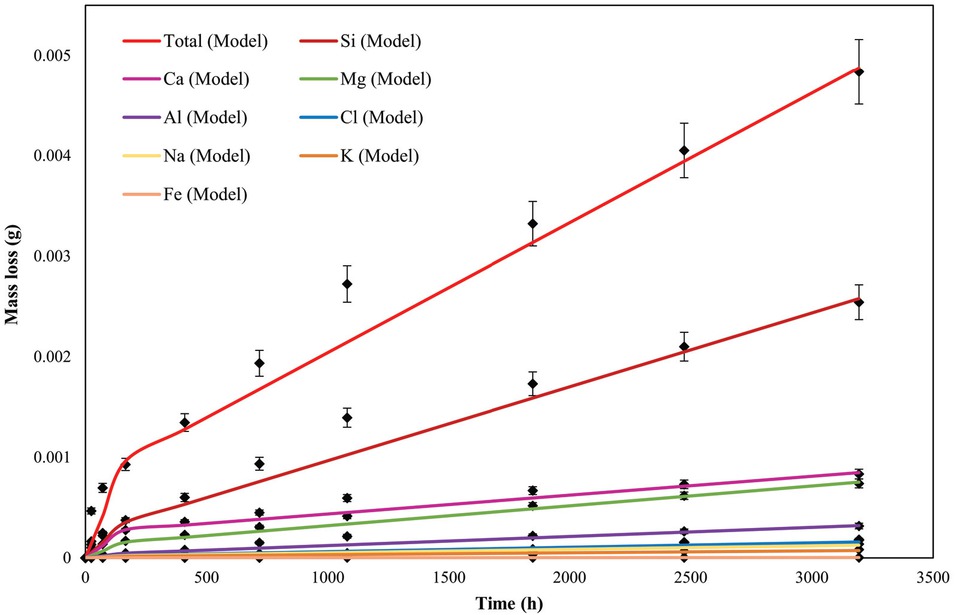
Experimental data and predicted ion release and total mass loss kinetics.
Rates of ion release during steady-state for the studied material are compared in Figure 4.
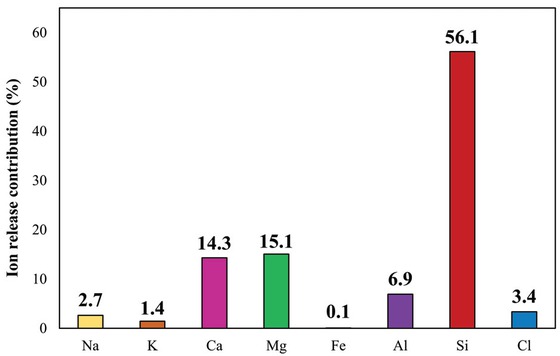
Comparison of ion release rates in the steady-state (values have been calculated from the rate constants in the steady-state).
The contribution from Si to the total mass loss is the largest (56.1% by mass) and seems to govern the dissolution process. Ca and Mg are released at approximately similar rates to each other and contribute 14.3 and 15.1% to the total mass loss, respectively, while all other elements contribute less than 7% individually. Once the steady-state is reached, it can be assumed that the reactions do not have any effect on each other and proceed at constant independent rates. It can be speculated that in the steady-state some equilibrium composition of glass (different from the bulk composition) is obtained in the outer layers that are contact with water, allowing elements to dissolve at some limiting rate and proportionally to their content in the outer layers of the glass.
Radius reduction in R-glass fibers after treatment in water at various times at 60°C predicted with the model is shown in Figure 5. The fiber radius decrease could not be captured with a digital microscope. Digital micrographs of fibers, untreated and treated in water are shown in Figure 6.
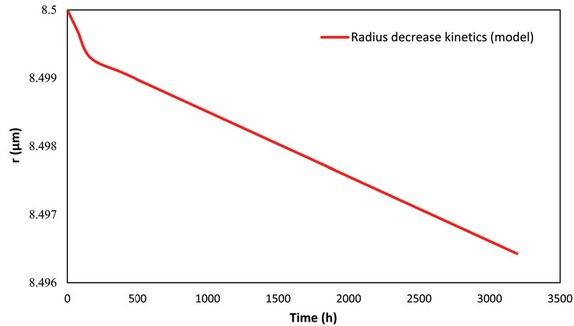
Modelled radius reduction in R-glass fibers after treatment in water at various times at 60°C.
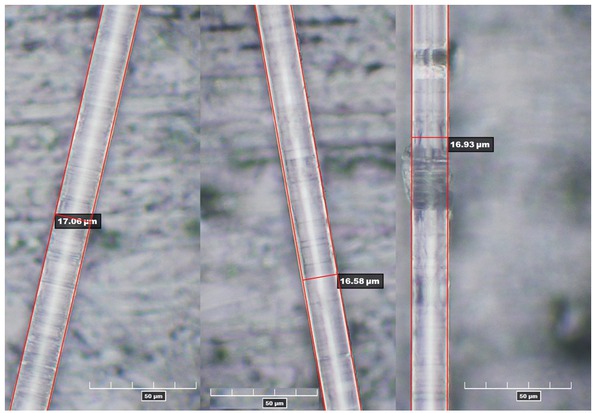
Digital microscope images of R-glass fibers from left to right: untreated; after 69 h in water at 60°C; after 3194 h in water at 60°C.
The lack of accuracy is reasonable, taking into account that the radius reduction predicted by the model in 3194 h time is only 0.0036 μm (0.04% radius loss) as seen in Figure 5, and the microscope resolution is 0.16 μm. Furthermore, a statistical error has to be considered since the radius is not perfectly equal in different locations of the fibers (as seen by discrepancy in measurements reported in Figure 6).
With the reaction rates obtained in this work, the full dissolution of the studied R-glass fibers would take 8.98∙106 h or 1025.1 years as reported in Table 3. The radius loss after 25 years, a typical design lifetime, would be 2.45%. These values are for 60°C. For lower temperatures, the radius reduction would be even less [5, 6, 18]. The effect of temperature on dissolution kinetics and the effect of cracks in the fibers of this particular glass material will be studied in the future.
Predicted dissolution times for various mass and radius loss values at 60°C.
| Time in water | Mass loss (%) | Radius loss (%) |
|---|---|---|
| (years) | ||
| 0.5 | 0.10 | 0.05 |
| 2.5 | 0.50 | 0.25 |
| 5.1 | 1.00 | 0.50 |
| 25.9 | 5.00 | 2.53 |
| 52.5 | 10.00 | 5.13 |
| 300.2 | 50.00 | 29.30 |
| 512.6 | 75.00 | 50.02 |
| 1025.1 | 100.00 | 100.00 |
5 Conclusions
In this study, the long-term (3194 h) dissolution of R-glass fibers in water was studied experimentally. A dissolving cylinder zero-order kinetic model was developed and successfully used to describe the kinetics of mass loss and the fiber’s radius reduction during dissolution in water.
Elements released during degradation were determined to be Na, K, Ca, Mg, Fe, Al, Si and Cl. The total material loss and release of each separate ion was modelled using the developed kinetic equations, and rate constants were obtained and reported. The contribution of Si to the total mass loss was the largest (56.1% by mass) and governed the dissolution process.
The model differentiates between the complex short-term and dissolution-dominated long-term processes. Furthermore, the novelty of the model is the ability to describe both dissolution and radius reduction kinetics without the necessity for introducing additional terms such as a conversion factor. The model is able to predict both mass loss and radius reduction kinetics using the same four parameters, which can be determined experimentally. The methodology provided in this work offers the guidelines to obtain the required parameters to use the model in practice. The developed model is useful for both monitoring the radius of degrading fibers and for monitoring the time evolution of the loss of material.
The radius reduction was found to be linear with time during dissolution when a steady-state is reached. The zero-order kinetic constant and the density of the glass describe the rate (proportionality) of the dissolution. Radius reduction predicted by the model in 3194 h time was only 0.0036 μm (0.04% radius loss) at 60°C and could not be captured with a microscope. The full dissolution of the studied R-glass fibers would take 8.98∙106 h or 1025.1 years. The radius loss after 25 years, a typical design lifetime, would be 2.45%.
Acknowledgments
This work is part of the DNV GL led Joint Industry Project “Affordable Composites” with twelve industrial partners and the Norwegian University of Science and Technology (NTNU). The authors would like to express their thanks for the financial support by The Research Council of Norway (Project 245606/E30 in the Petromaks 2 programme). The authors are thankful to Abedin I. Gagani, Syverin Lierhagen and Melanie Shebel. The first author is especially grateful to Oksana V. Golubova.
Conflict of interest Authors declare no conflict of interest.
References
[1] Wallenberger F.T., Commercial and Experimental Glass Fibers, in: Fiberglass and Glass Technology, Eds: Wallenberger F.T., Bingham P.A., Springer, US, 2010.10.1007/978-1-4419-0736-3Search in Google Scholar
[2] Steinmann W., Saelhoff A.-K., Essential Properties of Fibres for Composite Applications, in: Fibrous and Textile Materials for Composite Applications, Textile Science and Clothing Technology, Eds.: Rana S., Fangueiro R., Springer, Singapore, 2016.Search in Google Scholar
[3] Tournié A., Ricciardi P., Colomban P., Glass Corrosion Mechanisms: A Multiscale Analysis, Solid State Ionics, 2008, 179(38), 2142-2154.10.1016/j.ssi.2008.07.019Search in Google Scholar
[4] Brown E.N., Davis A.K., Jonnalagadda K.D., Sottos N.R., Effect of surface treatment on the hydrolytic stability of E-glass fiber bundle tensile strength, Compos. Sci. Technol., 2005, 65, 129–136.10.1016/j.compscitech.2004.07.001Search in Google Scholar
[5] Grambow B., Müller R., First-order dissolution rate law and the role of surface layers in glass performance assessment, J. Nucl. Mater., 2001, 298(1-2), 112-124.10.1016/S0022-3115(01)00619-5Search in Google Scholar
[6] Grambow B., A General Rate Equation for Nuclear Waste Glass Corrosion, Mat. Res. Soc. Symp. Proc., 1985, 44, 15-27.10.1557/PROC-44-15Search in Google Scholar
[7] Krauklis A.E., Gagani A.I., Echtermeyer A.T., Near-Infrared Spectroscopic Method for Monitoring Water Content in Epoxy Resins and Fiber-Reinforced Composites, Materials, 2018, 11(4), 586-599.10.3390/ma11040586Search in Google Scholar
[8] Stamenović M.R., Putić S.S., Rakin M.B., Medjo B., Čikara D., Effect of alkaline and acidic solutions on the tensile properties of glass–polyester pipes, Mater. Des., 2011, 32(4), 2456-2461.10.1016/j.matdes.2010.11.023Search in Google Scholar
[9] Krauklis A.E., Echtermeyer A.T., Mechanism of Yellowing: Carbonyl Formation during Hygrothermal Aging in a Common Amine Epoxy, Polymers, 2018, 10(9), 1017-1031.10.3390/polym10091017Search in Google Scholar
[10] Amaro A.M., Reis P.N.B., Neto M.A., Louro C., Effects of alkaline and acid solutions on glass/epoxy composites, Polym. Degrad. Stab., 2013, 98(4), 853-862.10.1016/j.polymdegradstab.2012.12.029Search in Google Scholar
[11] Delage F., Ghaleb D., Dussossoy J.L., Chevallier O., Vernaz E., A mechanistic model for understanding nuclear waste glass dissolution, J. Nucl. Mater., 1992, 190, 191-197.10.1016/0022-3115(92)90086-ZSearch in Google Scholar
[12] Geisler-Wierwille T., Nagel T.J., Kilburn M.R., Janssen A., Icenhower J., Fonseca R.O.C., Grange M.L., Nemchin A.A., The Mechanism of Borosilicate Glass Corrosion Revisited, Geochim. Cosmochim. Acta, 2015, 158, 112-129.10.1016/j.gca.2015.02.039Search in Google Scholar
[13] Icenhower J., Steefel C.I., Dissolution Rate of Borosilicate Glass SON68: A Method of Quantification Based upon Interferometry and Implications for Experimental and Natural Weathering Rates of Glass, Geochim. Cosmochim. Acta, 2015, 157, 147-163.10.1016/j.gca.2015.02.037Search in Google Scholar
[14] Ma T., Jivkov A.P., Li W., Liang W., Wang Y., Xu H., Han X., A mechanistic model for long-term nuclear waste glass dissolution integrating chemical affinity and interfacial diffusion barrier, J. Nucl. Mater., 2017, 486, 70-85.10.1016/j.jnucmat.2017.01.001Search in Google Scholar
[15] Mišíková L., Liška M., Galusková D., CORROSION OF E-GLASS FIBERS IN DISTILLED WATER, Ceram. Silikaty, 2007, 51(3), 131-135.Search in Google Scholar
[16] Bashir S.T., Yang L., Liggat J.J., Thomason J.L., Kinetics of dissolution of glass fibre in hot alkaline solution, J. Mater. Sci., 2018, 53(3), 1710-1722.10.1007/s10853-017-1627-zSearch in Google Scholar
[17] Krauklis A.E., Echtermeyer A.T., Dissolving Cylinder Zero-Order Kinetic Model for Predicting Hygrothermal Aging of Glass Fiber Bundles and Fiber-Reinforced Composites, International Glass Fiber Symposium, 2018.Search in Google Scholar
[18] Report RWM005105, AMEC/103498/02 Issue 2: Review of glass dissolution models and application to UK glasses, Didcot, 2015.Search in Google Scholar
[19] Costa P., Sousa Lobo J.M., Review: Modeling and comparison of dissolution profiles, Eur. J. Pharm. Sci., 2001, 13, 123-133.10.1016/S0928-0987(01)00095-1Search in Google Scholar
[20] Khawam A., Flanagan D.R., Solid-State Kinetic Models: Basics and Mathematical Fundamentals, J. Phys. Chem. B, 2006, 110, 17315-17328.10.1021/jp062746aSearch in Google Scholar PubMed
[21] International Standard ISO 2078:1993 (revised in 2014), Textile glass – Yarns – Designation, 2014.Search in Google Scholar
[22] 3B Fibreglass technical data sheet. HiPer-tex W2020 rovings, Belgium, 2012.Search in Google Scholar
[23] Li H., Gu P., Watson J., Meng J., Acid corrosion resistance and mechanism of E-glass fibers: boron factor, J. Mater. Sci., 2013, 48(8), 3075-3087.10.1007/s10853-012-7082-ySearch in Google Scholar
[24] Čornaja S., Fizikālā ķīmija. Elektroķīmija. Kinētika, RTU Izdevniecība, Rīga, 2008, (in Latvian).Search in Google Scholar
[25] Eastes W., Potter R.M., Hadley J.G., Estimating in-vitro glass fiber dissolution rate from composition, Inhal. Toxicol., 2000, 12, 269-280.10.1080/089583700196149Search in Google Scholar PubMed
© 2018 Andrey E. Krauklis, Andreas T. Echtermeyer, published by De Gruyter
This work is licensed under the Creative Commons Attribution-NonCommercial-NoDerivatives 4.0 License.
Articles in the same Issue
- Regular Articles
- The effect of CuO modification for a TiO2 nanotube confined CeO2 catalyst on the catalytic combustion of butane
- The preparation and antibacterial activity of cellulose/ZnO composite: a review
- Linde Type A and nano magnetite/NaA zeolites: cytotoxicity and doxorubicin loading efficiency
- Performance and thermal decomposition analysis of foaming agent NPL-10 for use in heavy oil recovery by steam injection
- Spectroscopic (FT-IR, FT-Raman, UV, 1H and 13C NMR) insights, electronic profiling and DFT computations on ({(E)-[3-(1H-imidazol-1-yl)-1-phenylpropylidene] amino}oxy)(4-nitrophenyl)methanone, an imidazole-bearing anti-Candida agent
- A Simplistic Preliminary Assessment of Ginstling-Brounstein Model for Solid Spherical Particles in the Context of a Diffusion-Controlled Synthesis
- M-Polynomials And Topological Indices Of Zigzag And Rhombic Benzenoid Systems
- Photochemical Transformation of some 3-benzyloxy-2-(benzo[b]thiophen-2-yl)-4Hchromen-4-ones: A Remote Substituent Effect
- Dynamic Changes of Secondary Metabolites and Antioxidant Activity of Ligustrum lucidum During Fruit Growth
- Studies on the flammability of polypropylene/ammonium polyphosphate and montmorillonite by using the cone calorimeter test
- DSC, FT-IR, NIR, NIR-PCA and NIR-ANOVA for determination of chemical stability of diuretic drugs: impact of excipients
- Antioxidant and Hepatoprotective Effects of Methanolic Extracts of Zilla spinosa and Hammada elegans Against Carbon Tetrachlorideinduced Hepatotoxicity in Rats
- Prunus cerasifera Ehrh. fabricated ZnO nano falcates and its photocatalytic and dose dependent in vitro bio-activity
- Organic biocides hosted in layered double hydroxides: enhancing antimicrobial activity
- Experimental study on the regulation of the cholinergic pathway in renal macrophages by microRNA-132 to alleviate inflammatory response
- Synthesis, characterization, in-vitro antimicrobial properties, molecular docking and DFT studies of 3-{(E)-[(4,6-dimethylpyrimidin-2-yl)imino]methyl} naphthalen-2-ol and Heteroleptic Mn(II), Co(II), Ni(II) and Zn(II) complexes
- M-Polynomials and Topological Indices of Dominating David Derived Networks
- Human Health Risk Assessment of Trace Metals in Surface Water Due to Leachate from the Municipal Dumpsite by Pollution Index: A Case Study from Ndawuse River, Abuja, Nigeria
- Analysis of Bowel Diseases from Blood Serum by Autofluorescence and Atomic Force Microscopy Techniques
- Hydrographic parameters and distribution of dissolved Cu, Ni, Zn and nutrients near Jeddah desalination plant
- Relationships between diatoms and environmental variables in industrial water biotopes of Trzuskawica S.A. (Poland)
- Optimum Conversion of Major Ginsenoside Rb1 to Minor Ginsenoside Rg3(S) by Pulsed Electric Field-Assisted Acid Hydrolysis Treatment
- Antioxidant, Anti-microbial Properties and Chemical Composition of Cumin Essential Oils Extracted by Three Methods
- Regulatory mechanism of ulinastatin on autophagy of macrophages and renal tubular epithelial cells
- Investigation of the sustained-release mechanism of hydroxypropyl methyl cellulose skeleton type Acipimox tablets
- Bio-accumulation of Polycyclic Aromatic Hydrocarbons in the Grey Mangrove (Avicennia marina) along Arabian Gulf, Saudi Coast
- Dynamic Change of Secondary Metabolites and spectrum-effect relationship of Malus halliana Koehne flowers during blooming
- Lipids constituents from Gardenia aqualla Stapf & Hutch
- Effect of using microwaves for catalysts preparation on the catalytic acetalization of glycerol with furfural to obtain fuel additives
- Effect of Humic Acid on the Degradation of Methylene Blue by Peroxymonosulfate
- Serum containing drugs of Gua Lou Xie Bai decoction (GLXB-D) can inhibit TGF-β1-Induced Epithelial to Mesenchymal Transition (EMT) in A549 Cells
- Antiulcer Activity of Different Extracts of Anvillea garcinii and Isolation of Two New Secondary Metabolites
- Analysis of Metabolites in Cabernet Sauvignon and Shiraz Dry Red Wines from Shanxi by 1H NMR Spectroscopy Combined with Pattern Recognition Analysis
- Can water temperature impact litter decomposition under pollution of copper and zinc mixture
- Released from ZrO2/SiO2 coating resveratrol inhibits senescence and oxidative stress of human adipose-derived stem cells (ASC)
- Validated thin-layer chromatographic method for alternative and simultaneous determination of two anti-gout agents in their fixed dose combinations
- Fast removal of pollutants from vehicle emissions during cold-start stage
- Review Article
- Catalytic activities of heterogeneous catalysts obtained by copolymerization of metal-containing 2-(acetoacetoxy)ethyl methacrylate
- Antibiotic Residue in the Aquatic Environment: Status in Africa
- Regular Articles
- Mercury fractionation in gypsum using temperature desorption and mass spectrometric detection
- Phytosynthetic Ag doped ZnO nanoparticles: Semiconducting green remediators
- Epithelial–Mesenchymal Transition Induced by SMAD4 Activation in Invasive Growth Hormone-Secreting Adenomas
- Physicochemical properties of stabilized sewage sludge admixtures by modified steel slag
- In Vitro Cytotoxic and Antiproliferative Activity of Cydonia oblonga flower petals, leaf and fruit pellet ethanolic extracts. Docking simulation of the active flavonoids on anti-apoptotic protein Bcl-2
- Synthesis and Characterization of Pd exchanged MMT Clay for Mizoroki-Heck Reaction
- A new selective, and sensitive method for the determination of lixivaptan, a vasopressin 2 (V2)-receptor antagonist, in mouse plasma and its application in a pharmacokinetic study
- Anti-EGFL7 antibodies inhibit rat prolactinoma MMQ cells proliferation and PRL secretion
- Density functional theory calculations, vibration spectral analysis and molecular docking of the antimicrobial agent 6-(1,3-benzodioxol-5-ylmethyl)-5-ethyl-2-{[2-(morpholin-4-yl)ethyl] sulfanyl}pyrimidin-4(3H)-one
- Effect of Nano Zeolite on the Transformation of Cadmium Speciation and Its Uptake by Tobacco in Cadmium-contaminated Soil
- Effects and Mechanisms of Jinniu Capsule on Methamphetamine-Induced Conditioned Place Preference in Rats
- Calculating the Degree-based Topological Indices of Dendrimers
- Efficient optimization and mineralization of UV absorbers: A comparative investigation with Fenton and UV/H2O2
- Metabolites of Tryptophane and Phenylalanine as Markers of Small Bowel Ischemia-Reperfusion Injury
- Adsorption and determination of polycyclic aromatic hydrocarbons in water through the aggregation of graphene oxide
- The role of NR2C2 in the prolactinomas
- Chromium removal from industrial wastewater using Phyllostachys pubescens biomass loaded Cu-S nanospheres
- Hydrotalcite Anchored Ruthenium Catalyst for CO2 Hydrogenation Reaction
- Preparation of Calcium Fluoride using Phosphogypsum by Orthogonal Experiment
- The mechanism of antibacterial activity of corylifolinin against three clinical bacteria from Psoralen corylifolia L
- 2-formyl-3,6-bis(hydroxymethyl)phenyl benzoate in Electrochemical Dry Cell
- Electro-photocatalytic degradation of amoxicillin using calcium titanate
- Effect of Malus halliana Koehne Polysaccharides on Functional Constipation
- Structural Properties and Nonlinear Optical Responses of Halogenated Compounds: A DFT Investigation on Molecular Modelling
- DMFDMA catalyzed synthesis of 2-((Dimethylamino)methylene)-3,4-dihydro-9-arylacridin-1(2H)-ones and their derivatives: in-vitro antifungal, antibacterial and antioxidant evaluations
- Production of Methanol as a Fuel Energy from CO2 Present in Polluted Seawater - A Photocatalytic Outlook
- Study of different extraction methods on finger print and fatty acid of raw beef fat using fourier transform infrared and gas chromatography-mass spectrometry
- Determination of trace fluoroquinolones in water solutions and in medicinal preparations by conventional and synchronous fluorescence spectrometry
- Extraction and determination of flavonoids in Carthamus tinctorius
- Therapeutic Application of Zinc and Vanadium Complexes against Diabetes Mellitus a Coronary Disease: A review
- Study of calcined eggshell as potential catalyst for biodiesel formation using used cooking oil
- Manganese oxalates - structure-based Insights
- Topological Indices of H-Naphtalenic Nanosheet
- Long-Term Dissolution of Glass Fibers in Water Described by Dissolving Cylinder Zero-Order Kinetic Model: Mass Loss and Radius Reduction
- Topological study of the para-line graphs of certain pentacene via topological indices
- A brief insight into the prediction of water vapor transmissibility in highly impermeable hybrid nanocomposites based on bromobutyl/epichlorohydrin rubber blends
- Comparative sulfite assay by voltammetry using Pt electrodes, photometry and titrimetry: Application to cider, vinegar and sugar analysis
- MicroRNA delivery mediated by PEGylated polyethylenimine for prostate cancer therapy
- Reversible Fluorescent Turn-on Sensors for Fe3+ based on a Receptor Composed of Tri-oxygen Atoms of Amide Groups in Water
- Sonocatalytic degradation of methyl orange in aqueous solution using Fe-doped TiO2 nanoparticles under mechanical agitation
- Hydrotalcite Anchored Ruthenium Catalyst for CO2 Hydrogenation Reaction
- Production and Analysis of Recycled Ammonium Perrhenate from CMSX-4 superalloys
- Topical Issue on Agriculture
- New phosphorus biofertilizers from renewable raw materials in the aspect of cadmium and lead contents in soil and plants
- Survey of content of cadmium, calcium, chromium, copper, iron, lead, magnesium, manganese, mercury, sodium and zinc in chamomile and green tea leaves by electrothermal or flame atomizer atomic absorption spectrometry
- Biogas digestate – benefits and risks for soil fertility and crop quality – an evaluation of grain maize response
- A numerical analysis of heat transfer in a cross-current heat exchanger with controlled and newly designed air flows
- Freshwater green macroalgae as a biosorbent of Cr(III) ions
- The main influencing factors of soil mechanical characteristics of the gravity erosion environment in the dry-hot valley of Jinsha river
- Free amino acids in Viola tricolor in relation to different habitat conditions
- The influence of filler amount on selected properties of new experimental resin dental composite
- Effect of poultry wastewater irrigation on nitrogen, phosphorus and carbon contents in farmland soil
- Response of spring wheat to NPK and S fertilization. The content and uptake of macronutrients and the value of ionic ratios
- The Effect of Macroalgal Extracts and Near Infrared Radiation on Germination of Soybean Seedlings: Preliminary Research Results
- Content of Zn, Cd and Pb in purple moor-grass in soils heavily contaminated with heavy metals around a zinc and lead ore tailing landfill
- Topical Issue on Research for Natural Bioactive Products
- Synthesis of (±)-3,4-dimethoxybenzyl-4-methyloctanoate as a novel internal standard for capsinoid determination by HPLC-ESI-MS/MS(QTOF)
- Repellent activity of monoterpenoid esters with neurotransmitter amino acids against yellow fever mosquito, Aedes aegypti
- Effect of Flammulina velutipes (golden needle mushroom, eno-kitake) polysaccharides on constipation
- Bioassay-directed fractionation of a blood coagulation factor Xa inhibitor, betulinic acid from Lycopus lucidus
- Antifungal and repellent activities of the essential oils from three aromatic herbs from western Himalaya
- Chemical composition and microbiological evaluation of essential oil from Hyssopus officinalis L. with white and pink flowers
- Bioassay-guided isolation and identification of Aedes aegypti larvicidal and biting deterrent compounds from Veratrum lobelianum
- α-Terpineol, a natural monoterpene: A review of its biological properties
- Utility of essential oils for development of host-based lures for Xyleborus glabratus (Coleoptera: Curculionidae: Scolytinae), vector of laurel wilt
- Phenolic composition and antioxidant potential of different organs of Kazakh Crataegus almaatensis Pojark: A comparison with the European Crataegus oxyacantha L. flowers
- Isolation of eudesmane type sesquiterpene ketone from Prangos heyniae H.Duman & M.F.Watson essential oil and mosquitocidal activity of the essential oils
- Comparative analysis of the polyphenols profiles and the antioxidant and cytotoxicity properties of various blue honeysuckle varieties
- Special Issue on ICCESEN 2017
- Modelling world energy security data from multinomial distribution by generalized linear model under different cumulative link functions
- Pine Cone and Boron Compounds Effect as Reinforcement on Mechanical and Flammability Properties of Polyester Composites
- Artificial Neural Network Modelling for Prediction of SNR Effected by Probe Properties on Ultrasonic Inspection of Austenitic Stainless Steel Weldments
- Calculation and 3D analyses of ERR in the band crack front contained in a rectangular plate made of multilayered material
- Improvement of fuel properties of biodiesel with bioadditive ethyl levulinate
- Properties of AlSi9Cu3 metal matrix micro and nano composites produced via stir casting
- Investigation of Antibacterial Properties of Ag Doped TiO2 Nanofibers Prepared by Electrospinning Process
- Modeling of Total Phenolic contents in Various Tea samples by Experimental Design Methods
- Nickel doping effect on the structural and optical properties of indium sulfide thin films by SILAR
- The effect mechanism of Ginnalin A as a homeopathic agent on various cancer cell lines
- Excitation functions of proton induced reactions of some radioisotopes used in medicine
- Oxide ionic conductivity and microstructures of Pr and Sm co-doped CeO2-based systems
- Rapid Synthesis of Metallic Reinforced in Situ Intermetallic Composites in Ti-Al-Nb System via Resistive Sintering
- Oxidation Behavior of NiCr/YSZ Thermal Barrier Coatings (TBCs)
- Clustering Analysis of Normal Strength Concretes Produced with Different Aggregate Types
- Magnetic Nano-Sized Solid Acid Catalyst Bearing Sulfonic Acid Groups for Biodiesel Synthesis
- The biological activities of Arabis alpina L. subsp. brevifolia (DC.) Cullen against food pathogens
- Humidity properties of Schiff base polymers
- Free Vibration Analysis of Fiber Metal Laminated Straight Beam
- Comparative study of in vitro antioxidant, acetylcholinesterase and butyrylcholinesterase activity of alfalfa (Medicago sativa L.) collected during different growth stages
- Isothermal Oxidation Behavior of Gadolinium Zirconate (Gd2Zr2O7) Thermal Barrier Coatings (TBCs) produced by Electron Beam Physical Vapor Deposition (EB-PVD) technique
- Optimization of Adsorption Parameters for Ultra-Fine Calcite Using a Box-Behnken Experimental Design
- The Microstructural Investigation of Vermiculite-Infiltrated Electron Beam Physical Vapor Deposition Thermal Barrier Coatings
- Modelling Porosity Permeability of Ceramic Tiles using Fuzzy Taguchi Method
- Experimental and theoretical study of a novel naphthoquinone Schiff base
- Physicochemical properties of heat treated sille stone for ceramic industry
- Sand Dune Characterization for Preparing Metallurgical Grade Silicon
- Catalytic Applications of Large Pore Sulfonic Acid-Functionalized SBA-15 Mesoporous Silica for Esterification
- One-photon Absorption Characterizations, Dipole Polarizabilities and Second Hyperpolarizabilities of Chlorophyll a and Crocin
- The Optical and Crystallite Characterization of Bilayer TiO2 Films Coated on Different ITO layers
- Topical Issue on Bond Activation
- Metal-mediated reactions towards the synthesis of a novel deaminolysed bisurea, dicarbamolyamine
- The structure of ortho-(trifluoromethyl)phenol in comparison to its homologues – A combined experimental and theoretical study
- Heterogeneous catalysis with encapsulated haem and other synthetic porphyrins: Harnessing the power of porphyrins for oxidation reactions
- Recent Advances on Mechanistic Studies on C–H Activation Catalyzed by Base Metals
- Reactions of the organoplatinum complex [Pt(cod) (neoSi)Cl] (neoSi = trimethylsilylmethyl) with the non-coordinating anions SbF6– and BPh4–
- Erratum
- Investigation on Two Compounds of O, O’-dithiophosphate Derivatives as Corrosion Inhibitors for Q235 Steel in Hydrochloric Acid Solution