Eco-friendly RP-HPLC approach for simultaneously estimating the promising combination of pentoxifylline and simvastatin in therapeutic potential for breast cancer: Appraisal of greenness, whiteness, and Box–Behnken design
-
Samar M. Mahgoub
 ,
Maha A. Alwaili
,
Maha A. Alwaili

Abstract
Breast cancer affects millions of women worldwide. This study explores the potential of combining pentoxifylline (PTX) and simvastatin (SIM) as a treatment for breast cancer. We aimed to develop six sustainability tools using green and white metrics to evaluate the environmental impact of reversed-phase high-performance liquid chromatography (RP-HPLC) methods for analyzing and separating PTX and SIM in their pure forms. The tools include analytical GREEnness, green analytical procedure index, Complexgreen analytical procedure index, analytical greenness metric for sample preparation, blue applicability grade index, and the RGB 12 algorithm. For the separation, we used a Novapack C8 column (15 × 0.46 cm, 5 µm) at 25°C. The injection volume was 5.0 µL, the wavelength was set to 210 nm, and the total runtime was 5 min. We identified optimal chromatographic conditions efficiently using the Box–Behnken design with minimal trials. We investigated the effects of three factors on retention time and resolution: acetonitrile ratio, pH, and flow rate. We used overlay plots with a 60:40 ratio (v/v) of acetonitrile and bi-distilled water to forecast the most effective mobile phase. The calibration curves for PTX and SIM showed a correlation value of over 0.999 within the range of 5–60 µg·mL−1. The recovery rates ranged from 99.9% to 100.2%, indicating high accuracy. Our RP-HPLC technique proves to be reliable and efficient for the simultaneous estimation of multiple anticancer drugs. We evaluated the environmental sustainability of this approach using green and white metrics, and the recommended method has been thoroughly validated according to International Council for Harmonisation guidelines, making it highly reliable for analyzing new formulations.
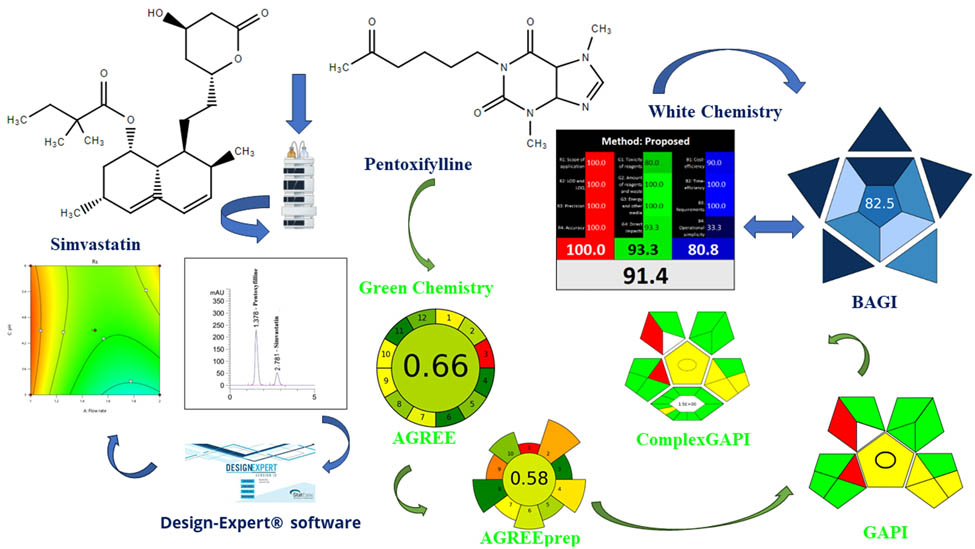
Graphical abstract
1 Introduction
The vision of green and white chemistry represents an innovative and practical approach to chemical research and engineering. This methodology prioritizes the protection of human health and the environment by reducing the use of hazardous reagents in chemical products and processes [1]. By applying the criteria of green and white chemistry, scientists and engineers can develop products and processes that are more durable, safer, and environmentally friendly, effectively addressing the needs of society [2]. Utilizing renewable resources in chemical reactions can significantly reduce pollution and waste, enhancing safety. Green and white chemistry are rapidly becoming crucial drivers of the chemical industry’s future. They are pivotal in developing sustainable practices and leading sustainable chemistry programs. Over the past two decades, they have emerged as key components in advancing sustainable chemistry [3,4]. Globally, both government and private sector initiatives have increasingly promoted green chemistry, with the potential to transform the chemical industry. This shift toward sustainable design has been significantly driven by green chemistry principles. To realize these advancements, chemists must adhere to the twelve criteria of green chemistry [5]. Since 1999, the Royal Society of Chemistry has published the Green Chemistry journal, which has been instrumental in advancing the field. In the coming decades, green chemistry is anticipated to become even more vital, playing a key role in waste prevention and sustainable development. Incorporating parameters for method validation can help assess the “greenness” of analytical techniques [6]. The acceptance of analytical chemistry within the community will increase if the sustainability of its methods is verified. Achieving a sustainable future requires the integration of green chemistry initiatives [7]. There has been a growing movement to find greener ways to conduct quantitative analyses in the last few years. It is crucial to enhance both the safety and health of analysts and the environmental impact of analytical processes. Pharmaceutical companies are adopting more eco-friendly analytical methods, and the analytical community is increasingly focusing on sustainability and environmental responsibility. When developing new methods, careful attention must be given to the eco-friendliness of solvents and waste production. While sustainability has made significant strides in analytical chemistry, further progress is still needed [8].
Using the Box–Behnken design (BBD) can greatly enhance the precision of experimental results. By adjusting the chromatographic system with BBD and HPLC, analytical techniques are developed and validated with improved accuracy. This optimization leads to more efficient HPLC procedures. Additionally, peak parameters are adjusted until they meet the desired specifications. BBD is a practical and straightforward method that provides reliable results, even when multiple factors need to be assessed. The BBD is unquestionably one of the most often used response surface methodology (RSM) in experimental design. BBD uses a three-level factorial design that only makes use of the midpoints of the edge and center points in order to avoid extreme combinations of components. One of the main advantages of BBD over central composite design (CCD) is that it requires fewer iterations and has better consistency across the design domain. Being able to construct the design matrix of BBD with fewer experimental runs makes it a more practical and affordable option than CCD. However, it is imperative to recognize that BBD is not without limitations. For example, it can compute only a portion of the quadratic model for components with four factors or hard-to-modify factors. Despite these limitations, BBD is still a good option for experimental design [9].
For female cancer patients, breast cancer accounts for the vast majority of deaths, and it is anticipated that its occurrence will increase in the coming decade. Despite significant research and resources dedicated to finding a cure, breast cancer remains challenging to treat due to issues such as metastasis, recurrence, and drug resistance. Therefore, there is a pressing need for new technologies and drugs to reduce cancer-related mortality. Recent studies suggest that statins can inhibit cancer cell growth and induce cell death. Specifically, simvastatin (SIM) (Figure S1a) has shown promise in overcoming chemotherapeutic resistance, especially in conjunction with doxorubicin [10]. Meanwhile, pentoxifylline (PTX) (Figure S1b) exhibits several properties beneficial for cancer treatment. It has demonstrated anticancer activity and can increase the sensitivity of cancer cells to radiation therapy, potentially reducing the long-term side effects associated with radiation. Additionally, PTX may enhance the effectiveness of commonly used drugs such as cisplatin and doxorubicin, while also mitigating their side effects, as reported by several research groups [11]. In 2018, Castellanos-Esparza et al. reported a synergistic effect of both drugs in enhancing the sensitivity of the triple-negative breast cancer cell line MDA-MB-231 [12]. Several studies have investigated using PTX and SIM individually in human plasma or in vitro. However, there is currently no method for simultaneously determining both drugs using HPLC. While numerous HPLC methods have been developed for analyzing PTX in pharmaceutical dosage forms and human plasma [13,14,15,16], a combined method for both drugs remains unavailable. Conversely, several HPLC methods have been reported for determining and quantifying SIM in pharmaceutical dosage forms [17,18,19]. The significance of this study lies in its development of a novel, green, and sustainable HPLC method for the simultaneous analysis of PTX and SIM, two drugs with promising potential for breast cancer treatment. Breast cancer remains a major global health concern, and the search for effective and sustainable treatment options is ongoing. PTX and SIM have shown individual promise in cancer therapy, with PTX exhibiting anticancer activity and enhancing the effectiveness of other treatments, while SIM has demonstrated potential in overcoming chemotherapeutic resistance. Previous studies have suggested a synergistic effect between PTX and SIM in treating triple-negative breast cancer. However, a lack of a reliable and efficient method for simultaneously quantifying both drugs in a single analysis has hindered further research and clinical applications. Our study addresses this gap by introducing a green and sustainable HPLC method that meets the growing demand for environmentally friendly analytical techniques in the pharmaceutical industry. By utilizing green and white chemistry principles, our method minimizes the use of hazardous chemicals and reduces waste, contributing to a more sustainable and environmentally responsible approach to drug analysis. The successful development of this method paves the way for more efficient and effective research into the potential of PTX and SIM as a combination therapy for breast cancer.
Based on a thorough literature review, no HPLC method has been found that can simultaneously quantify PTX and SIM while ensuring analyst safety and adhering to environmental preservation principles based on green and white chemistry. To address this gap, we have developed a novel, environmentally friendly HPLC method incorporating green and white chemistry principles and BBD. This method aims to quantify PTX and SIM accurately and efficiently in their respective dosage forms.
We assessed the “greenness” and “whiteness” of our procedure using several tools, including analytical GREEnness (AGREE), analytical greenness metric for sample preparation (AGREEprep), green analytical procedure index (GAPI), Complexgreen analytical procedure index (ComplexGAPI), and blue applicability grade index. In addition to these widely recognized green metrics, we also employed BAGI and RGB12. Our results confirm that the method is environmentally friendly. Furthermore, we have innovatively addressed the issue of peak overlap in binary combinations using HPLC, which may significantly enhance chromatographic analysis.
2 Materials and methods
2.1 Materials and reagents
Career Henan Chemical Co. (Henan, China) provided a PTX standard, and Hangzhou Lane Technology Co., Ltd (Hangzhou, China) provided a SIM standard. As commercial formulations were unavailable, we used a synthetic mixture instead of the commercial formulations. Merck (Germany) provided bi-distilled water, HPLC-grade ethanol, and acetonitrile.
2.2 Apparatuses
This work employed an HPLC quaternary pump, an autosampler, and a PDA detector (Agilent, USA, HPLC 1260 Infinity II). Data handling and collection were carried out with open-source software, “chromatography data system.”
2.3 Chromatographic system
The optimal system was established using isocratic mode in the reversed-phase high-performance liquid chromatography (RP-HPLC) methods. The analysis was conducted with a Novapack C8 column (15 × 0.46 cm, 5 µm) at 25°C. With a flow rate of 1.0 mL·min−1, an injection volume of 5 µL, UV detection at 210 nm, and a runtime of 5 min, the RP-HPLC method used acetonitrile and bi-distilled water as the mobile phase. Samples were prepared at room temperature (25°C) within 24 h of collection and stored in amber-colored vials at 4°C to minimize light exposure until analysis. The sample cooler was maintained at 4°C to ensure the stability of the analytes during storage and transportation. These measures were implemented to address potential stability issues with PTX and SIM effectively.
2.4 Standard stock solutions
To prepare the stock standard, we weighed 5.0 mg of PTX and SIM and added it to a 10-mL volumetric flask. We then added 5 mL of ethanol and vigorously shook and sonicated the flask for 5 min. As a final step, we added purified water until the stock solution reached 500 µg·mL−1.
2.5 Construction of calibration curves
A range of concentrations of PTX and SIM standard solutions were studied from 5.0 to 60 µg·mL−1. For the standard check, two points were calibrated, a test setup was performed, a recovery injection was conducted, and a standard check was conducted. Regression equations were used to correlate integrated peak areas with concentrations.
2.6 Tools for measuring greenness and whiteness
2.6.1 AGREE tool
In addition to evaluating general sustainability, the AGREE tool specifically assesses environmental sustainability. During the evaluation process, the 12 criteria of the Green analytical chemistry (GAC) are reviewed. Each variable or concept is rated based on its ecological sustainability, with scores ranging from 0 to 1. The results are displayed in graphs that use red, yellow, and green to indicate the levels of achievement for each standard. The size of each region on the chart corresponds to the magnitude of the metric [20].
2.6.2 AGREEprep tool
Sample preparation is a crucial step in analytical processes and should be conducted sustainably. AGREEprep ensures that the environmental impact of sample preparation techniques is minimized by adhering to eco-friendly principles. While the 12 rules of GAC were previously followed, AGREEprep now aligns with the ten green sample preparation (GSP) standards, which are considered the industry’s leading benchmarks for sustainable sample preparation [21].
2.6.3 GAPI tool
Proposing greener methods necessitates a thorough greenness assessment. It is crucial to evaluate how samples are prepared, analyzed, and finalized before assessing a technique’s overall “greenness.” The assessment design features five pentagrams, each representing a stage of the process. These stages are categorized as green, yellow, or red based on their environmental impact, with levels classified as low, medium, or high. This tool allows us to evaluate our analytical methods and enhance their environmental impact, moving toward more sustainable practices [22].
2.6.4 ComplexGAPI tool
ComplexGAPI extends GAPI by including additional steps before sample preparation and analysis. It evaluates environmental sustainability, instrumentation, workflow, and purification alongside yield, conditions, reagents, and solvents. The sustainability implications are assessed using a color-coded system similar to GAPI, with environmental concerns represented as red, yellow, or green [23].
2.6.5 BAGI tool
One of the key roles of BAGI is to assess analytical methods. This tool enhances well-known green metrics by incorporating the criteria of white analytical chemistry (WAC). BAGI evaluates an analytical technique based on ten essential characteristics: effectiveness, automation, sample preparation, quantities, reagents, materials, sample analysis capacity per hour, simultaneous analysis of analytes, instrumentation requirements, and concurrent sample treatment. Using this information, BAGI generates pictograms and scores to identify potential improvements. AGREE, ComplexGAPI, GAPI, and AGREEprep are examples of existing green assessment technologies that BAGI enhances by offering a comprehensive methodology for assessing analytical chemistry methods [24].
2.6.6 RGB12 algorithm tool
The use of green methods alone does not ensure sustainability in analytical chemistry, as these methods primarily focus on reducing environmental harm. Sustainability also requires considering method efficacy, validity, and cost. To evaluate and balance these factors, the RGB12 algorithm tool is employed, which compares up to ten methods using a free Excel spreadsheet. This tool uses a three-color table to assess 12 key WAC assumptions: the red table evaluates the scope of application, detection limits, quantitative limits, and precision and accuracy; the green table considers reagent toxicity, waste, and energy consumption; and the blue table looks at cost, time, and ease of operation. The results are summarized in a three-column table where scores out of 100 indicate compliance with WAC postulates. The most sustainable method is identified by the highest whiteness score, reflecting the optimal balance of performance, environmental impact, and productivity [25].
2.7 Optimization of RP-HPLC method by design of experiments (DOE)
Our preliminary screening study identified the key factors influencing chromatographic separation. To optimize the resolution and retention times of both drugs, we used BBD with RSM, examining three variables at three levels. The variables included in the mobile phase were acetonitrile ratio, pH, and flow rate. We conducted 17 experiments to analyze retention time and resolution. The results were accurately represented by second-order polynomial equations, and a three-dimensional (3D) response surface was created to visualize the interactions between independent variables. The optimal outcome was predicted using overlay plots and the desirability function [26].
3 Results
The study uses HPLC methodology to determine PTX and SIM simultaneously, assessing the method’s white and green metrics and efficacy in the pure dosage form.
3.1 Utilizing an analytical quality by design (AQbD) approach for method development
3.1.1 Establishing precise analytical target profiles (ATP) and identifying critical quality attributes (CQAs)
Before utilizing the AQbD process for the developed method, it is essential to construct ATP beforehand. This section identified the fundamental attributes that serve as indicators of technique performance. Reliable results were achieved by identifying CQAs from the defined ATP. The CQAs play a crucial role in assessing the satisfactory performance of the developed procedure. Table S1 provides a comprehensive list of the ATP components used in the current RP-HPLC technique for PTX and SIM. The CQAs associated with ATP were resolution and retention time for PTX and SIM, respectively [27].
3.1.2 Risk assessment study
Using risk assessment studies, the effects of numerous factors impacting the ATP were investigated. To conduct the risk assessment, it is necessary to have an understanding of the specified relationship(s) between the critical analytical attributes (CAAs) of ATP and critical method parameters. Figure S2 is a cause-and-effect Ishikawa fishbone diagram. It is a methodical approach to grouping the causes of a problem to pinpoint the origins of errors, variances, flaws, or malfunctions. Factors including stationary phase, mobile phase, and other parameters affected the CAAs of the RP-HPLC process, according to an failure mode and effects analysis (FMEA) risk assessment research. The risk priority number (RPN) was utilized in the computation of the FMEA research results. To determine the RPN, the risk was rated from 1 to 5 (1 low, 5 high). The final RPN was the product of severity (S), occurrence (O), and detectability (D). Eq. 1 provided a mathematical representation of the RPN computation [28]
3.2 Methods development and optimization
3.2.1 Mobile phase composition
Methanol/water (50:50, v/v) and monobasic potassium dihydrogen phosphate buffer pH 3: ethanol (50:50, v/v) were used as mobile phases, but no definite sharp peak was obtained with the monobasic potassium dihydrogen phosphate buffer pH 5.0: ethanol (50:50, v/v). The choice of water and acetonitrile as the mobile phase components is likely due to their polarity and ability to solvate a wide range of analytes. The 40:60 ratio was likely optimized to achieve the best balance between retention and peak shape for the specific analytes being separated.
3.2.2 pH
The pH of the mobile phase can influence the ionization state of analytes, affecting their retention behavior. The observed decrease in retention time at lower pH values suggests that the analytes might be positively charged species that interact more strongly with a negatively charged stationary phase at higher pH. The finding that pH 3.0 provided the best peak shape and retention times indicates that this pH was optimal for minimizing analyte ionization and maximizing retention.
3.2.3 Flow rate
The flow rate affects peak broadening and retention time. A higher flow rate can reduce analysis time but may also lead to decreased peak resolution. Variations of the flow rate from 0.5 to 2 mL·min−1 have been carried out. The chosen flow rate of 1.0 mL·min−1 was likely determined to balance peak resolution and analysis time.
3.2.4 Stationary phase
We used various columns of various packing materials and different lengths, including C8, C18, phenyl, and cyano columns, with different lengths, which varied from 100 to 250 mm. The choice of stationary phase (C8) (15 × 0.46 cm, 5 µm) is likely based on the polarity and chemical properties of the analytes. A C8 stationary phase is moderately hydrophobic and can provide good retention for a variety of analytes. Therefore, the estimated void volume for a Novapack C8 column (15 × 0.46 cm, 5 µm) having a porosity of 0.4 is approximately 0.248 cm3 calculated from the following equation:
3.2.5 Detection wavelength
Because of UV absorbance properties of the analytes, the wavelengths within 200–400 nm were selected for scanning, giving a clear chromatogram with sharp peaks with a high resolution of 210 nm. This wavelength ensures that the analytes can be detected with good sensitivity.
3.2.6 Column temperature
A constant temperature of 25°C was likely maintained to ensure consistent retention times and peak shapes.
Overall, the chromatographic conditions were carefully optimized to achieve the desired separation goals. The justifications provided above demonstrate a sound understanding of the factors influencing chromatographic behavior and the systematic approach taken to optimize the method.
3.3 DoE
The development of HPLC methods has undergone a significant transformation. Historically, analysts relied on trial and error to achieve desired results, which was time-consuming and inefficient. Conventional one-factor-at-a-time approaches are now seen as less effective due to their high costs, resource demands, and limited ability to provide fully justified results. In contrast, BBD offers a more precise method for assessing variable influence and interactions with fewer experiments, as illustrated in Table 1. BBD generates a second-order polynomial equation using a chromatographic response classifier, optimizing chromatographic parameters and highlighting critical components. This approach reduces the number of trials required and improves accuracy and reliability. Although BBD may only effectively explore extreme values of factors, it remains a leading method for refining chromatographic procedures. After extensive testing, BBD has proven to simplify processes effectively. To ensure precision, we conducted three rounds of testing with varying pH, flow rates, and acetonitrile ratios, using randomization for the final 17 runs. This approach helped identify faults and minimize the impact of external factors [29].
Variables and responses for the improved method's Box-Behnken experimental design
| Factor 1 | Factor 2 | Factor 3 | Response 1 | Response 2 | Response 3 | ||
|---|---|---|---|---|---|---|---|
| Std | Run | A: Flow rate | B: ACN | C: pH | Rs | RT1 | RT2 |
| 1 | 7 | 1 | 50 | 4.5 | 7.78 | 1.47 | 2.51 |
| 2 | 12 | 2 | 50 | 4.5 | 5.78 | 1.03 | 2.19 |
| 3 | 4 | 1 | 70 | 4.5 | 7.53 | 1.26 | 2.29 |
| 4 | 14 | 2 | 70 | 4.5 | 7.23 | 0.99 | 1.91 |
| 5 | 6 | 1 | 60 | 3 | 8.96 | 1.33 | 2.37 |
| 6 | 5 | 2 | 60 | 3 | 4.98 | 1.08 | 2.1 |
| 7 | 8 | 1 | 60 | 6 | 8.14 | 1.23 | 2.21 |
| 8 | 10 | 2 | 60 | 6 | 6.97 | 1.01 | 2.05 |
| 9 | 13 | 1.5 | 50 | 3 | 2.9 | 1.25 | 2.26 |
| 10 | 3 | 1.5 | 70 | 3 | 5.45 | 1.18 | 2.17 |
| 11 | 17 | 1.5 | 50 | 6 | 6.44 | 1.12 | 2.13 |
| 12 | 1 | 1.5 | 70 | 6 | 6.58 | 1.1 | 2.12 |
| 13 | 2 | 1.5 | 60 | 4.5 | 6.23 | 1.21 | 2.19 |
| 14 | 11 | 1.5 | 60 | 4.5 | 6.23 | 1.21 | 2.19 |
| 15 | 16 | 1.5 | 60 | 4.5 | 6.23 | 1.21 | 2.19 |
| 16 | 9 | 1.5 | 60 | 4.5 | 6.23 | 1.21 | 2.19 |
| 17 | 15 | 1.5 | 60 | 4.5 | 6.23 | 1.21 | 2.19 |
3.4 An assessment of the suggested approaches’ greenness and whiteness
3.4.1 AGREE tool
AGREE is the framework utilized to assess environmental sustainability. It applies the GAC’s 12 fundamental principles to evaluate each code’s score. A color-coded graph using red, yellow, and green illustrates the achievement levels for each standard, with the size of each region on the chart directly correlating to the metric being measured. AGREE offers a comprehensive evaluation of an entity’s environmental sustainability, as shown in Figure S3a. The AGREE pictogram in Figure 1a, which features varying shades of green and a central score of 0.66, visually represents this assessment.
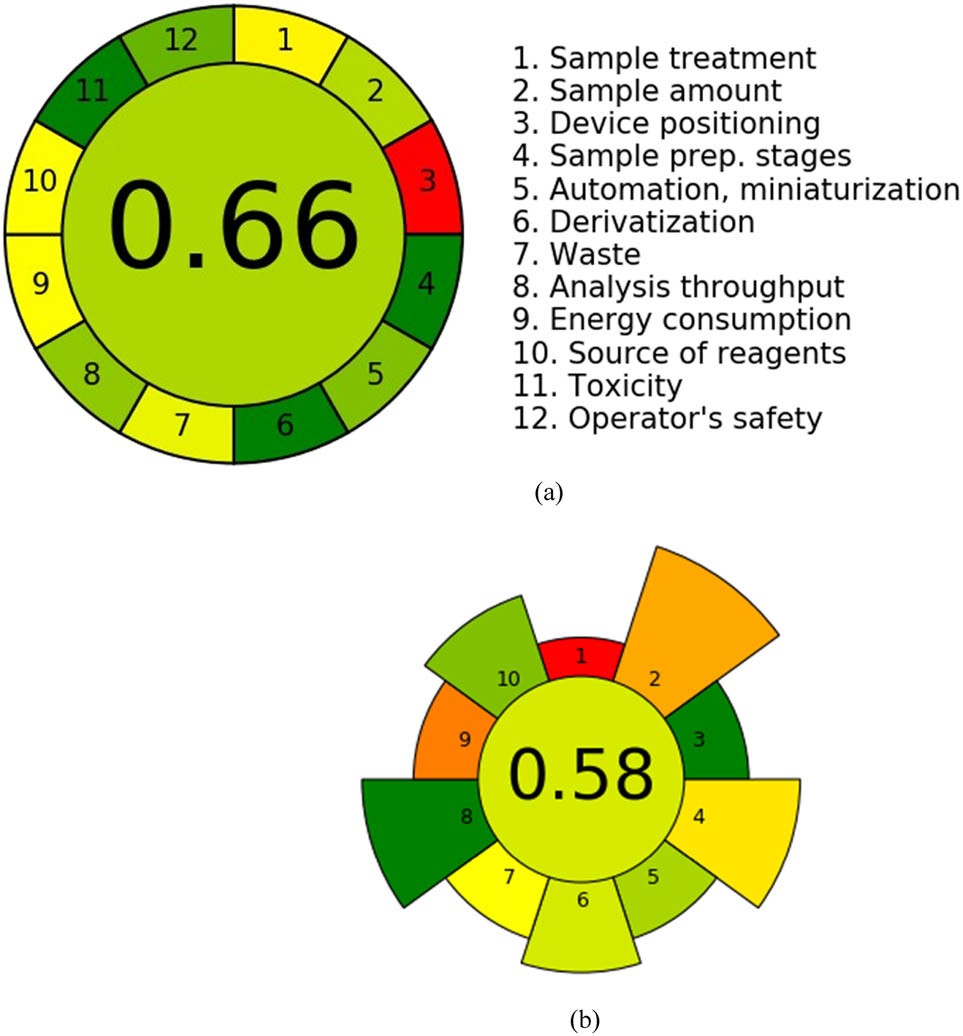
Assessment of the developed HPLC technique utilizing (a) AGREE and (b) AGREEprep.
3.4.2 AGREEprep tool
The AGREEprep methodology streamlines the evaluation and sample preparation processes by incorporating the ten fundamental principles of environmentally sustainable sampling. A score of 1 indicates optimal performance, while scores between 0 and 1 reflect varying levels of proficiency. Each of the ten sectors is depicted with a distinct graphic symbol, as illustrated in Figure S3b. Figure 1b shows a score of 0.58, confirming the ecological effectiveness of our methodology.
3.4.3 GAPI tool
The GAPI approach enables a reliable assessment of an analytical method’s environmental sustainability, encompassing all stages from sample preparation to final determination. It features 15 descriptive components that underscore 5 key characteristics distinguishing its approach. GAPI effectively compares different analytical methodologies by considering all relevant factors throughout the process, as detailed in Figure S4a. Our study’s results, illustrating the ecological impact of this method, are shown in Figure 2a.
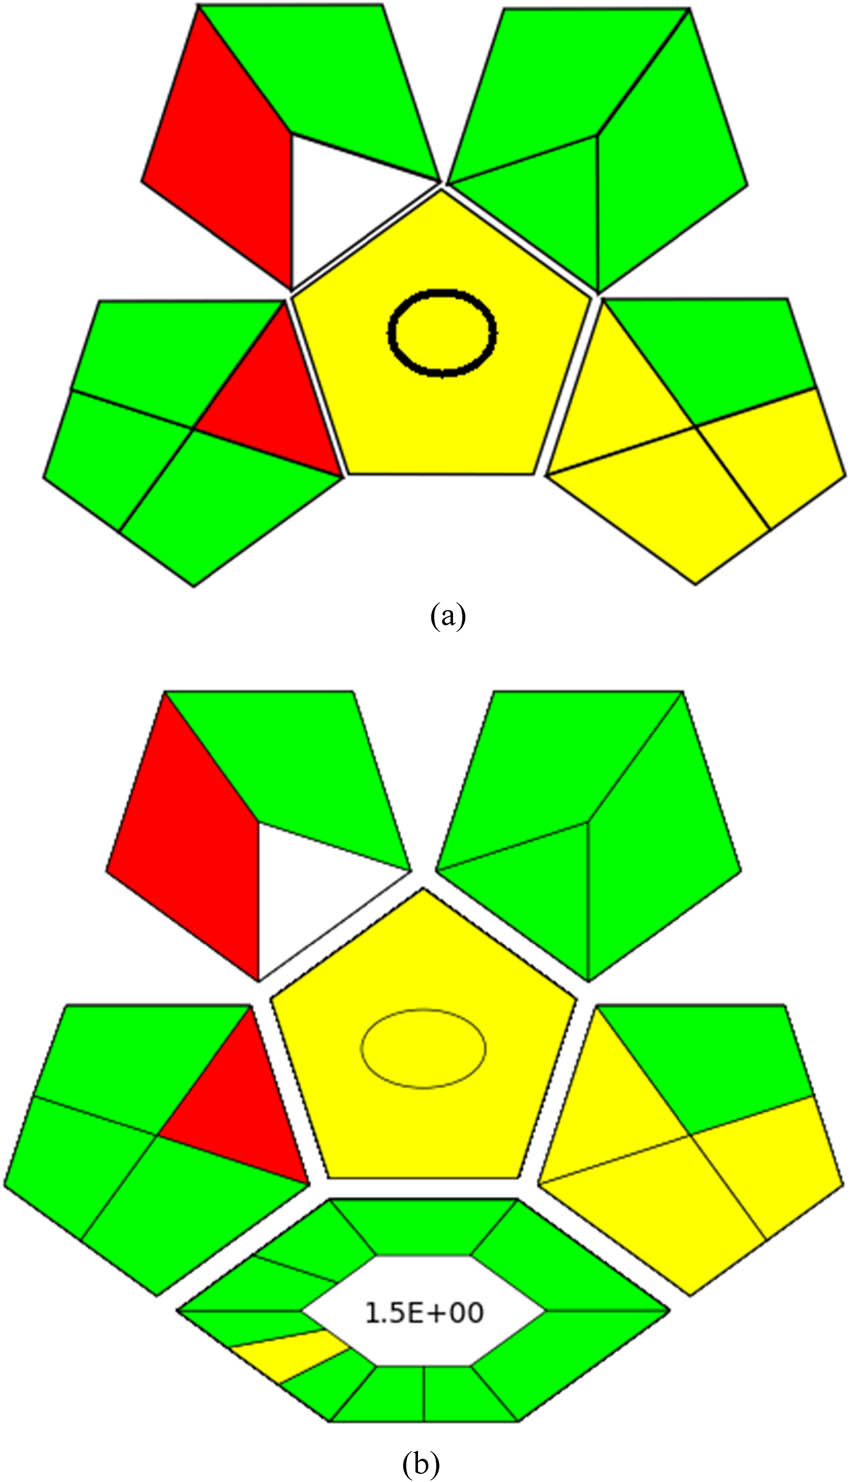
Assessment of the developed HPLC technique utilizing (a) GAPI and (b) ComplexGAPI.
3.4.4 ComplexGAPI tool
ComplexGAPI extends the traditional GAPI metrics by incorporating a hexagonal layer that includes pre-analysis procedures. This layer evaluates various aspects such as output, reaction conditions, reactants, solvents, instrumentation, and post-reaction processing. Like GAPI, ComplexGAPI employs a color-coded system to assess the sustainability implications of each element, with red, yellow, and green representing significant, moderate, and minimal environmental concerns, respectively (Figure S4b). Figure 2b visually demonstrates how different strategies are employed within this framework. ComplexGAPI is particularly useful for analyzing methodologies that integrate GAC characteristics.
3.4.5 BAGI tool
BAGI showcases the utility and effectiveness of its ten standards through pictograms and scores. The final HPLC score combines dark blue, light blue, and dark blue shades to represent the method’s performance. The color coding reflects how well the approach meets the established requirements. An analytical technique is deemed applicable if it scores 60 or higher, as illustrated in Figure S5. Figure 3a presents the pictograms of the BAGI indexes, highlighting the evaluation outcomes.
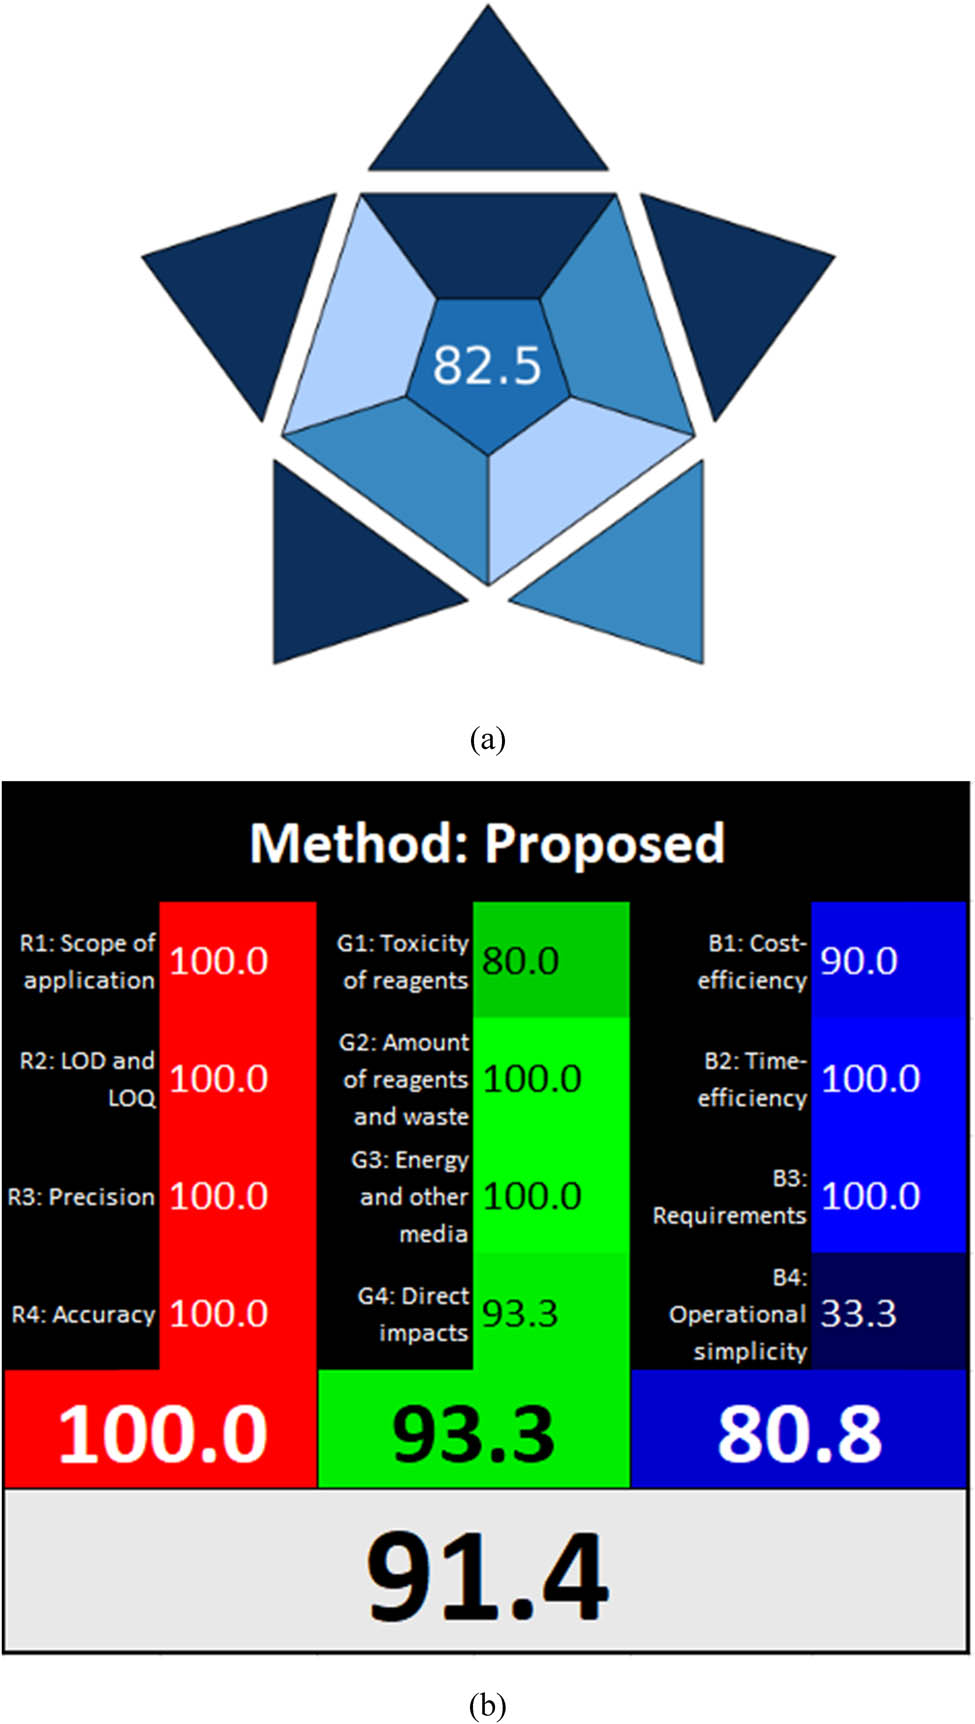
Assessment of the developed HPLC technique utilizing (a) BAGI and (b) RGB 12 algorithm.
3.4.6 RGB12 algorithm tool
The RGB12 tool scores each of the three colors individually and combines the results using an algorithm. A method is considered “white” if it aligns well with WAC principles. The newly developed HPLC analysis method effectively detected impurities, achieving a perfect score of 100% in the red category and 93.3% in the green category. Additionally, it scored 80.8% in the blue category, reflecting its improved efficiency and practicality. Overall, the method demonstrated strong environmental friendliness and sustainability, earning a 91.4% score in the whiteness evaluation, as shown in Figure 3b.
3.5 Method validation
By validating the proposed procedures based on International Council for Harmonisation (ICH) guidelines, analysts are assured that the procedures will be productive and reliable [30].
3.5.1 Linearity and range
As drug concentrations in samples increase, HPLC techniques exhibit linearity, producing results that are proportional to the drug concentrations. Using a calibration curve that plots drug peak areas against their respective concentrations within the designated ranges, calibration curves were developed. The correlation coefficients (r) obtained were greater than 0.999, indicating a high degree of linearity. Data analysis and method fitting were performed using Open-lap software. Table 2 provides a detailed characterization of the calibration curves, demonstrating excellent reliability and accuracy across all tested calibration points. The results consistently showed high reliability.
Regression and statistical parameters from the calibration curves of PTX and SIM
| Parameter | Drugs | |
|---|---|---|
| PTX | SIM | |
| Wavelength | 210 nm | 210 nm |
| Range (µg·mL−1) | 5–60 | 5–60 |
| Coefficient of determination (R 2) | 0.9998 | 0.9999 |
| Slope | 23.86 | 4.00 |
| Intercept | 64.85 | −2.17 |
| LOD | 1.18 µg·mL−1 | 1.03 µg·mL−1 |
| LOQ | 3.59 µg·mL | 3.13 µg·mL |
Note: LOD (3.3 × σ/slope) and LOQ (10 × σ/slope).
3.5.2 Limit of detection (LOD) and limit of quantification (LOQ)
Using the formulas from our validated Excel sheet, (3.3/S) and (10/S), we calculated the LOD LOQ. In these formulas, S represents the slope and standard deviation from the calibration curves. According to Table 2, strategies with the lowest LOD and LOQ values demonstrate the highest sensitivity.
3.5.3 Accuracy and recovery
The samples were injected three times in duplicate into a standard analyte concentration at 50%, 100%, and 150% concentrations. Table 3 contains experimental results, which can be used to determine the degree of agreement between actual and experimental values.
Results of accuracy for PTX and SIM in commercial tablets
| Test % | St add.n (mL) to 50 mL flask | Calculated amount (µg·mL−1) | Amount found (µg·mL−1) | Recovery (%) | Calculated amount (µg·mL−1) | Amount found (µg·mL−1) | Recovery (%) |
|---|---|---|---|---|---|---|---|
| PTX | SIM | ||||||
| Tablets | Tablets | Tablets | Tablets | Tablets | Tablets | Tablets | |
| 50% | 5 | 10.68 | 10.680 | 100.000 | 18.50 | 18.490 | 99.946 |
| 100% | 10 | 20.68 | 20.470 | 98.985 | 38.50 | 38.560 | 100.156 |
| 150% | 15 | 30.85 | 30.770 | 99.741 | 57.75 | 57.860 | 100.190 |
| Minimum | 98.98 | 99.95 | |||||
| Maximum | 100.00 | 100.16 | |||||
| Average | 99.58 | 100.19 | |||||
| SD | 0.53 | 0.13 | |||||
| RSD% | 0.52986 | 0.13219 | |||||
3.5.4 Precision
A rigorous intraday and interday precision assessment was conducted over 1 and 2 days to evaluate the repeatability and intermediate precision of the method. Divide the standard deviation (SD) by 100 to calculate the relative standard deviation percentage. With a precision of less than 2%, the developed method shows high precision. Detailed results are provided in Table 4.
Results of Intra-day and inter-day precision for PTX and SIM in commercial tablets
| Test | PTX | SIM | ||
|---|---|---|---|---|
| First analyst (within a day) | Second analyst (between days) | First analyst (within a day) | Second analyst (between days) | |
| Test 1 | 103.8 % | 100.39% | 100.05% | 100.15% |
| Test 2 | 102.08% | 102.08% | 99.98% | 100.21% |
| Test 3 | 101.5% | 101.50% | 100.12% | 100.18% |
| Test 4 | 101.6% | 101.6% | 99.86% | 100.04% |
| Test 5 | 103.33% | 103.33% | 99.92% | 99.86% |
| Test 6 | 103.75% | 103.75% | 100.19% | 100.11% |
| Average | 102.57% | 102.26% | 100.02% | 100.09% |
| SD | 1.02 | 1.04 | 0.13 | 0.12 |
| RSD | 1.04 | 1.02 | 0.13 | 0.13 |
| Pooled RSD (12 samples) | 1.03 | 0.12 | ||
3.5.5 Robustness
The robustness of a methodology refers to its ability to remain unchanged even when its parameters undergo minor but intentional fluctuations. After modifying each drug parameter, standards were prepared and injected. Table 5 shows several variations, including wavelength adjustment (210 nm ± 2 nm), flow rate adjustment (1.0 mL·min−1 ± 0.1 mL·min−1), and mobile phase modification (60% acetonitrile ± 1.0%).
Method robustness for the developed HPLC method for PTX and SIM
| Analyte | Chromatographic parameters | Wavelength (nm) | Acetonitrile ratio (%) | Flow rate | Column temperature | ||||
|---|---|---|---|---|---|---|---|---|---|
| PTX | 208 | 212 | 59.00% | 61.00% | 0.9 min·mL−1 | 1.1 min·mL−1 | 20°C | 30°C | |
| Assay % | 101.61% | 102.01% | 101.33% | 101.87% | 100.90% | 101.21% | 100.88% | 101.02% | |
| Retention time (Rt) | 1.32 | 1.34 | 1.34 | 1.32 | 1.35 | 1.32 | 1.37 | 1.30 | |
| Tailing factor | 0.80 | 0.82 | 0.80 | 0.81 | 0.82 | 0.83 | 0.98 | 0.78 | |
| Resolution | N/A | N/A | N/A | N/A | N/A | N/A | N/A | N/A | |
| SIM | Assay % | 106.85% | 107.34% | 108.74% | 107.03% | 106.11% | 107.40% | 106.53% | 105.44% |
| Retention time (Rt) | 2.37 | 2.38 | 2.37 | 2.33 | 2.34 | 2.36 | 2.42 | 2.29 | |
| Tailing factor | 0.89 | 0.9 | 0.88 | 0.89 | 0.88 | 0.89 | 0.84 | 0.77 | |
| Resolution | 8.90 | 8.94 | 8.96 | 8.94 | 8.95 | 8.93 | 9.45 | 8.84 | |
3.5.6 Selectivity
Various unknown substances, matrices, degradation agents, impurities, or blanks were assessed to determine whether HPLC methods could accurately and reliably detect analytes. In the developed methods, peaks of active ingredients were unaffected by diluents, excipients, placebos, degradants, impurities, and chemical coatings.
3.5.7 System suitability
An operation must meet specific requirements before its results can be accepted. This is called system suitability. At least five final standard solutions were repeatedly injected to evaluate the suitability of the developed processes. Statistical analysis in Table 6 revealed acceptable plate counts, resolutions, peak tailing, peak shapes, and peak % relative standard deviation. As a result of developing the analytical methods, we observed that the results were accurate and complied with United States pharmacopeia requirements and FDA guidelines.
System suitability criteria for the suggested HPLC method for PTX and SIM
| Suitability parameter | PTX | SIM |
|---|---|---|
| Retention time (min) | 1.33 | 2.37 |
| Resolution (NLT 2.0) | N/A | 8.96 |
| Theoretical plates (NLT 2000) | 4,740 | 4,022 |
| Tailing factor (NMT 2.0) | 0.80 | 0.86 |
3.5.8 Forced degradation
To assess how the active pharmaceutical ingredients (APIs) PTX and SIM degrade under various conditions, we conducted forced degradation studies. These studies simulate the stress conditions that might occur during storage or after administration. Forced degradation is a type of accelerated stability study that predicts how a drug behaves over time more quickly than traditional long-term stability tests. The methods used for forced degradation include exposure to acidic and basic conditions, oxidation, light, and heat. Typically, the acceptable degradation range for HPLC analysis is between 5% and 20%, though some researchers suggest that a 10% degradation is ideal for validating HPLC methods for small molecules.
3.5.8.1 Acid hydrolysis
PTX and SIM were subjected to acid hydrolysis testing individually in round-bottom flasks, each containing 10 mg of the respective compound. The flasks were subjected to heating in a water bath at a temperature of 70°C for a duration of 3 h, using 30 mL of a solution containing 0.1 N HCl. Following the process of heating, the samples were counteracted using a diluted solution of 0.1 N NaOH to achieve a final concentration of 20 µg·mL−1 using distilled water. The solutions were subsequently examined using HPLC, and the findings are presented in Figure 4a.
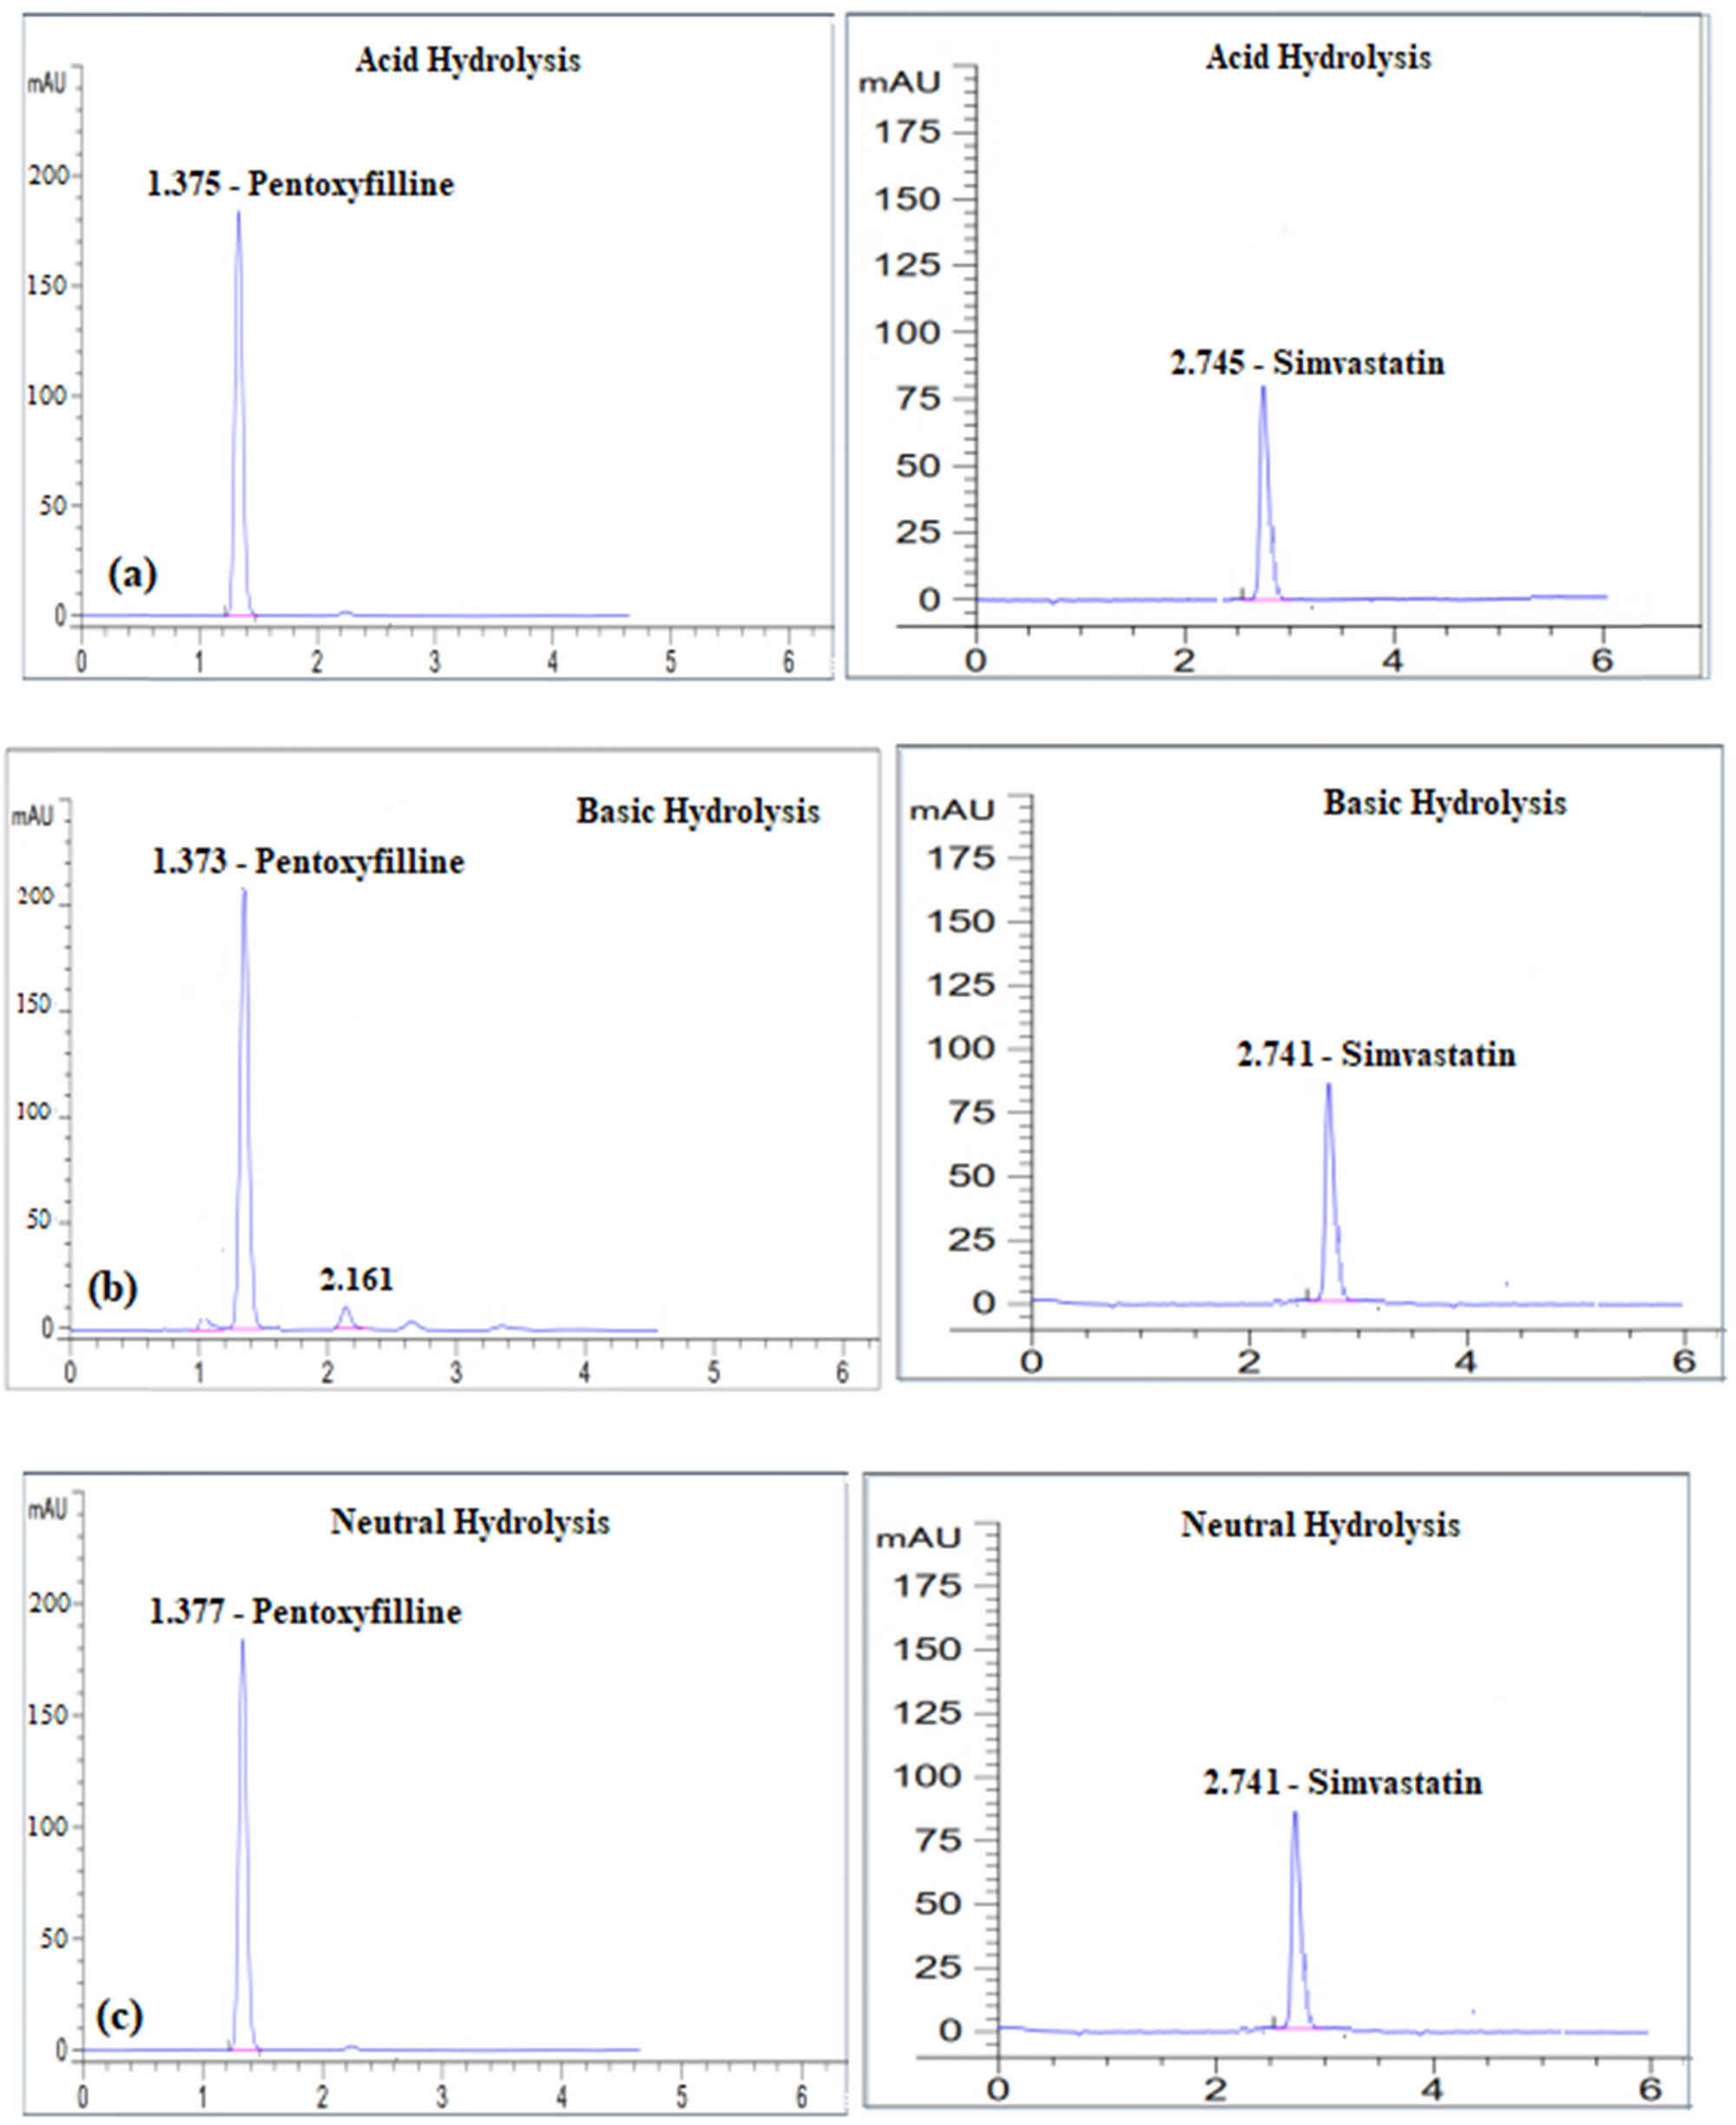
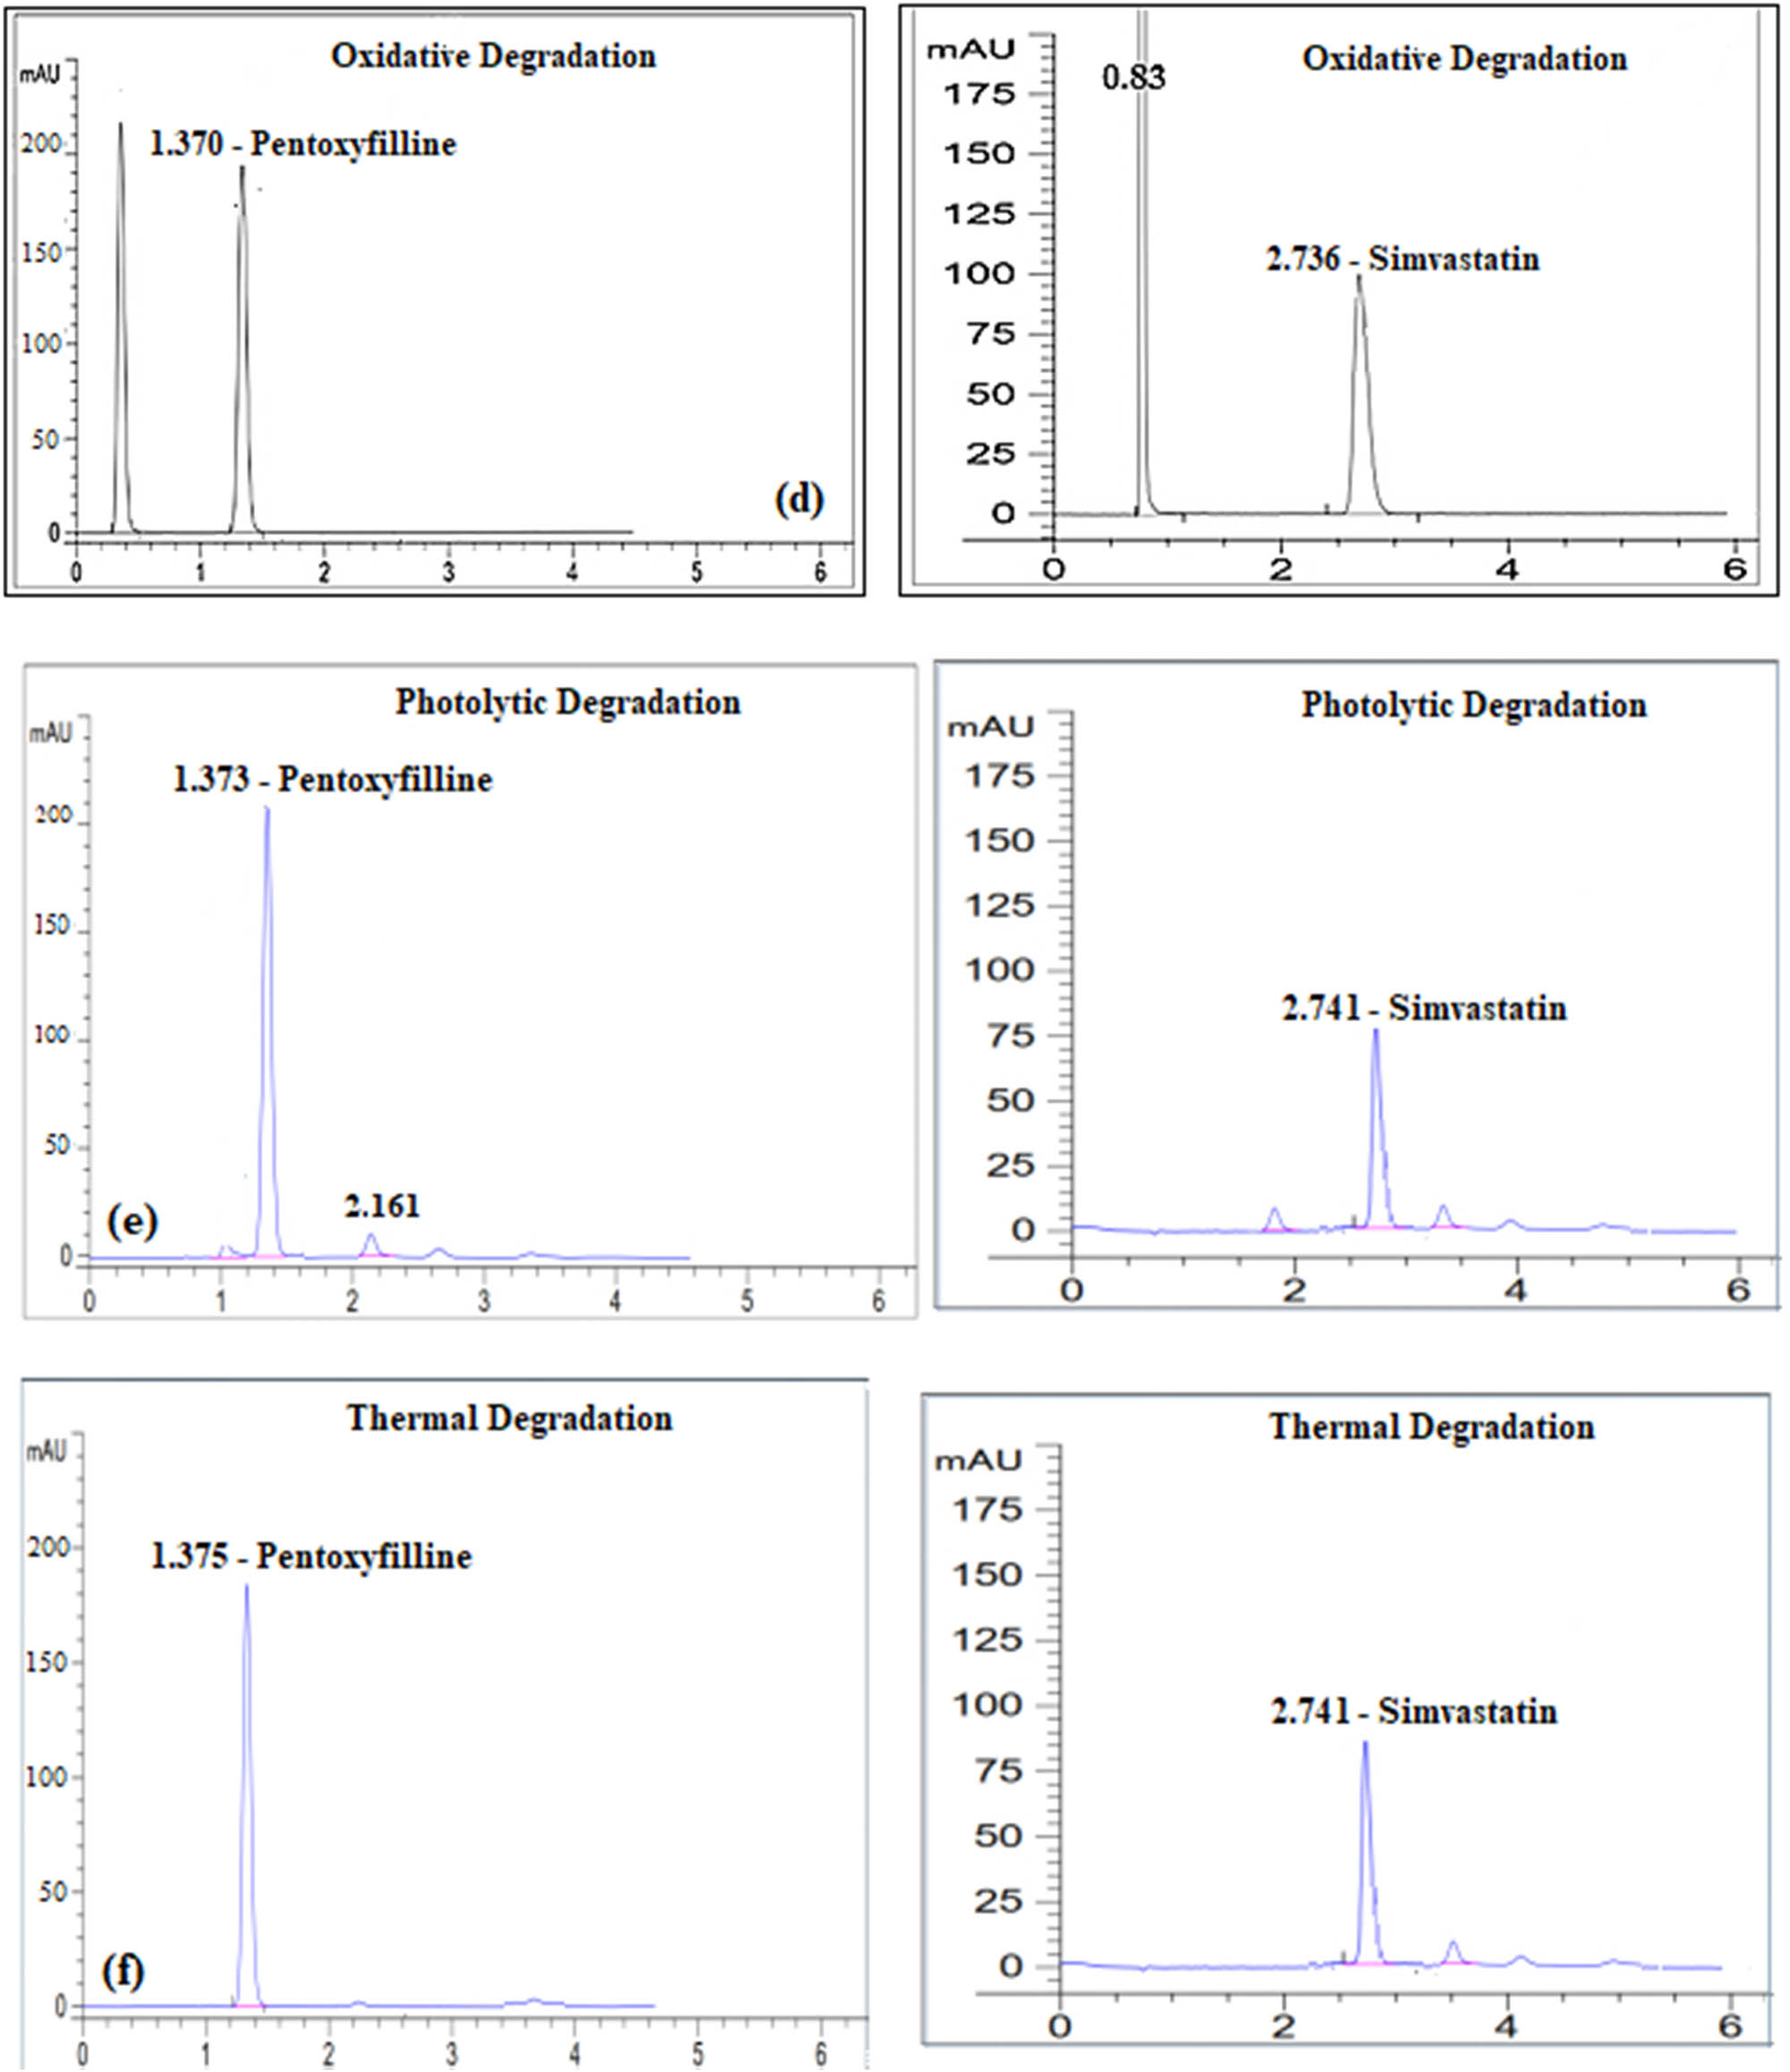
Degradation profiles of each of Pentoxyfilline and Simvastatin after their exposure to (a) 0.1N HCl, (b) 0.1N NaOH, (c) water, (d) 30% H2O2, (e) photolytic degradation, and (f) thermal degradation, respectively.
3.5.8.2 Basic hydrolysis
In the basic hydrolysis test, we followed a similar procedure but used 30 mL of 0.1 N NaOH instead of 0.1 N HCl. After the reaction, the samples were neutralized with 0.1 N HCl, and the final concentration was adjusted to 20 µg·mL−1 with distilled water. The degradation profiles in 0.1 N NaOH are illustrated in Figure 4b.
3.5.8.3 Oxidative degradation
For oxidative degradation, 10 mg of each drug was placed in 100 mL volumetric flasks, with 30 mL of 30% hydrogen peroxide added to each. The flasks were kept in the dark for 24 h and then filled to the mark with the diluent to achieve a concentration of 20 µg·mL−1. The solutions were analyzed by HPLC, with the results depicted in Figure 4c.
3.5.8.4 Photolytic and thermal degradation
To test photolytic degradation, PTX and SIM at a concentration of 20 µg·mL−1 were exposed to direct sunlight for 1 h. The results of this exposure are shown in Figure 4d. For thermal degradation, the drugs were refluxed in a water bath at 70°C for 2 h, and the final concentration was adjusted to 20 µg·mL−1. These samples were then analyzed by HPLC, with the results shown in Figure 4e.
Table 7 summarizes the findings from these stress tests, demonstrating that the method developed is specific to the APIs even in the presence of degradation products, with no interference detected.
Results of forced degradation studies of PTX and SIM in API form
| Forced degradation tests | Assay of PTX (%) | Peak purity (purity threshold = 990) | Assay of SIM (%) | Peak purity (purity threshold = 990) |
|---|---|---|---|---|
| Acid hydrolysis using 30 mL 0.1 N HCl for 1 h. | 97.04 | 999.44 | 98.24 | 999.88 |
| Basic hydrolysis using 30 mL 0.1 N NaOH for 1 h. | 98.01 | 999.27 | 97.12 | 999.53 |
| Oxidation using 30% H2O2 for 1 h. | 94.06 | 999.20 | 96.14 | 999.35 |
| Stress testing by heat at 70°C for 2 h | 96.68 | 999.30 | 97.24 | 999.48 |
| Stress testing using sunlight (photo degradation) for 1 h. | 96.24 | 999.70 | 97.44 | 999.46 |
4 Discussion
4.1 Methods of statistical analysis
This study determines statistical significance if the P-value is less than 0.05. There was a good fit with a polynomial equation (R > 0.8) and a reasonable estimate of the model’s predictive capacity based on the regression models’ R-squared and modified R-squared values. The data matches are correct, which indicates that the data are accurate. The model’s forecasting accuracy is crucial for subsequent estimations, as the high predicted R-squared values show.
4.2 Impacts of different factors on resolution
The model’s unquestionable usefulness is revealed by statistical analysis, as evidenced by the impressive model F-value of 7.33. For example, the P-values for the flow rate (A), acetonitrile ratio (B), and pH (C) are all less than 0.0500, indicating that these factors are essential and appropriate. The statistical data in Table S2 demonstrate that a probability of only 0.78% cannot account for the observed F-value. The model’s validity and the insight it provides into data are evident in these convincing results. As illustrated in our research, resolution response is strongly influenced by multiple parameters. Negative quadratic effect and positive linear impact were discernible. As you can see, adding more variables can result in a reduction in resolution. A variable’s optimal value is so crucial for enhancing retention time. The positive sign appearing before interaction phrases indicates that two variables behave similarly when they interact. Obtaining the best possible results requires careful analysis of the effects of variables on resolution response. Resolution is significantly affected by flow rate (A), acetonitrile ratio (B), and pH (C), as shown in Figure 5a–f. The relationships between these variables were studied using polynomial equations, contour plots, and 3D graphs. In addition, the acetonitrile ratio plays a vital role in resolution. Positive coefficients in regression equations indicate a positive relationship between the independent variable and the resolution response. It has been found that the resolution response is inversely correlated with the flow rate and favorably correlated with the acetonitrile-to-buffer pH ratio.
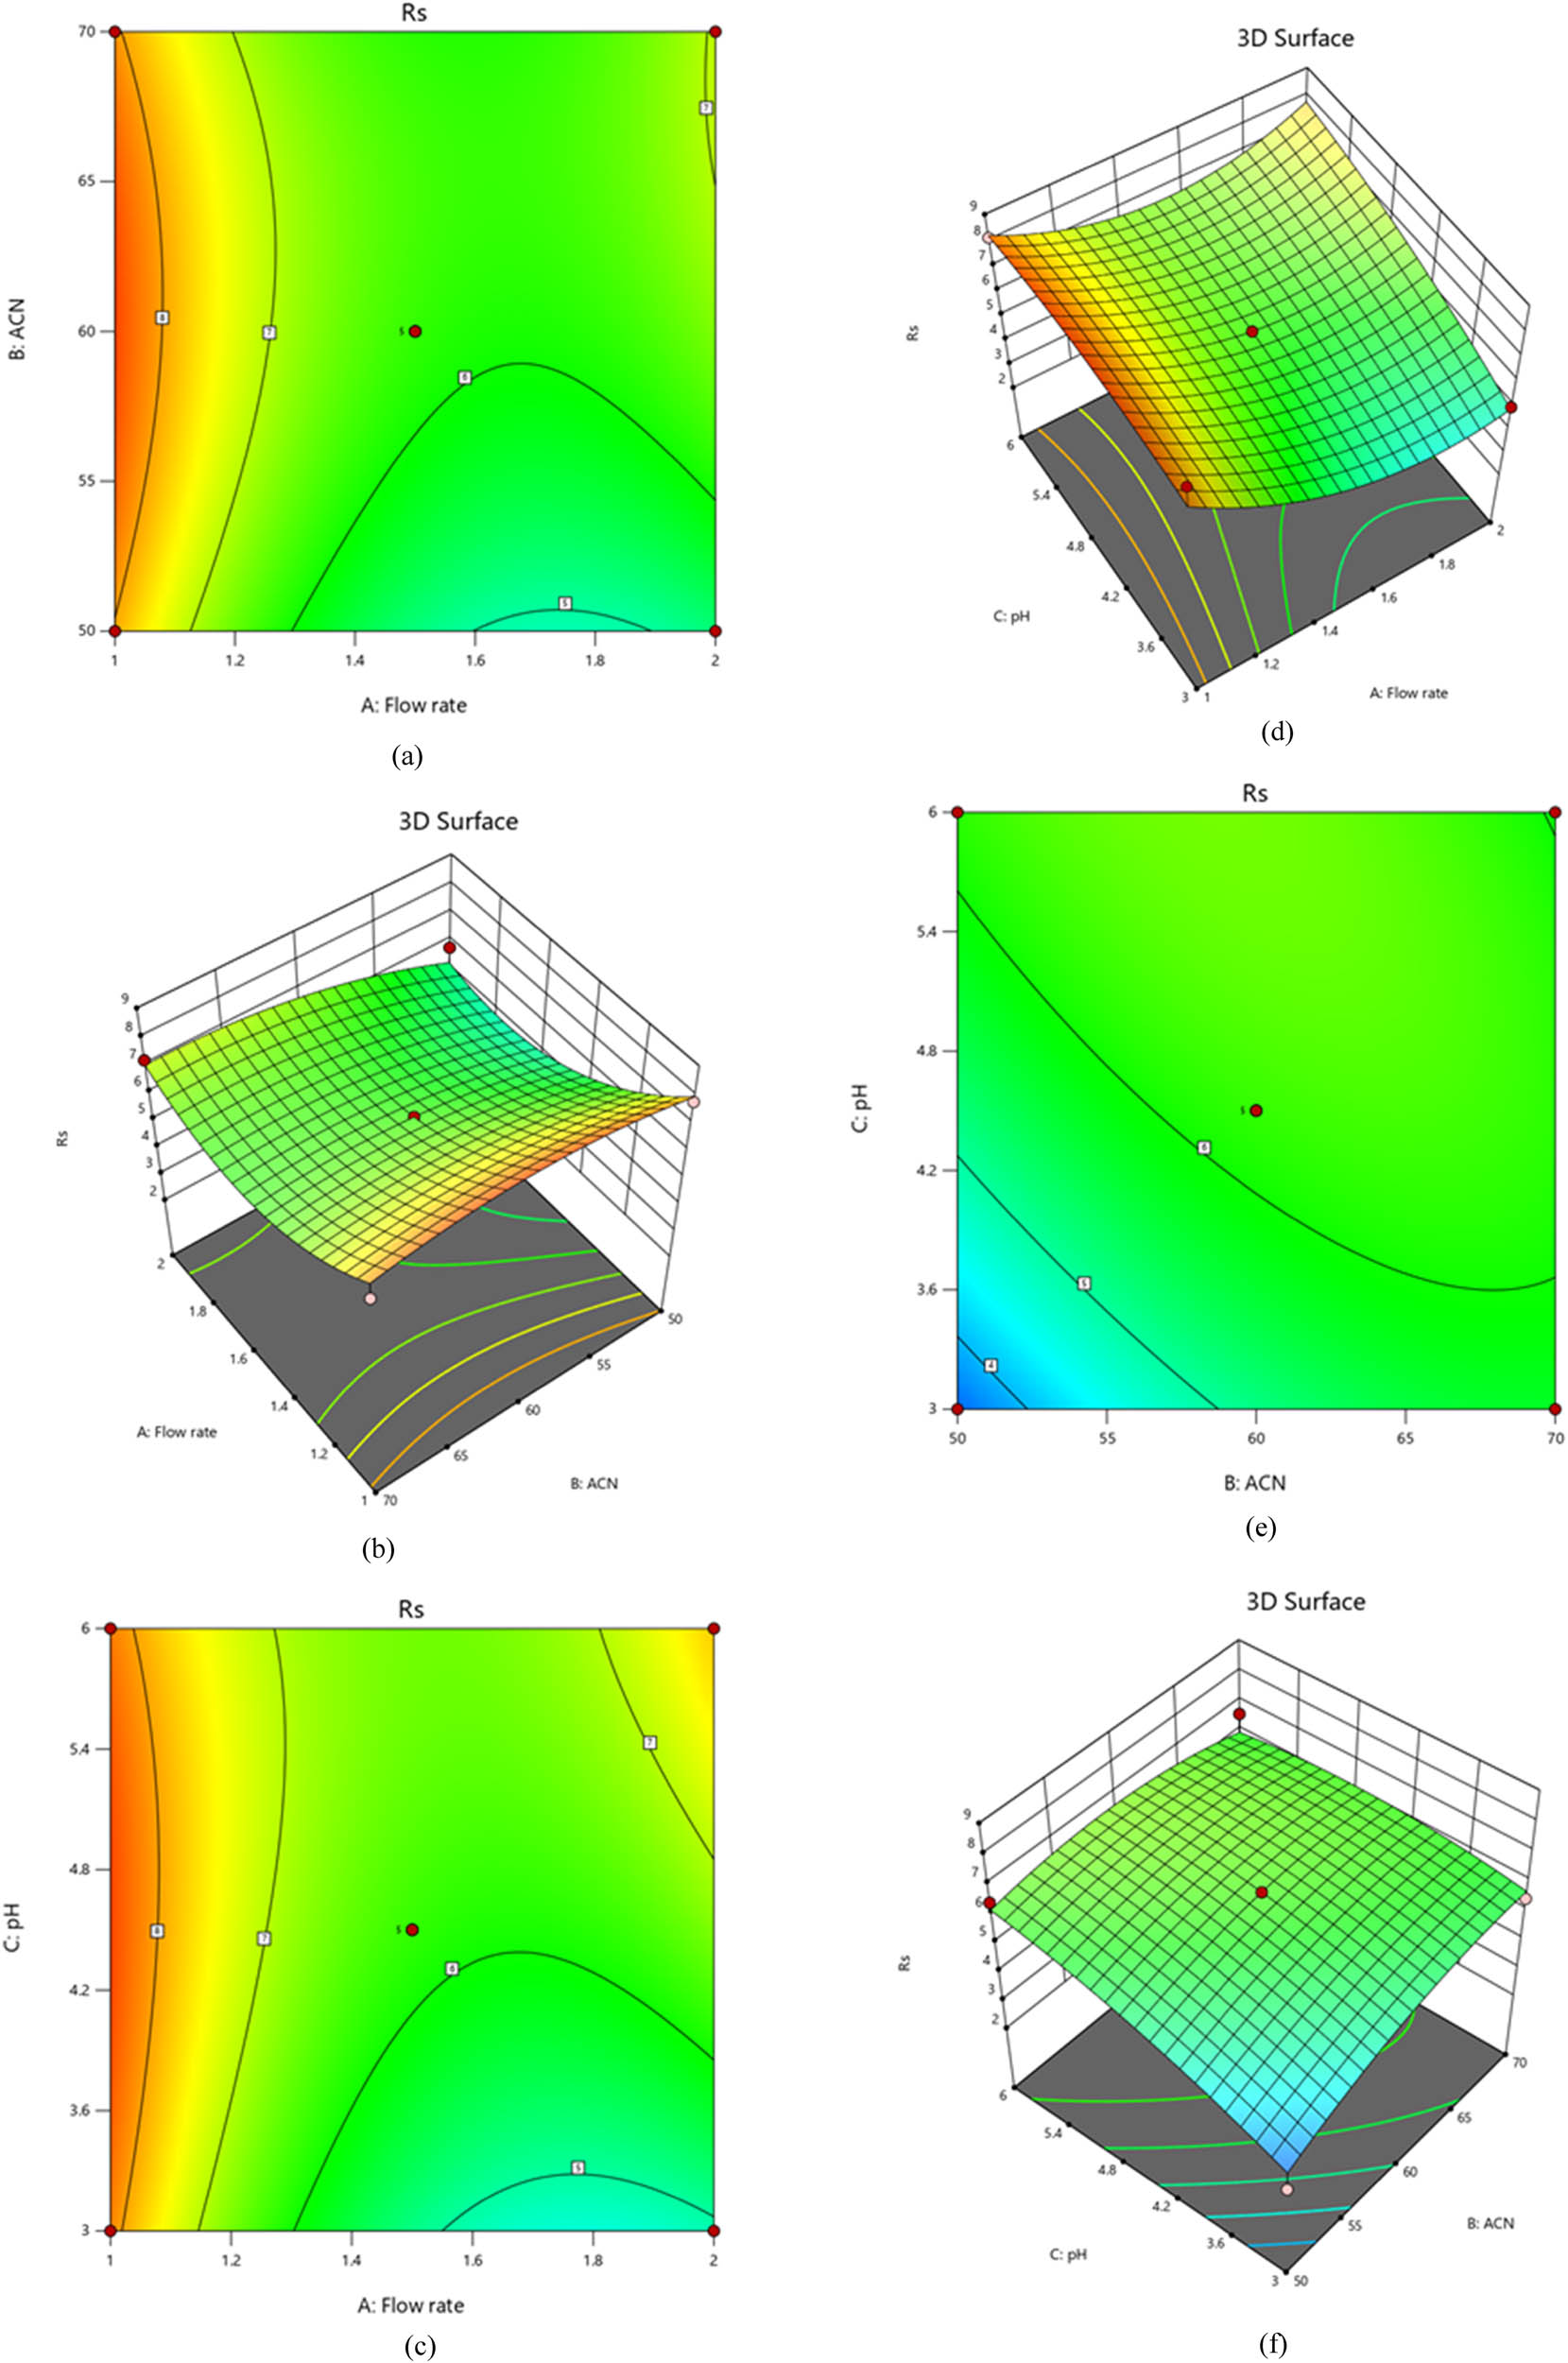
Plots of contours and 3D-response surfaces showing flow rate and acetonitrile ratio (a) and (b), flow rate and pH (c) and (d), and acetonitrile ratio and pH (e) and (f) effects on resolution.
Alternatively, resolution decreases as acetonitrile ratios and column temperatures increase. The development of analytical techniques can be done more cleverly than simply increasing resolution, according to chemists with experience. The advantage of this method is that it requires shorter run times for the chromatograms, which indicates a low waste of time and mobile phase. The analytical technique is designed with an intermediate acetonitrile ratio and low flow rate and provides maximum efficiency, little mobile phase waste, and short-term column maintenance. This method also shortens retention time [31]. After an investigation, it was shown that the flow rate (A) is the main factor affecting resolution. As the flow rate increases, the resolution decreases; however, the resolution increases as the flow rate decreases. Moreover, the acetonitrile ratio and pH are negatively related. Keeping acetonitrile ratios low and raising pH resulted in a decreased resolution response. A flow rate vs acetonitrile ratio interaction significantly modifies the resolution response. Our linear regression analysis found that the resolution is directly related to the acetonitrile ratio (B) and pH (C). We may now optimize our processes and attain superior outcomes by creating a second-order polynomial Eq. 2 to highlight this relationship between predictor factors and responses [32]
where the quadratic term is A 2 (flow rate2), B 2 (acetonitrile ratio2), and C 2 (pH2), and the variables’ interactions are represented by the following: R s (resolution response for drugs), A (flow rate), B (acetonitrile ratio), C (pH), AB (flow rate × acetonitrile ratio), AC (flow rate × pH), and BC (acetonitrile ratio × pH).
4.3 Impacts of different factors on PTX retention time
Statistical analysis reveals the model’s undeniable effectiveness, as demonstrated by the outstanding Model F-value of 16.27. The acetonitrile ratio (B), pH (C), and flow rate (A) P-values, for instance, are all less than 0.0500, suggesting that these parameters are relevant and necessary. The statistical data of Table S3 show that a probability of just 0.07% cannot explain the observed F-value. These compelling results demonstrate the validity of the model and the insight it offers into the data. Our research shows that PTX retention time response highly depends on several aspects. There was a noticeable negative linear impact and quadratic effect. We observe that PTX retention time may decrease as more variables are added. The ideal value of a variable is significant for increasing retention time. When two variables interact, they behave similarly, as indicated by the positive sign before the interaction phrases. Careful examination of the effects of variables on resolution response is necessary to achieve the best possible results. Figure 6 illustrates how flow rate (A), acetonitrile ratio (B), and pH (C) all have a significant impact on retention time.
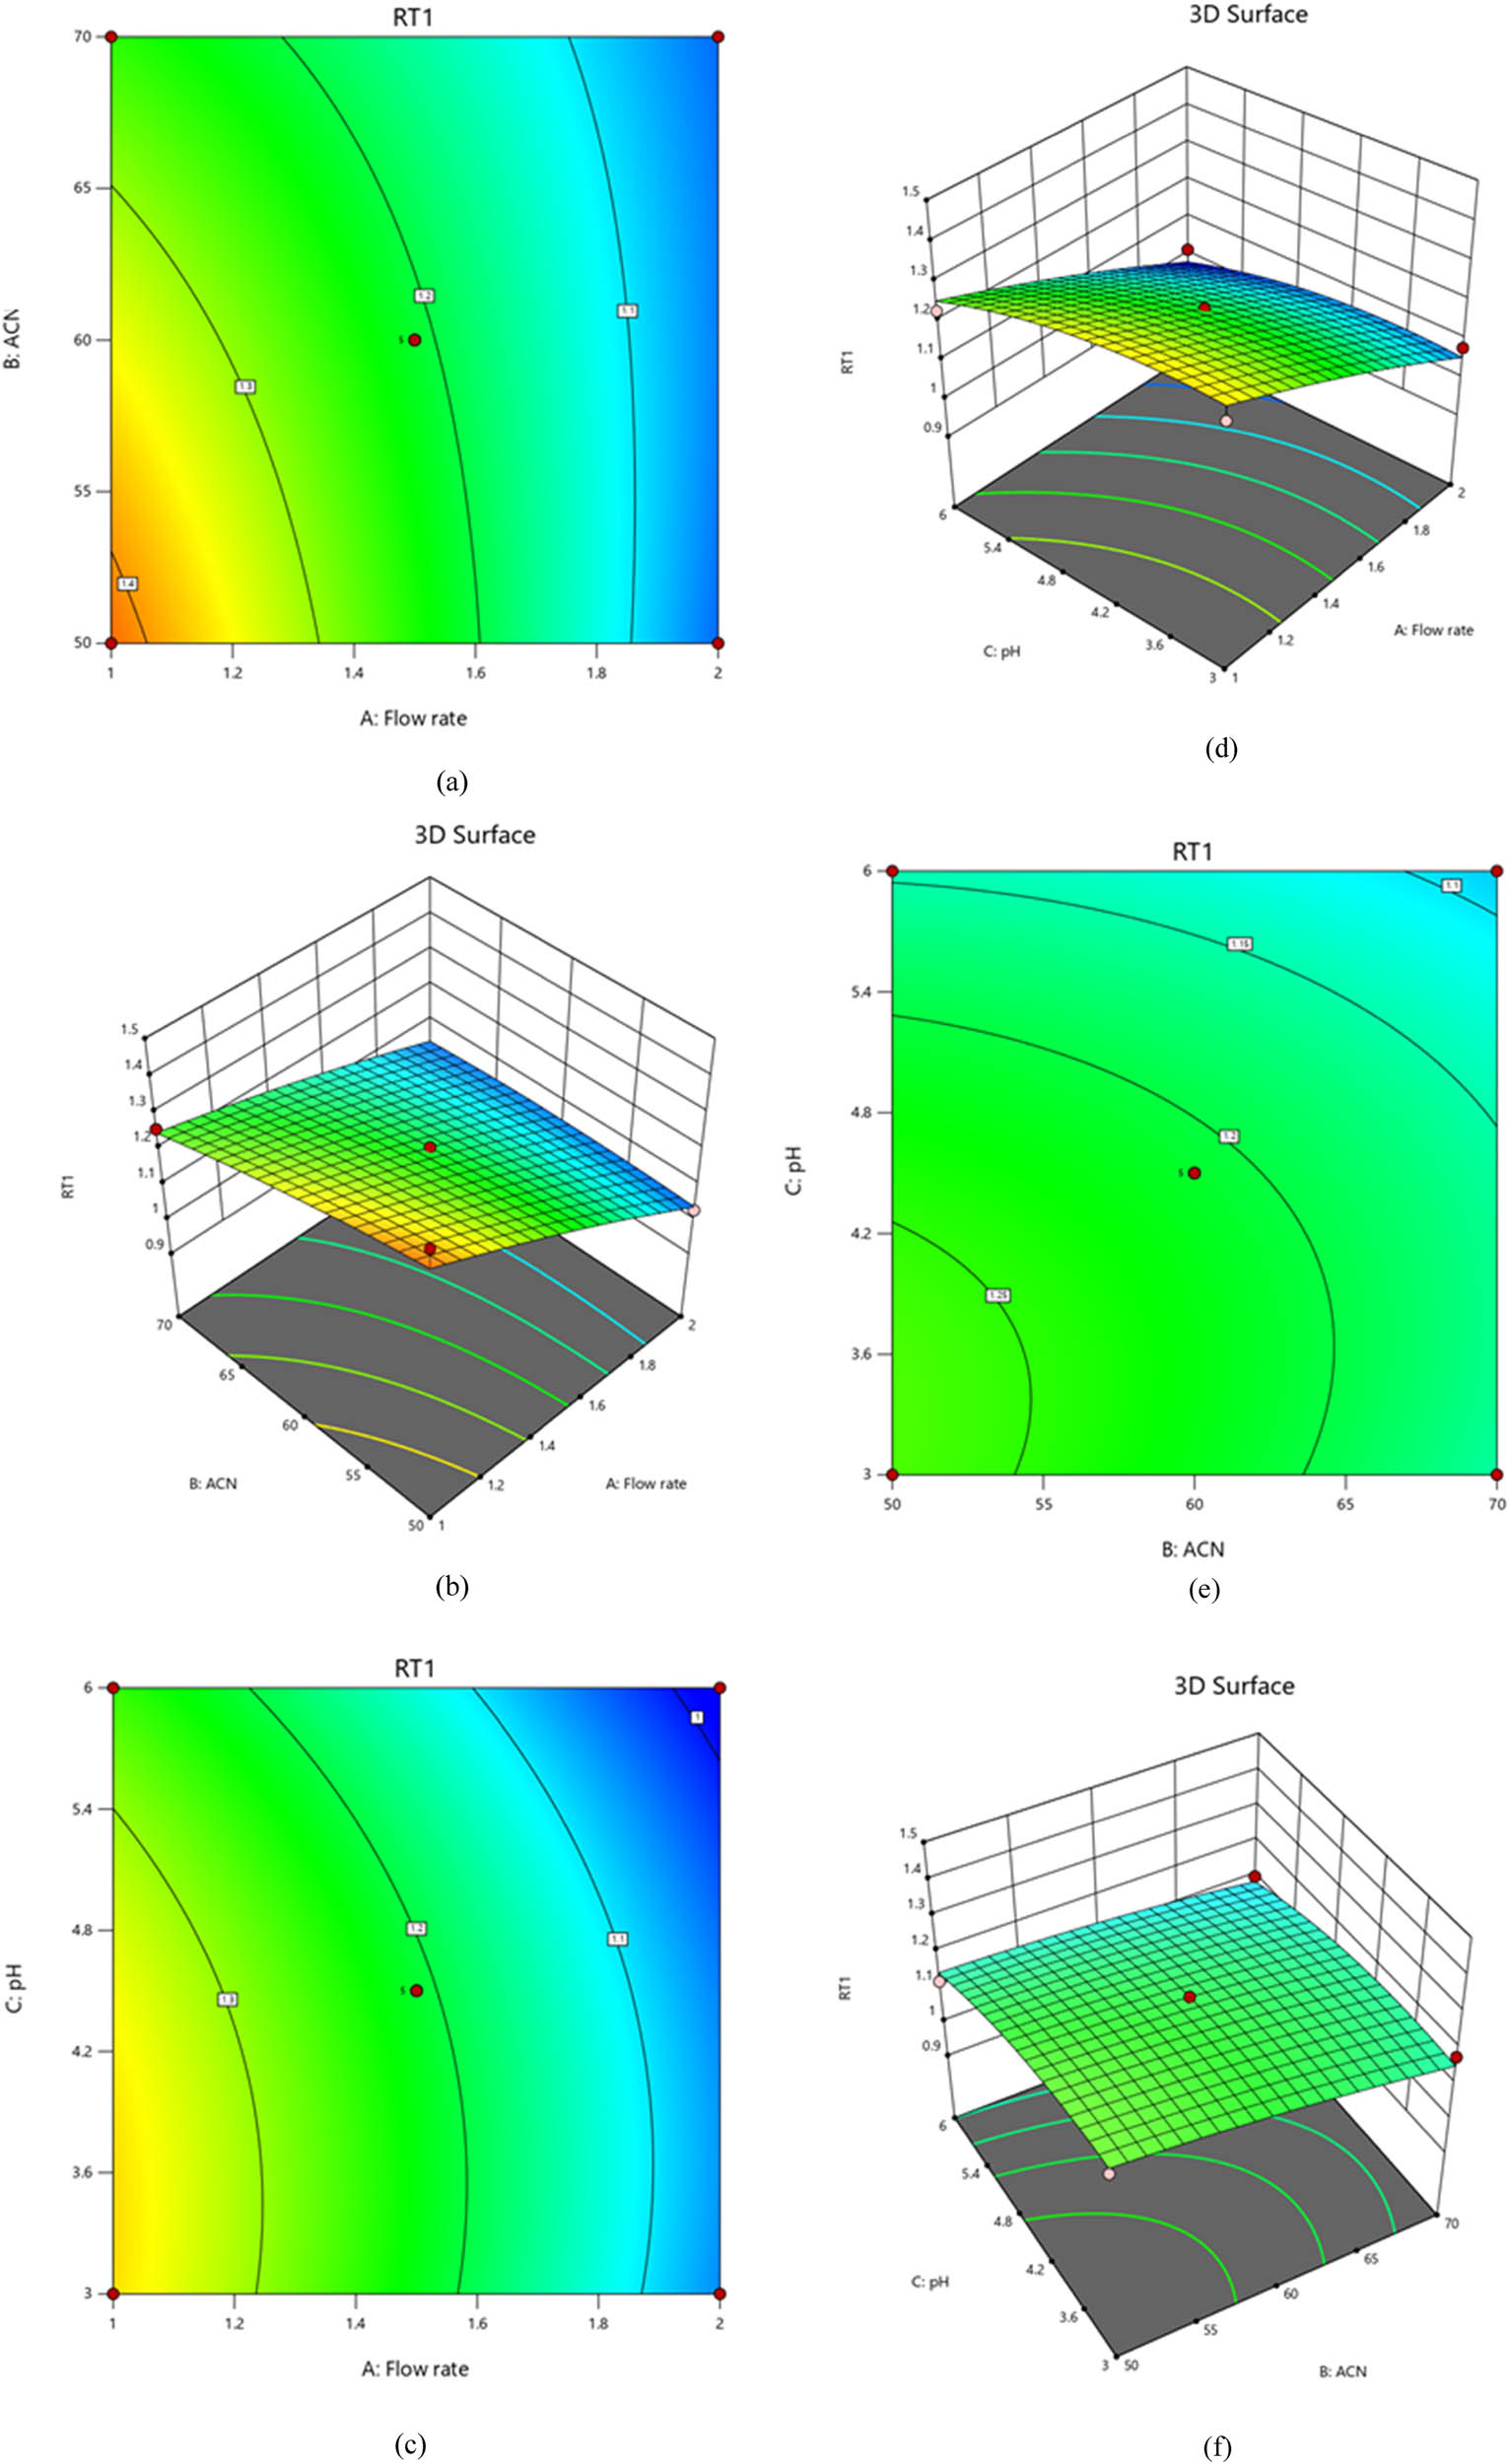
Plots of contours and 3D-response surfaces showing flow rate and acetonitrile ratio (a) and (b), flow rate and pH (c) and (d), and acetonitrile ratio and pH (e) and (f) effects on PTX retention time.
A regression equation and quadratic effect indicate that the retention time response of PTX is inversely related to the variables of flow rate (A), acetonitrile ratio (B), and pH (C). The PTX retention time response decreases when the variables of flow rate (A), acetonitrile ratio (B), and pH (C) increase. As a result of Eq. 3, an independent variable with a negative sign significantly impacts the resolution. The contour and 3D-response surface plots (Figure 6a–f) show that the two variables interact favorably with favorable interaction terms.
4.4 Impacts of different factors on SIM retention time
Based on the statistical study, the model’s indisputable efficacy is demonstrated by its remarkable model F-value of 6.28. For instance, the P-values for the acetonitrile ratio (B), pH (C), and flow rate (A) are all less than 0.0500, suggesting that these variables are significant and pertinent. Based on the statistical data presented in Table S4, it is evident that a probability of even 0.02% cannot account for the observed F-value. These remarkable results demonstrate the usefulness of the model and the insightful understanding it offers of the data, as displayed in Eq. 4. The flow rate’s negative linear influence and positive quadratic effect on the SIM retention time response indicate that the SIM retention time response decreases when pH increases from a low to a high level. The positive sign before the interacting terms denotes that both components behave favorably in the same manner, i.e., by lowering the buffer’s pH while maintaining a low percentage of acetonitrile to increase response. This term interaction also suggests another noteworthy effect. Furthermore, the negative result demonstrates the antagonistic behavior of the two predictor variables, i.e., lowering the flow rate while increasing the pH of the buffer decreases the response, as shown in Figure 7a–f
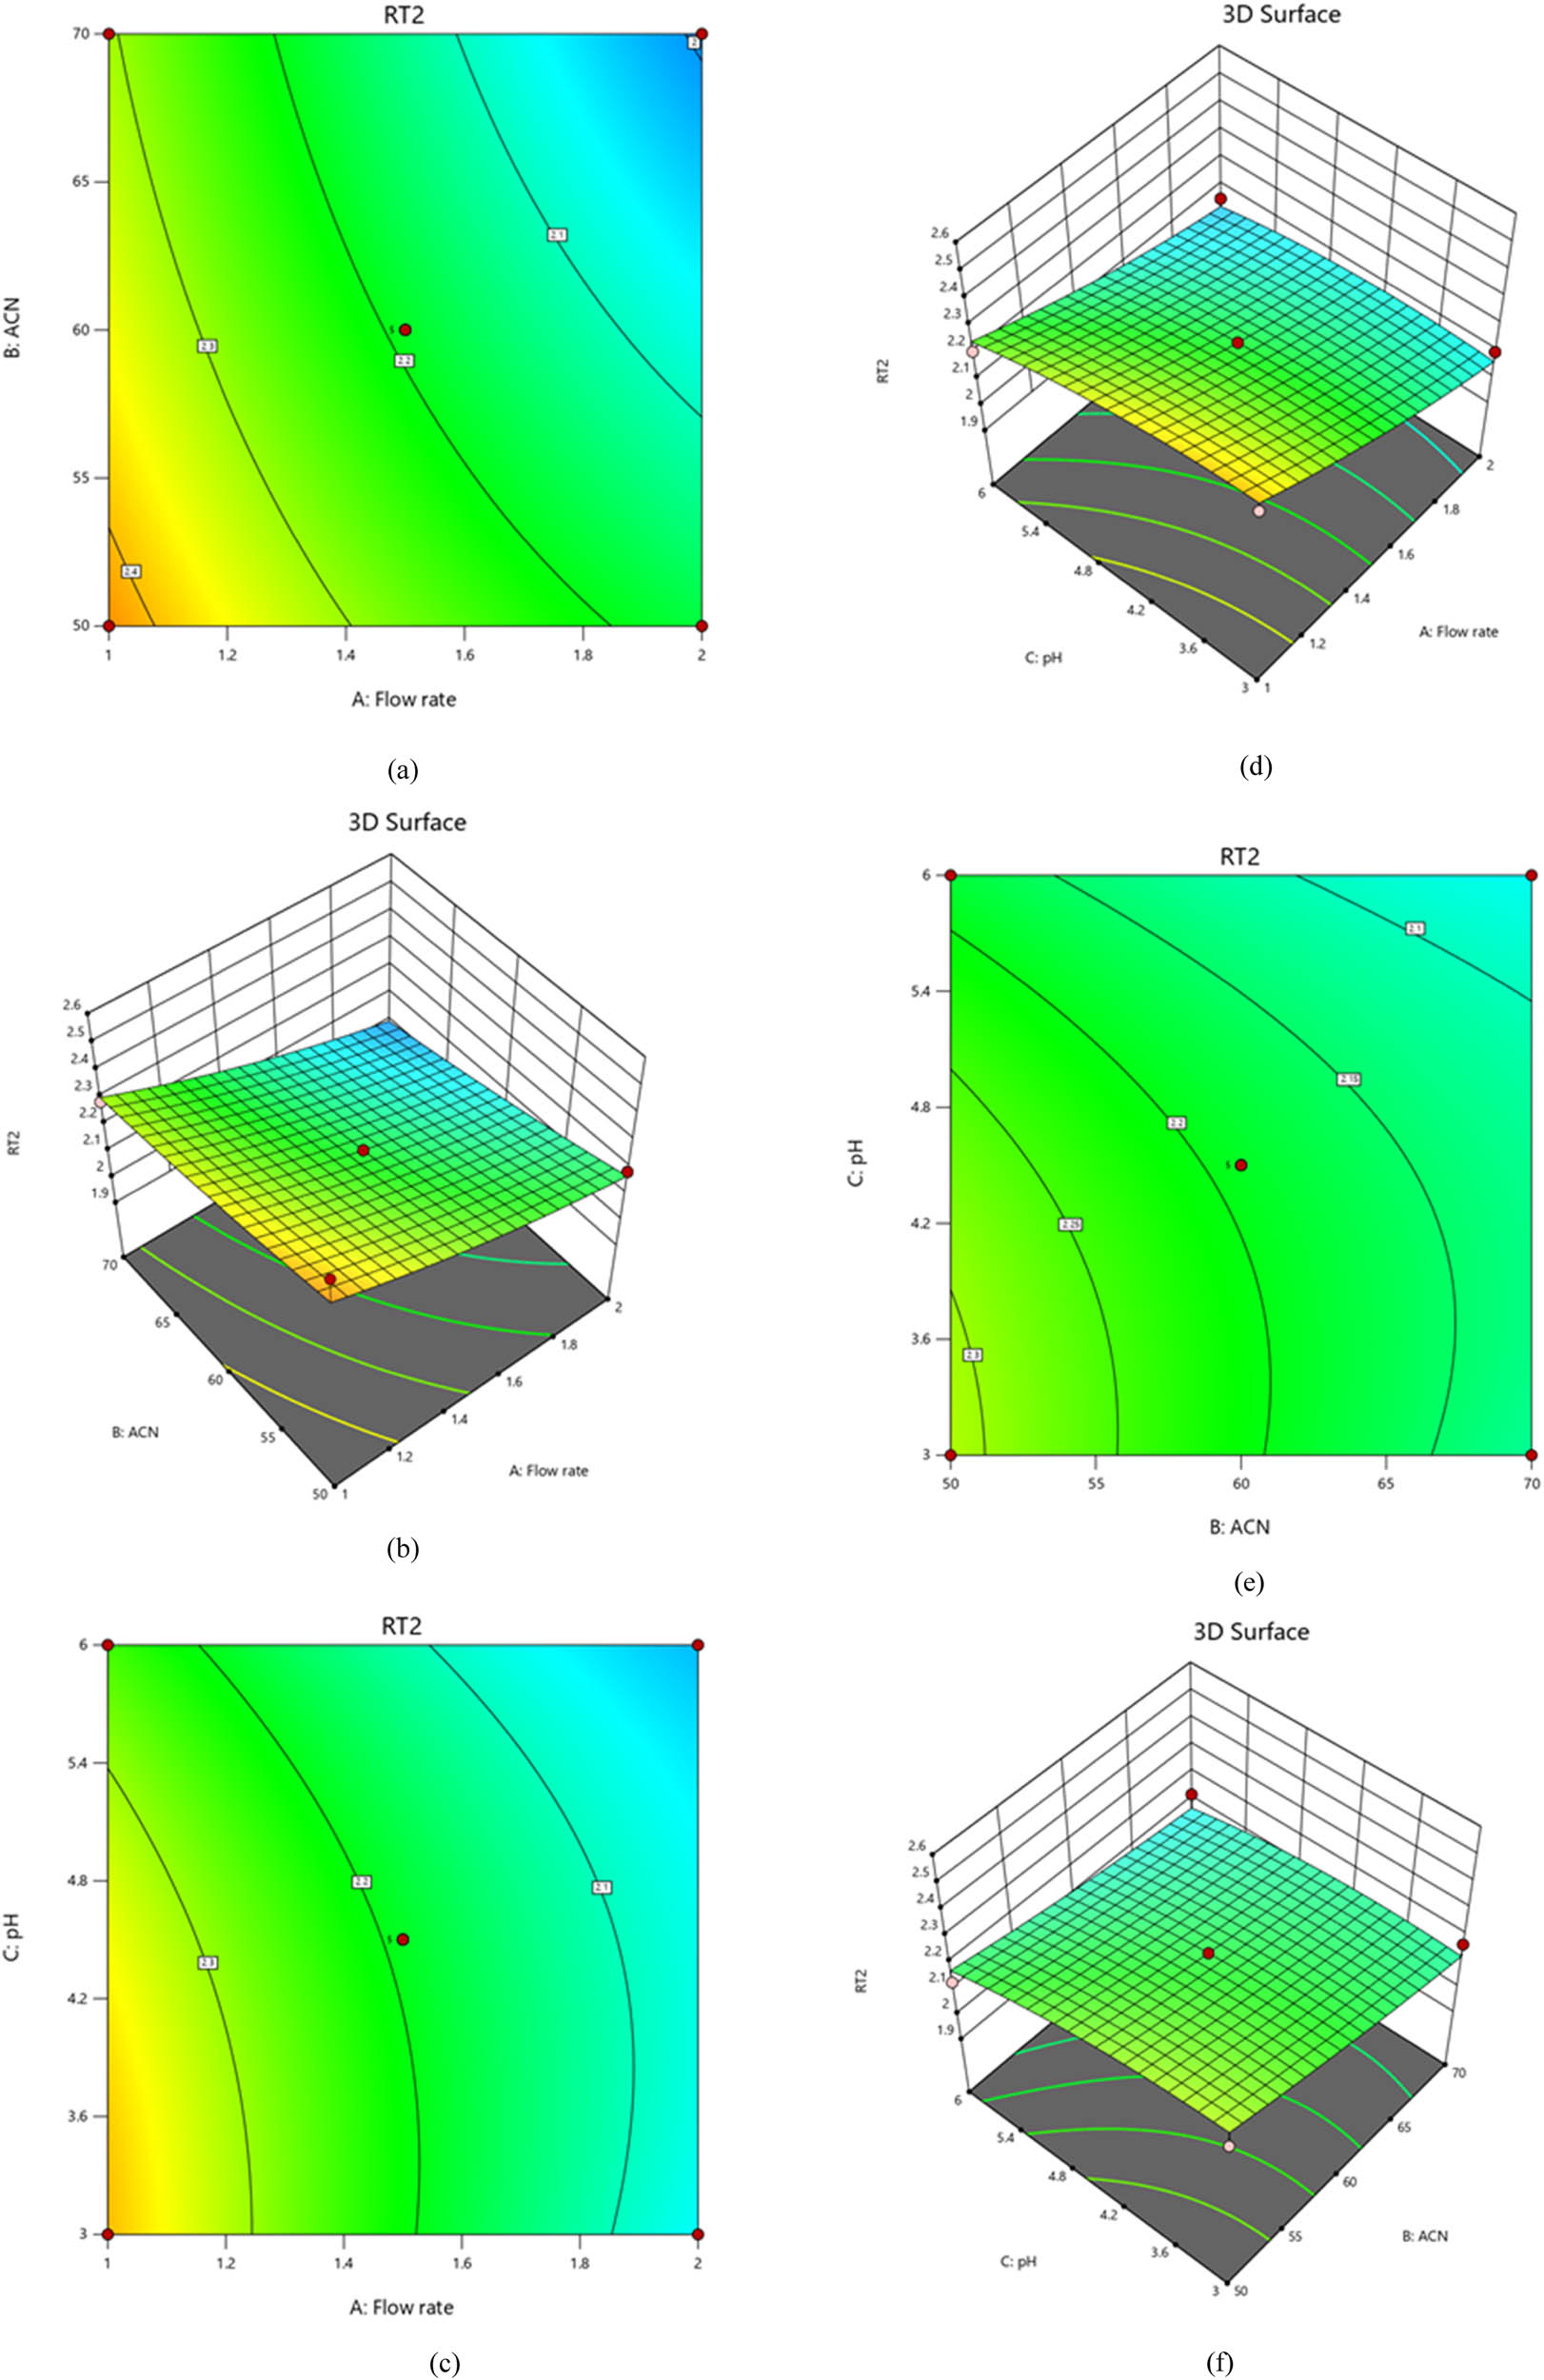
Plots of contours and 3D-response surfaces showing flow rate and acetonitrile ratio (a) and (b), flow rate and pH (c) and (d), and acetonitrile ratio and pH (e) and (f) effects on SIM retention time.
4.5 The integrated characteristics of desirability
Supplementary Figure S6a–f shows overlay plots that accurately predict the ideal separation criterion. After optimizing the system’s appeal, the tailing factor was low, the theoretical plate was significant, and the retention times were less than 3 min. Once the critical factors were identified, we tested a variety of parameter variations in the lab. A 60/40 mixture of acetonitrile and water is used with a 1.0 mL·min−1 flow rate in the optimal chromatographic method illustrated in Figure 8b. This results from this method’s asymmetric peak, short retention time, and high resolution.
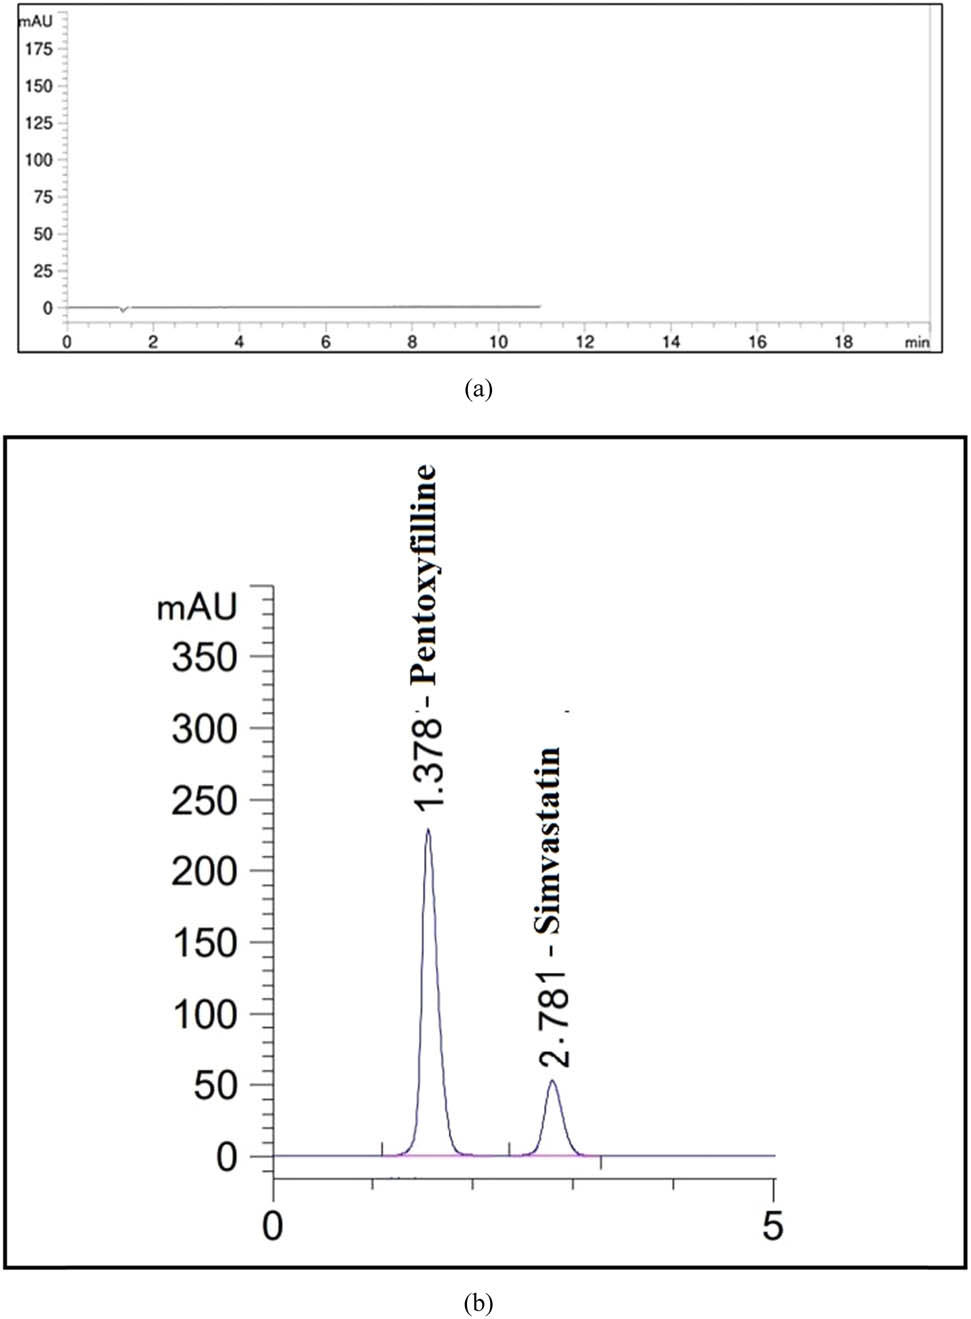
HPLC chromatograms for (a) blank and (b) standard solutions of PTX and SIM.
4.6 Appraisal of GAC and WAC
GAC consists of 12 principles that have been converted into scores that assess how eco-friendly analytical techniques are. This section explains how GAC principles can be converted to scores. The BAGI procedure improves established environmental measurements by integrating concepts of analytical chemistry. BAGI assesses an analytical method using ten pivotal criteria: efficacy, automation, sample preparation, numbers, reagents, materials, hourly sample analysis capacity, concurrent analysis of analytes, apparatus requirements, and concurrent sample treatment. Based on this data, BAGI utilizes pictograms and scores to highlight possible enhancements. As shown in Supplementary File 2, each principle is restored graphically.
5 Conclusion
This study used four greenness appraisal tools and two whiteness appraisal tools to assess the sustainability of newly validated chromatographic techniques, including AGREE, AGREEprep, GAPI, ComplexGAPI, BAGI, and RGB12 algorithms. The developed RP-HPLC method offers a sustainable and efficient solution for the simultaneous analysis of PTX and SIM, two anticancer drugs. By minimizing environmental impact and reducing costs, this technique is well-suited for the pharmaceutical industry. The method’s validation according to ICH guidelines ensures its reliability, while its optimized chromatographic conditions and single-sample preparation enhance efficiency. Overall, this RP-HPLC approach provides a valuable tool for drug development and quality control.
6 Future research directions
6.1 Exploration of other drug combinations
The developed method can be extended to analyze other drug combinations, particularly those with similar physicochemical properties to PTX and SIM. This would broaden the applicability of the method in the pharmaceutical industry.
6.2 Optimization for different analytical scenarios
The method could be further optimized for various analytical scenarios, such as high-throughput analysis or low-sample volume analysis. This would enhance its versatility and accommodate diverse analytical needs.
6.3 Investigation of alternative greenness and whiteness appraisal tools
The performance of the method could be evaluated using additional greenness and whiteness appraisal tools to provide a more comprehensive assessment of its sustainability. This would contribute to a deeper understanding of the method’s environmental impact and potential for improvement.
6.4 Development of GSP techniques
Exploring GSP techniques, such as solid-phase microextraction or liquid–liquid microextraction, could further reduce the environmental footprint of the method. This would align with the growing emphasis on sustainable analytical chemistry.
6.5 Application in real-world samples
The method could be applied to real-world samples, such as pharmaceutical formulations or biological fluids, to evaluate its performance in practical settings. This would provide valuable insights into its robustness and reliability under real-world conditions.
By pursuing these future research directions, the potential of the developed RP-HPLC method can be fully realized, contributing to more sustainable and efficient drug analysis practices in the pharmaceutical industry.
Acknowledgements
The authors acknowledge Princess Nourah bint Abdulrahman University Researchers Supporting Project number (PNURSP2024R227), Princess Nourah bint Abdulrahman University, Riyadh, Saudi Arabia. The authors would like to thank the Deanship of Scientific Research at Shaqra University for supporting this work. The authors are thankful to the Deanship of Graduate Studies and Scientific Research at the University of Bisha for supporting this work through the Fast-Track Research Support Program.
-
Funding information: The research was funded by Princess Nourah bint Abdulrahman University Researchers Supporting Project number (PNURSP2024R227), Princess Nourah bint Abdulrahman University, Riyadh, Saudi Arabia.
-
Author contributions: Samar M. Mahgoub: methodology, writing – review & editing, investigation, conceptualization; Maha A. Alwaili: data curation, software, visualization, writing – review & editing (equal); Hassan A. Rudayni: validation, investigation (equal), software, writing – review & editing (equal); Ahmed A. Allam: resources, writing – review & editing (equal), software (equal), data curation (equal), conceptualization (equal); Mustafa Ahmed Abdel-Reheim: software(equal), conceptualization (equal), writing – review & editing (equal), data curation (equal); Manal A. Almalki: visualization, writing – review & editing (equal), investigation (equal); Osama A. Mohammed: data curation (equal), conceptualization (equal), writing – review & editing (equal); Mahmoud A. Mohamed: project administration, writing – original draft, software(equal), investigation (equal), conceptualization (equal).
-
Conflict of interest: The authors state no conflict of interest.
-
Data availability statement: The datasets generated during and/or analyzed during the current study are available from the corresponding author on reasonable request.
References
[1] Prajapati P, Pulusu VS, Shah S. Red, green, and blue model-based assessment and principles of white analytical chemistry to robust stability-indicating chromatographic estimation of thiocolchicoside and diclofenac sodium. J AOAC Int. 2023;106(5):1374–88. 10.1093/jaoacint/qsad052.Search in Google Scholar PubMed
[2] Nassef HM, Ahmed HA, El-Atawy MA, Alanazi TYA, Mohamed MA. Greens assessment of RP-UPLC method for estimating Triamcinolone Acetonide and its degraded products compared to Box–Behnken and Six Sigma designs. Green Chem Lett Rev. 2024;17(1):2301315. 10.1080/17518253.2023.2301315.Search in Google Scholar
[3] Morgan EM, Lotfy HM, Obaydo RH, Fayez YM, Abdelkawy M, Boltia SA. Whiteness and greenness assessment with efficacy evaluation of two UPLC systems applied for the quantification of cinnarizine and dimenhydrinate along with their toxic impurities. Sustain Chem Pharm. 2023;36:101225. 10.1016/j.scp.2023.101225.Search in Google Scholar
[4] Shehata N, Rawan AF, Ahmed HA, Alhaddad OA, Amin MS, Nafee SS, et al. Adsorption separation of oxytetracycline hydrochloride using natural and nanostructured clay mineral of silica in synthetic solution: Integration to white and green chemistry metrics. Sustain Chem Pharm. 2024;39:101574. 10.1016/j.scp.2024.101574.Search in Google Scholar
[5] Rostom Y, Rezk MR, Wadie M, Abdel-Moety EM, Marzouk HM. State-of-the-art mathematically induced filtration approaches for smart spectrophotometric assessment of silodosin and solifenacin mixture in their new challenging formulation: Multi-tool greenness and whiteness evaluation. Spectrochim Acta A: Mol Biomol. 2024;307:123650. 10.1016/j.saa.2023.123650.Search in Google Scholar PubMed
[6] Youssef YM, Mahrouse MA, Mostafa EA. Assessment of environmental impact of a novel stability-indicating RP-HPLC method and reported methods for the determination of selexipag in bulk and dosage form: A comparative study using different greenness assessment tools. Microchem J. 2023;185:108256. 10.1016/j.microc.2022.108256.Search in Google Scholar
[7] Ibrahim AE, Elmansi H, Belal F. Solvent-free mixed micellar mobile phases: An advanced green chemistry approach for reversed-phase HPLC determination of some antihypertensive drugs. J Sep Sci. 2020;43:3224–32. 10.1002/jssc.202000429.Search in Google Scholar PubMed
[8] Marzouk HM, Gouda AS, Rezk MR, Abdel-Megied AM. A validated LC-MS/MS method for determination of Molnupiravir and Favipiravir in human plasma; Assessment of the remarkable potential synergistic effect against SARS-CoV-2 Infection: Application to a pharmacokinetic study in healthy Egyptian volunteers. Microchem J. 2024;197:109815. 10.1016/j.microc.2023.109815.Search in Google Scholar
[9] Nassef H, Ahmed H, Bashal A, El-Atawy M, Alanazi T, Mahgoub S, et al. A novel Six Sigma approach and eco-friendly RP-HPLC technique for determination of pimavanserin and its degraded products: Application of Box–Behnken design. Rev Anal Chem. 2024;43(1):20230073. 10.1515/revac-2023-0073.Search in Google Scholar
[10] Tilija Pun N, Jeong CH. Statin as a potential chemotherapeutic agent: current updates as a monotherapy, combination therapy, and treatment for anti-cancer drug resistance. Pharmaceuticals. 2021;14(5):470. 10.3390/ph14050470.Search in Google Scholar PubMed PubMed Central
[11] Golunski G, Woziwodzka A, Piosik J. Potential use of pentoxifylline in cancer therapy. Curr Pharm Biotechnol. 2018;19(3):206–16. 10.2174/1389201019666180528084641.Search in Google Scholar PubMed
[12] Castellanos-Esparza YC, Wu S, Huang L, Buquet C, Shen R, Sanchez-Gonzalez B, et al. Synergistic promoting effects of pentoxifylline and simvastatin on the apoptosis of triple-negative MDA-MB-231 breast cancer cells. Int J Oncol. 2018;52:1246–54. 10.3892/ijo.2018.4272.Search in Google Scholar PubMed
[13] Chmielewska A, Konieczna L, Plenis A, Lamparczyk H. Quantitative determination of pentoxifylline in human plasma. Acta Chromatogr. 2006;16:70–9.Search in Google Scholar
[14] Lahsini R, Monser L. Optimization and validation of a new HPLC method using monolithic column for simultaneous determination of pentoxifylline and related compounds. Pharm Chem J. 2012;46:127–31. 10.1007/s11094-012-0746-8.Search in Google Scholar
[15] Korany MA, Haggag RS, Ragab MA, Elmallah OA. A validated stability indicating DAD–HPLC method for determination of pentoxifylline in presence of its pharmacopeial related substances. Bull Fac Pharmacy, Cairo Univ. 2013;51(2):211–9. 10.1016/j.bfopcu.2013.06.001.Search in Google Scholar
[16] Thallaj N. HPLC method validation for determination of pentoxifylline in pharmaceutical dosage forms. Indian J Adv Chem. 2022;2(1):5–9. 10.1007/s11094-012-0746-8.Search in Google Scholar
[17] Alhazmi HA, Alnami AM, Arishi MAA, Alameer RK, Al Bratty M, Rehman ZU, et al. A fast and validated reversed-phase HPLC method for simultaneous determination of simvastatin, atorvastatin, telmisartan and irbesartan in bulk drugs and tablet formulations. Sci Pharm. 2017;86(1):1. 10.3390/scipharm86010001.Search in Google Scholar PubMed PubMed Central
[18] Nováková L, Šatínský D, Solich P. HPLC methods for the determination of simvastatin and atorvastatin. TrAC Trends Anal Chem. 2008;27(4):352–67. 10.1016/j.trac.2008.01.013.Search in Google Scholar
[19] Pasha MK, Muzeeb S, Basha SJ, Shashikumar D, Mullangi R, Srinivas NR. Analysis of five HMG‐CoA reductase inhibitors—atorvastatin, lovastatin, pravastatin, rosuvastatin and simvastatin: pharmacological, pharmacokinetic and analytical overview and development of a new method for use in pharmaceutical formulations analysis and in vitro metabolism studies. Biomed Chromatogr. 2006;20(3):282–93. 10.1002/bmc.561.Search in Google Scholar PubMed
[20] Mahgoub SM, Mahmoud MR, Binsaleh AY, Almalki MA, Mohamed MA, Nassar HF. Analytical assessment of a novel RP-HPLC method for the concurrent quantification of selected pharmaceutical drugs levodopa and carbidopa using eight greenness metrics comparing to the lean six sigma approach. Sustainable Chem Pharm. 2023;36:101291. 10.1016/j.scp.2023.101291.Search in Google Scholar
[21] Pena-Pereira F, Tobiszewski M, Wojnowski W, Psillakis E. A Tutorial on AGREEprep an Analytical Greenness Metric for Sample Preparation. Adv Sample Prep. 2022;3:100025. 10.1016/j.sampre.2022.100025.Search in Google Scholar
[22] Płotka-Wasylka J. A new tool for the evaluation of the analytical procedure: Green Analytical Procedure Index. Talanta. 2018;181:204–9. 10.1016/j.talanta.2018.01.013.Search in Google Scholar PubMed
[23] Ahmed HA, El-Atawy MA, Nassef HM, Amin MS, Jaremko M, Emwas AH, et al. Eco-friendly chromatographic techniques for appraisal of amlodipine, hydrochlorothiazide, telmisartan, and their related substances in dosage form: Application to six sigma and content uniformity approaches. Sustainable Chem Pharm. 2024;38:101469. 10.1016/j.scp.2024.101469.Search in Google Scholar
[24] Manousi N, Wojnowski W, Płotka-Wasylka J, Samanidou V. Blue applicability grade index (BAGI) and software: a new tool for the evaluation of method practicality. Green Chem. 2023;25(19):7598–604. 10.1039/D3GC02347H.Search in Google Scholar
[25] Nowak PM, Wietecha-Posłuszny R, Pawliszyn J. White Analytical Chemistry: An approach to reconcile the principles of Green Analytical Chemistry and functionality. TrAC Trends Anal Chem. 2021;138:116223. 10.1016/j.trac.2021.116223.Search in Google Scholar
[26] Al-Kadhi NS, Mohamed MA, Ahmed HA, Nassar HF. Facile synthesis and eco-friendly analytical methods for concurrent estimation of selected pharmaceutical drugs in their solutions: application to quality by design, lean six sigma, and stability studies. BMC Chem. 2023 10;17(1):136. 10.1186/s13065-023-01028-8.Search in Google Scholar PubMed PubMed Central
[27] Shah J, Kotadiya R, Patel R. Analytical quality by design-based robust RP-HPLC method for quantitative estimation of pregabalin and etoricoxib in fixed-dose combination tablet formulation. J AOAC Int. 2022;105(6):1536–47. 10.1093/jaoacint/qsac082.Search in Google Scholar PubMed
[28] Patel RB, Patel N, Patel MR. Design of experiment centered multivariate optimization strategy for RP-HPLC method to quantitate retapamulin in topical cream and microemulsion. Pharm Sci. 2020;27(2):219–29. 10.34172/PS.2020.85.Search in Google Scholar
[29] Alanazi TYA, Adel Pashameah R, Binsaleh AY, Mohamed MA, Ahmed HA, Nassar HF. Condition optimization of eco-friendly RP-HPLC and MCR methods via Box–Behnken design and six sigma approach for detecting antibiotic residues. Sci Rep. 2023;13:15729. 10.1038/s41598-023-40010-1.Search in Google Scholar PubMed PubMed Central
[30] ICH Harmonized Tripartite Guideline. current step. 2005;4:1–17.Search in Google Scholar
[31] Hassouna MEM, Mohamed MA. Optimization and modelling of novel RP-UPLC method for simultaneous determination of cefradine, cefalexin, sodium benzoate and methylparaben in some biological fluids. application to experimental design. Egypt J Chem. 2022;65(9):673–86. 10.21608/EJCHEM.2022.111666.5085.Search in Google Scholar
[32] Buenaño L, Ali E, Jafer A, Zaki SH, Hammady FJ, Khayoun Alsaadi SB, et al. Optimization by Box–Behnken design for environmental contaminants removal using magnetic nanocomposite. Sci Rep. 2024;14(1):6950. 10.1038/s41598-024-57616-8.Search in Google Scholar PubMed PubMed Central
© 2024 the author(s), published by De Gruyter
This work is licensed under the Creative Commons Attribution 4.0 International License.
Articles in the same Issue
- Research Articles
- Green polymer electrolyte and activated charcoal-based supercapacitor for energy harvesting application: Electrochemical characteristics
- Research on the adsorption of Co2+ ions using halloysite clay and the ability to recover them by electrodeposition method
- Simultaneous estimation of ibuprofen, caffeine, and paracetamol in commercial products using a green reverse-phase HPTLC method
- Isolation, screening and optimization of alkaliphilic cellulolytic fungi for production of cellulase
- Functionalized gold nanoparticles coated with bacterial alginate and their antibacterial and anticancer activities
- Comparative analysis of bio-based amino acid surfactants obtained via Diels–Alder reaction of cyclic anhydrides
- Biosynthesis of silver nanoparticles on yellow phosphorus slag and its application in organic coatings
- Exploring antioxidant potential and phenolic compound extraction from Vitis vinifera L. using ultrasound-assisted extraction
- Manganese and copper-coated nickel oxide nanoparticles synthesized from Carica papaya leaf extract induce antimicrobial activity and breast cancer cell death by triggering mitochondrial caspases and p53
- Insight into heating method and Mozafari method as green processing techniques for the synthesis of micro- and nano-drug carriers
- Silicotungstic acid supported on Bi-based MOF-derived metal oxide for photodegradation of organic dyes
- Synthesis and characterization of capsaicin nanoparticles: An attempt to enhance its bioavailability and pharmacological actions
- Synthesis of Lawsonia inermis-encased silver–copper bimetallic nanoparticles with antioxidant, antibacterial, and cytotoxic activity
- Facile, polyherbal drug-mediated green synthesis of CuO nanoparticles and their potent biological applications
- Zinc oxide-manganese oxide/carboxymethyl cellulose-folic acid-sesamol hybrid nanomaterials: A molecularly targeted strategy for advanced triple-negative breast cancer therapy
- Exploring the antimicrobial potential of biogenically synthesized graphene oxide nanoparticles against targeted bacterial and fungal pathogens
- Biofabrication of silver nanoparticles using Uncaria tomentosa L.: Insight into characterization, antibacterial activities combined with antibiotics, and effect on Triticum aestivum germination
- Membrane distillation of synthetic urine for use in space structural habitat systems
- Investigation on mechanical properties of the green synthesis bamboo fiber/eggshell/coconut shell powder-based hybrid biocomposites under NaOH conditions
- Green synthesis of magnesium oxide nanoparticles using endophytic fungal strain to improve the growth, metabolic activities, yield traits, and phenolic compounds content of Nigella sativa L.
- Estimation of greenhouse gas emissions from rice and annual upland crops in Red River Delta of Vietnam using the denitrification–decomposition model
- Synthesis of humic acid with the obtaining of potassium humate based on coal waste from the Lenger deposit, Kazakhstan
- Ascorbic acid-mediated selenium nanoparticles as potential antihyperuricemic, antioxidant, anticoagulant, and thrombolytic agents
- Green synthesis of silver nanoparticles using Illicium verum extract: Optimization and characterization for biomedical applications
- Antibacterial and dynamical behaviour of silicon nanoparticles influenced sustainable waste flax fibre-reinforced epoxy composite for biomedical application
- Optimising coagulation/flocculation using response surface methodology and application of floc in biofertilisation
- Green synthesis and multifaceted characterization of iron oxide nanoparticles derived from Senna bicapsularis for enhanced in vitro and in vivo biological investigation
- Potent antibacterial nanocomposites from okra mucilage/chitosan/silver nanoparticles for multidrug-resistant Salmonella Typhimurium eradication
- Trachyspermum copticum aqueous seed extract-derived silver nanoparticles: Exploration of their structural characterization and comparative antibacterial performance against gram-positive and gram-negative bacteria
- Microwave-assisted ultrafine silver nanoparticle synthesis using Mitragyna speciosa for antimalarial applications
- Green synthesis and characterisation of spherical structure Ag/Fe2O3/TiO2 nanocomposite using acacia in the presence of neem and tulsi oils
- Green quantitative methods for linagliptin and empagliflozin in dosage forms
- Enhancement efficacy of omeprazole by conjugation with silver nanoparticles as a urease inhibitor
- Residual, sequential extraction, and ecological risk assessment of some metals in ash from municipal solid waste incineration, Vietnam
- Green synthesis of ZnO nanoparticles using the mangosteen (Garcinia mangostana L.) leaf extract: Comparative preliminary in vitro antibacterial study
- Simultaneous determination of lesinurad and febuxostat in commercial fixed-dose combinations using a greener normal-phase HPTLC method
- A greener RP-HPLC method for quaternary estimation of caffeine, paracetamol, levocetirizine, and phenylephrine acquiring AQbD with stability studies
- Optimization of biomass durian peel as a heterogeneous catalyst in biodiesel production using microwave irradiation
- Thermal treatment impact on the evolution of active phases in layered double hydroxide-based ZnCr photocatalysts: Photodegradation and antibacterial performance
- Preparation of silymarin-loaded zein polysaccharide core–shell nanostructures and evaluation of their biological potentials
- Preparation and characterization of composite-modified PA6 fiber for spectral heating and heat storage applications
- Preparation and electrocatalytic oxygen evolution of bimetallic phosphates (NiFe)2P/NF
- Rod-shaped Mo(vi) trichalcogenide–Mo(vi) oxide decorated on poly(1-H pyrrole) as a promising nanocomposite photoelectrode for green hydrogen generation from sewage water with high efficiency
- Green synthesis and studies on citrus medica leaf extract-mediated Au–ZnO nanocomposites: A sustainable approach for efficient photocatalytic degradation of rhodamine B dye in aqueous media
- Cellulosic materials for the removal of ciprofloxacin from aqueous environments
- The analytical assessment of metal contamination in industrial soils of Saudi Arabia using the inductively coupled plasma technology
- The effect of modified oily sludge on the slurry ability and combustion performance of coal water slurry
- Eggshell waste transformation to calcium chloride anhydride as food-grade additive and eggshell membranes as enzyme immobilization carrier
- Synthesis of EPAN and applications in the encapsulation of potassium humate
- Biosynthesis and characterization of silver nanoparticles from Cedrela toona leaf extracts: An exploration into their antibacterial, anticancer, and antioxidant potential
- Enhancing mechanical and rheological properties of HDPE films through annealing for eco-friendly agricultural applications
- Immobilisation of catalase purified from mushroom (Hydnum repandum) onto glutaraldehyde-activated chitosan and characterisation: Its application for the removal of hydrogen peroxide from artificial wastewater
- Sodium titanium oxide/zinc oxide (STO/ZnO) photocomposites for efficient dye degradation applications
- Effect of ex situ, eco-friendly ZnONPs incorporating green synthesised Moringa oleifera leaf extract in enhancing biochemical and molecular aspects of Vicia faba L. under salt stress
- Biosynthesis and characterization of selenium and silver nanoparticles using Trichoderma viride filtrate and their impact on Culex pipiens
- Photocatalytic degradation of organic dyes and biological potentials of biogenic zinc oxide nanoparticles synthesized using the polar extract of Cyperus scariosus R.Br. (Cyperaceae)
- Assessment of antiproliferative activity of green-synthesized nickel oxide nanoparticles against glioblastoma cells using Terminalia chebula
- Chlorine-free synthesis of phosphinic derivatives by change in the P-function
- Anticancer, antioxidant, and antimicrobial activities of nanoemulsions based on water-in-olive oil and loaded on biogenic silver nanoparticles
- Study and mechanism of formation of phosphorus production waste in Kazakhstan
- Synthesis and stabilization of anatase form of biomimetic TiO2 nanoparticles for enhancing anti-tumor potential
- Microwave-supported one-pot reaction for the synthesis of 5-alkyl/arylidene-2-(morpholin/thiomorpholin-4-yl)-1,3-thiazol-4(5H)-one derivatives over MgO solid base
- Screening the phytochemicals in Perilla leaves and phytosynthesis of bioactive silver nanoparticles for potential antioxidant and wound-healing application
- Graphene oxide/chitosan/manganese/folic acid-brucine functionalized nanocomposites show anticancer activity against liver cancer cells
- Nature of serpentinite interactions with low-concentration sulfuric acid solutions
- Multi-objective statistical optimisation utilising response surface methodology to predict engine performance using biofuels from waste plastic oil in CRDi engines
- Microwave-assisted extraction of acetosolv lignin from sugarcane bagasse and electrospinning of lignin/PEO nanofibres for carbon fibre production
- Biosynthesis, characterization, and investigation of cytotoxic activities of selenium nanoparticles utilizing Limosilactobacillus fermentum
- Highly photocatalytic materials based on the decoration of poly(O-chloroaniline) with molybdenum trichalcogenide oxide for green hydrogen generation from Red Sea water
- Highly efficient oil–water separation using superhydrophobic cellulose aerogels derived from corn straw
- Beta-cyclodextrin–Phyllanthus emblica emulsion for zinc oxide nanoparticles: Characteristics and photocatalysis
- Assessment of antimicrobial activity and methyl orange dye removal by Klebsiella pneumoniae-mediated silver nanoparticles
- Influential eradication of resistant Salmonella Typhimurium using bioactive nanocomposites from chitosan and radish seed-synthesized nanoselenium
- Antimicrobial activities and neuroprotective potential for Alzheimer’s disease of pure, Mn, Co, and Al-doped ZnO ultra-small nanoparticles
- Green synthesis of silver nanoparticles from Bauhinia variegata and their biological applications
- Synthesis and optimization of long-chain fatty acids via the oxidation of long-chain fatty alcohols
- Eminent Red Sea water hydrogen generation via a Pb(ii)-iodide/poly(1H-pyrrole) nanocomposite photocathode
- Green synthesis and effective genistein production by fungal β-glucosidase immobilized on Al2O3 nanocrystals synthesized in Cajanus cajan L. (Millsp.) leaf extracts
- Green stability-indicating RP-HPTLC technique for determining croconazole hydrochloride
- Green synthesis of La2O3–LaPO4 nanocomposites using Charybdis natator for DNA binding, cytotoxic, catalytic, and luminescence applications
- Eco-friendly drugs induce cellular changes in colistin-resistant bacteria
- Tangerine fruit peel extract mediated biogenic synthesized silver nanoparticles and their potential antimicrobial, antioxidant, and cytotoxic assessments
- Green synthesis on performance characteristics of a direct injection diesel engine using sandbox seed oil
- A highly sensitive β-AKBA-Ag-based fluorescent “turn off” chemosensor for rapid detection of abamectin in tomatoes
- Green synthesis and physical characterization of zinc oxide nanoparticles (ZnO NPs) derived from the methanol extract of Euphorbia dracunculoides Lam. (Euphorbiaceae) with enhanced biosafe applications
- Detection of morphine and data processing using surface plasmon resonance imaging sensor
- Effects of nanoparticles on the anaerobic digestion properties of sulfamethoxazole-containing chicken manure and analysis of bio-enzymes
- Bromic acid-thiourea synergistic leaching of sulfide gold ore
- Green chemistry approach to synthesize titanium dioxide nanoparticles using Fagonia Cretica extract, novel strategy for developing antimicrobial and antidiabetic therapies
- Green synthesis and effective utilization of biogenic Al2O3-nanocoupled fungal lipase in the resolution of active homochiral 2-octanol and its immobilization via aluminium oxide nanoparticles
- Eco-friendly RP-HPLC approach for simultaneously estimating the promising combination of pentoxifylline and simvastatin in therapeutic potential for breast cancer: Appraisal of greenness, whiteness, and Box–Behnken design
- Use of a humidity adsorbent derived from cockleshell waste in Thai fried fish crackers (Keropok)
- One-pot green synthesis, biological evaluation, and in silico study of pyrazole derivatives obtained from chalcones
- Bio-sorption of methylene blue and production of biofuel by brown alga Cystoseira sp. collected from Neom region, Kingdom of Saudi Arabia
- Synthesis of motexafin gadolinium: A promising radiosensitizer and imaging agent for cancer therapy
- The impact of varying sizes of silver nanoparticles on the induction of cellular damage in Klebsiella pneumoniae involving diverse mechanisms
- Microwave-assisted green synthesis, characterization, and in vitro antibacterial activity of NiO nanoparticles obtained from lemon peel extract
- Rhus microphylla-mediated biosynthesis of copper oxide nanoparticles for enhanced antibacterial and antibiofilm efficacy
- Harnessing trichalcogenide–molybdenum(vi) sulfide and molybdenum(vi) oxide within poly(1-amino-2-mercaptobenzene) frameworks as a photocathode for sustainable green hydrogen production from seawater without sacrificial agents
- Magnetically recyclable Fe3O4@SiO2 supported phosphonium ionic liquids for efficient and sustainable transformation of CO2 into oxazolidinones
- A comparative study of Fagonia arabica fabricated silver sulfide nanoparticles (Ag2S) and silver nanoparticles (AgNPs) with distinct antimicrobial, anticancer, and antioxidant properties
- Visible light photocatalytic degradation and biological activities of Aegle marmelos-mediated cerium oxide nanoparticles
- Physical intrinsic characteristics of spheroidal particles in coal gasification fine slag
- Exploring the effect of tea dust magnetic biochar on agricultural crops grown in polycyclic aromatic hydrocarbon contaminated soil
- Crosslinked chitosan-modified ultrafiltration membranes for efficient surface water treatment and enhanced anti-fouling performances
- Study on adsorption characteristics of biochars and their modified biochars for removal of organic dyes from aqueous solution
- Zein polymer nanocarrier for Ocimum basilicum var. purpurascens extract: Potential biomedical use
- Green synthesis, characterization, and in vitro and in vivo biological screening of iron oxide nanoparticles (Fe3O4) generated with hydroalcoholic extract of aerial parts of Euphorbia milii
- Novel microwave-based green approach for the synthesis of dual-loaded cyclodextrin nanosponges: Characterization, pharmacodynamics, and pharmacokinetics evaluation
- Bi2O3–BiOCl/poly-m-methyl aniline nanocomposite thin film for broad-spectrum light-sensing
- Green synthesis and characterization of CuO/ZnO nanocomposite using Musa acuminata leaf extract for cytotoxic studies on colorectal cancer cells (HCC2998)
- Review Articles
- Materials-based drug delivery approaches: Recent advances and future perspectives
- A review of thermal treatment for bamboo and its composites
- An overview of the role of nanoherbicides in tackling challenges of weed management in wheat: A novel approach
- An updated review on carbon nanomaterials: Types, synthesis, functionalization and applications, degradation and toxicity
- Special Issue: Emerging green nanomaterials for sustainable waste management and biomedical applications
- Green synthesis of silver nanoparticles using mature-pseudostem extracts of Alpinia nigra and their bioactivities
- Special Issue: New insights into nanopythotechnology: current trends and future prospects
- Green synthesis of FeO nanoparticles from coffee and its application for antibacterial, antifungal, and anti-oxidation activity
- Dye degradation activity of biogenically synthesized Cu/Fe/Ag trimetallic nanoparticles
- Special Issue: Composites and green composites
- Recent trends and advancements in the utilization of green composites and polymeric nanocarriers for enhancing food quality and sustainable processing
- Retraction
- Retraction of “Biosynthesis and characterization of silver nanoparticles from Cedrela toona leaf extracts: An exploration into their antibacterial, anticancer, and antioxidant potential”
- Retraction of “Photocatalytic degradation of organic dyes and biological potentials of biogenic zinc oxide nanoparticles synthesized using the polar extract of Cyperus scariosus R.Br. (Cyperaceae)”
- Retraction to “Green synthesis on performance characteristics of a direct injection diesel engine using sandbox seed oil”