Estimation of greenhouse gas emissions from rice and annual upland crops in Red River Delta of Vietnam using the denitrification–decomposition model
-
 and
and

Abstract
This study used the denitrification–decomposition (DNDC) model and ArcGIS 10.1 to calculate and quantify the greenhouse gas (GHG) potential from rice and annual upland crops in the Red River Delta of Vietnam. GHG emissions were monitored, analyzed, and calculated at experimental sites. The operating mechanism, sensitivity analysis of the parameters, calibration, and verification of the DNDC model for the GHG emission calculation were studied and performed, and a set of parameters was built. A good correlation between actual and simulated values was shown. From the data set of meteorological stations in and around the Red River Delta, the current land-use map, the topographic and soil map, a complex map of meteorology–soil–land use was built. Each unit of this map contains complete information about climate, soil, and crops as input data for modeling GHG emissions from crop production. From the spatial analysis and collected input data, GHG emissions were measured and calculated for the cultivated field of the Red River Delta (annual rice and upland crops) using the DNDC model. The model's outputs were used to build thematic maps on the distribution of global warming potential (CH4, N2O) for each unit of the complex map of climate, soil, and crops.
1 Introduction
Greenhouse gas (GHG) emissions from agriculture production have become a global problem. Significantly, it can be mentioned that Vietnam is one of the countries that depend on agricultural production as a prominent citizen’s livelihood. Vietnam's agricultural production is not only heavily affected by climate change but also causes climate change because it contributes to emissions.
Vietnam's National GHG inventory was implemented four times in 1994, 2000, and 2014, and most of the calculations of GHG inventory used the emission factors of IPCC Tier 1 [1] but not the country-specific factors (Tier 2 and higher). However, precise quantification of GHG emissions from rice and other crops is complex because of spatial variations in climate and soil, crops, and farming practices.
Besides using the closed-chamber method of direct field measurement or inventory emissions according to IPCC guidelines, countries, such as China, India, etc., have used the denitrification–decomposition (DNDC) model method combined with remote sensing to calculate the GHG emissions from rice farming. The application of a mathematical model quantifying GHG emissions is a possible solution to meet both technical requirements and emission calculation with high and stable accuracy [2].
DNDC model has modules to calculate CO2, N2O, and CH4 emissions by day and simulate the nitrogen cycle in agricultural soil. DNDC has a structure to simulate relatively fully the biochemical and physicochemical processes in soil, as well as other environmental factors (temperature, precipitation, etc.) that affect the processes of formation and release of GHGs from the soil into the atmosphere. DNDC has proven its reliability in GHG calculations through studies in many countries around the world and is considered as one of the most comprehensive currently available tools to calculate and forecast GHG emissions from agricultural and forestry activities [3,4,5].
The DNDC model has been applied to estimate N2O emissions and SOC fluctuations in agricultural cropping systems in the US since the early 1990s in the studies of Li et al. [5,6]. Bouwman et al. [7] used the DNDC model to calculate N2O emissions from small livestock production systems. Cai et al. tested the DNDC model in GHG emission calculations in East Asia [8]. Then, Pathak et al. and Babu et al. [9] continued to perfect the DNDC model combined with remote sensing to calculate emissions from rice cultivation in India. Most of the changes focused on the addition of anaerobic biogeochemical equations, rice growth, and farming practice parameters [9,10].
Then, a series of studies of DNDC model applications to estimate the emission reduction potential of improved farming practices were done by Cai et al. and Li et al., [11,12,13]. In 2008, Fumoto and his colleagues continued to improve the DNDC model into a version of DNDC-Rice specifically for rice land. The enhancements allow DNDC to improve the accuracy of quantification and CH4 emissions from rice fields under scenarios of climate, soil properties, farming practices, etc. and are used to determine the potential for CH4 mitigation in Japan [14]. Smith et al. [15] studied the sensitivity of the parameters of the DNDC model and used the calibrated DNDC model to estimate the GHG emission factor in Canada. Zhang et al. used the DNDC model in combination with remote sensing to calculate emissions for 1.44 million hectares of rice cultivation in southern China [16]. In 2016, Zhang and colleagues applied the DNDC model to estimate N2O emissions under different types of irrigation in vineyards in Ningxia, China [17]. Zhao et al. conducted sensitivity analysis, calibration, and verification of the DNDC model and then applied the model to suggest potential measures to reduce GHG emissions from rice fields in Shanghai, China [18].
Thus, it can be affirmed that the DNDC model has been continuously tested by CH4 and N2O monitoring data measured in the field and continues to be calibrated, perfected, and upgraded by researchers around the world. The application of the DNDC model to different rice farming systems in the United States, China, Thailand, India, Japan, and the Philippines has given very positive results. These studies have demonstrated that it is possible to use the DNDC model to estimate GHG emissions from rice fields at a large scale.
2 Methodology
2.1 Research framework
The research steps are shown in Figure 1.
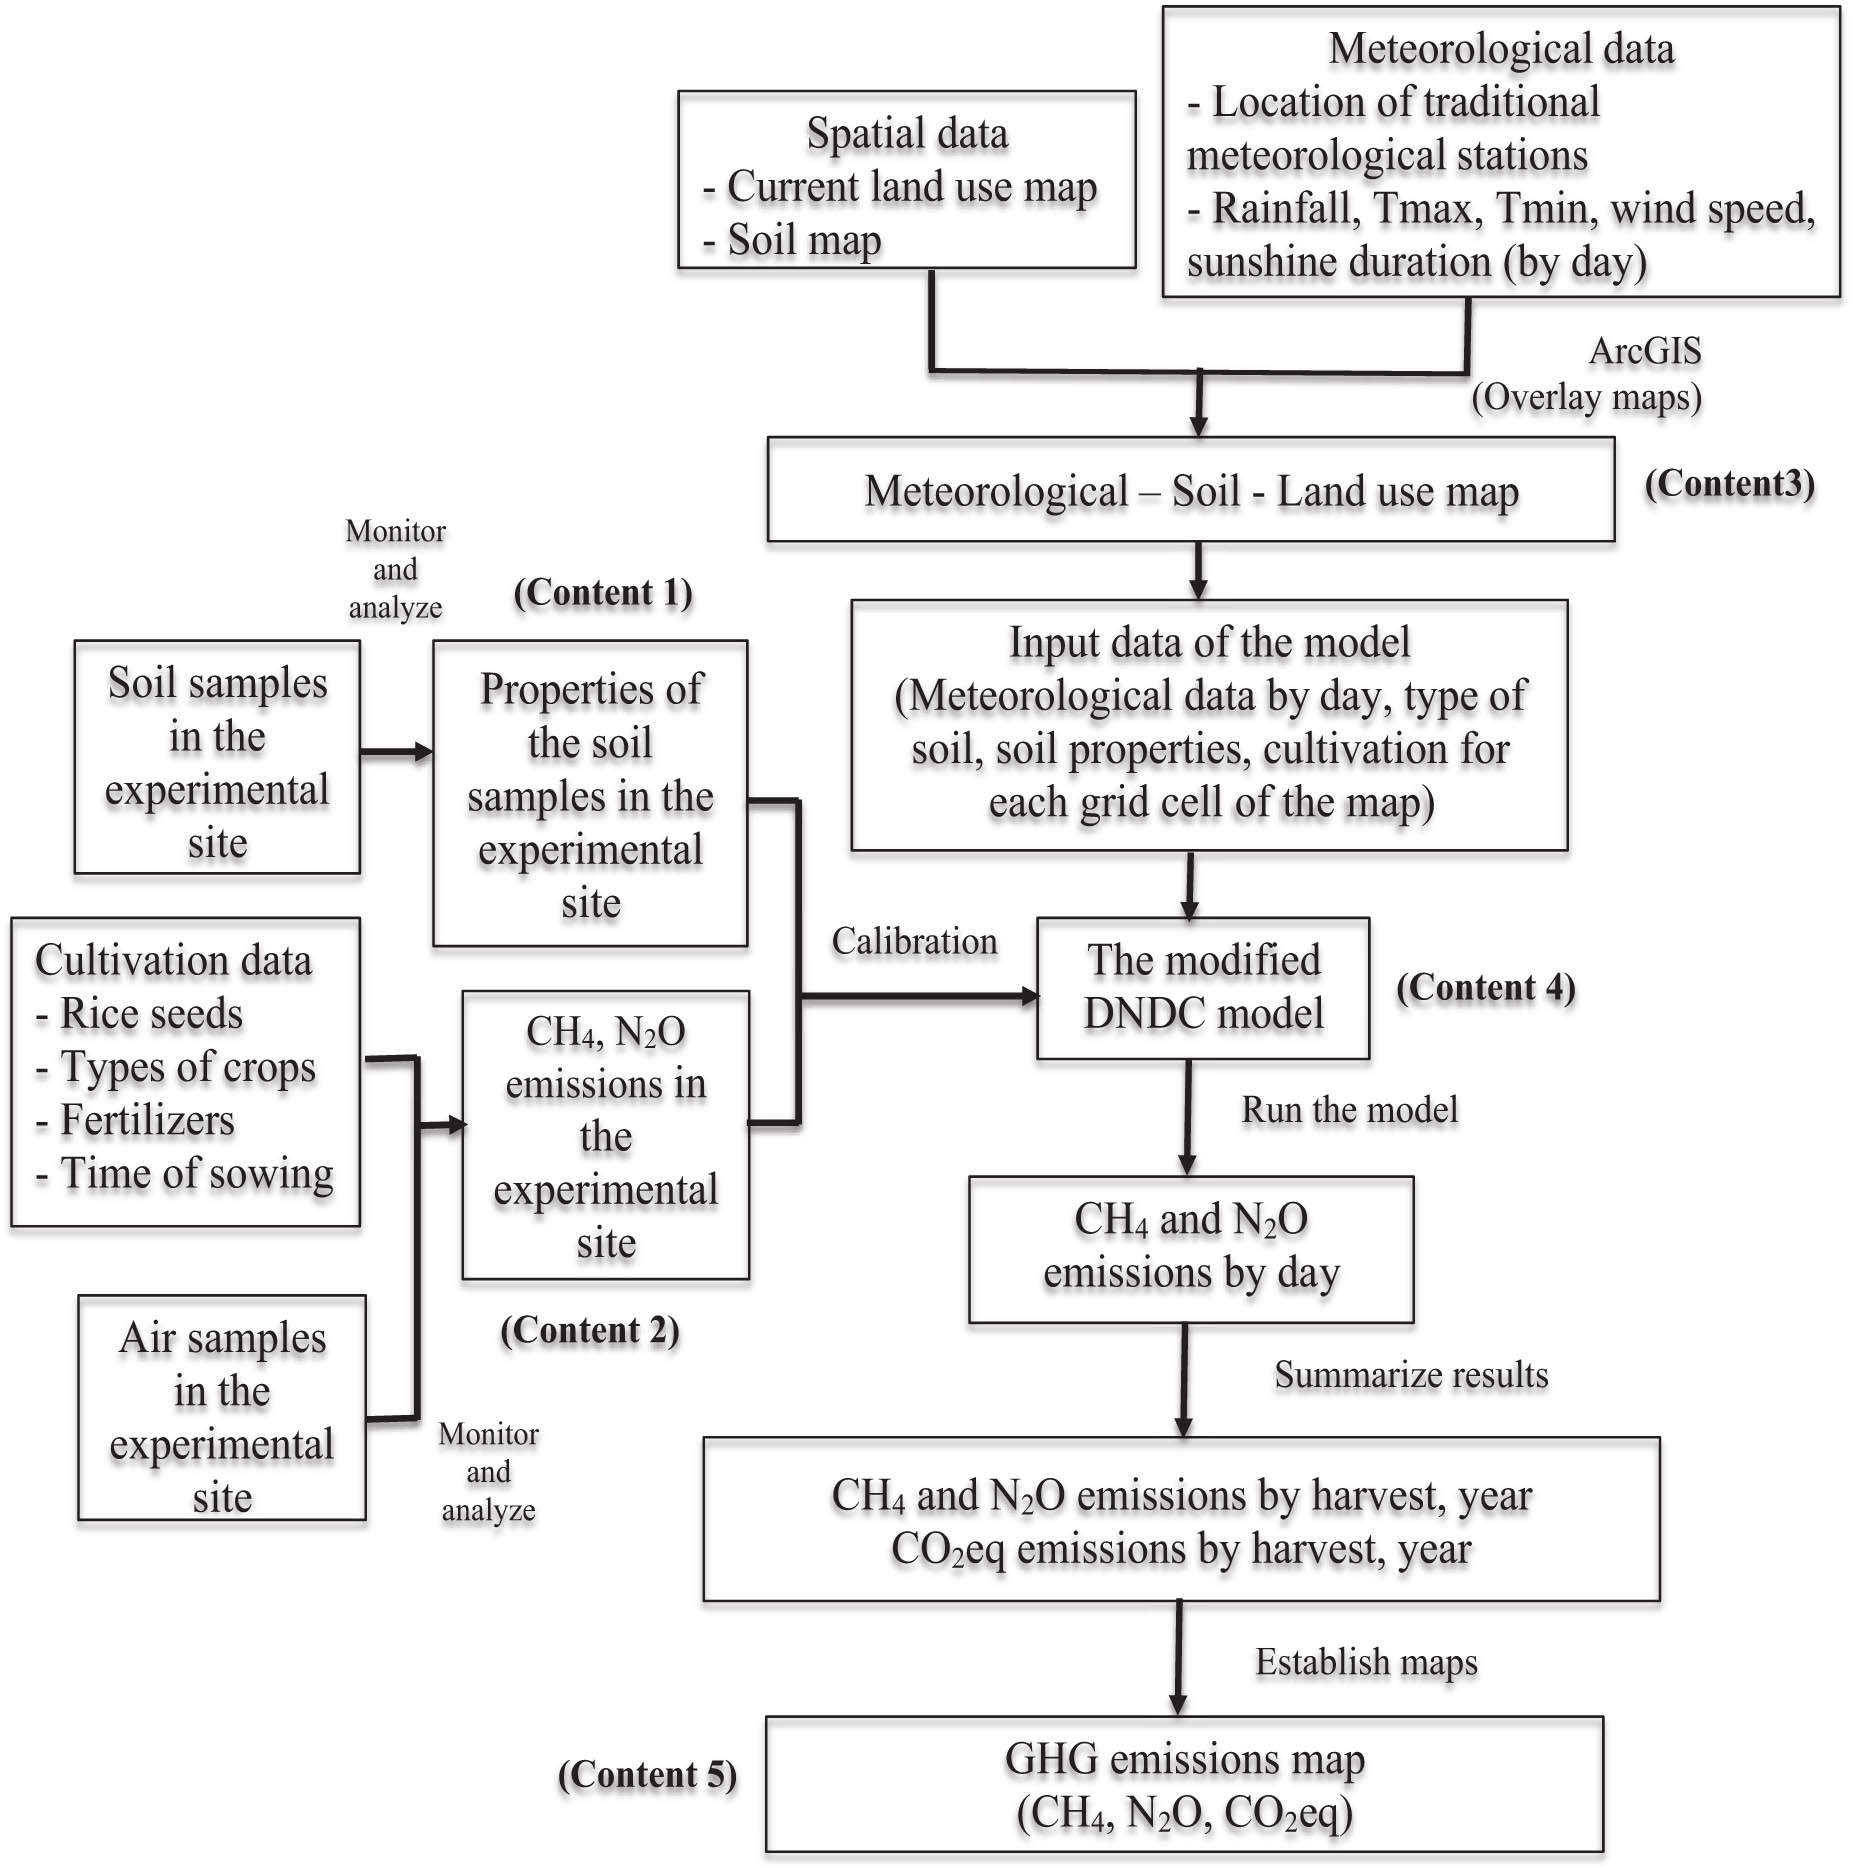
Research framework.
Regarding the implementation process, first of all, the study has collected all data on bio-physical and socio-economic conditions of the study area, meteorology, soil, land use, crop, and farming activities in both spatial and non-spatial data of the Red River Delta.
The field measurements (to measure CH4 and N2O emissions) were performed in four provinces (Nam Dinh, Thai Binh, Hai Duong provinces, and Hanoi city) on Fluvisols soil, gray soil, saline soil, and thionic soil and planted some rice varieties of Huong Viet 3, BT7, TX111, DS1, LVN17, and BC15.
The spatial data of the whole Red River Delta were processed and edited for georeferences. Then, the layers of land map information and land-use status map are superimposed and combined with the information of meteorological stations in the region to create a combination map of meteorology–land–land use representation. Therefore, each polygon contains information on meteorology, soil, and cultivation in the format of the DNDC model as inputs for further GHG emission estimation process.
In the next step, the study uses the modified DNDC model to calculate CH4 and N2O emissions from rice and upland crops in the Red River Delta with different meteorological and soil conditions. The global warming potential (GWP) was estimated from CH4 and N2O emissions in terms of CO2 equivalents, guided by IPCC (2006), with a ratio of 28 for CH4 and 265 for N2O. The polygons containing emissions of CH4, N2O, and CO2eq are then presented on maps as thematic maps (using ArcGIS 10.0) of GHG emissions (Figure 1).
2.2 Methodology
2.2.1 Data collection
The spatial data include land-use map of the Red River Delta in 2015 received from the Vietnam General Department of Land Management and the Ministry of Natural Resources and Environment, and the soil map of the Red River Delta in 2016 received from the Soils and Fertilizers Research Institute, Vietnam Academy of Agricultural Sciences.
The soil data information includes soil types, soil layer thickness, and sand oil physical and biochemical properties received from the Soils and Fertilizers Research Institute. The crop data include crop varieties, phenology, seasonal crop calendar, farming techniques, fertilizers types, nutrient content, and application procedures.
The crop data include rice varieties and other annual crops; physiological and biochemical characteristics of rice and maize varieties; seasonal calendar; farming techniques (soil preparation, irrigation, fertilization, weeding, plant protection spraying); and types and characteristics of fertilizers (from documents, books, and scientific articles; information about varieties and results of variety testing, December 2017 statistical report of the Ministry of Agriculture and Rural Development [MARD]) [19].
Meteorological data were collected during the period 2010–2020 at 28 principal meteorological stations in the network of national monitoring of Viet Nam Meteorological and Hydrological Administration. These stations ensure measurements on a unified basis and serve for basic investigation. The information includes station coordinates, minimum and maximum temperature, sunshine hours, wind direction and speed, rainfall, and humidity in a daily resolution. The meteorological station’s locations are shown in Figure 2, and their information is presented in Tables S1 and S3.

Location map of meteorological stations.
2.2.2 Gas sampling and analysis
2.2.2.1 Rice varieties
The rice varieties at the experimental sites were regionalized by MARD and were Huong Viet 3, BT7, TX111, DS1, and BC15. All these five varieties have durations from 110 to 138 days and can be grown in two seasons in a year; spring rice has a longer duration than summer season rice. All five varieties have a high yield potential range from 5.5 to 7.5 tons·ha−1 season−1 (Table S2).
2.2.2.2 Experimental layout
Field measurements were set up on 10 selected sites (Table 1). The farming activities were practiced following the recommendations of local extension with adjustments for local conditions of weather, soil, and farming levels. In general, Spring rice started on February 5th and ended on June 15th, and Summer rice started on 24th June and ended in October.
Amount of fertilizer applied at the study sites
| Site | Province, soil type, and crop rotation | Rice varieties | Coordinates | Fertilizer applied (kg·ha−1·crop−1) | |||||
|---|---|---|---|---|---|---|---|---|---|
| Spring crop | Summer crop | ||||||||
| N | P2O5 | K2O | N | P2O5 | K2O | ||||
| 1 | Ha Noi, Fluvisols, Spring rice and Summer rice | BT7 | 20°55′60″N; 105°50′54″E | 95.4 | 65.0 | 70.0 | 82.8 | 55.0 | 60.0 |
| 2 | Nam Dinh, Fluvisols, Spring rice and Summer rice | TX111 | 19°59′11″N; 106°8′5″E | 95.4 | 65.0 | 70.0 | 82.8 | 55.0 | 60.0 |
| 3 | Thai Binh, Fluvisols, Spring rice and Summer rice | DS1 | 20°24′18″N; 106°17′49″E | 95.0 | 65.0 | 50.0 | 90.0 | 55.0 | 45.0 |
| 4 | Thai Binh, Fluvisols, Spring rice, Summer rice, and Winter crop | BT7 | 20°24′54″N; 106°16′1″E | 100.0 | 60.0 | 50.0 | 90.0 | 58.0 | 45.0 |
| 5 | Ha Duong, Fluvisols, Thai Binh, Fluvisols, Spring rice, Summer rice, and Winter crop | BC15 | 20°3′8″N; 106°13′28″E | 100.0 | 60.0 | 70.0 | 90.0 | 58.0 | 60.0 |
| 6 | Nam Dinh, Solonetz, Thai Binh, Fluvisols, Spring rice and Summer rice | TX111 | 20°3′28″N; 106°13′1″E | 100.0 | 75.0 | 70.0 | 104.9 | 47.0 | 72.0 |
| 7 | Nam Dinh, Solonetz, Thai Binh, Fluvisols, Spring rice and Summer rice | TX111 | 20°13′59″N; 106°15′33″E | 100.0 | 75.0 | 70.0 | 104.9 | 47.0 | 72.0 |
| 8 | Thai Binh, Solonetz, Spring rice and Summer rice | Huong Viet 3 | 20°24′50″N; 106°34′35″E | 100.0 | 75.0 | 50.0 | 95.0 | 50.0 | 45.0 |
| 9 | Thai Binh, Thionic, Spring rice and Summer rice | BC15 | 20°45′74.23″; 106°38′5″E | 127.0 | 48.0 | 80.0 | 104.9 | 47.0 | 72.0 |
| 10 | Ha Noi, Gray, Spring rice and Summer rice | BC15 | 21°16′22″N; 105°53′30″E | 120.0 | 75.0 | 50.0 | 110.0 | 55.0 | 45.0 |
In spring, land preparation was done from February 5 to 18, 2018; transplantation was done from February 08 to 20, 2018, with a rice population of 30–35 hills·m−2, and harvest from June 02 to 11, 2018. In summer, land preparation was done from June 24 to 25, 2018, transplantation was done from 30 June 30 to July 02, 2018, with a rice population of 30–35 hills·m−2 and harvest from October 17 to 27, 2018. Water management was similar to farming practices, in which the field was flooded 10 cm until the rice was matured, and then the field was drained (in spring, it was drained from May 20 to 30, 2018; in summer, it was drained from October 01 to 19, 2018 depending on each experimental site). After harvesting, the straw was removed, but the stubble was plow-incorporated into the soil.
Fertilizer was applied three times per season. Basal fertilizer uses 100% phosphorus fertilizer, 30% nitrogen fertilizer, and 30% potassium fertilizer. The first split at tillering was with 40% nitrogen fertilizer, and the second split was at panicle initiation; the second additional fertilizer was 30% nitrogen fertilizer, and the remaining 70% was potash fertilizer. The rate of fertilizer application was recommended by the provincial Departments of Agriculture and Rural Development and trained by the Agricultural Extension Centers of the provinces. This is also the fertilizer level we obtained from the survey results of 720 farmer households.
2.2.2.3 Gas sampling
The CH4 and N2O fluxes were determined using the techniques of static flux chamber and gas chromatography, following the methods of Rochette and Eriksen-Hamel (2008) [20]. The chamber consists of a permanently installed base unit (open bottom) and a removable top. A stainless steel base unit (45 cm length, 9 40 cm width, 9 40 cm height) with a water groove (5 cm in depth) on the top was placed 10 cm deep in the soil for 3 days before transplanting to avoid lateral gas diffusion. The removable top (45 cm length, 9 40 cm width, 9 9 cm height) covered six hills of rice, and the plant density inside the chamber was the same as that outside of the chamber (see www.climaviet.org). Floodwater was used to seal the plexiglass top to the base unit during gas sampling. A rubber septum, thermometer, and two mini-fans (12 V) were installed at the top of the chamber [21]. Pressure control (a plastic tube with 7.6 m length and 1.5 mm diameter) was also installed to maintain an equilibrium gas pressure between the inside and outside of the chamber and to minimize mixing of the internal chamber gases with the exterior atmosphere [22]. Removable wooden boardwalks were set up in the early stages of the rice season to avoid soil disturbances during gas sampling. Samples for analysis of CH4 and N2O were taken at the stages of transplant, tillering stage, stem elongation, panicle initiation, booting stage, flowering stage, milk stage, and dough stage.
2.2.2.4 Analysis of gas samples
Gas samples were analyzed by gas chromatography: CH4 gas was determined by a flame ionization detector at 300°C and N2O was determined by an electron capture detector at 350°C.
For determining the GHG emission, the intensity of CH4 or N2O emission (mg·m−2·h−1) was calculated using the equation of Smith et al. [15].
2.2.3 Soil analysis
Soil samples were taken in the survey field at the rooting layer before the experiment. Soil sampling was carried out following the Vietnam standards: soil texture by a pipette (TCVN 8567:2010); soil pH by using a pH meter (TCVN 5979-2007); total OC by Walkley – Black (TCVN 9294:2012); total N by the Kjeldahl procedure (TCVN 7373:2004); total P by the colorimetric method (TCVN 8940:2011); total K by atomic absorption spectroscopy method (TCVN 8660:2011); cation exchange capacity (CEC) by the ammonium acetate extraction method; and available K2O (TCVN8662:2011) and available P2O5 by Olsen (TCVN8661:2011).
2.2.4 Modeling
2.2.4.1 Model description
The DNDC model was used to simulate GHG emissions from rice cultivation and some other annual crops.
The DNDC model is a process-oriented computer simulation model of carbon and nitrogen biogeochemistry in agroecosystems. The model consists of two components: the first component, consisting of the soil climate, crop growth, and decomposition sub-models, predicts the soil temperature, moisture, pH, redox potential (Eh), and substrate concentration profiles driven by ecological drivers (climate, soil, vegetation, and anthropogenic activity). The second component, consisting of nitrification, denitrification, and fermentation sub-models, predicts emissions of carbon dioxide (CO2), methane (CH4), ammonia (NH3), nitric oxide (NO), nitrous oxide (N2O), and dinitrogen (N2) from plant–soil systems. Classical laws of physics, chemistry, and biology, as well as empirical equations generated from laboratory studies, have been incorporated into the model to parameterize each specific geochemical or biochemical reaction. The entire model forms a bridge between the C and N biogeochemical cycles and the primary ecological drivers [23].
The input data of the model included meteorology (temperature, precipitation, wind speed, solar radiation, humidity); cultivation (seeds, time of sowing, harvesting, fertilizers, watering, crop management, weeds, etc.); and soil (soil type, pH, bulk density, hydraulic conductivity, clay content, OC content, etc.)
The output data of the model involved CH4 and N2O emissions per unit of cultivated area and other indicators related to OC, Eh, etc.
2.2.4.2 Sensitivity assessment of the DNDC model for the calculation of emissions
The input sensitivity analysis scenarios are prepared based on the climate, soil, and actual farming practices in the fluviol farming system in Thai Binh. Sensitivity analysis of the inputs is performed by changing a single input parameter within an observable range while keeping all other inputs at the original parameter (baseline). Input factors for sensitivity assessment include climate factors (temperature, precipitation, humidity), soil properties (organic carbon content in soil, clay fraction, pH, bulk density, and porosity), or farming practices (the amount of nitrogen fertilizer and manure used). The selected initial value is rice grown on fluviol soil in Nguyen Xa commune, Vü Thu district, Thai Binh province. The rice variety used in the experiment is the one that is widely grown in the area. The soil pH ranged from 4.8 to 5.0; soil texture values (%) were 19.96% (<0.002 mm), 49.38% (0.002–0.02 mm), and 30.66% (0.02–0.2 mm); the soil organic content was 0.18%; plant available phosphorus was 182.09 mg/100 g; and CEC was 26.75 cmol·kg−1. Fertilizer was applied three times/season without application of manure, and the plow depth was about 20 cm. The irrigation mode was still mainly regular flooding. The average daily temperature and daily rainfall data were obtained from the Thai Binh meteorological station in 2018.
2.2.4.3 Calibration of the DNDC model for emission calculation
The estimated results of CH4 and N2O emissions by the DNDC model were compared with the measured ones at the experimental site in two rice seasons. The correlation between the two results was determined using the R 2 [24] and Nash – Sutcliffe efficiency index (NSI) [25], as follows:
where i is the total number of tests, O i is the actual measured value i, Ō is the mean of the actual measured value, P i is the simulated value i that corresponds to O i , and n is the total number of tests. The R 2 value ranges from 0 to 1, representing the correlation between the actual measured value and the simulated value. The NSI value ranges from −∞ to 1, representing the match between the actual measured value and the simulated value on a 1:1 straight line. If R 2 and NSI are less than or close to zero, then the results are considered unacceptable or of poor reliability. On the contrary, if this value is equal to 1, the simulation results of the model are perfect. The model is accepted when the R 2 coefficient and NSI index are greater than 0.5.
The model parameters that can be calibrated are the bulk density, clay fraction, drainage efficiency, porosity, wilting point, field capacity, conductivity, rainwater collection index, soil salinity index, initial nitrate concentration at the surface soil, initial ammonium concentration at the surface soil, pH, and microbial activity index.
2.2.4.4 Model verification
The model was verified by comparing the GHG emission calculation results of the model with the experimental data set from the study of Mai et al. [26], which measured the field emissions at Thinh Long, Hai Hau, and Nam Dinh.
Similar to the content of model calibration, this research has calculated the value of the coefficient of determination R 2 and the NSI to compare the fit between the calculated emission values by the model (after calibration) and observed values.
2.2.5 Spatial analysis
The DNDC model estimated GHG emissions for each polygon on the map unit. Then, ArcGIS 10.1 software was used to present all these results on thematic maps, the so-called maps of CH4, N2O, and CO2eq emission.
2.2.6 Statistical analysis
The data and results of the conducted experiments after applying the DNDC model were processed using Microsoft Excel. GHGs were converted to CO2eq with a factor of 28 for CH4 and 265 for N2O, according to IPCC 2014 [1].
3 Results and discussion
3.1 Physical and chemical properties of soils at experimental sites
Most of the measurement sites have organic and total N contents at high levels. For the organic content, because fluvisols outside the dyke are regularly accreted, the organic C was determined to be low of less than 1%; in contrast, due to fluvisols in low-lying areas being poorly drained and poorly mineralized, the organic C content was higher than 2.2%. Fluvisols with OC ranged from 0.9% to 2.61%; saline soils ranged from 0.4% to 2.29%; thionic soils were 3.3%, and gray soils were 1.23%. Thus, the organic content in thionic soils was much higher than that in the remaining three soil types. Additionally, most of the total N fluctuated in the range of 0.12%–2.7%.
At most of the study sites, phosphorus and available potassium were high, especially available phosphorus, which was very high. The soils’ CEC was medium to high, ranging from 12.6 to 26.7 cmol·kg−1. Mainly, thionic soils with total phosphorus were in the middle and poor levels.
In terms of acidity, saline soil, fluvisols, and gray soil had minor acidic reactions; thionic soils had acidic reactions. The pHKCl fluctuated as follows: fluvisols, 4.8–5.56; saline soils, 5.04–5.9; gray soil, 5.51; and thionic soil, 3.88.
The soil texture was classified according to three levels: clay, silt, and sand. Fluvisols mainly had silt particles: clay from 21.4% to 31.4%, silt from 54.2% to 57.2%, and sand from 14.4% to 21.4%. Soils varied from sandy to silt and clay, depending on the topographical conditions, the distribution distance of the soils from the river, and the distribution upstream, midstream, or downstream of the river.
3.2 Model sensitivity
3.2.1 Sensitivity of parameters for CH4 emissions
Figures 3 and 4 show that the temperature was a parameter that greatly affected the level of CH4 emissions. When the temperature fluctuated by 25%, 50%, and 75% of the initial value, CH4 emissions increased or decreased sharply, ranging from 75% to 530%. This is consistent with Li et al. research because the microbial activity involved in the production of methane increased significantly with increasing and decreasing temperature. Changes in precipitation did not have much effect on CH4 emissions. This result is conformable with the published studies of Sass et al. , Yagi et al. (1996), Adhya et al. (2000), and Lu et al. (2000) [3,27,28,29,30].

Sensitivity of parameters for CH4 emissions.

Sensitivity of parameters for N2O emissions.
Among rice cultivation practices, the amount of nitrogen fertilizer (urea) and the amount of manure are the two main farming activities that have a significant impact on seasonal CH4 emissions. When the amount of nitrogen fertilizer is reduced by 25%, 50%, and 75%, CH4 emissions decrease in the range of 0.12–14.25%. When the amount of nitrogen fertilizer is increased by 25%, 50%, and 75%, CH4 emissions increase in the range of 0.13–0.47%. When the amount of manure is increased from no fertilizer to 1, 1.5, and 2 tons·ha−1, the CH4 emission rate increases from 10.55% to 15.37%. Cai et al. showed that the form of nitrogen fertilizer directly or indirectly affects CH4 and N2O emissions. The application of the ammonium sulfate nitrogen fertilizer helps reduce CH4 emissions but increases N2O emissions by 25–50% [11].
When the bulk density decreases to 75%, CH4 emissions decrease sharply (90.15%), and when the bulk density increases to 75%, CH4 emissions increase sharply (172.05%).
The clay fraction is the next sensitive factor. When the clay fraction is decreased by 25%, 50%, and 75%, CH4 emissions increase by 18.09%, 53.41%, and 118.12%, respectively, and when the clay fraction is increased by 25%, 50%, and 75%, CH4 emissions decrease by 7.89%, 11.45%, and 14.77%, respectively.
The fourth sensitive factor for CH4 emissions is the microbial activity index. When the microbial activity index decreased in the range of 25–75% compared to the initial value, CH4 emissions decreased in the range of 34.79–86.65%. In contrast, when the microbial activity index is increased within the range of 25–75% compared to the initial value, CH4 emissions are decreased by 33.98–89.91%, respectively. Soil microorganisms play an important role in the production of CO2, CH4, and N2O in most terrestrial ecosystems. However, the level of GHG emissions between the soil and atmosphere depends on various factors that affect the development of microorganisms, such as soil oxygen content, underground water content, soil temperature, soil mineral N, organic matter and pH, or farming practices such as manure and N fertilization, plowing of plant residues, and tillage methods. Tillage can also affect the activities of microorganisms and indirectly affect CH4 and N2O emissions from soil.
Organic matter content in soil is a relatively sensitive factor for CH4 emissions due to the influence of methanogenic bacteria density. Many studies have shown that organic matter plays an extremely important role in the formation and emission of CH4 as the starting material of CH4 formation in soil. The stronger the decomposition process of organic matter in the soil, the lower the oxidation–reduction potential, creating favorable conditions for the formation of CH4. The richer the soil is in organic matter, the more CH4 emissions there are [31,32]. Sensitivity analysis results show that when the initial OC content is increased from 25% to 75%, CH4 emissions increase by 18.22% and 52.99%, respectively. On the contrary, when the initial OC content decreased to 25–75%, the amount of CH4 decreased by 18.89% and 62.69%, respectively.
Porosity and conductivity of water are also factors that affect CH4 emissions. CH4 emissions decrease with water conductivity or porosity. CH4 emissions increase with increasing water conductivity or porosity. The conductivity of water is an index that describes the total dissolved ions in a solution. The movement of these ions creates an electromagnetic current, also known as ion conduction. The conductivity of water is proportional to the temperature of the water.
Compared to the analyzed factors, pH, drainage efficiency, depth of water retention layer, field capacity, and initial nitrate concentration at surface soil might have little impact on the CH4 emissions.
Density and clay rates were also sensitive factors. Some parameters that did not affect CH4 emissions were the wilting point in moisture soils and the salinity index. These results were similar to those reported by Li et al. (2004), Wassmann et al. (2000), and Yagi et al. Among rice cultivation methods, nitrogen (urea) and manure were the two primary farming practices that significantly impacted seasonal CH4 emissions [5,30,34,35].
3.2.2 Sensitivity of parameters for N2O emissions
N2O emissions were not much influenced by meteorological and precipitation factors. while temperatures oscillated by 25%, 50%, and 75% of initial values, N2O emissions, respectively, increased by 3.59%, 12.92%, and 24.52% and decreased by 2.02%, 13.12%, and 24.01%. The reason is that microorganisms involved in the nitrification process decreased when the temperature decreased and increased significantly when the temperature increased. This result is consistent with the studies of Li et al. [3].
In addition, N2O emissions were impacted significantly by the clay rate and the microbial activity index. The parameters drainage capacity, water movement speed, and initial ammonium content in the topsoil at the study sites experienced a lower influence on N2O emissions from rice soils. The wilting point in moisture soil and salinity index were the unaffected factors.
The initial nitrate concentration at the surface soil is also a highly sensitive factor for calculating N2O emissions. When the initial nitrate concentration increased at the surface soil (0.3 mg·kg−1) to 25%, 50%, and 75%, the N2O emission level increased by 29.56%, 59.52%, and 89.74%, respectively. On the contrary, when the initial nitrate concentration decreased at the surface soil by 25%, 50%, and 75% compared to the initial value, the N2O emission level decreased by 28.94%, 56.72%, and 81.23%, respectively.
Similar to CH4 emissions, bulk density is a very sensitive factor for N2O emissions. Bulk density positively affects the increase in N2O emissions.
Organic matter content in soil is the next most sensitive factor. Organic carbon plays an important role in the formation of N2O and N2 in the soil by affecting the density of bacteria participating in nitrification and denitrification processes. Carbon can stimulate the growth and activity of microorganisms and provide the necessary organic carbon for reducing agents. The development of soil microorganisms increases O2 consumption, accelerating the formation of anaerobic conditions necessary for denitrification. Zou et al. (2004) also showed that when the organic C content in the soil increased, N2O emissions were also increased. When the initial OC content increased from 25% to 75%, N2O emission levels increased by 75.2% and 78.3%, respectively. On the contrary, when the initial OC content is decreased, the N2O emission level decreases [33].
Some factors that also have a significant influence on N2O emissions are field capacity, porosity, and depth of the water retention layer. Field capacity and porosity are directly proportional to N2O emission levels, while the depth of the water retention layer is inversely proportional to N2O emission levels. Hua et al. showed that wet rice soil has both an aerobic surface soil layer and a deep anaerobic soil layer. It is the structure of two distinct soil layers in close proximity that creates conditions for the simultaneous occurrence of nitrification and denitrification reactions participating in the release of N2O. However, the nitrification process only dominates in the topsoil layer, while the denitrification process dominates in the deep soil layer during periods of high soil moisture. N2O produced from denitrification is often greater than that from nitrification [34].
Regarding fertilizers, nitrogen levels were positively linearly correlated with N2O emissions. The oscillation of the amount of N fertilizer applied to the soil by 25%, 50%, and 75% of the initial values increased or decreased N2O emissions by 2.29% and 10.72%, respectively. When the manure was changed from 0 to 1–2 ton·ha−1, the N2O emissions increased sharply. The trends in this research are similar to those of Li et al. and Bouwman et al. (2002) [4,6,7].
3.3 Model calibration
The model coefficients were adjusted according to the measurement results at the experimental sites. After that, the CH4 and N2O emissions calculated by the DNDC model were compared with the measured data in the field. Based on the CH4 and N2O emission values measured in the field and calculated using the model to show the point distribution, the GHG emissions values were distributed close to the 1:1 line. Figures 4 and 5 show a good correlation between the actual and simulated values: R 2 in spring and summer crops reached 0.86 and 0.79, NSI reached0.82 and 0.77 (for CH4); R 2 in spring and winter crops reached 0.62 and 0.69, and NSI reached 0.69 and 0.76 (for N2O) (Figure 6).

Simulated and field-measured CH4 emissions in the (a) spring season and (b) summer season.

Simulated and field-measured N2O emissions in the (a) spring season and (b) summer season.
3.4 Model validation
Similar to the data of model calibration, this study has calculated the value of the coefficient of determination R 2 and the NSI to compare the trend between the calculated emission values by model (after calibration) and observed values.
The results of model verification show the following: (i) comparing CH4 emissions observed and modeled in the spring crop, NSI = 0.79 and R 2 = 0.95; in the seasonal crop, NSI = 0.88 and R 2 = 0.95; and (ii) comparing the observed and modeled N2O emissions in the spring crop, NSI = 0.79 and R 2 = 0.81; in the seasonal crop, NSI = 0.73 and R 2 = 0.87. Thus, a good correlation between the field-measured values and the calculated values by the model was demonstrated. The model had a relatively high correlation (shown by the R 2 and NSI asymptotically up to 1). The results are presented in Figures 7 and 8.

Simulated and field-measured CH4 emissions in spring and summer seasons.

Simulated and field-measured N2O emissions in spring and summer seasons.
3.5 Input data for the model
3.5.1 Meteorological data
The coordinates of meteorological stations in the region are shown in Figure 2. The climate characteristics of each station are shown by daily data, and the average meteorological parameters are shown in Table S3.
3.5.2 Current land-use map
Current land types in the study area are rice and other annual, urban areas, rural areas, and others, which are shown in Figure S1. The planted area of rice and annual upland crops in the Red River Delta are shown in Table S4.
3.5.3 Soil map in the Red River Delta
From the collected soil map, filtering and establishing the thematic map were carried out; thereby, a new soil map for the Red River Delta was formed with the main soil types being fluvisols, gray soil, saline soil, thionic soil, sand soil, sloping, peat soil, erosion, chalk soil, which is shown in Figure S2. The planted area of rice and annual upland crops by main soil types of the Red River Delta are shown in Table S5.
3.5.4 Complex map of meteorology–soil–land use in the Red River Delta region
From the coordinate data of meteorological stations, the current land-use map and the distribution map of the soil types, a complex map of meteorology–soil–land use (Figure 9) was built by using the overlay analysis method.

Complex map of meteorology–soil–land use in the Red River Delta region.
From the coordinate information of meteorological stations, the current land-use map and the soil map, a complex map of meteorology–soil–land use (Figure 8) was built using the overlay analysis method. Each unit of the complex map already contains information about the location of the land plot, meteorology, soil type, crop status, and area of the land parcel (cells).
The total area of annual rice and upland crops on four main types of land is 1,115.41 thousand hectares, in which the total area of four main types of land for rice cultivation is 727.87 thousand ha, and the total area of four main types of land for annual upland crops is 387.54 thousand ha.
3.6 GHG emissions from rice and upland crops in the Red River Delta
3.6.1 GHG emissions from rice cultivation
Based on the results of the DNDC simulation for each unit of the complex map of meteorological–soil–land use, thematic maps showing the distribution of CH4 emissions from rice soil (Figure 10) and N2O emissions distribution from rice soil (Figure 11) were established. The results show a high range of CH4 emissions from 600 to 700 kg·ha−1·year−1. In coastal areas, CH4 emissions range from 755 to 859 kg·ha−1·year−1. The CH4 emissions were lowest in gray soils with an average of 250.57 kg·ha−1·year−1 and highest in thionic soils with an average of 802.74 kg·ha−1·year−1. Comparing the results between the measured and the DNDC model, we found a correlation between the content of soil organic matter and the soil and emissions. For instance, gray soil has lower organic matter content and lower emissions than other soil types, while thionic soil has the highest organic matter content and higher CH4 emissions. This trend agrees well with the measurement trend and previous studies by Pandey et al., Tariq et al., and Mai et al. [35,36,37].

Map of CH4 emissions from rice soil in the Red River Delta.

Map of N2O emissions from rice soil in the Red River Delta.
N2O emissions range widely from 0.55 to 2.0 kg·ha−1·year−1. N2O emissions differ by the soil type; the gray soil has the lowest N2O emission with a value of 0.667 kg·ha−1·year−1, and saline soil has the highest N2O emission with a value of 1,389 kg·ha−1·year−1. There is a correlation between the soil nitrogen content and N2O emissions. For instance, gray soil had lower nitrogen content and lower N2O emissions, while thionic soil had high nitrogen content and the highest N2O emission. This finding agrees with field measurement results and previous studies of Arjun et al. [38], Wassmann et al. [35], and Azeem et al. [37].
3.6.2 GHG emissions from annual upland crops in the Red River Delta
Based on the results of the DNDC simulation results for each unit on the complex map of meteorological–soil–land use, thematic maps showing N2O emissions distribution from the annual upland crops soil (Figure 12) were established.

Map of N2O emissions from annual upland crop soil in the Red River Delta.
The N2O emission values on the map range from 1.2 to 1.35 kg N2O·ha−1·year−1. The highest N2O emission is concentrated around the Ha Noi center, with emission rates higher than 1.3 kg N2O·ha−1·year−1, while the lowest emission points are distributed around the Hai Phong city and Thai Binh province with about 0.7–0.9 kg N2O·ha−1·year−1.
Thionic soils had the lowest N2O emissions (average: 0.723 kg N2O·ha−1·year−1); in contrast, fluvisols witnessed the highest N2O emissions (average: 1,957 kg·ha−1·year−1). The values ranged from 0.716 to 2,728 kg N2O·ha−1·year−1.
3.6.3 GWP
N2O emission and GWP from upland crops were estimated using IPCC (2014) guidelines and were then presented on a map (Figure 11) with a unit of kgN2O·ha−1·year−1. N2O emissions from these range from 17,500 to 20,000 kg CO2eq·ha−1·year−1. In the coastal area, GWP ranges from 18,500 to 22,842.21 kg CO2eq·ha−1·year−1 (Figure 13).

Map of GWP from rice in Red River Delta.
For annual upland crops, the calculated results show that the area around the Thai Binh station has the lowest emission (average: 260.41 kg CO2eq·ha−1·year−1), followed by the area around the Phu Lien station (average emission of 274.81 kg CO2eq·ha−1·year−1). The area around the Nam Dinh station has the highest emission (average 346.09 kg CO2eq·ha−1·year−1). Total CO2eq mostly fluctuates in the range of 310–355 kg CO2eq·ha−1·year−1 due to high soil N content, light mechanical composition, and a large amount of N fertilizer. The result is shown on the emission map in Figure 14.

Map of GWP from annual upland crops in Red River Delta.
The map of GWP (total GHG emissions in CO2eq) from rice and upland crop soil is presented in Figure 15. The map values show that the northern parts have a lower N2O emission (average: 4,586.33 kg CO2eq·ha−1·year−1) than the Southern parts (average: 22,842.21 kg CO2eq·ha−1·year−1). The reason for that is the Southern parts have alluvial, saline, and alum soils, while the area around the Tam Dao station and Ha Nam station has only two types of soil: alluvial and gray. The monitoring and analysis results at the experimental sites show that gray soil has lower emissions than thionic soil, saline soil, and fluvisol soil. Besides, meteorological factors also affect the emission level, especially temperature and humidity. Lu et al. (2000) showed that a temperature increase of 15–25°C under 45-day anaerobic conditions significantly increased the decomposition of carbon in the soil [28].

Map of total GHG emissions (in CO2eq) from annual rice and upland crops in Red River Delta.
4 Conclusion
This research monitored, analyzed, and calculated GHG emissions from rice crops at experimental sites in the Red River Delta. The DNDC model used to simulate GHG emission showed a good correlation between the observed and simulated values. The complex map of meteorology–soil–land use for the Red River Delta has been established from three single maps by overlaying operation. Each unit of this complex map contains information on climatic, soil, and crops, which uses input data for the DNDC model. Simulated results showed that CH4 emissions ranged from 72.20 to 859.16 kg·ha−1·year−1, in which gray soils had the lowest CH4 emission (average: 250.57 kg·ha−1·year−1) and thionic soils had the highest (average: 802.74 kg·ha−1·year−1). Similarly, N2O emissions ranged from 0.306 to 2,247 kg·ha−1·year−1, and N2O emission was the lowest (average: 0.667 kg·ha−1·year−1) in gray soils and highest (average 1,389 kg·ha−1·year−1) in saline soils. GWP in CO2eq values are in the range of 17,500–22,842 kg CO2eq·ha−1·year−1, which tends to be higher in the coastal area. For annual crops, N2O emission ranged from 0.716 to 2,728 kg N2O·ha−1·year−1, in which N2O emission in thionic soils are lowest with an average of 0.723 kg N2O·ha−1·year−1, while N2O emission on fluvisols is highest with an average of 1,957 kg·ha−1·year−1. GWP in CO2eq area fluctuates from 310 to 355 kg CO2eq·ha−1·year−1. From these simulated results, we developed a thematic map on the distribution of GHG emissions (CH4, N2O, GWP) for each map unit representative of meteorological, soil, and land use conditions for the whole delta.
-
Funding information: The authors state no funding is involved.
-
Author contributions: The authors contributed equally to this work.
-
Conflict of interest: The authors state no conflict of interest.
-
Data availability statement: The datasets generated during and/or analyzed during the current study are available from the corresponding author on reasonable request.
Appendix 1: DNDC Climate Data
Bac Ninh Meteorological Stations
| No. | Month/day/year | Tmax(°C) | Tmin (°C) | Rainfall (mm) | Wind speed (m·s−1) | Sunshine hours (h) | Humidity (°C) |
|---|---|---|---|---|---|---|---|
| 1 | 01/01/2010 | 15.4 | 11.7 | 3 | 0 | 64 | |
| 2 | 01/02/2010 | 16.3 | 13.3 | 4 | 0 | 76 | |
| 3 | 01/03/2010 | 15.1 | 12.9 | 3.8 | 7 | 0 | 88 |
| 4 | 01/04/2010 | 12.9 | 10 | 0 | 7 | 0 | 79 |
| 5 | 01/05/2010 | 11.4 | 8.3 | 0 | 5 | 0 | 85 |
| 6 | 01/06/2010 | 13 | 8.6 | 0 | 6 | 0 | 80 |
| 7 | 01/07/2010 | 12.9 | 9.9 | 0 | 5 | 0 | 82 |
| 8 | 01/08/2010 | 13.1 | 10.2 | 0.7 | 5 | 0 | 92 |
| 9 | 01/09/2010 | 14.9 | 10.9 | 0 | 6 | 0 | 72 |
| 10 | 01/10/2010 | 14.9 | 11.7 | 5 | 0.1 | 62 | |
| 11 | 01/11/2010 | 13 | 11.4 | 6 | 0 | 63 | |
| 12 | 01/12/2010 | 15.1 | 10.4 | 0.1 | 6 | 0 | 72 |
| 13 | 01/13/2010 | 19.2 | 8.5 | 0.2 | 5 | 8.1 | 76 |
| 14 | 01/14/2010 | 16.7 | 10.6 | 3 | 0 | 84 | |
| 15 | 01/15/2010 | 15.5 | 13.5 | 0.1 | 3 | 0 | 93 |
| 16 | 01/16/2010 | 17.9 | 14.7 | 0 | 4 | 0 | 91 |
| 17 | 01/17/2010 | 16.9 | 15.7 | 1.7 | 3 | 0 | 90 |
| 18 | 01/18/2010 | 15.7 | 13.4 | 5 | 0 | 78 | |
| 19 | 01/19/2010 | 15.8 | 12.6 | 0 | 4 | 0 | 85 |
| … | … | … | … | … | … | … | … |
| … | … | … | … | … | … | … | … |
| 3643 | 12/22/2020 | 16.5 | 14.3 | 2.5 | 4 | 0 | 92 |
| 3644 | 12/23/2020 | 21.2 | 15.3 | 1.1 | 3 | 0 | 94 |
| 3645 | 12/24/2020 | 25.7 | 18.6 | 0 | 4 | 0.6 | 88 |
| 3646 | 12/25/2020 | 27.5 | 21.1 | 0 | 5 | 5.3 | 84 |
| 3647 | 12/26/2020 | 26 | 17.7 | 0 | 6 | 1 | 79 |
| 3648 | 12/27/2020 | 18.3 | 14.7 | 5 | 0 | 67 | |
| 3649 | 12/28/2020 | 20.8 | 15.5 | 5 | 1.7 | 67 | |
| 3650 | 12/29/2020 | 24 | 16 | 3 | 6.8 | 76 | |
| 3651 | 12/30/2020 | 24.3 | 18.7 | 4 | 2.1 | 80 | |
| 3652 | 12/31/2020 | 22.8 | 18.8 | 0 | 4 | 0 | 81 |
Ha Nam Meteorological Stations
| No. | Month/day/year | Tmax (°C) | Tmin (°C) | Rainfall (mm) | Wind speed (m·s−1) | Sunshine hours (h) | Humidity (°C) |
|---|---|---|---|---|---|---|---|
| 1 | 01/01/2010 | 15.8 | 12.8 | 4 | 0 | 58 | |
| 2 | 01/02/2010 | 17.3 | 13.8 | 3 | 0 | 76 | |
| 3 | 01/03/2010 | 16.7 | 13.1 | 4.3 | 8 | 0 | 90 |
| 4 | 01/04/2010 | 13.4 | 10.4 | 0.4 | 6 | 0 | 88 |
| 5 | 01/05/2010 | 11 | 9.3 | 1.2 | 7 | 0 | 97 |
| 6 | 01/06/2010 | 12 | 9 | 1.4 | 4 | 0 | 90 |
| 7 | 01/07/2010 | 12.1 | 10.4 | 0.8 | 5 | 0 | 92 |
| 8 | 01/08/2010 | 12.2 | 10.9 | 0.6 | 5 | 0 | 98 |
| 9 | 01/09/2010 | 14.5 | 10.9 | 1.7 | 8 | 0 | 82 |
| 10 | 01/10/2010 | 14.9 | 12.2 | 4 | 0 | 66 | |
| 11 | 01/11/2010 | 13.4 | 11.9 | 7 | 0 | 66 | |
| 12 | 01/12/2010 | 14.7 | 10.9 | 9 | 0 | 72 | |
| 13 | 01/13/2010 | 17.7 | 10.6 | 4 | 5.4 | 79 | |
| 14 | 01/14/2010 | 16 | 12.8 | 4 | 0 | 86 | |
| 15 | 01/15/2010 | 15.6 | 14.5 | 5 | 0 | 93 | |
| 16 | 01/16/2010 | 17.7 | 15 | 0.4 | 4 | 0 | 95 |
| 17 | 01/17/2010 | 17.6 | 15.2 | 9.3 | 6 | 0 | 97 |
| 18 | 01/18/2010 | 15.7 | 14 | 6 | 0 | 82 | |
| 19 | 01/19/2010 | 16.4 | 13.4 | 4 | 0 | 88 | |
| … | … | … | … | … | … | … | … |
| … | … | … | … | … | … | … | … |
| 3643 | 12/22/2020 | 17.8 | 16.1 | 1.5 | 4 | 0 | 96 |
| 3644 | 12/23/2020 | 21.5 | 16.8 | 0.6 | 3 | 0.1 | 94 |
| 3645 | 12/24/2020 | 27.5 | 19.6 | 3 | 3.7 | 88 | |
| 3646 | 12/25/2020 | 27.9 | 20.9 | 4 | 6.7 | 83 | |
| 3647 | 12/26/2020 | 25.4 | 18.6 | 11.7 | 4 | 0.8 | 90 |
| 3648 | 12/27/2020 | 18.6 | 15.1 | 0.1 | 6 | 0 | 74 |
| 3649 | 12/28/2020 | 21.4 | 15.3 | 4 | 2.2 | 68 | |
| 3650 | 12/29/2020 | 24 | 16.4 | 4 | 7 | 78 | |
| 3651 | 12/30/2020 | 24.1 | 18.5 | 0.1 | 4 | 3.4 | 79 |
| 3652 | 12/31/2020 | 21.5 | 19.5 | 0.3 | 4 | 0 | 84 |
Hai Duong Meteorological Stations
| No. | Month/day/year | Tmax (°C) | Tmin (°C) | Rainfall (mm) | Wind speed (m·s)−1 | Sunshine hours (h) | Humidity (°C) |
|---|---|---|---|---|---|---|---|
| 1 | 01/01/2010 | 16 | 11.5 | 3 | 0 | 64 | |
| 2 | 01/02/2010 | 17.1 | 13.5 | 3 | 0 | 72 | |
| 3 | 01/03/2010 | 15.9 | 12 | 1.5 | 6 | 0 | 90 |
| 4 | 01/04/2010 | 13.2 | 10 | 0 | 5 | 0 | 82 |
| 5 | 01/05/2010 | 11.2 | 8.5 | 1 | 4 | 0 | 95 |
| 6 | 01/06/2010 | 12.1 | 8.8 | 0.4 | 6 | 0 | 84 |
| 7 | 01/07/2010 | 12.6 | 9.8 | 0.1 | 4 | 0 | 89 |
| 8 | 01/08/2010 | 12.7 | 10.3 | 0.5 | 5 | 0 | 95 |
| 9 | 01/09/2010 | 14.2 | 10.8 | 0.1 | 5 | 0 | 74 |
| 10 | 01/10/2010 | 14.6 | 11.4 | 4 | 0 | 59 | |
| 11 | 01/11/2010 | 13.1 | 11 | 5 | 0 | 66 | |
| 12 | 01/12/2010 | 14.6 | 10.4 | 0.1 | 6 | 0.2 | 74 |
| 13 | 01/13/2010 | 19.4 | 9.2 | 0 | 4 | 8 | 72 |
| 14 | 01/14/2010 | 17.7 | 11.6 | 3 | 0 | 83 | |
| 15 | 01/15/2010 | 16.3 | 14 | 0 | 4 | 0 | 92 |
| 16 | 01/16/2010 | 19.3 | 14.8 | 0 | 4 | 0 | 89 |
| 17 | 01/17/2010 | 18.5 | 16.3 | 0 | 5 | 0 | 88 |
| 18 | 01/18/2010 | 16.3 | 13.9 | 4 | 0 | 76 | |
| 19 | 01/19/2010 | 16 | 12.2 | 0 | 3 | 0 | 87 |
| … | … | … | … | … | … | … | … |
| … | … | … | … | … | … | … | … |
| 3643 | 12/22/2020 | 16.4 | 14.8 | 2.1 | 5 | 0 | 98 |
| 3644 | 12/23/2020 | 22.4 | 16 | 0.1 | 4 | 0.5 | 96 |
| 3645 | 12/24/2020 | 26.6 | 19.8 | 6 | 5 | 92 | |
| 3646 | 12/25/2020 | 27.1 | 20.4 | 6 | 6.5 | 92 | |
| 3647 | 12/26/2020 | 26 | 19.2 | 6 | 1.2 | 86 | |
| 3648 | 12/27/2020 | 19.3 | 15.7 | 6 | 0 | 73 | |
| 3649 | 12/28/2020 | 22.3 | 15.3 | 5 | 2.9 | 75 | |
| 3650 | 12/29/2020 | 24.4 | 16.2 | 4 | 8.1 | 81 | |
| 3651 | 12/30/2020 | 24.8 | 18 | 4 | 2.7 | 86 | |
| 3652 | 12/31/2020 | 23.4 | 19 | 0 | 5 | 0 | 86 |
Hung Yen Meteorological Stations
| No. | Month/day/year | Tmax (°C) | Tmin (°C) | Rainfall (mm) | Wind speed (m·s−1) | Sunshine hours (h) | Humidity (°C) |
|---|---|---|---|---|---|---|---|
| 1 | 01/01/2010 | 15.9 | 12.6 | 5 | 0 | 54 | |
| 2 | 01/02/2010 | 17.5 | 13.7 | 5 | 0 | 68 | |
| 3 | 01/03/2010 | 16.1 | 12.9 | 1.4 | 6 | 0 | 89 |
| 4 | 01/04/2010 | 13.2 | 9.6 | 6 | 0 | 86 | |
| 5 | 01/05/2010 | 10.6 | 8.5 | 0.4 | 4 | 0 | 97 |
| 6 | 01/06/2010 | 12.2 | 8.6 | 0.8 | 5 | 0 | 84 |
| 7 | 01/07/2010 | 12 | 9.8 | 0.5 | 4 | 0 | 94 |
| 8 | 01/08/2010 | 12 | 10.5 | 0.1 | 4 | 0 | 98 |
| 9 | 01/09/2010 | 14 | 10.8 | 0.7 | 6 | 0.2 | 75 |
| 10 | 01/10/2010 | 15 | 11.9 | 6 | 0.2 | 56 | |
| 11 | 01/11/2010 | 13.2 | 11.4 | 6 | 0 | 62 | |
| 12 | 01/12/2010 | 14.5 | 10.5 | 5 | 0 | 72 | |
| 13 | 01/13/2010 | 18 | 9.7 | 5 | 7.6 | 77 | |
| 14 | 01/14/2010 | 17 | 12.8 | 4 | 0 | 85 | |
| 15 | 01/15/2010 | 15.7 | 14.3 | 0 | 4 | 0 | 96 |
| 16 | 01/16/2010 | 18.2 | 14.9 | 0 | 3 | 0 | 94 |
| 17 | 01/17/2010 | 17.4 | 16.2 | 0 | 6 | 0 | 88 |
| 18 | 01/18/2010 | 16.3 | 13.6 | 5 | 0 | 76 | |
| 19 | 01/19/2010 | 16 | 12.3 | 3 | 0 | 88 | |
| … | … | … | … | … | … | … | … |
| … | … | … | … | … | … | … | … |
| 3643 | 12/22/2020 | 16.6 | 15.6 | 1.6 | 5 | 0 | 98 |
| 3644 | 12/23/2020 | 21 | 16.3 | 0.4 | 5 | 0 | 96 |
| 3645 | 12/24/2020 | 26.6 | 19.7 | 5 | 3.2 | 94 | |
| 3646 | 12/25/2020 | 27.4 | 21.3 | 7 | 8.4 | 84 | |
| 3647 | 12/26/2020 | 26 | 19.2 | 5 | 2 | 86 | |
| 3648 | 12/27/2020 | 19.2 | 15.7 | 6 | 0 | 73 | |
| 3649 | 12/28/2020 | 21.2 | 15.4 | 5 | 2.2 | 75 | |
| 3650 | 12/29/2020 | 24.1 | 16.3 | 5 | 7.6 | 82 | |
| 3651 | 12/30/2020 | 23.3 | 18.5 | 5 | 2.2 | 86 | |
| 3652 | 12/31/2020 | 21.2 | 19.2 | 0.1 | 5 | 0 | 92 |
Lang Meteorological Stations
| No. | Month/day/year | Tmax (°C) | Tmin (°C) | Rainfall (mm) | Wind speed (m·s−1) | Sunshine hours (h) | Humidity (°C) |
|---|---|---|---|---|---|---|---|
| 1 | 01/01/2010 | 15.6 | 12.8 | 3 | 0 | 56 | |
| 2 | 01/02/2010 | 16.2 | 14 | 2 | 0 | 69 | |
| 3 | 01/03/2010 | 15.3 | 13.4 | 2.7 | 5 | 0 | 91 |
| 4 | 01/04/2010 | 13.6 | 10.5 | 0 | 3 | 0 | 85 |
| 5 | 01/05/2010 | 10.7 | 8.7 | 0.6 | 3 | 0 | 93 |
| 6 | 01/06/2010 | 12.9 | 9 | 0.9 | 4 | 0 | 83 |
| 7 | 01/07/2010 | 12.5 | 10.1 | 0.3 | 3 | 0 | 87 |
| 8 | 01/08/2010 | 12.4 | 10.5 | 1.1 | 3 | 0 | 92 |
| 9 | 01/09/2010 | 15.2 | 11.2 | 0.2 | 6 | 0 | 76 |
| 10 | 01/10/2010 | 16 | 12.5 | 2 | 0.4 | 58 | |
| 11 | 01/11/2010 | 14 | 11.9 | 5 | 0 | 61 | |
| 12 | 01/12/2010 | 15.4 | 11.3 | 0.1 | 5 | 0 | 70 |
| 13 | 01/13/2010 | 18.1 | 9.8 | 0 | 3 | 6.2 | 73 |
| 14 | 01/14/2010 | 16.6 | 12.9 | 2 | 0 | 83 | |
| 15 | 01/15/2010 | 15.5 | 13.9 | 0.6 | 2 | 0 | 95 |
| 16 | 01/16/2010 | 18 | 14.8 | 0.6 | 3 | 0 | 93 |
| 17 | 01/17/2010 | 17.5 | 15.7 | 4.8 | 6 | 0 | 91 |
| 18 | 01/18/2010 | 15.7 | 13.7 | 0 | 4 | 0 | 78 |
| 19 | 01/19/2010 | 16.9 | 13.1 | 0 | 4 | 0 | 84 |
| … | … | … | … | … | … | … | … |
| … | … | … | … | … | … | … | … |
| 3643 | 12/22/2020 | 17 | 15.4 | 1.3 | 5 | 0 | 90 |
| 3644 | 12/23/2020 | 20.7 | 15.5 | 1.1 | 2 | 0 | 94 |
| 3645 | 12/24/2020 | 26.7 | 19.5 | 3 | 2.1 | 88 | |
| 3646 | 12/25/2020 | 28.3 | 21.4 | 5 | 6.8 | 78 | |
| 3647 | 12/26/2020 | 26.4 | 19.4 | 0.1 | 6 | 0 | 80 |
| 3648 | 12/27/2020 | 19.4 | 16 | 0.2 | 4 | 0 | 64 |
| 3649 | 12/28/2020 | 19.5 | 16 | 3 | 0 | 64 | |
| 3650 | 12/29/2020 | 23.5 | 16.4 | 3 | 4.8 | 74 | |
| 3651 | 12/30/2020 | 23.6 | 18.2 | 3 | 1.7 | 76 | |
| 3652 | 12/31/2020 | 22.9 | 20.1 | 0 | 2 | 0 | 77 |
Nam Đinh Meteorological Stations
| No. | Month/day/year | Tmax (°C) | Tmin (°C) | Rainfall (mm) | Wind speed (m·s−1) | Sunshine hours (h) | Humidity (°C) |
|---|---|---|---|---|---|---|---|
| 1 | 01/01/2010 | 16.3 | 12.5 | — | 4 | 0 | 62 |
| 2 | 01/02/2010 | 18.2 | 14.2 | — | 2 | 0 | 71 |
| 3 | 01/03/2010 | 16.6 | 12.3 | 3.10 | 5 | 0 | 92 |
| 4 | 01/04/2010 | 13 | 9.8 | 0.20 | 4 | 0 | 89 |
| 5 | 01/05/2010 | 10.6 | 9 | 0.90 | 4 | 0 | 98 |
| 6 | 01/06/2010 | 12 | 8.5 | 1.20 | 6 | 0 | 89 |
| 7 | 01/07/2010 | 11.8 | 10 | 1.00 | 4 | 0 | 97 |
| 8 | 01/08/2010 | 12.3 | 10.6 | 0.80 | 5 | 0 | 99 |
| 9 | 01/09/2010 | 14 | 10.6 | 0.60 | 6 | 0 | 82 |
| 10 | 01/10/2010 | 14.5 | 11.8 | — | 4 | 0.2 | 66 |
| 11 | 01/11/2010 | 13 | 11.4 | — | 5 | 0 | 70 |
| 12 | 01/12/2010 | 14.3 | 9.5 | — | 6 | 0 | 74 |
| 13 | 01/13/2010 | 18.6 | 9.4 | — | 5 | 7.1 | 80 |
| 14 | 01/14/2010 | 17.3 | 12.7 | — | 3 | 0 | 87 |
| 15 | 01/15/2010 | 16.1 | 14.4 | 0.10 | 4 | 0 | 94 |
| 16 | 01/16/2010 | 18.5 | 15 | 0.10 | 3 | 0 | 92 |
| 17 | 01/17/2010 | 18.4 | 16.2 | 0.20 | 4 | 0 | 93 |
| 18 | 01/18/2010 | 16.2 | 13.7 | — | 4 | 0 | 80 |
| 19 | 01/19/2010 | 16 | 12.7 | — | 3 | 0 | 90 |
| … | … | … | … | … | … | … | … |
| … | … | … | … | … | … | … | … |
| 3643 | 12/22/2020 | 17.6 | 16.1 | 0.2 | 4 | 0 | 97 |
| 3644 | 12/23/2020 | 26.5 | 16.7 | 0.1 | 4 | 2.3 | 89 |
| 3645 | 12/24/2020 | 27.7 | 19.9 | 0 | 5 | 4.5 | 89 |
| 3646 | 12/25/2020 | 27.6 | 21.1 | 5 | 8.6 | 86 | |
| 3647 | 12/26/2020 | 26.5 | 20.6 | 0 | 5 | 1.6 | 86 |
| 3648 | 12/27/2020 | 21.6 | 16.3 | 0.1 | 4 | 0 | 70 |
| 3649 | 12/28/2020 | 22.5 | 15.1 | 4 | 1.5 | 69 | |
| 3650 | 12/29/2020 | 25.7 | 16.1 | 4 | 8.5 | 78 | |
| 3651 | 12/30/2020 | 24.3 | 18.6 | 4 | 1.3 | 81 | |
| 3652 | 12/31/2020 | 21.5 | 19.1 | 0.1 | 4 | 0 | 89 |
Ninh Binh Meteorological Stations
| No. | Month/day/year | Tmax (°C) | Tmin (°C) | Rainfall (mm) | Wind speed (m·s−1) | Sunshine hours (h) | Humidity (°C) |
|---|---|---|---|---|---|---|---|
| 1 | 01/01/2010 | 16.2 | 12.6 | 3 | 0 | 54 | |
| 2 | 01/02/2010 | 18.2 | 14.2 | 3 | 0 | 70 | |
| 3 | 01/03/2010 | 16.8 | 12.5 | 3.7 | 4 | 0 | 91 |
| 4 | 01/04/2010 | 13.4 | 10.5 | 0.4 | 5 | 0 | 89 |
| 5 | 01/05/2010 | 11 | 9.6 | 0.5 | 6 | 0 | 96 |
| 6 | 01/06/2010 | 12 | 9.1 | 0.8 | 5 | 0 | 89 |
| 7 | 01/07/2010 | 12.4 | 10.1 | 0.2 | 4 | 0 | 92 |
| 8 | 01/08/2010 | 13 | 11.1 | 0.5 | 4 | 0 | 96 |
| 9 | 01/09/2010 | 14.3 | 10.7 | 0.6 | 6 | 0 | 81 |
| 10 | 01/10/2010 | 14.9 | 12.1 | 5 | 0 | 64 | |
| 11 | 01/11/2010 | 13.4 | 11.6 | 5 | 0 | 65 | |
| 12 | 01/12/2010 | 14.6 | 10.7 | 5 | 0 | 69 | |
| 13 | 01/13/2010 | 18 | 10.9 | 3 | 4.7 | 76 | |
| 14 | 01/14/2010 | 17.3 | 13.3 | 4 | 0 | 82 | |
| 15 | 01/15/2010 | 16.1 | 14.5 | 0.4 | 3 | 0 | 92 |
| 16 | 01/16/2010 | 18.3 | 15 | 0.1 | 4 | 0 | 93 |
| 17 | 01/17/2010 | 17.8 | 15.7 | 2.4 | 3 | 0 | 95 |
| 18 | 01/18/2010 | 16.3 | 14.1 | 4 | 0 | 80 | |
| 19 | 01/19/2010 | 17.3 | 13.6 | 3 | 0 | 86 | |
| … | … | … | … | … | … | … | … |
| … | … | … | … | … | … | … | … |
| 3643 | 12/22/2020 | 17.6 | 16.7 | 0.2 | 3 | 0 | 97 |
| 3644 | 12/23/2020 | 27.4 | 17 | 0 | 5 | 5.6 | 88 |
| 3645 | 12/24/2020 | 27.6 | 19.7 | 5 | 5.2 | 88 | |
| 3646 | 12/25/2020 | 27.4 | 20.6 | 6 | 9.2 | 84 | |
| 3647 | 12/26/2020 | 25 | 21 | 0.2 | 4 | 0.7 | 89 |
| 3648 | 12/27/2020 | 21.6 | 15.4 | 1.4 | 6 | 0 | 79 |
| 3649 | 12/28/2020 | 22.6 | 15.5 | 4 | 2.9 | 70 | |
| 3650 | 12/29/2020 | 25.5 | 16.7 | 4 | 7 | 76 | |
| 3651 | 12/30/2020 | 24.1 | 18.8 | 0 | 4 | 1.2 | 79 |
| 3652 | 12/31/2020 | 21.3 | 19.5 | 0.6 | 4 | 0 | 92 |
Phu Lien Meteorological Stations
| No. | Month/day/year | Tmax (°C) | Tmin (°C) | Rainfall (mm) | Wind speed (m·s)−1 | Sunshine hours (h) | Humidity (°C) |
|---|---|---|---|---|---|---|---|
| 1 | 01/01/2010 | 15.9 | 10.9 | 3 | 0 | 67 | |
| 2 | 01/02/2010 | 17 | 13 | 4 | 0 | 75 | |
| 3 | 01/03/2010 | 15.6 | 12.5 | 5.9 | 5 | 0 | 93 |
| 4 | 01/04/2010 | 13.7 | 10.4 | 0.5 | 4 | 0 | 91 |
| 5 | 01/05/2010 | 12.1 | 10.4 | 1.2 | 4 | 0 | 98 |
| 6 | 01/06/2010 | 11.6 | 10 | 1.4 | 5 | 0 | 96 |
| 7 | 01/07/2010 | 12.6 | 10.5 | 0.5 | 4 | 0 | 98 |
| 8 | 01/08/2010 | 14.2 | 11.5 | 0.9 | 5 | 0 | 98 |
| 9 | 01/09/2010 | 13.3 | 10.6 | 0.2 | 5 | 0 | 86 |
| 10 | 01/10/2010 | 14.4 | 10.8 | 3 | 0 | 76 | |
| 11 | 01/11/2010 | 13 | 10.6 | 4 | 0 | 78 | |
| 12 | 01/12/2010 | 14.5 | 9.2 | 0 | 5 | 0 | 84 |
| 13 | 01/13/2010 | 18.3 | 8.9 | 5 | 9 | 78 | |
| 14 | 01/14/2010 | 18.4 | 12.5 | 5 | 0 | 80 | |
| 15 | 01/15/2010 | 16.2 | 14 | 5 | 0 | 91 | |
| 16 | 01/16/2010 | 20 | 14.5 | 4 | 0 | 90 | |
| 17 | 01/17/2010 | 21.1 | 16.8 | 5 | 0 | 86 | |
| 18 | 01/18/2010 | 16.8 | 14.1 | 5 | 0 | 81 | |
| 19 | 01/19/2010 | 16.2 | 13.4 | 4 | 0 | 90 | |
| … | … | … | … | … | … | … | … |
| … | … | … | … | … | … | … | … |
| 3643 | 12/22/2020 | 18 | 16.5 | 0.1 | 3 | 0 | 99 |
| 3644 | 12/23/2020 | 24 | 17.3 | 0.2 | 4 | 2 | 96 |
| 3645 | 12/24/2020 | 25.5 | 19.2 | 4 | 3 | 94 | |
| 3646 | 12/25/2020 | 26.2 | 19.8 | 0 | 4 | 5.7 | 94 |
| 3647 | 12/26/2020 | 25.5 | 19.4 | 5 | 4.1 | 92 | |
| 3648 | 12/27/2020 | 19.4 | 15.7 | 0 | 5 | 0.1 | 82 |
| 3649 | 12/28/2020 | 24 | 15.2 | 4 | 4.5 | 80 | |
| 3650 | 12/29/2020 | 25.3 | 15.5 | 6 | 6.2 | 83 | |
| 3651 | 12/30/2020 | 25 | 17.7 | 3 | 3.4 | 89 | |
| 3652 | 12/31/2020 | 21.6 | 18.6 | 0.2 | 5 | 0 | 90 |
Son Tay Meteorological Stations
| No. | Month/day/year | Tmax (°C) | Tmin (°C) | Rainfall (mm) | Wind speed (m·s−1) | Sunshine hours (h) | Humidity °C) |
|---|---|---|---|---|---|---|---|
| 1 | 01/01/2010 | 15 | 12 | 1 | 0 | 69 | |
| 2 | 01/02/2010 | 15.5 | 12.7 | 2 | 0 | 80 | |
| 3 | 01/03/2010 | 14.6 | 13 | 1.4 | 1 | 0 | 92 |
| 4 | 01/04/2010 | 13.6 | 10.3 | 1 | 0 | 86 | |
| 5 | 01/05/2010 | 10.7 | 9.3 | 2.2 | 1 | 0 | 98 |
| 6 | 01/06/2010 | 12.5 | 9.1 | 1.5 | 1 | 0 | 93 |
| 7 | 01/07/2010 | 12.9 | 10.4 | 0.2 | 1 | 0 | 91 |
| 8 | 01/08/2010 | 12.4 | 10.5 | 2.2 | 2 | 0 | 96 |
| 9 | 01/09/2010 | 13.6 | 11 | 1.3 | 2 | 0 | 92 |
| 10 | 01/10/2010 | 15.5 | 12 | 1 | 0 | 77 | |
| 11 | 01/11/2010 | 13.4 | 11.5 | 1 | 0 | 74 | |
| 12 | 01/12/2010 | 14.9 | 10.6 | 0.5 | 2 | 0 | 84 |
| 13 | 01/13/2010 | 17 | 10 | 4 | 0.2 | 86 | |
| 14 | 01/14/2010 | 15.7 | 13 | 1 | 0 | 87 | |
| 15 | 01/15/2010 | 16 | 13.4 | 0.5 | 1 | 0 | 95 |
| 16 | 01/16/2010 | 17.5 | 14.6 | 0.4 | 1 | 0 | 97 |
| 17 | 01/17/2010 | 17 | 15.6 | 2.4 | 4 | 0 | 93 |
| 18 | 01/18/2010 | 15.8 | 13.8 | 2 | 0 | 87 | |
| 19 | 01/19/2010 | 19.1 | 13 | 1 | 0 | 84 | |
| … | … | … | … | … | … | … | … |
| … | … | … | … | … | … | … | … |
| 3643 | 12/22/2020 | 17.1 | 15.9 | 2 | 2 | 0 | 94 |
| 3644 | 12/23/2020 | 20.2 | 15.5 | 0.1 | 2 | 0 | 94 |
| 3645 | 12/24/2020 | 24 | 18.8 | 0.1 | 2 | 0.9 | 90 |
| 3646 | 12/25/2020 | 27.5 | 20.9 | 3 | 4.4 | 82 | |
| 3647 | 12/26/2020 | 25.5 | 18.6 | 2.3 | 5 | 1.4 | 86 |
| 3648 | 12/27/2020 | 18.6 | 15 | 0.2 | 3 | 0 | 73 |
| 3649 | 12/28/2020 | 18.4 | 15.3 | 2 | 0 | 74 | |
| 3650 | 12/29/2020 | 22.6 | 15 | 2 | 6.1 | 76 | |
| 3651 | 12/30/2020 | 23.5 | 17.7 | 3 | 2.2 | 80 | |
| 3652 | 12/31/2020 | 22.1 | 19.4 | 0.1 | 2 | 0 | 84 |
Tam Đao Meteorological Stations
| No. | Month/day/year | Tmax (°C) | Tmin (°C) | Rainfall (mm) | Wind speed (m·s−1) | Sunshine hours (h) | Humidity (°C) |
|---|---|---|---|---|---|---|---|
| 1 | 01/01/2010 | 7.6 | 5.2 | 4 | 0 | 80 | |
| 2 | 01/02/2010 | 11 | 7.2 | 0.3 | 4 | 0 | 99 |
| 3 | 01/03/2010 | 12.4 | 7.1 | 2.7 | 11 | 0 | 100 |
| 4 | 01/04/2010 | 8.5 | 6.5 | 0.6 | 6 | 0 | 100 |
| 5 | 01/05/2010 | 8.7 | 7.6 | 0.9 | 4 | 0 | 100 |
| 6 | 01/06/2010 | 8.4 | 6.2 | 1.4 | 2 | 0 | 100 |
| 7 | 01/07/2010 | 9 | 6.7 | 0.5 | 4 | 0 | 100 |
| 8 | 01/08/2010 | 9.7 | 7.5 | 1.5 | 4 | 0 | 100 |
| 9 | 01/09/2010 | 7.6 | 4.5 | 1.5 | 12 | 0 | 92 |
| 10 | 01/10/2010 | 7.7 | 5.4 | 0.1 | 11 | 0 | 72 |
| 11 | 01/11/2010 | 6.2 | 5 | 5 | 0 | 86 | |
| 12 | 01/12/2010 | 8.4 | 4.1 | 0.5 | 11 | 0.2 | 93 |
| 13 | 01/13/2010 | 9.5 | 5.7 | 0.1 | 3 | 2.5 | 97 |
| 14 | 01/14/2010 | 11.2 | 7.9 | 6 | 0 | 96 | |
| 15 | 01/15/2010 | 13 | 10.3 | 1.5 | 7 | 0 | 100 |
| 16 | 01/16/2010 | 13.3 | 12 | 0.4 | 7 | 0 | 100 |
| 17 | 01/17/2010 | 13.3 | 9 | 1.7 | 11 | 0 | 100 |
| 18 | 01/18/2010 | 9.8 | 8 | 0.8 | 11 | 0 | 100 |
| 19 | 01/19/2010 | 11.4 | 8.7 | 0.1 | 6 | 0 | 99 |
| … | … | … | … | … | … | … | … |
| … | … | … | … | … | … | … | … |
| 3643 | 12/22/2020 | 15.6 | 14.6 | 2.4 | 4 | 0 | 96 |
| 3644 | 12/23/2020 | 16 | 14.6 | 3.4 | 4 | 0 | 97 |
| 3645 | 12/24/2020 | 17.8 | 15.6 | 0.2 | 5 | 1.2 | 98 |
| 3646 | 12/25/2020 | 18.1 | 16.7 | 0.7 | 6 | 0.7 | 97 |
| 3647 | 12/26/2020 | 18 | 13.4 | 4.1 | 11 | 0 | 95 |
| 3648 | 12/27/2020 | 13.4 | 9.7 | 0.3 | 11 | 0 | 88 |
| 3649 | 12/28/2020 | 13.8 | 9.6 | 0.1 | 4 | 0 | 93 |
| 3650 | 12/29/2020 | 17 | 12.8 | 4 | 2.9 | 93 | |
| 3651 | 12/30/2020 | 16.4 | 13.9 | 4 | 0 | 96 | |
| 3652 | 12/31/2020 | 16.7 | 15.3 | 8 | 0 | 86 |
Thai Binh Meteorological Stations
| No. | Month/day/year | Tmax (°C) | Tmin (°C) | Rainfall (mm) | Wind speed (m·s−1) | Sunshine hours (h) | Humidity (°C) |
|---|---|---|---|---|---|---|---|
| 1 | 01/01/2010 | 16.6 | 11.6 | 4 | 0 | 66 | |
| 2 | 01/02/2010 | 18.1 | 13.6 | 3 | 0 | 75 | |
| 3 | 01/03/2010 | 17 | 12.2 | 0.6 | 8 | 0 | 92 |
| 4 | 01/04/2010 | 13.7 | 10 | 0 | 5 | 0 | 90 |
| 5 | 01/05/2010 | 11.1 | 8.8 | 0.1 | 5 | 0 | 98 |
| 6 | 01/06/2010 | 11.9 | 8.8 | 1.3 | 7 | 0 | 90 |
| 7 | 01/07/2010 | 12 | 10.4 | 0.7 | 5 | 0 | 96 |
| 8 | 01/08/2010 | 13.2 | 10.7 | 0.5 | 5 | 0 | 96 |
| 9 | 01/09/2010 | 13 | 10.5 | 0.6 | 7 | 0 | 86 |
| 10 | 01/10/2010 | 14.7 | 11.4 | 5 | 0 | 67 | |
| 11 | 01/11/2010 | 13 | 10.9 | 7 | 0 | 72 | |
| 12 | 01/12/2010 | 14.2 | 8.9 | 9 | 0 | 80 | |
| 13 | 01/13/2010 | 18.7 | 9.7 | 6 | 8 | 76 | |
| 14 | 01/14/2010 | 18 | 12 | 3 | 0 | 86 | |
| 15 | 01/15/2010 | 16.2 | 14.5 | 0 | 5 | 0 | 92 |
| 16 | 01/16/2010 | 19.2 | 15.2 | 0 | 5 | 0 | 92 |
| 17 | 01/17/2010 | 20 | 16.7 | 1 | 6 | 0 | 91 |
| 18 | 01/18/2010 | 17 | 13.5 | 5 | 0 | 82 | |
| 19 | 01/19/2010 | 15.9 | 13 | 5 | 0 | 93 | |
| … | … | … | … | … | … | … | … |
| … | … | … | … | … | … | … | … |
| 3643 | 12/22/2020 | 18.1 | 16.3 | 0.1 | 3 | 0 | 96 |
| 3644 | 12/23/2020 | 26.7 | 17.4 | 4 | 4.4 | 90 | |
| 3645 | 12/24/2020 | 25.5 | 20 | 4 | 1.8 | 91 | |
| 3646 | 12/25/2020 | 27.2 | 20.6 | 9 | 7.3 | 86 | |
| 3647 | 12/26/2020 | 25.4 | 19.8 | 0 | 8 | 3.3 | 87 |
| 3648 | 12/27/2020 | 21.2 | 16.1 | 7 | 0 | 67 | |
| 3649 | 12/28/2020 | 22.8 | 14.8 | 6 | 2.3 | 70 | |
| 3650 | 12/29/2020 | 26.1 | 15.7 | 5 | 7 | 76 | |
| 3651 | 12/30/2020 | 25 | 17.6 | 5 | 1.5 | 84 | |
| 3652 | 12/31/2020 | 21.6 | 19 | 3 | 0 | 88 |
Vinh Yen Meteorological Stations
| No. | Month/day/year | Tmax (°C) | Tmin (°C) | Rainfall (mm) | Wind speed (m·s−1) | Sunshine hours (h) | Humidity (%) |
|---|---|---|---|---|---|---|---|
| 1 | 01/01/2010 | 15.1 | 12.5 | 3 | 0 | 64 | |
| 2 | 01/02/2010 | 15.8 | 13.4 | 3 | 0 | 75 | |
| 3 | 01/03/2010 | 15.2 | 13.5 | 2.9 | 4 | 0 | 90 |
| 4 | 01/04/2010 | 14 | 11 | 5 | 0 | 82 | |
| 5 | 01/05/2010 | 12.2 | 9.2 | 0.5 | 5 | 0 | 90 |
| 6 | 01/06/2010 | 12.2 | 9.7 | 1 | 4 | 0 | 92 |
| 7 | 01/07/2010 | 13 | 11 | 0.2 | 3 | 0 | 86 |
| 8 | 01/08/2010 | 13 | 11.2 | 2.5 | 3 | 0 | 95 |
| 9 | 01/09/2010 | 14 | 11.9 | 1.8 | 5 | 0 | 88 |
| 10 | 01/10/2010 | 15.8 | 12.4 | 3 | 0 | 74 | |
| 11 | 01/11/2010 | 14 | 12 | 4 | 0 | 66 | |
| 12 | 01/12/2010 | 15.3 | 11.2 | 0.1 | 5 | 0 | 82 |
| 13 | 01/13/2010 | 17.5 | 9.4 | 0.1 | 5 | 4 | 82 |
| 14 | 01/14/2010 | 16.2 | 11 | 3 | 0 | 84 | |
| 15 | 01/15/2010 | 15.6 | 13.8 | 0.4 | 3 | 0 | 95 |
| 16 | 01/16/2010 | 17.9 | 15 | 1 | 3 | 0 | 92 |
| 17 | 01/17/2010 | 17.3 | 16.2 | 4.6 | 6 | 0 | 89 |
| 18 | 01/18/2010 | 15.1 | 12.5 | 3 | 0 | 64 | |
| 19 | 01/19/2010 | 15.8 | 13.4 | 3 | 0 | 75 | |
| … | … | … | … | … | … | … | … |
| … | … | … | … | … | … | … | … |
| 3643 | 12/22/2020 | 17.8 | 15.6 | 3 | 3 | 0 | 92 |
| 3644 | 12/23/2020 | 21.3 | 16.1 | 0.4 | 3 | 0 | 94 |
| 3645 | 12/24/2020 | 25 | 19.2 | 0.2 | 2 | 0.5 | 92 |
| 3646 | 12/25/2020 | 28.4 | 21.3 | 5 | 3.3 | 84 | |
| 3647 | 12/26/2020 | 25.4 | 19.6 | 0.7 | 7 | 1.3 | 80 |
| 3648 | 12/27/2020 | 19.6 | 16.4 | 6 | 0 | 78 | |
| 3649 | 12/28/2020 | 18.6 | 16 | 3 | 0 | 80 | |
| 3650 | 12/29/2020 | 23.4 | 15.6 | 4 | 5.8 | 82 | |
| 3651 | 12/30/2020 | 23.6 | 17.8 | 4 | 2.8 | 86 | |
| 3652 | 12/31/2020 | 22.9 | 19.5 | 3 | 0 | 88 |
Appendix 2: Details of Meteorological Stations
| No. | Name of meteorological stations | Coordinates | |
|---|---|---|---|
| X | Y | ||
| 1 | Son Tay | 21°08′N | 105°30′E |
| 2 | Lang | 21°01′ N | 105°48′ E |
| 3 | Ba Vi | 21°06′ N | 105°32′ E |
| 4 | Ha Đong | 20°58′ N | 105°46′ E |
| 5 | Vinh Yen | 21°19′ N | 105°36′ E |
| 6 | Tam Đao | 21°28′ N | 105°39′ E |
| 7 | Bac Ninh | 21°11′ N | 106°05′ E |
| 8 | Hai Duong | 20°56′ N | 106°18′ E |
| 9 | Chi Linh | 21°07′ N | 106°28′ E |
| 10 | Phu Lien | 20°48′ N | 106°38′ E |
| 11 | Hon Dau | 20°70′ N | 106°78′ E |
| 12 | Hung Yen | 20°39′ N | 106°03′ E |
| 13 | Thai Binh | 20°27′ N | 106°21′ E |
| 14 | Ba Lat | 20°30′ N | 106°55′ E |
| 15 | Ha Nam | 20°33′ N | 105°55′ E |
| 16 | Nam Đinh | 20°24′ N | 106°09′ E |
| 17 | Van Ly | 20°15′ N | 106°30′ E |
| 18 | Ninh Binh | 20°14′ N | 105°58′ E |
| 19 | Nho Quan | 20°19′ N | 105°45′ E |
| 20 | Cuc Phuong | 20°14′ N | 105°43′ E |
| 21 | Uong Bi | 21°04′ N | 106°75′ E |
| 22 | Bac Giang | 21°27′ N | 106°18′ E |
| 23 | Hiep Hoa | 21°37′ N | 105°97′ E |
| 24 | Viet Tri | 21°18′ N | 105°25′ E |
| 25 | Phu Ho | 21°27′ N | 105°14′ E |
| 26 | Kim Boi | 20°70′ N | 105°52′ E |
| 27 | Chi Ne | 20°49′ N | 105°67′ E |
| 28 | Lac Son | 20°43′ N | 105°39′ E |
Appendix 3: Input Data Processing and Steps of Model Running
A. Climate Data
Data for the years from 2010 to 2020 at 28 traditional meteorological stations in the network of national monitoring of Viet Nam Meteorological and Hydrological Administration. These stations ensure measurements on a unified basis, serve for basic investigation. Collected data includes station coordinates, day’s maximum temperature (°C), day's minimum temperature (°C), total daily sunshine hours (h), wind direction and speed (m·s−1), daily rainfall (mm), and humidity (%) (from Vietnam Meteorological and Hydrological Aministration). The sunshine hours per day is calculated and converted into units of solar radiation intensity (unit: Mj·m−2·day−1). Meteorological data is processed, aggregated by year, each meteorological region and saved as *.txt. The data are sorted by day, in order from left to right as follows: day of year, maximum temperature (Tmax), minimum temperature (Tmin), precipitation (Rainfall), wind speed (Vmax), solar radiation intensity (Rn), humidity (Huminity). (Figure A1)

Example of climate data that is one of input data of DNDC model.
B. Soil Data
Soil data is collected and entered directly into the model, including: Bulk density, pH, OC, drainage efficiency, depth of water retention layer, field capacity, wilting point, clay fraction, conductivity, porosity, microbial activity index, soil salinity index, rainwater collection index, initial nitrate concentration at surface soil, initial ammonium concentration at surface soil, N, P2O5, K2O (%), etc. (Figure A2)
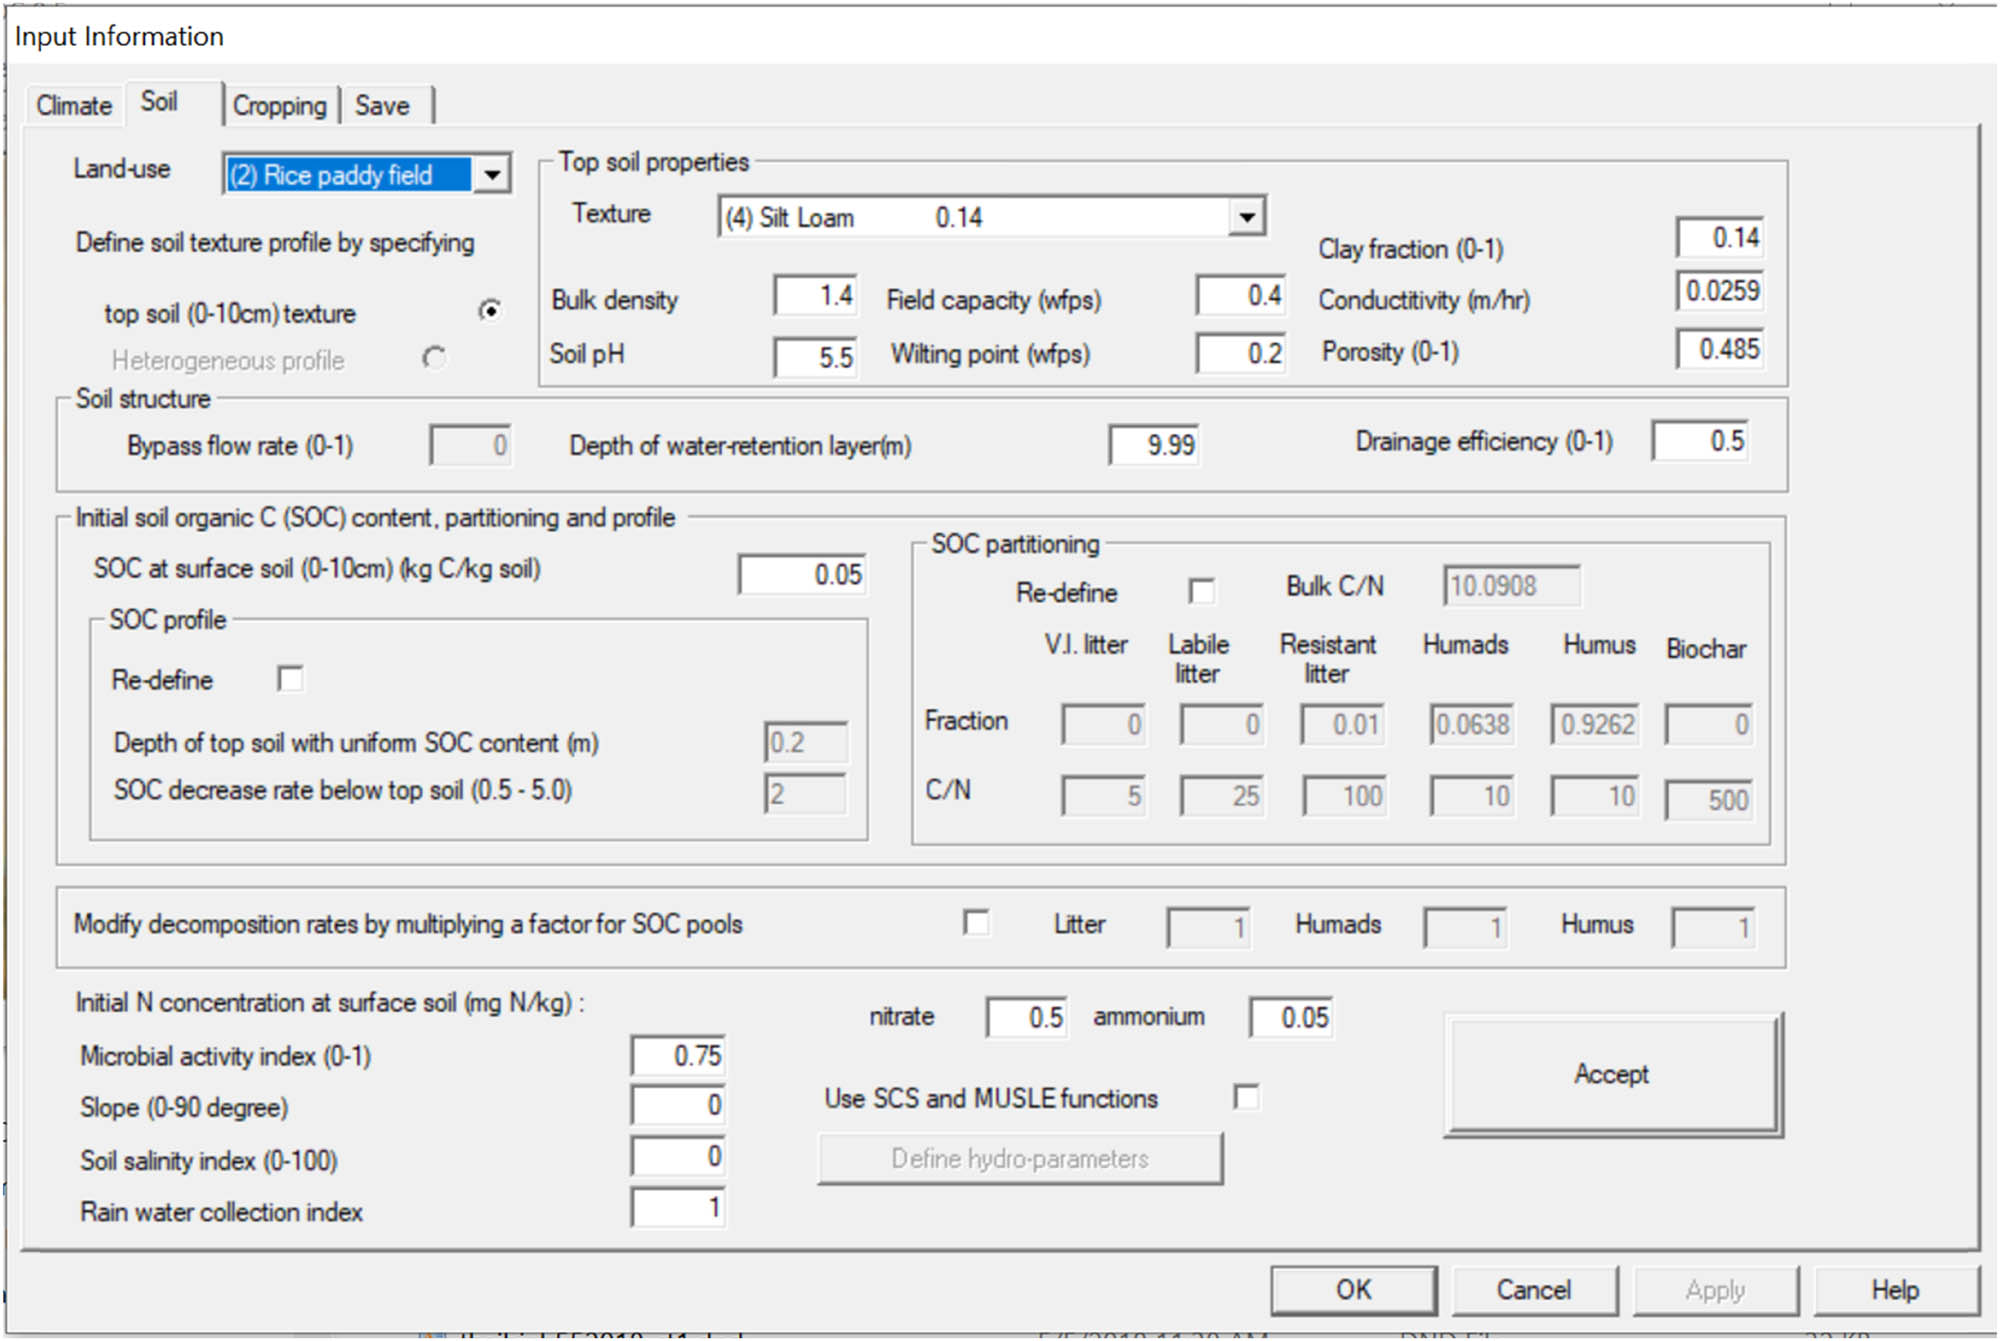
Example of soil data that is one of input data of DNDC model.
C. Crop Data
Crop data is collected and entered directly into the model, including: seeds, physiological and biochemical characteristics; seasonal calendar; farming techniques; types and characteristics of fertilizers, etc. (Figures A3, A4, A5, A6)

Example of crop data that is one of input data of DNDC model.
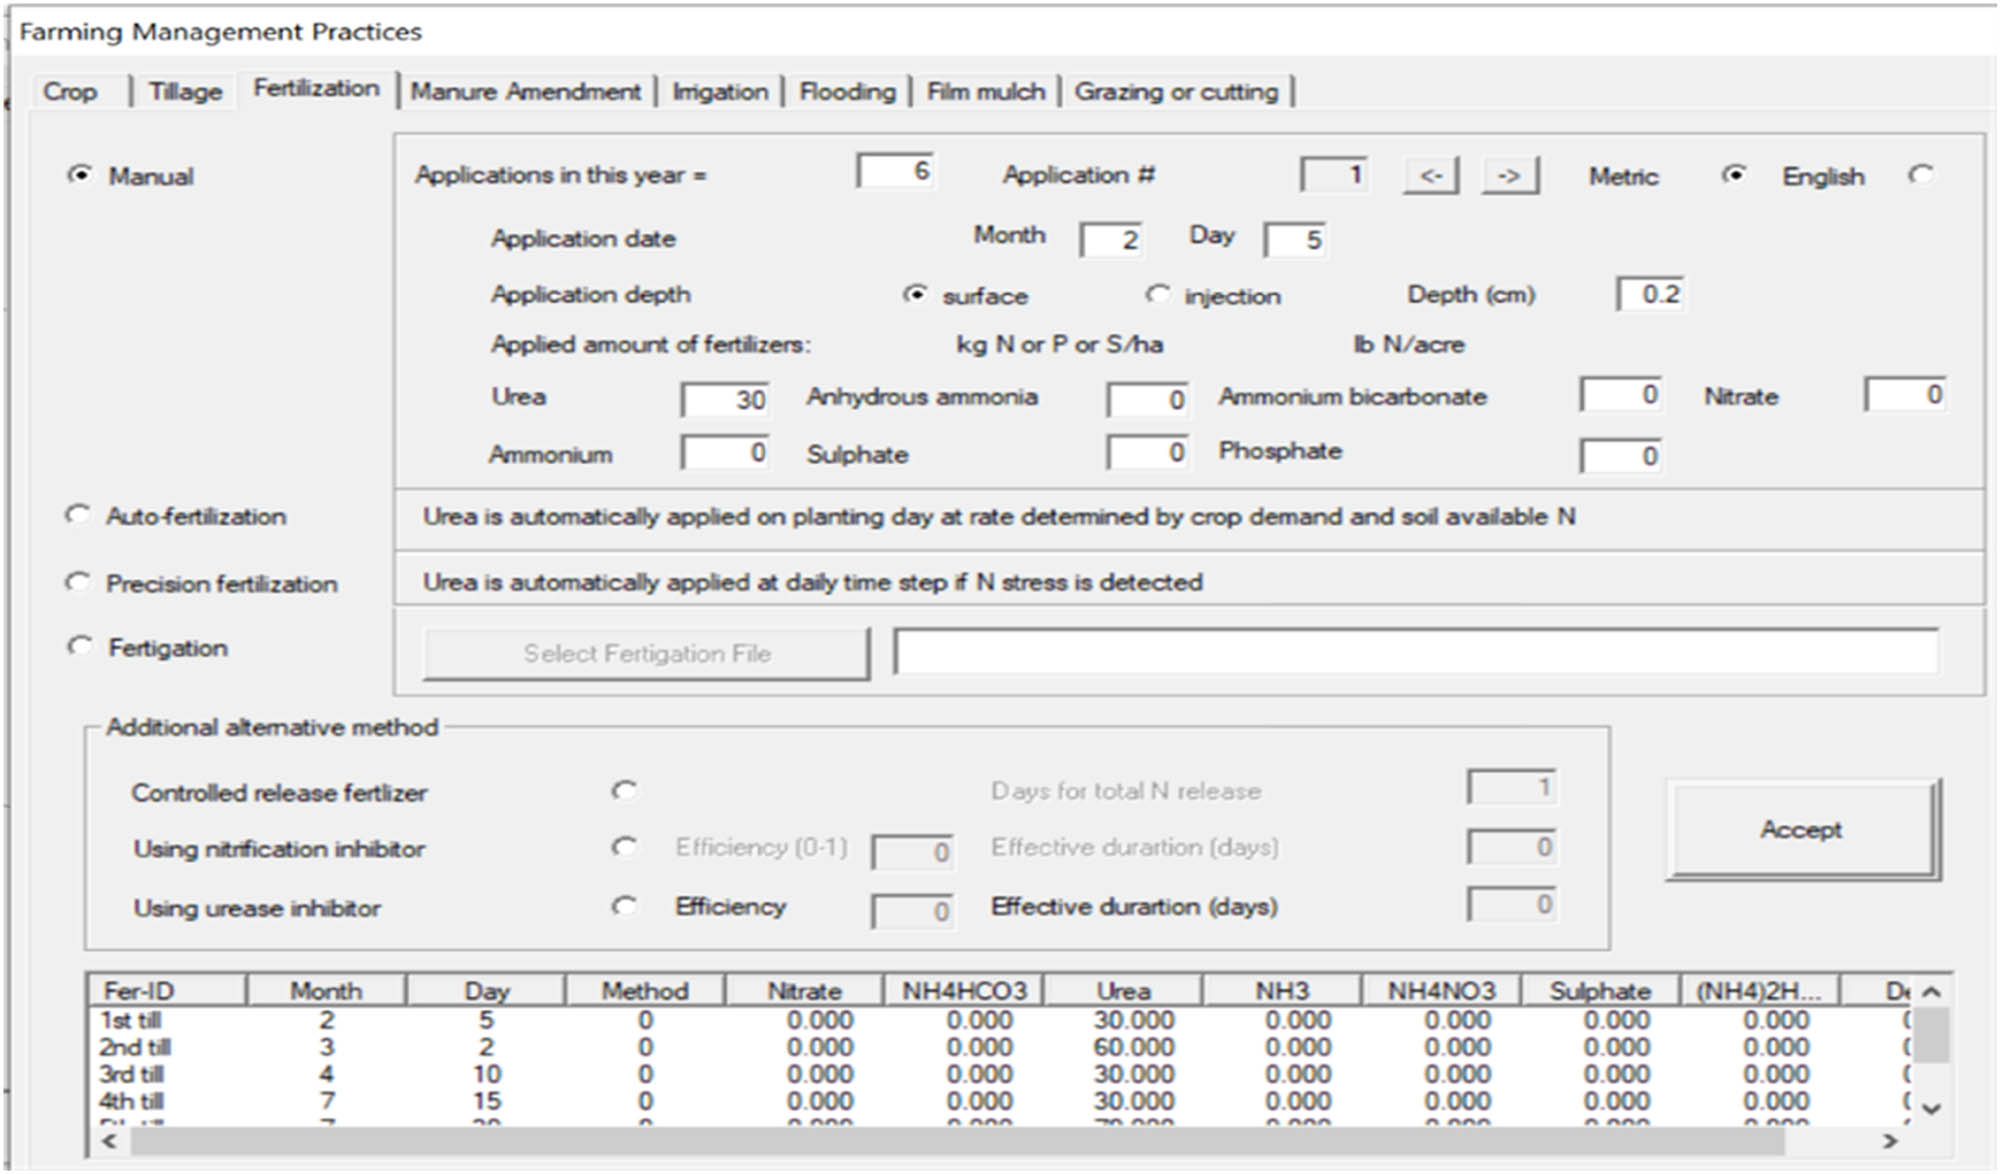
Example of fertilization that is one of input data of DNDC mode.l.
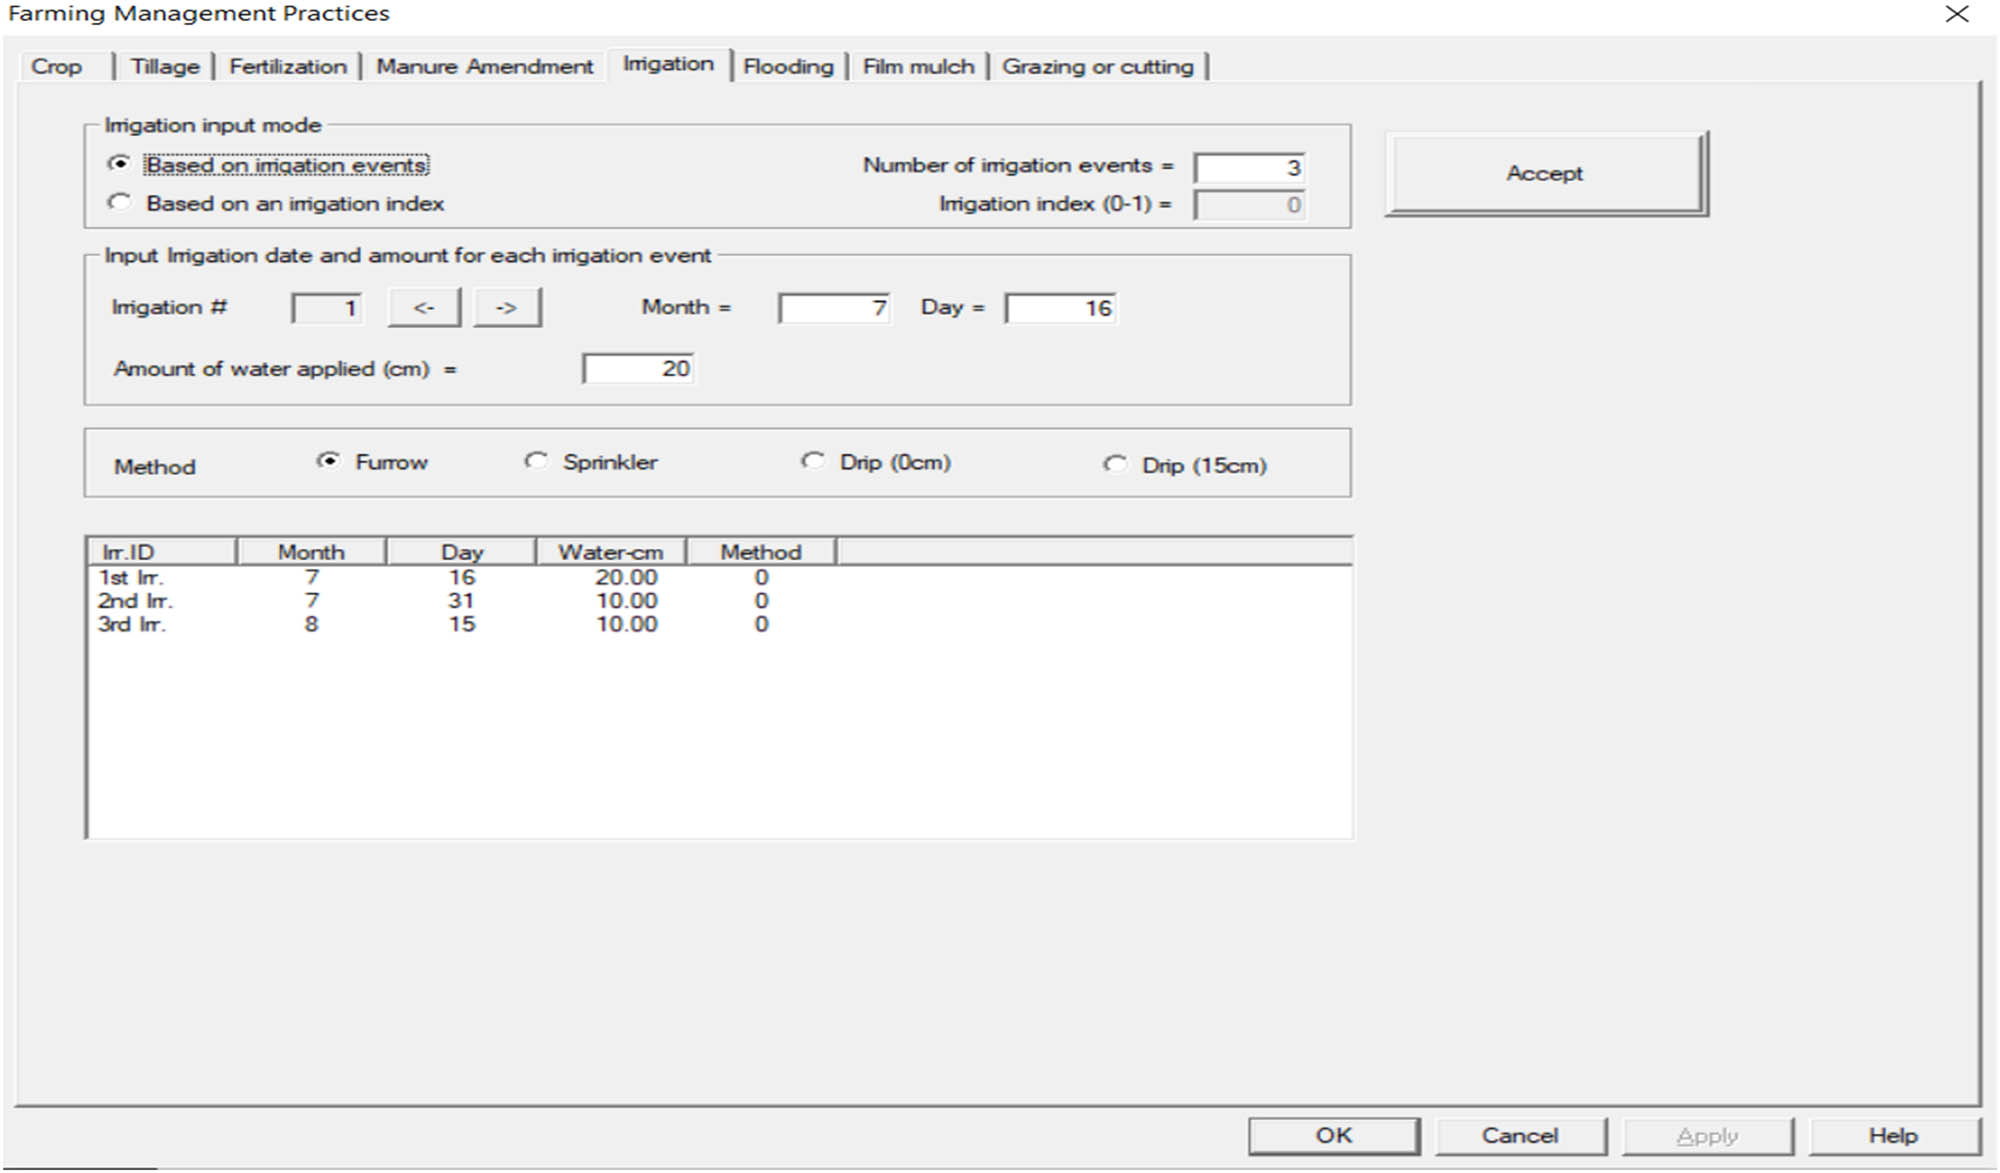
Example of irrigation that is one of input data of DNDC model.
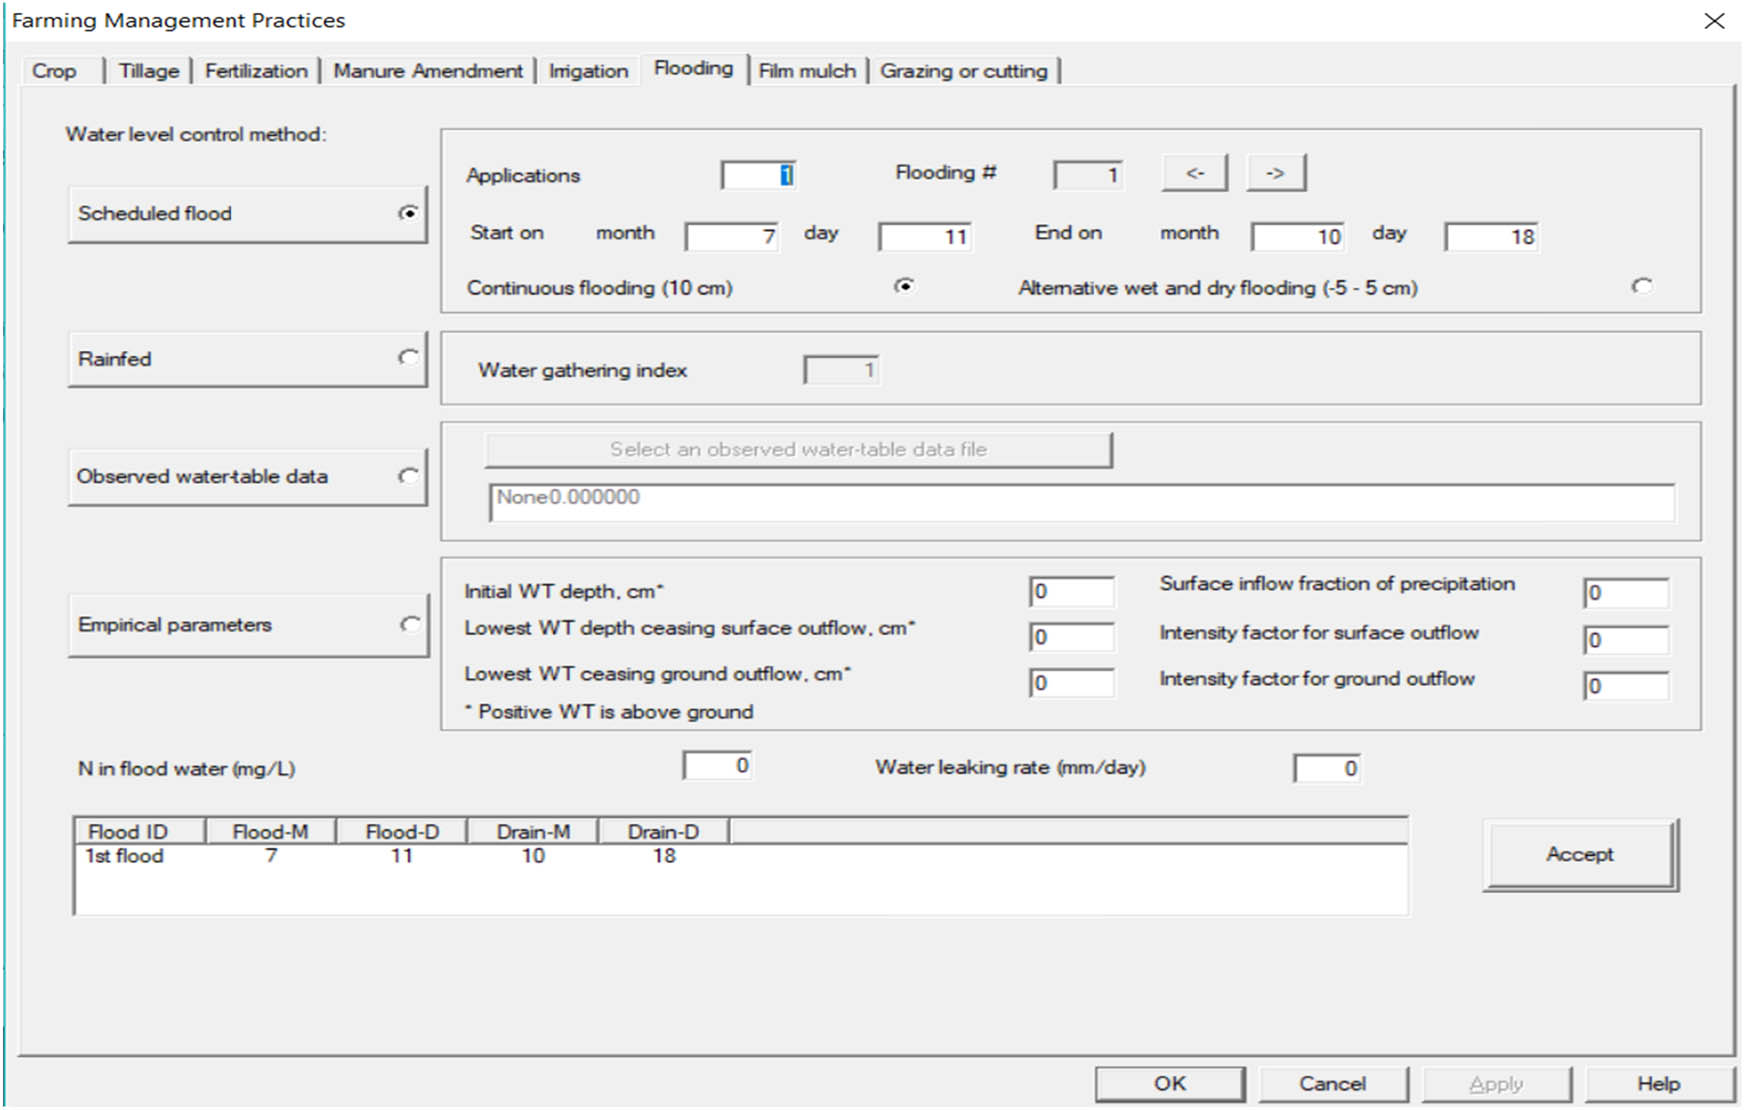
Example of flooding that is one of input data of DNDC model.
D. Steps of Model Running
Running DNDC model includes 04 main steps:
− Step 1: Enter the input parameters, including:
+ Import meteorological data: Go to "Climate" to create a file name, enter the coordinates of the study area and select the meteorological file of the study area;
+ Enter soil data: Go to "Soil" to select soil type, pH, SOC, NO3, NH4 +, soil salinity, and some other parameters;
+ Input crop data: Go to “Croping” to enter data on tillage, crop, watering, fertilizer, flooding, etc. (Figure A7)

Example of step 1 – Importing meteorological data.
− Step 2: Save the model running file as *, dnd. (Figure A8)

Example of step 2 – Save the running file.
− Step 3: Run the model. (Figure A9)

Example of step 3 – Run the model.
− Step 4: View model results. (Figures A10 and A11)

Example of step 4 – View results.

Example of step 4 – View results.
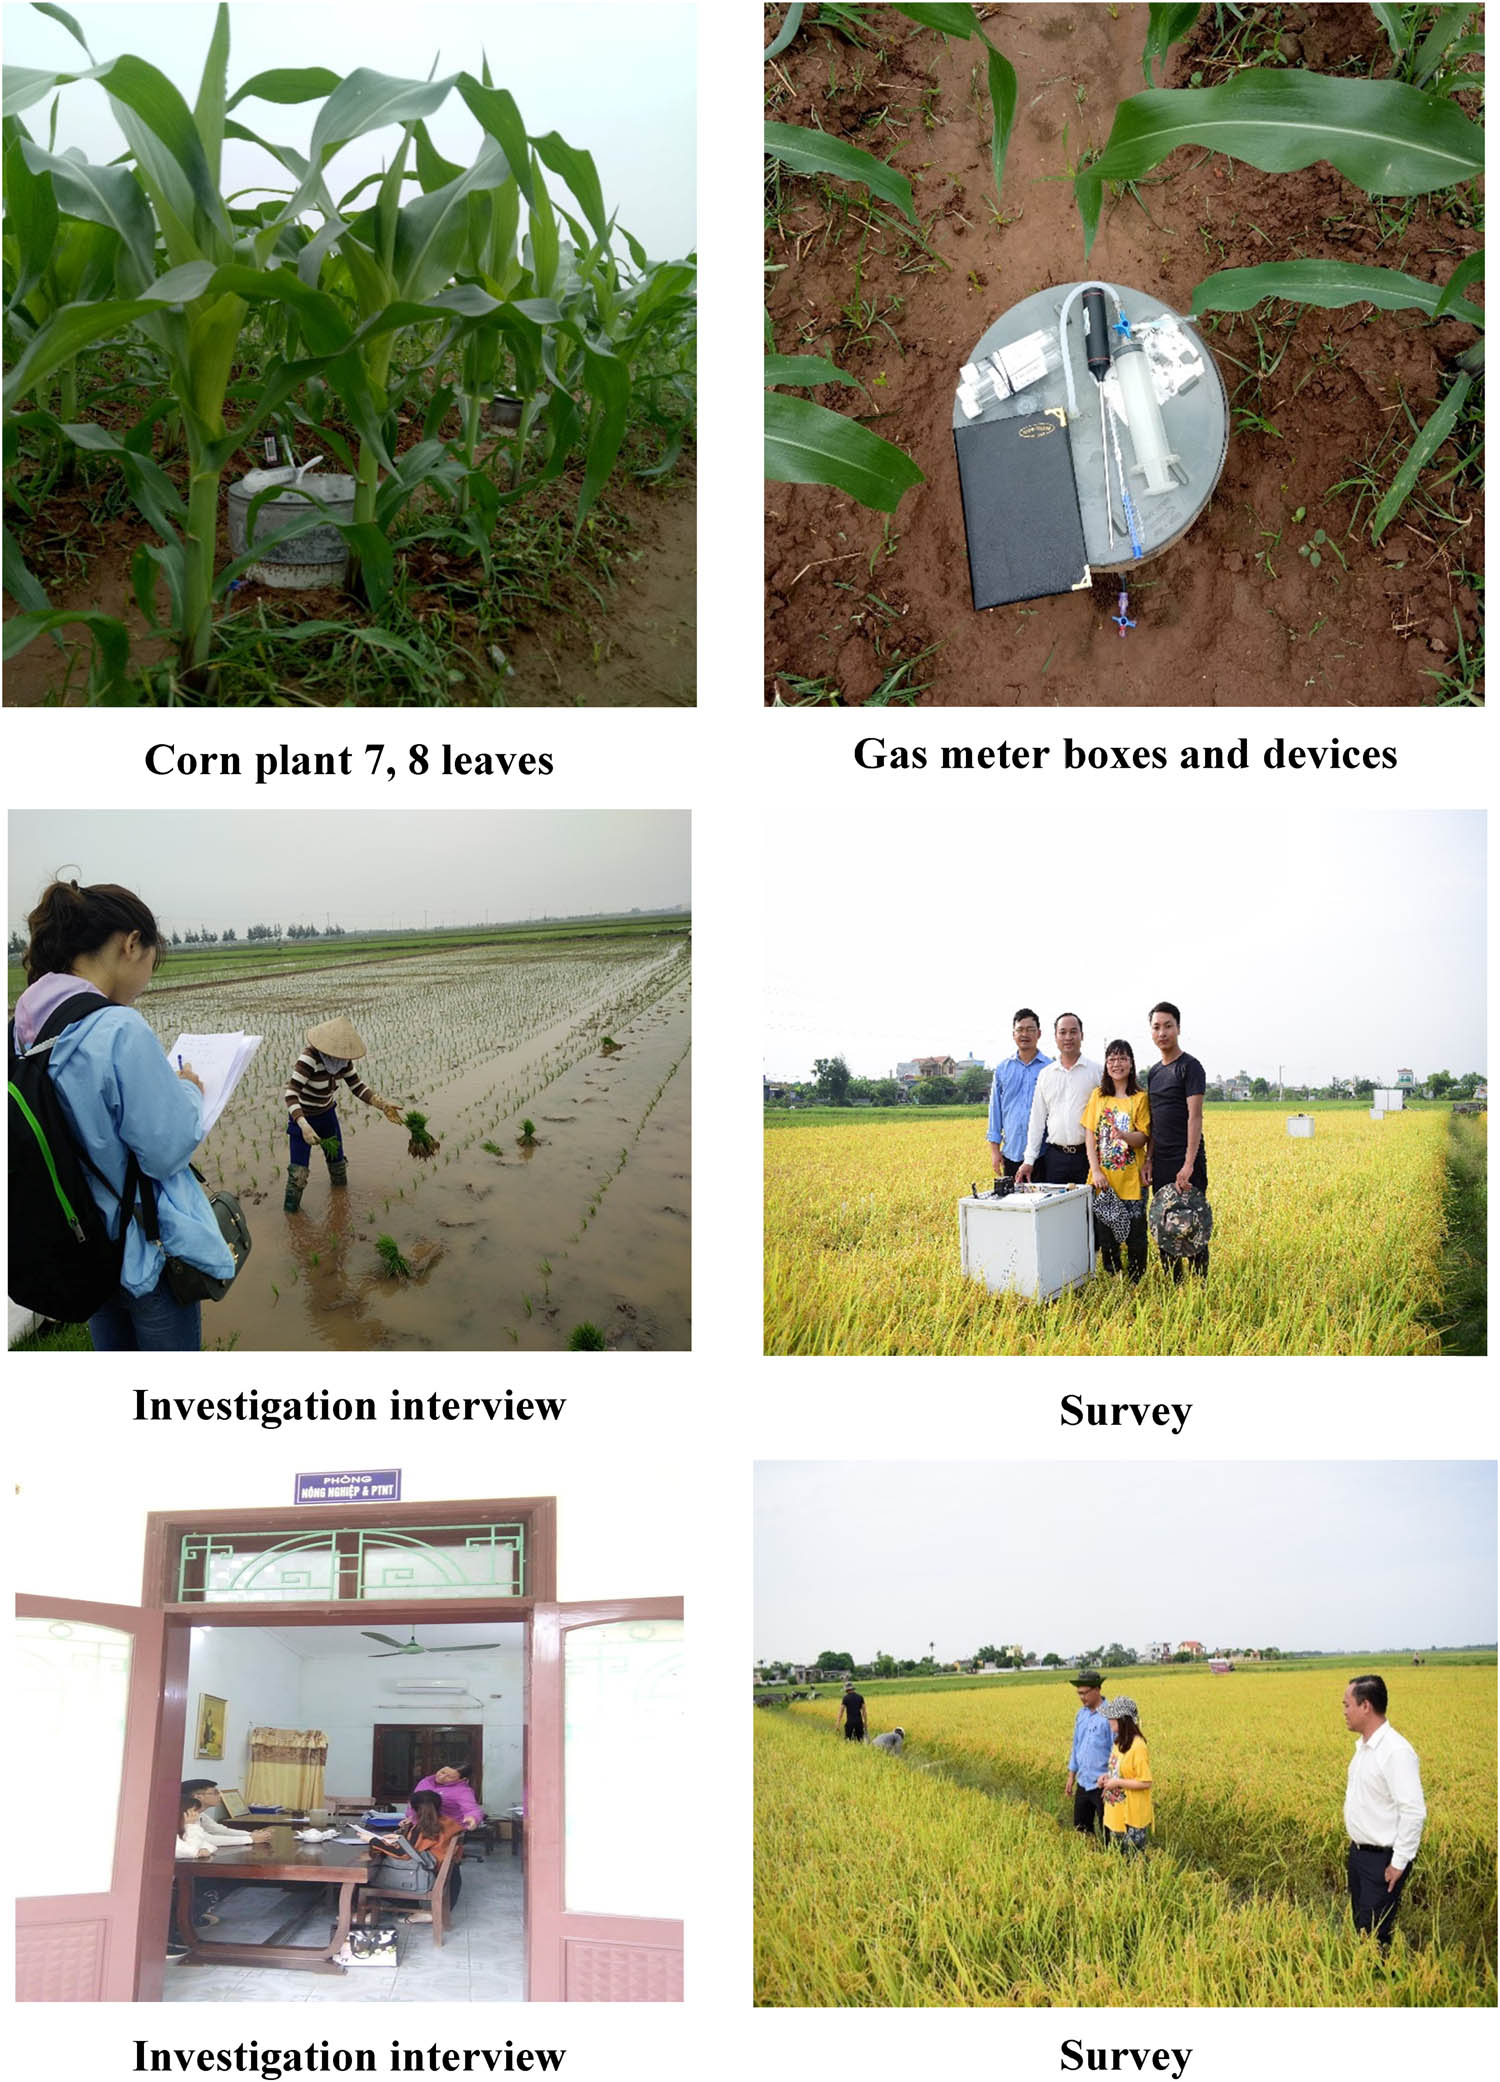
Appendix 4 Conducting Research Pictures


References
[1] Intergovernmental Panel on Climate Change (IPCC). Revised 1996 IPCC Guidelines for National Greenhouse Gas Inventories: Reference Manual. Vol. 3. Bracknell, UK; 1997.Search in Google Scholar
[2] Mai VT. Research on some adaptation measures and potential mitigation to climate change in agricultural production. J Agric Rural Dev. 2013;3:28–36.Search in Google Scholar
[3] Li C, Frolking S, Frolking TA. A model of Nitrous oxide evolution from soil driven by rainfall events: Model structure and sensitivity. Geophys Res. 1992;97:9759–76.10.1029/92JD00509Search in Google Scholar
[4] Li C, Frolking S, Harris R. Modelling carbon biogeochemistry in agricultural soils. Glob Biogeochem Cycles. 1994;8:237–54.10.1029/94GB00767Search in Google Scholar
[5] Li C. Modelling trace gas emissions from agricultural ecosystems. Nutr Cycl Agro-ecosyst. 2000;58:259–76.10.1007/978-94-010-0898-3_20Search in Google Scholar
[6] Li C, Narayanan V, Harriss R. Model estimate of N2O emissions from agricultural lands in the United States. Glob Bio-geophys Cycles. 1996;10:297–306.10.1029/96GB00470Search in Google Scholar
[7] Bouwman AF, Boumans LJM, Batjes NH. Emissions of N2O and NO from fertilized fields: Summary of available measurement data. Glob Biogeochem Cycles. 2002;16(4):1058. 10.1029/2001GB001811.Search in Google Scholar
[8] Cai Z, Sawamoto T, Li C, Kang G, Boonjawat J, Mosier A, et al. Field validation of the DNDC model for greenhouse gas emissions in East Asian cropping systems. Glob Biogeochem Cycles. 2003;17(4):1107. 10.1029/2003GB002046.Search in Google Scholar
[9] Babu YJ, Li CS, Frolking S, Nayak DR, Adhya TK. Field validation of DNDC model for methane and Nitrous oxide emissions from rice based production systems of India. Nutr Cycl Agroecosys. 2006;74:157–74.10.1007/s10705-005-6111-5Search in Google Scholar
[10] Pathak H, Li C, Wassmann R. Greenhouse gas emissions from Indian rice fields: calibration and upscaling using the DNDC model. Biogeosciences. 2005;2:113–23.10.5194/bg-2-113-2005Search in Google Scholar
[11] Cai Z, Shan Y, Xu H. Effects of nitrogen fertilization on CH4 emissions from rice fields. Soil Sci Plant Nutr. 2007;53:353–61.10.1111/j.1747-0765.2007.00153.xSearch in Google Scholar
[12] Li C, Farahbakhshazad N, Jaynes DB, Dinnes DL, Salas W, McLaugHMin D. Modeling nitrate leaching with a biogeochemical model modified based on observations in a row-crop field in Iowa. Ecol Model. 2006;196:116–30.10.1016/j.ecolmodel.2006.02.007Search in Google Scholar
[13] Li H, Qiu J, Wang L, Tang H, Li C, Van Ranst E. Modelling impacts of alternative farming management practices on greenhouse gas emissions from a winter wheat–maize rotation system in China. J Agric Ecosyst Environ. 2010;135(1–2):24–33. 10.1016/j.agee.2009.08.003.Search in Google Scholar
[14] Fumoto T, Yanagihara T, Saito T, Yagi K. Assessment of the methane mitigation potentials of alternative water regimes in rice fields using a process-based biogeochemistry model. Glob Change Biol. 2010;16(6):1847–59. 10.1111/j.1365-2486.2009.02050.Search in Google Scholar
[15] Smith WN, Grant BB, Desjardins RL, Worth D, Li C, Boles SH, et al. A tool to link agricultural activity data with the DNDC model to estimate GHG emission factors in Canada. Agric Ecosyst Environ. 2010;136:301–9.10.1016/j.agee.2009.12.008Search in Google Scholar
[16] Zhang Y, Wang YY, Su SL, Li C. Quantifying methane emissions from rice paddies in Northeast China by integrating remote sensing mapping with a biogeochemical model. Biogeosciences. 2011;8(5):1225–35.10.5194/bg-8-1225-2011Search in Google Scholar
[17] Zhang Y, Niu H, Wang S, Xu K, Wang R. Application of the DNDC model to estimate N2O emissions under different types of irrigation in vineyards in Ningxia, China. Agric Water Manag. 2016;163:295–304.10.1016/j.agwat.2015.10.006Search in Google Scholar
[18] Zhao Z, Cao L, Deng J, Sha Z, Chu C, Zhou D, et al. Modeling CH4 and N2O emission patterns and mitigation potential from paddy fields in Shanghai, China with the DNDC model. Agric Syst. 2020;178.10.1016/j.agsy.2019.102743Search in Google Scholar
[19] Statistical report of the Ministry of Agriculture and Rural Development; 2017. https://www.mard.gov.vn/Pages/bao-cao-thong-ke.aspx.Search in Google Scholar
[20] Rochette P, Eriksen-Hamel NS. Chamber measurements of soil nitrous oxide flux: Are absolute values reliable? Soil Sci Soc Am J. 2008;72(2):331–42.19.10.2136/sssaj2007.0215Search in Google Scholar
[21] Ma BL, Liang BC, Biswas DK, Morrison MJ, McLaughlin NB. The carbon footprint of maize production as affected by nitrogen and maize-legume rotations. J Nutr Cycl Agroecosyst. 2012;94(1):15–31.16.10.1007/s10705-012-9522-0Search in Google Scholar
[22] Lindau CW, Bollich PK, DeLaune RD, Patrick WH, Jr, Law VJ. Effect of Urea Fertilizer and Environmental Factors on CH4 Emissions from a Louisiana. U.S.A. Rice field. Plant Soil. 1991;136:195–203.10.1007/BF02150050Search in Google Scholar
[23] DNDC Guideline. User’s Guide for DNDC Model 9.5. Institute for the Study of Earth, Oceans and Space University of New Hampshire; 2012.Search in Google Scholar
[24] Krause P, Boyle DP, Bäse F. Comparison of different efficiency criteria for hydrological model assessment. Adv Geosci. 2005;5:89–99.10.5194/adgeo-5-89-2005Search in Google Scholar
[25] Nash JE, Suttcliffe JV. River flow forecasting through conceptual models, Part 1. A discussion of principles. J Hydrol. 1970;10(3):282.10.1016/0022-1694(70)90255-6Search in Google Scholar
[26] Mai VT, Bui TPL, Vu DQ, Cao VP, Tran KT, Pham QH, et al. Handbook on measuring greenhouse gas emissions from paddy rice fields in Vietnam. Institute for Agricultural Environment (IAE). Agricultural Publisher; 2016.Search in Google Scholar
[27] Adhya TK, Bharati K, Mohanty SR, Ramakrishnan B, Rao VR, Sethunathanan N, et al. Methane emission from rice field at Cuttack, India. Nutr Cycl Agroecosyst. 2000;58:95–105.10.1007/978-94-010-0898-3_9Search in Google Scholar
[28] Lu WF, Chen W, Duan BW, Guo WM, Lu Y, Lantin RS, et al. Methane emissions and mitigation options in irrigated rice fields in southeast China. Nutr Cycl Agroecosystems. 2000;58:65–73.10.1007/978-94-010-0898-3_6Search in Google Scholar
[29] Sass RL, Fisher FM, Harcombe PA, Tumer FT. Methane production and emission in a Texas rice field. Glob Biogeochem Cycles. 1990;4:7–68.10.1029/GB004i001p00047Search in Google Scholar
[30] Yagi K, Tsuruta H, Kanda K, Minami K. Effect of water management on methane emission from Japanese rice paddy field: automated methane monitoring. Glob Biogeochem Cycles. 1996;10:255–67.10.1029/96GB00517Search in Google Scholar
[31] Alexander M. Introduction to soil microbiology. Vol. 469. 2nd edn. New York, Santa Barbara, London, Sydney, Toronto: John Wiley & Sons; 1977.Search in Google Scholar
[32] Ponnamperuma FN. The chemistry of submerged soils. Adv Agron. 1972;24:29–96.10.1016/S0065-2113(08)60633-1Search in Google Scholar
[33] Zou JW, Huang Y, Zong LG, Zheng XH, Wang YS. Carbon dioxide, nitrous oxide and methane emissions from a rice-winter wheat rotation system as affected by crop residue incorporation and temperature. Adv Atmos Sci. 2004;21:691–8.10.1007/BF02916366Search in Google Scholar
[34] Li C, Mosier A, Wassmann R, Cai Z, Zheng X, Huang Y, et al. Modeling greenhouse gas emissions from ricebased production systems: sensitivity and upscaling. Glob Biogeochem Cycles. 2004;18:1043.10.1029/2003GB002045Search in Google Scholar
[35] Wassmann R, Lantin RS, Neue HU, Buendia LV, Corton TM, Lu Y. Characterization of methane emissions from rice fields in Asia, III. Mitigation options and future research needs. Nutr Cycl Agroecosyst. 2000;58:23–36.10.1007/978-94-010-0898-3_3Search in Google Scholar
[36] Pandey A, Mai VT, Vu DQ, Bui TPL, Anh Mai TL, Jensen LS, et al. Organic matter and water management strategies to reduce methane and nitrous oxide emissions from rice paddies in Vietnam. Agric Ecosyst Environ. 2014;196:137–46.10.1016/j.agee.2014.06.010Search in Google Scholar
[37] Tariq A, Vu QD, Jensen LS, de Tourdonnet S, Sander BO, Wassmann R, et al. Mitigating CH4 and N2O emissions from intensive rice production systems in northern Vietnam: Efficiency of drainage patterns in combination with rice residue incorporation. Agric Ecosyst Environ. 2017;249:101–11. 10.1016/j.agee.2017.08.011.Search in Google Scholar
[38] Pandey A, Suter H, He J-Z, Hu H-W, Chen D. Dissimilatory nitrate reduction to ammonium dominates nitrate reduction in long-term low nitrogen fertilized rice paddies. Soil Biol Biochem. 2019;131:149–56. 10,1016/j.soilbio.2019.01.007.Search in Google Scholar
© 2024 the author(s), published by De Gruyter
This work is licensed under the Creative Commons Attribution 4.0 International License.
Articles in the same Issue
- Research Articles
- Green polymer electrolyte and activated charcoal-based supercapacitor for energy harvesting application: Electrochemical characteristics
- Research on the adsorption of Co2+ ions using halloysite clay and the ability to recover them by electrodeposition method
- Simultaneous estimation of ibuprofen, caffeine, and paracetamol in commercial products using a green reverse-phase HPTLC method
- Isolation, screening and optimization of alkaliphilic cellulolytic fungi for production of cellulase
- Functionalized gold nanoparticles coated with bacterial alginate and their antibacterial and anticancer activities
- Comparative analysis of bio-based amino acid surfactants obtained via Diels–Alder reaction of cyclic anhydrides
- Biosynthesis of silver nanoparticles on yellow phosphorus slag and its application in organic coatings
- Exploring antioxidant potential and phenolic compound extraction from Vitis vinifera L. using ultrasound-assisted extraction
- Manganese and copper-coated nickel oxide nanoparticles synthesized from Carica papaya leaf extract induce antimicrobial activity and breast cancer cell death by triggering mitochondrial caspases and p53
- Insight into heating method and Mozafari method as green processing techniques for the synthesis of micro- and nano-drug carriers
- Silicotungstic acid supported on Bi-based MOF-derived metal oxide for photodegradation of organic dyes
- Synthesis and characterization of capsaicin nanoparticles: An attempt to enhance its bioavailability and pharmacological actions
- Synthesis of Lawsonia inermis-encased silver–copper bimetallic nanoparticles with antioxidant, antibacterial, and cytotoxic activity
- Facile, polyherbal drug-mediated green synthesis of CuO nanoparticles and their potent biological applications
- Zinc oxide-manganese oxide/carboxymethyl cellulose-folic acid-sesamol hybrid nanomaterials: A molecularly targeted strategy for advanced triple-negative breast cancer therapy
- Exploring the antimicrobial potential of biogenically synthesized graphene oxide nanoparticles against targeted bacterial and fungal pathogens
- Biofabrication of silver nanoparticles using Uncaria tomentosa L.: Insight into characterization, antibacterial activities combined with antibiotics, and effect on Triticum aestivum germination
- Membrane distillation of synthetic urine for use in space structural habitat systems
- Investigation on mechanical properties of the green synthesis bamboo fiber/eggshell/coconut shell powder-based hybrid biocomposites under NaOH conditions
- Green synthesis of magnesium oxide nanoparticles using endophytic fungal strain to improve the growth, metabolic activities, yield traits, and phenolic compounds content of Nigella sativa L.
- Estimation of greenhouse gas emissions from rice and annual upland crops in Red River Delta of Vietnam using the denitrification–decomposition model
- Synthesis of humic acid with the obtaining of potassium humate based on coal waste from the Lenger deposit, Kazakhstan
- Ascorbic acid-mediated selenium nanoparticles as potential antihyperuricemic, antioxidant, anticoagulant, and thrombolytic agents
- Green synthesis of silver nanoparticles using Illicium verum extract: Optimization and characterization for biomedical applications
- Antibacterial and dynamical behaviour of silicon nanoparticles influenced sustainable waste flax fibre-reinforced epoxy composite for biomedical application
- Optimising coagulation/flocculation using response surface methodology and application of floc in biofertilisation
- Green synthesis and multifaceted characterization of iron oxide nanoparticles derived from Senna bicapsularis for enhanced in vitro and in vivo biological investigation
- Potent antibacterial nanocomposites from okra mucilage/chitosan/silver nanoparticles for multidrug-resistant Salmonella Typhimurium eradication
- Trachyspermum copticum aqueous seed extract-derived silver nanoparticles: Exploration of their structural characterization and comparative antibacterial performance against gram-positive and gram-negative bacteria
- Microwave-assisted ultrafine silver nanoparticle synthesis using Mitragyna speciosa for antimalarial applications
- Green synthesis and characterisation of spherical structure Ag/Fe2O3/TiO2 nanocomposite using acacia in the presence of neem and tulsi oils
- Green quantitative methods for linagliptin and empagliflozin in dosage forms
- Enhancement efficacy of omeprazole by conjugation with silver nanoparticles as a urease inhibitor
- Residual, sequential extraction, and ecological risk assessment of some metals in ash from municipal solid waste incineration, Vietnam
- Green synthesis of ZnO nanoparticles using the mangosteen (Garcinia mangostana L.) leaf extract: Comparative preliminary in vitro antibacterial study
- Simultaneous determination of lesinurad and febuxostat in commercial fixed-dose combinations using a greener normal-phase HPTLC method
- A greener RP-HPLC method for quaternary estimation of caffeine, paracetamol, levocetirizine, and phenylephrine acquiring AQbD with stability studies
- Optimization of biomass durian peel as a heterogeneous catalyst in biodiesel production using microwave irradiation
- Thermal treatment impact on the evolution of active phases in layered double hydroxide-based ZnCr photocatalysts: Photodegradation and antibacterial performance
- Preparation of silymarin-loaded zein polysaccharide core–shell nanostructures and evaluation of their biological potentials
- Preparation and characterization of composite-modified PA6 fiber for spectral heating and heat storage applications
- Preparation and electrocatalytic oxygen evolution of bimetallic phosphates (NiFe)2P/NF
- Rod-shaped Mo(vi) trichalcogenide–Mo(vi) oxide decorated on poly(1-H pyrrole) as a promising nanocomposite photoelectrode for green hydrogen generation from sewage water with high efficiency
- Green synthesis and studies on citrus medica leaf extract-mediated Au–ZnO nanocomposites: A sustainable approach for efficient photocatalytic degradation of rhodamine B dye in aqueous media
- Cellulosic materials for the removal of ciprofloxacin from aqueous environments
- The analytical assessment of metal contamination in industrial soils of Saudi Arabia using the inductively coupled plasma technology
- The effect of modified oily sludge on the slurry ability and combustion performance of coal water slurry
- Eggshell waste transformation to calcium chloride anhydride as food-grade additive and eggshell membranes as enzyme immobilization carrier
- Synthesis of EPAN and applications in the encapsulation of potassium humate
- Biosynthesis and characterization of silver nanoparticles from Cedrela toona leaf extracts: An exploration into their antibacterial, anticancer, and antioxidant potential
- Enhancing mechanical and rheological properties of HDPE films through annealing for eco-friendly agricultural applications
- Immobilisation of catalase purified from mushroom (Hydnum repandum) onto glutaraldehyde-activated chitosan and characterisation: Its application for the removal of hydrogen peroxide from artificial wastewater
- Sodium titanium oxide/zinc oxide (STO/ZnO) photocomposites for efficient dye degradation applications
- Effect of ex situ, eco-friendly ZnONPs incorporating green synthesised Moringa oleifera leaf extract in enhancing biochemical and molecular aspects of Vicia faba L. under salt stress
- Biosynthesis and characterization of selenium and silver nanoparticles using Trichoderma viride filtrate and their impact on Culex pipiens
- Photocatalytic degradation of organic dyes and biological potentials of biogenic zinc oxide nanoparticles synthesized using the polar extract of Cyperus scariosus R.Br. (Cyperaceae)
- Assessment of antiproliferative activity of green-synthesized nickel oxide nanoparticles against glioblastoma cells using Terminalia chebula
- Chlorine-free synthesis of phosphinic derivatives by change in the P-function
- Anticancer, antioxidant, and antimicrobial activities of nanoemulsions based on water-in-olive oil and loaded on biogenic silver nanoparticles
- Study and mechanism of formation of phosphorus production waste in Kazakhstan
- Synthesis and stabilization of anatase form of biomimetic TiO2 nanoparticles for enhancing anti-tumor potential
- Microwave-supported one-pot reaction for the synthesis of 5-alkyl/arylidene-2-(morpholin/thiomorpholin-4-yl)-1,3-thiazol-4(5H)-one derivatives over MgO solid base
- Screening the phytochemicals in Perilla leaves and phytosynthesis of bioactive silver nanoparticles for potential antioxidant and wound-healing application
- Graphene oxide/chitosan/manganese/folic acid-brucine functionalized nanocomposites show anticancer activity against liver cancer cells
- Nature of serpentinite interactions with low-concentration sulfuric acid solutions
- Multi-objective statistical optimisation utilising response surface methodology to predict engine performance using biofuels from waste plastic oil in CRDi engines
- Microwave-assisted extraction of acetosolv lignin from sugarcane bagasse and electrospinning of lignin/PEO nanofibres for carbon fibre production
- Biosynthesis, characterization, and investigation of cytotoxic activities of selenium nanoparticles utilizing Limosilactobacillus fermentum
- Highly photocatalytic materials based on the decoration of poly(O-chloroaniline) with molybdenum trichalcogenide oxide for green hydrogen generation from Red Sea water
- Highly efficient oil–water separation using superhydrophobic cellulose aerogels derived from corn straw
- Beta-cyclodextrin–Phyllanthus emblica emulsion for zinc oxide nanoparticles: Characteristics and photocatalysis
- Assessment of antimicrobial activity and methyl orange dye removal by Klebsiella pneumoniae-mediated silver nanoparticles
- Influential eradication of resistant Salmonella Typhimurium using bioactive nanocomposites from chitosan and radish seed-synthesized nanoselenium
- Antimicrobial activities and neuroprotective potential for Alzheimer’s disease of pure, Mn, Co, and Al-doped ZnO ultra-small nanoparticles
- Green synthesis of silver nanoparticles from Bauhinia variegata and their biological applications
- Synthesis and optimization of long-chain fatty acids via the oxidation of long-chain fatty alcohols
- Eminent Red Sea water hydrogen generation via a Pb(ii)-iodide/poly(1H-pyrrole) nanocomposite photocathode
- Green synthesis and effective genistein production by fungal β-glucosidase immobilized on Al2O3 nanocrystals synthesized in Cajanus cajan L. (Millsp.) leaf extracts
- Green stability-indicating RP-HPTLC technique for determining croconazole hydrochloride
- Green synthesis of La2O3–LaPO4 nanocomposites using Charybdis natator for DNA binding, cytotoxic, catalytic, and luminescence applications
- Eco-friendly drugs induce cellular changes in colistin-resistant bacteria
- Tangerine fruit peel extract mediated biogenic synthesized silver nanoparticles and their potential antimicrobial, antioxidant, and cytotoxic assessments
- Green synthesis on performance characteristics of a direct injection diesel engine using sandbox seed oil
- A highly sensitive β-AKBA-Ag-based fluorescent “turn off” chemosensor for rapid detection of abamectin in tomatoes
- Green synthesis and physical characterization of zinc oxide nanoparticles (ZnO NPs) derived from the methanol extract of Euphorbia dracunculoides Lam. (Euphorbiaceae) with enhanced biosafe applications
- Detection of morphine and data processing using surface plasmon resonance imaging sensor
- Effects of nanoparticles on the anaerobic digestion properties of sulfamethoxazole-containing chicken manure and analysis of bio-enzymes
- Bromic acid-thiourea synergistic leaching of sulfide gold ore
- Green chemistry approach to synthesize titanium dioxide nanoparticles using Fagonia Cretica extract, novel strategy for developing antimicrobial and antidiabetic therapies
- Green synthesis and effective utilization of biogenic Al2O3-nanocoupled fungal lipase in the resolution of active homochiral 2-octanol and its immobilization via aluminium oxide nanoparticles
- Eco-friendly RP-HPLC approach for simultaneously estimating the promising combination of pentoxifylline and simvastatin in therapeutic potential for breast cancer: Appraisal of greenness, whiteness, and Box–Behnken design
- Use of a humidity adsorbent derived from cockleshell waste in Thai fried fish crackers (Keropok)
- One-pot green synthesis, biological evaluation, and in silico study of pyrazole derivatives obtained from chalcones
- Bio-sorption of methylene blue and production of biofuel by brown alga Cystoseira sp. collected from Neom region, Kingdom of Saudi Arabia
- Synthesis of motexafin gadolinium: A promising radiosensitizer and imaging agent for cancer therapy
- The impact of varying sizes of silver nanoparticles on the induction of cellular damage in Klebsiella pneumoniae involving diverse mechanisms
- Microwave-assisted green synthesis, characterization, and in vitro antibacterial activity of NiO nanoparticles obtained from lemon peel extract
- Rhus microphylla-mediated biosynthesis of copper oxide nanoparticles for enhanced antibacterial and antibiofilm efficacy
- Harnessing trichalcogenide–molybdenum(vi) sulfide and molybdenum(vi) oxide within poly(1-amino-2-mercaptobenzene) frameworks as a photocathode for sustainable green hydrogen production from seawater without sacrificial agents
- Magnetically recyclable Fe3O4@SiO2 supported phosphonium ionic liquids for efficient and sustainable transformation of CO2 into oxazolidinones
- A comparative study of Fagonia arabica fabricated silver sulfide nanoparticles (Ag2S) and silver nanoparticles (AgNPs) with distinct antimicrobial, anticancer, and antioxidant properties
- Visible light photocatalytic degradation and biological activities of Aegle marmelos-mediated cerium oxide nanoparticles
- Physical intrinsic characteristics of spheroidal particles in coal gasification fine slag
- Exploring the effect of tea dust magnetic biochar on agricultural crops grown in polycyclic aromatic hydrocarbon contaminated soil
- Crosslinked chitosan-modified ultrafiltration membranes for efficient surface water treatment and enhanced anti-fouling performances
- Study on adsorption characteristics of biochars and their modified biochars for removal of organic dyes from aqueous solution
- Zein polymer nanocarrier for Ocimum basilicum var. purpurascens extract: Potential biomedical use
- Green synthesis, characterization, and in vitro and in vivo biological screening of iron oxide nanoparticles (Fe3O4) generated with hydroalcoholic extract of aerial parts of Euphorbia milii
- Novel microwave-based green approach for the synthesis of dual-loaded cyclodextrin nanosponges: Characterization, pharmacodynamics, and pharmacokinetics evaluation
- Bi2O3–BiOCl/poly-m-methyl aniline nanocomposite thin film for broad-spectrum light-sensing
- Green synthesis and characterization of CuO/ZnO nanocomposite using Musa acuminata leaf extract for cytotoxic studies on colorectal cancer cells (HCC2998)
- Review Articles
- Materials-based drug delivery approaches: Recent advances and future perspectives
- A review of thermal treatment for bamboo and its composites
- An overview of the role of nanoherbicides in tackling challenges of weed management in wheat: A novel approach
- An updated review on carbon nanomaterials: Types, synthesis, functionalization and applications, degradation and toxicity
- Special Issue: Emerging green nanomaterials for sustainable waste management and biomedical applications
- Green synthesis of silver nanoparticles using mature-pseudostem extracts of Alpinia nigra and their bioactivities
- Special Issue: New insights into nanopythotechnology: current trends and future prospects
- Green synthesis of FeO nanoparticles from coffee and its application for antibacterial, antifungal, and anti-oxidation activity
- Dye degradation activity of biogenically synthesized Cu/Fe/Ag trimetallic nanoparticles
- Special Issue: Composites and green composites
- Recent trends and advancements in the utilization of green composites and polymeric nanocarriers for enhancing food quality and sustainable processing
- Retraction
- Retraction of “Biosynthesis and characterization of silver nanoparticles from Cedrela toona leaf extracts: An exploration into their antibacterial, anticancer, and antioxidant potential”
- Retraction of “Photocatalytic degradation of organic dyes and biological potentials of biogenic zinc oxide nanoparticles synthesized using the polar extract of Cyperus scariosus R.Br. (Cyperaceae)”
- Retraction to “Green synthesis on performance characteristics of a direct injection diesel engine using sandbox seed oil”