Multi-objective statistical optimisation utilising response surface methodology to predict engine performance using biofuels from waste plastic oil in CRDi engines
-
Sumit Kanchan
 ,
Rajeev Kumar
,
Shubham Sharma
,
Fuad A. Awwad
,
M. Ijaz Khan
,
Rajeev Kumar
,
Shubham Sharma
,
Fuad A. Awwad
,
M. Ijaz Khan

Abstract
The current research focuses on the optimisation of common rail direct injection (CRDi) diesel engines for their optimum performance and emission characteristics using the response surface methodology (RSM) technique. The RSM approach is used in this study to reduce the number of experimental tests and costs. In the RSM technique, the three input operational parameters such as injection pressures (30, 35, and 40 MPa), engine loads through indicated mean effective pressure (2.1, 4.15, and 6.2 bar), and varying waste plastic oil (WPO)–diesel fuel blends (5%, 10%, and 15%) are considered to improve the engine output responses like brake thermal efficiency (BTE) and nitrogen oxide (NOx) emissions. The polynomial regression model is developed within the defined input parameter range. The validations and prediction accuracy of the regression model are studied using diagnostic and influence plots such as Box–Cox, Cook’s distance, leverage plot, and difference in fits (DFFITS) analysis, to name a few. After the validations of the model, the prediction values of BTE and NOx are compared with the experimental test results. The effects of input parameters on the BTE and NOx emissions are studied by contour and 3D surface plots. The collective effect of NOx and BTE is analysed through an overlay plot at different one-side intervals. The minor change in the outputs of BTE and NOx emissions is studied by sensitivity analysis. The confirmation of the proposed regression model is done through the multi-variate desirability function approach. The results found that the regression model predicts accurately when compared to the experimental test results. The optimal input parameter after the RSM and desirability approach for maximum BTE and lower NOx is found to be 5% of WPO + diesel fuel blend, 30 MPa injection pressure, and 2.1 bar of engine load. Using these parameter sets, the highest value of BTE and the lowest value of NOx emissions are found to be 32.5605% and 14.8757 ppm, respectively.
Graphical abstract
Abbreviations
- 4S
-
four-stroke
- AC
-
air-cooled
- ANOVA
-
analysis of variance
- BP
-
brake power
- BSFC
-
brake-specific fuel consumption
- BTDC
-
before top dead centre
- BTE
-
brake thermal efficiency
- CA
-
crank angle
- CDRI
-
common rail direct injection engine
- CI
-
compression ignition
- CO
-
carbon monoxide
- CPCB
-
Central Pollution Control Board
- CR
-
compression ratio
- DFBETAS
-
difference in betas
- DFFITS
-
difference in fits
- DI
-
direct injection
- FTIR
-
Fourier transform infrared
- GCMS
-
gas chromatography–mass spectrometry
- HC
-
hydrocarbon
- HDPE
-
high-density polyethylene
- HRR
-
heat release rate
- ID
-
ignition delay
- IP
-
injection pressure
- IT
-
injection time
- LDPE
-
low-density polyethylene
- MCDM
-
multi-criteria decision-making
- PET
-
polyethylene terephthalate
- PM
-
particulate matter
- PP
-
peak pressure
- PP
-
polypropylene
- PPO
-
plastic pyrolysed oil
- PS
-
polystyrene
- PVC
-
polyvinyl chloride
- SWM
-
solid waste management
- TPA
-
tonnes per annum
- WASPAS
-
weighted aggregated sum product assessment
- WC
-
water-cooled
- WPM
-
weighted product model
- WPO
-
waste plastic oil
- WPO
-
waste plastic oil
- WSM
-
weighted sum model
1 Introduction
Conventional fossil fuels are diminishing over time, and it is predicted that they will become extinct in the next few years. The increasing number of vehicles on the road and the rising carbon emissions from conventional fuel vehicles make it progressively more important to develop non-renewable fossil fuel alternatives [1]. Considering the present energy-economic environmental needs, all alternative biofuels must be easy to renew, have higher availability, and be environmentally friendly to be effective [2,3,4].
Waste plastic oil (WPO) as an alternative fuel has better performance, combustion, and pollution-depletion properties [3]. With increasing amount of waste plastic pollution in the surroundings, biofuels like WPO have shown promising potential to aim at collectively non-renewable fuel and pollution issues. According to Dogu et al. [5], better waste management and wiser product designs are urgently needed to reduce the on-going marine and land pollution caused by solid plastic waste. Sibao et al. [6] have shed light on a direct method of converting polyolefins into liquid fuels and also proposed that this method can selectively convert the plastics into the desired type of fuel, be it gasoline, diesel, jet fuel, or gasoline range hydrocarbons. However, due to the higher aromatic content in WPO, longer ignition delay, higher cylinder pressure, and heat release rate reduce the engine performance and increase the emission of nitrogen oxides (NOx) and other pollutants. The prepared pyrolytic liquid fuel is employed in compression ignition (CI) engines to reduce the use of the conventional fossil fuel, diesel. Table 1 summarises the studies conducted recently on the use of WPO in CI engines as a fuel. As depicted from Table 1, the lower proportion of WPO in the diesel resulted in the increment in the brake thermal efficiency (BTE), while a reduction is reported in the brake-specific fuel consumption (BSFC). Concurrently, a mixed performance in engine emissions like HC, NOx, CO, and CO2 is found.
Summary of the collective literature available on WPO and its blend as the engine fuel on the engine performance and emission characteristics
| Performance | Emission | ||||||||||
|---|---|---|---|---|---|---|---|---|---|---|---|
| Reference | Diesel % | Blend additive | WPO % | BTE | BSFC | EGT | HC | NOx | CO | CO2 | |
| Type | % | ||||||||||
| Devraj et al. [8] | 0 | DEE | 0 | 100 | ↓ | ↑ | — | ↑ | ↑ | ↑ | ↑ |
| 0 | DEE | 05 | 95 | ↓ | ↑ | — | ↑ | ↓ | ↑ | ↑ | |
| 0 | DEE | 10 | 90 | ↑ | ↑ | — | ↑ | ↓ | ↑ | ↑ | |
| Kaimal and Vijayabalan [9] | 0 | DEE | 0 | 100 | ↓ | — | — | ↑ | ↑ | ↑ | — |
| 0 | DEE | 05 | 95 | ↓ | — | — | ↑ | ↑ | ↑ | — | |
| 0 | DEE | 10 | 90 | ↓ | — | — | ↑ | ↑ | ↑ | — | |
| 0 | DEE | 15 | 85 | ↓ | — | — | ↑ | ↑ | ↑ | — | |
| Damodaran et al. [10] | 50 | n-Butanol | 10 | 40 | ↓ | ↑ | — | ↑ | ↓ | ↔ | — |
| 50 | n-Butanol | 20 | 30 | ↓ | ↑ | — | ↑ | ↓ | ↔ | — | |
| 50 | n-Butanol | 30 | 20 | ↑ | ↑ | — | ↑ | ↔ | ↔ | — | |
| 0 | n-Butanol | 0 | 100 | ↓ | ↑ | — | ↑ | ↓ | ↔ | — | |
| Damodaran et al. [3] | 0 | n-Hexanol | 30 | 70 | ↓ | ↓ | — | — | ↓ | — | — |
| 0 | n-Octanol | 30 | 70 | ↓ | ↑ | — | — | ↓ | — | — | |
| 0 | n-Pentanol | 30 | 70 | ↑ | ↓ | — | — | ↑ | — | — | |
| Das et al. [7] | 80 | Ethanol | 10 | 0 | ↑ | ↑ | ↑ | ↑ | ↓ | ↑ | — |
| 70 | Ethanol | 15 | 0 | ↑ | ↑ | ↑ | ↑ | ↓ | ↑ | — | |
| 60 | Ethanol | 20 | 0 | ↓ | ↓ | ↑ | ↓ | ↓ | ↑ | — | |
| Dillikanan et al. [11] | 0 | n-Hexanol | 0 | 100 | ↓ | ↑ | ↑ | — | ↑ | ↑ | — |
| 50 | n-Hexanol | 10 | 40 | ↓ | ↑ | ↑ | — | ↑ | ↑ | — | |
| 50 | n-Hexanol | 20 | 30 | ↓ | ↑ | ↔ | — | ↔ | ↑ | — | |
| 50 | n-Hexanol | 30 | 20 | ↓ | ↑ | ↓ | — | ↓ | ↑ | — | |
| Venkatasan et al. [12] | 0 | n-Hexanol | 0 | 100 | ↓ | ↓ | — | ↑ | ↑ | ↑ | — |
| 50 | n-Hexanol | 20 | 30 | ↑ | ↓ | — | ↑ | ↓ | ↓ | — | |
| 50 | n-Hexanol | 30 | 20 | ↓ | ↓ | — | ↑ | ↓ | ↔ | — | |
| 50 | n-Hexanol | 40 | 10 | ↓ | ↓ | — | ↑ | ↑ | ↑ | — | |
| Kaewbuddee et al. [13] | 0 | — | 0 | 100 | ↑ | ↑ | — | — | ↑ | ↑ | ↑ |
| 0 | Castor oil methyl esters | 10 | 90 | ↑ | ↑ | — | — | ↑ | ↑ | ↑ | |
| 0 | Palm oil methyl esters | 10 | 90 | ↑ | ↑ | — | — | ↑ | ↑ | ↑ | |
| Syamsiro et al. [14] | 80 | — | — | 20 | ↓ | ↑ | — | ↑ | — | — | — |
| 60 | Ethanol | 20 | 20 | ↑ | ↓ | — | ↑ | — | — | — | |
| 80 | 100 g Natural gas | 20 | ↑ | ↓ | — | ↑ | — | — | — | ||
It is known that testing any alternative fuel is a time-consuming and high-priced practice that involves establishing the results of many operational facets such as fuel injection pressure, fuel injection timing, compression ratio, and load. Therefore, a scientific investigation that comprises the design of the experiment, analysis of variance (ANOVA), establishment of a relation function, and arrangement of findings in the method of surface illustrations is widely explored and adopted. Various optimisation techniques [15,16] to achieve higher thermal efficiencies and emissions within permissible limits have been applied by many researchers. Using scrap plastic chairs to optimise the engine behaviour can have a number of important and pertinent consequences for sustainability and environmental issues. The following are some important things to think about – garbage reduction: one way to lessen the quantity of plastic garbage that clogs landfills and contaminates the environment is to use used plastic chairs as a fuel for engines. Addressing the issue of plastic trash globally is imperative, as it has dire ecological and environmental ramifications. Resource conservation: we can lessen the need for virgin fossil fuels and other resources that are normally needed to power motors by recycling discarded plastic chairs. This can lessen the negative effects that resource extraction has on the environment and aid in the conservation of natural resources. Reduce carbon emissions: plastic chairs can release greenhouse gases and other pollutants when they are burned or turned into fuel. In contrast to conventional fossil fuels, this process may produce less net carbon emissions if it is optimised and the emissions are well managed. A more effective and clean burning process might result from proper optimisation. Energy recovery: by converting used plastic chairs into fuel, it is possible to recover energy that would otherwise be thrown away. This energy can be used to generate electricity, heat buildings, or run automobiles, among other things, promoting sustainability and energy recovery. Circular economy: recycling waste plastic chairs for engine optimisation is in line with the circular economy’s tenets, which emphasise resource reuse, repurposing, and recycling in order to reduce waste and increase the material lifespan. Innovation and research: the use of waste plastics to optimise engine behaviour can spur innovation and research in materials science and sustainable technologies. Innovations in environmental science and engineering may result from finding more effective and sustainable methods to use plastics. Local economic opportunities: by gathering, processing, and using waste plastics for engine optimisation, small-scale businesses and jobs can be established locally, supporting sustainability and economic growth. Regulatory compliance: requirements and rewards may exist in some areas to promote recycling and appropriate plastic disposal. Employing waste plastics to optimise engine behaviour can assist firms in adhering to these laws and even obtaining tax benefits or incentives. Education and public awareness: these programmes can educate the public about the harm that plastic trash does to the environment and the significance of proper waste disposal. Additionally, it can inform individuals of the possible advantages of recycling and reusing plastics. Potential difficulties: when employing waste plastics for engines, it is vital to keep in mind that there can be difficulties with material selection, technological optimisation, and emission management. Effective solutions to these problems will need careful thought and investigation. In conclusion, utilising discarded plastic chairs to optimise engine behaviour can support a circular economy, reduced waste, resource conservation, decreased carbon emissions, and energy recovery. To optimise its advantages and minimise its disadvantages, it must be carried out with an emphasis on environmental responsibility and the development of an effective, sustainable technology. Optimisation tools like response surface methodology (RSM), Taguchi methods, and non-linear regression are largely adopted by various researchers for the performance optimisation of engines. Among these, RSM has emerged as a promising optimisation tool. RSM is very useful for optimising complicated systems with a lot of moving parts and parameters like engine performance, combustion processes, and fuel mixtures. The design of experiments (DOE) is the first step in RSM data collection. When it comes to fuel optimisation, this could entail adjusting a number of variables, including the temperature, air–fuel ratio, ignition timing, and fuel composition, and measuring the effects on emissions and fuel efficiency. The response variables which can be optimised could include engine performance (horsepower, torque), emissions (CO2, NOx, particulate matter), and fuel efficiency (miles per gallon or kilometres per litre). RSM approaches aid in the optimisation of fuel blends for various fuels, including diesel, gasoline, and ethanol, in order to reduce emissions and increase the efficiency. In order to optimise the fuel efficiency and reduce emissions, engines’ air–fuel ratio, injection timing, and compression ratio can also be used in the combustion process. Additionally, it assists in reducing the emissions of pollutants, including particulate matter and NOx. Through the identification of optimal combinations and operating circumstances, this optimisation technique also plays a vital role in the development and optimisation of alternative fuels, such as hydrogen or biofuels.
An instance of an experimental design that makes use of RSM is the Box–Behnken design (BBD). It is especially valuable for processes like fuel optimisation that have several independent variables to optimise. When there are many factors or when doing multiple trials would be costly and time-consuming, it may not be feasible to fully explore all factor combinations. In these cases, the central and factorial point design can be especially helpful. It offers a methodical and effective way to maximise fuel compositions and combustion processes with the least number of required trials.
As an aspect of the RSM technique, the BBD is utilised to reduce the number of experimental trials along with costs.
The BBD is selected due to its ability to identify the implications of input operational parameters on output responses while generating the minimum number of experimental cycles possible. Injection pressures, engine loading as measured by indicated mean effective pressure (IMEP), and varying WPO–diesel fuel blends are the three input parameters considered in the study. BTE and NOx emissions comprise the output responses. When developing, validating, and analysing the polynomial regression model, numerous diagnostic and influence plots are employed.
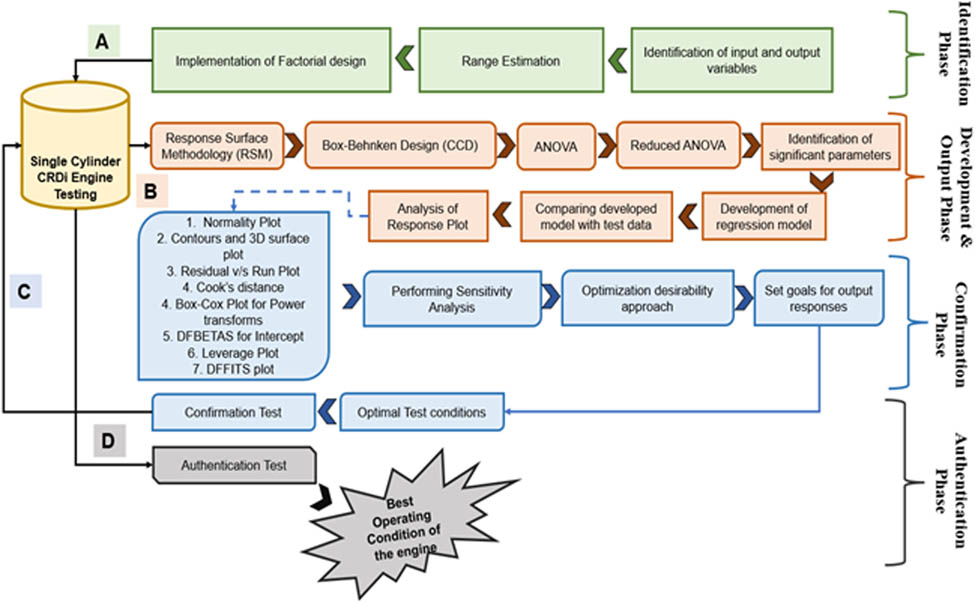
Identifying and range estimation of input operational parameters and output responses; development of a polynomial regression model utilising reduced ANOVA; confirmation studies utilising a variety of graphs and analyses; and an authentication phase comprising the four stages of the work methodology.
Fifteen different sets or groups of experiments have been generated employing the BBD to generate an experimental matrix with three input parameters and two output responses. Subsequently, statistical analyses, such as ANOVA, are employed in the study to ascertain which process parameters have a substantial impact on the output responses, namely BTE and NOx emissions.
Established advantages like reduced number of experiments, time utilised for mathematical modelling, and cost make it a favourable optimisation tool to achieve better engine performance and lower emissions. Said et al. [17] applied the RSM and BBD-based quadratic models to reduce the number of experiments for conducting the tests on the diesel engine. The study aims to improve the effect of operational parameters like the engine load and injection time on combustion and emission characteristics. The results revealed that the experimental findings are within 7% of the model-predicted output. Bora et al. [18] used RSM for model prediction on a dual-fuel engine. The tests established that the projected outcome is within the 6% error range. Similar experiments are conducted by Vali et al. [19] as they used waste cooking oil for biodiesel production. They recommended that RSM could be an effective way of attaining the finest engine performance and emissions at different operational conditions. Engine parameters such as injection timing, load, fuel flow rate, and blend ratio are adjusted by Singh et al. [20] using RSM through a series of experiments using Pongamia biodiesel to improve the engine behaviour. An investigation by Sakhtivel et al. [21] on a CI engine using a Calophyllum inophyllum bio-diesel fuel blend showed how effectively the RSM technique could be used. They suggested that the RSM-based model could achieve up to 99% accuracy response in contrast to test values. Similarly, in another experiment on WPO, Das et al. [22] used ethanol as an additive along with a diesel blend. They reported higher engine efficiency and reduced emission at a low compression ratio of 18 (18).
From the comprehensive literature available, it is found that exhaustive work is being done in CI engines using WPO to attain the finest engine behaviour by utilising many techniques. But barely any research article is found which uses WPO extracted from the plastic chairs and the optimisation technique applied. In the literature, papers portray the use of mixed plastic waste for WPO production which yields WPO oil having both high-density polyethylene (HDPE) and low-density polyethylene (LDPE) plastics. The current work only focuses on using plastic chairs which comprise only HDPE plastic. Further, limited articles are found on optimising engine behaviour using the collective impact of the injection pressure, load, and fuel blend either through experimentation or by an RSM-based approach. Also, a few papers portray the sensitivity analysis for achieving high BTE and lower engine emission. Therefore, with these literature gaps, the current work is focused on optimising the three operational parameters such as injection pressure, load, and WPO–diesel blends to attain improved BTE and emission, primarily NOx using the RSM. With the WPO fuel prepared from an HDPE source, sensitivity analysis has been conducted to highlight and validate the consequence of each parameter on engine BTE and NOx behaviour, which is also infrequent. To aid in the development of regression models, the data transformation is required to line up the residuals which are projected using the Box–Cox plot [28]. Thereafter, attempts have been made to develop a regression model for the output responses, and the validation of the model is done by comparing it with test values, so that in the future the model can be utilised for finding other test values at different operational parameters without performing the expensive engine tests. With the model developed, the investigation is carried forward to measure how much the regression function changes if some input operational parameter is not included in the model, by using Cook’s distance. Additionally, the analysis is done on how each operational parameter influenced the model fit through leverage plots. Difference in fits (DFFITS) analysis is further used to measure how much the prediction changes if some operational parameter is not included in the model fit. As a final consideration, the difference in betas (DFBETAS) analysis performed for measuring the coefficient measurement changes in cases where a parameter operating in the operational environment is not considered in the model fit, which is rare. The diagnostic approach and a brief role of each tool used in the current study are summarised in Figure 1.
Confined summary of the diagnostic process used in Design-Expert software.
2 Research objectives of the current work
Based on the literature review and identifying the research gaps, the present study focuses on achieving the following objectives:
To study the effect of operational parameters such as engine load, injection pressure, and fuel blends to attain optimal engine behaviour through contours and 3D surface plots.
To investigate the optimal operational parameter for improved output response of BTE and NOx using the RSM approach.
To develop a regression model for the output responses, so that it could be utilised for finding test values without performing time-utilising and high-priced tests.
Using statistical approaches such as Box–Cox plots, Cook’s distance, leverage plots, and DFFITS and DFBETAS analyses to analyse the influence of input operational parameters on model fit.
To know the best optimum parameter using desirability analysis.
The sensitivity analysis is carried out to know the effect of the minor change in the important values of the outputs BTE and NOx emission on the optimal value of operational parameters.
3 Fuel preparation and experimental setup
3.1 Collection and preparation of WPO
Waste plastic is retained as the primary source of oil. The composition of the WPO is mainly kept to be plastic chairs, and the collection is from discarded items on the university campus, so they are all nearly identical. A plastic chair can be made of many materials, but most commonly it is made up of HDPE. The waste plastic is pyrolysed in a gaseous fuel heated, batch pyrolysis unit with a handling capacity of 2 kg waste for the production of pyrolytic WPO. The process temperature is kept at 450°C in isothermal conditions for 30 min with a heating rate of 20°C·min−1 from room temperature. The plant for the production of pyrolytic WPO comprises the reactor assembly, condensing unit, separator, and gas collection system. The thermophysical properties of the derived WPO and those of diesel are compared in Table 2.
Thermophysical properties of the diesel and WPO fuel
| Properties | Testing method | WPO | Diesel |
|---|---|---|---|
| Density @ 15°C (kg/m3) | ASTM D1298 | 799.9 | 833 |
| Lower calorific value (MJ/kg) | ASTM D420 | 41,323 | 42,800 |
| Kinematic viscosity @40°C (cSt) | ASTM D445 | 0.75 | 0.8 |
| Flashpoint (°C) | ASTM D93 | 24 | 64 |
| Fire point (°C) | ASTM D92 | 34 | 73 |
3.2 Engine setup and accompanying accessories
The tests are conducted on a single-cylinder common rail direct injection (CRDi) diesel engine. The schematic diagram of the experimental setup used for the analysis is shown in Figure 2. The engine specifications are listed in Table 3.
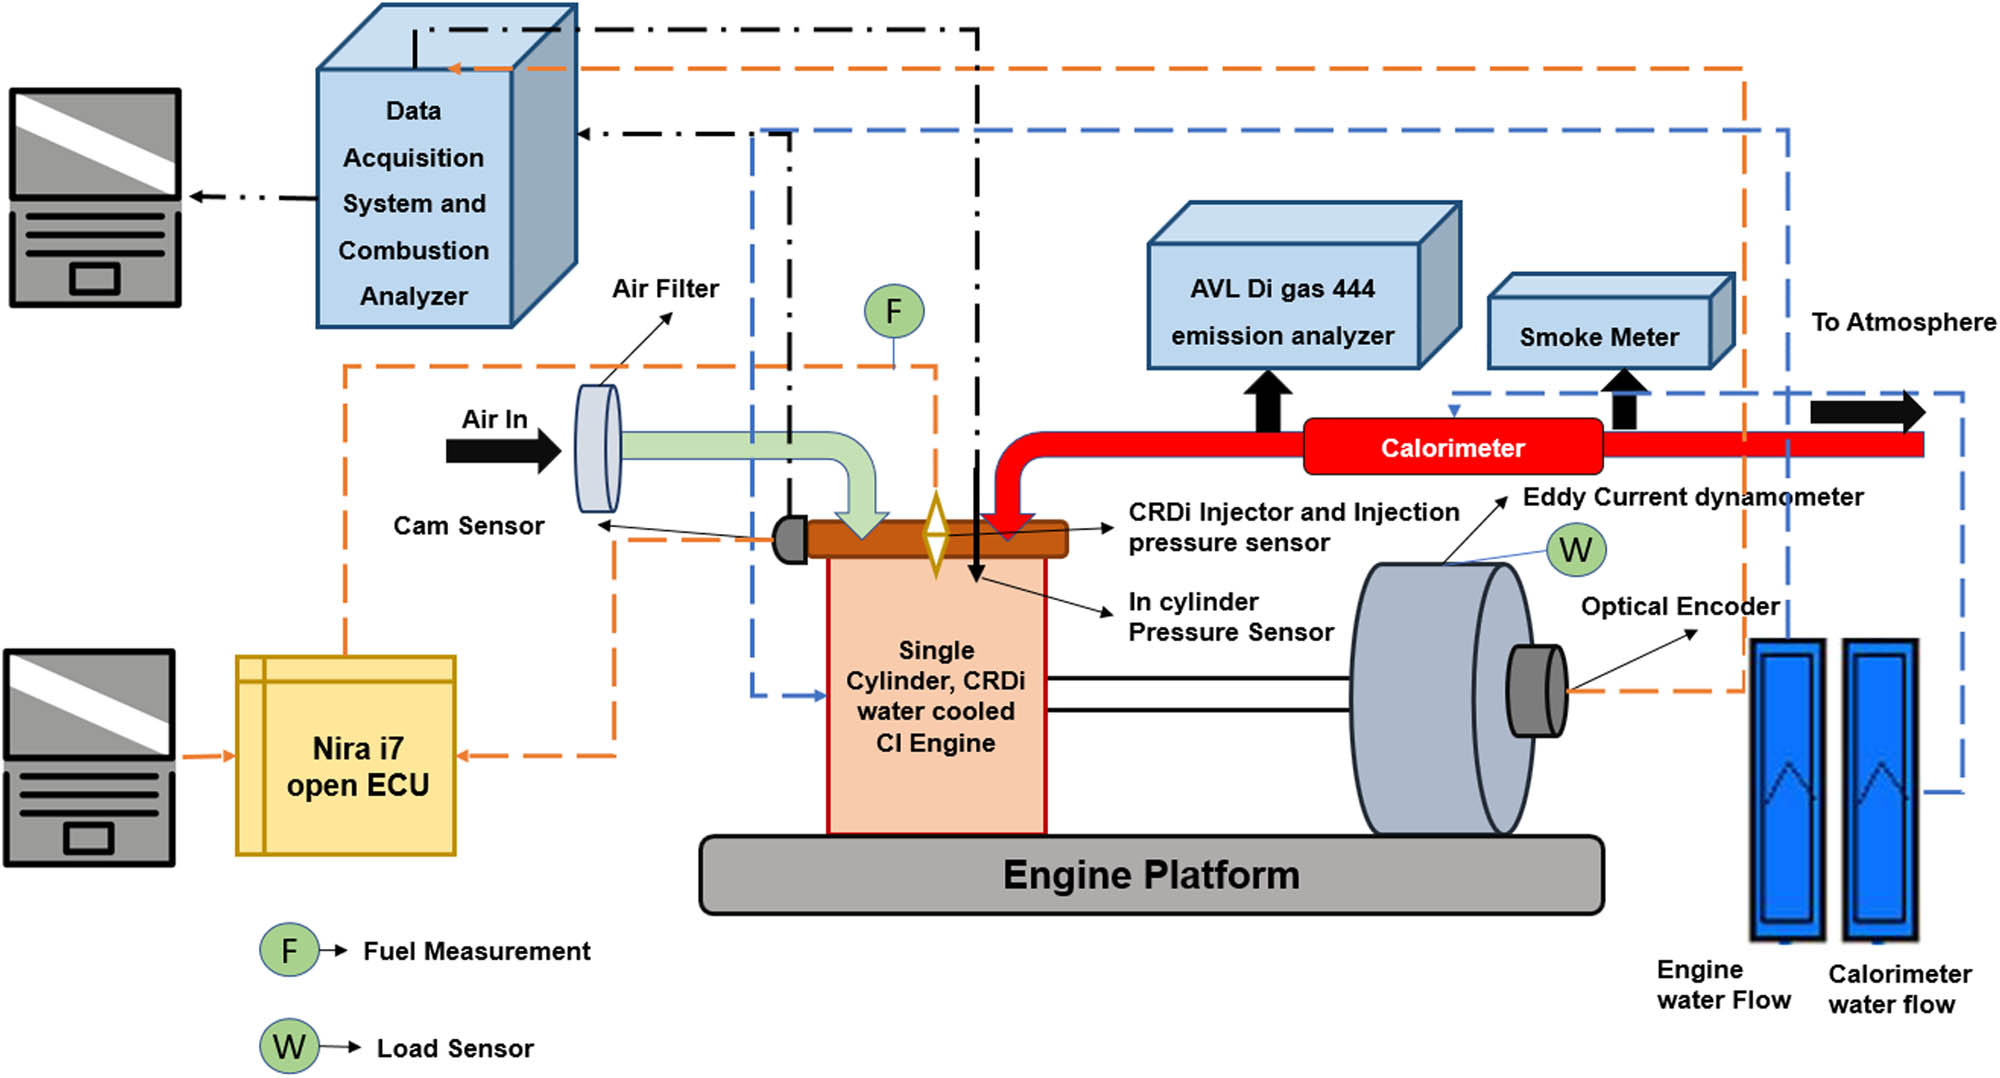
Schematic layout of the experimental setup.
Engine specifications
| Brand | Kirloskar |
|---|---|
| Model | TV1 (modified from DI to CRDi) |
| No. of cylinders and stroke | 1, 4 |
| Displacement volume | 661 cc |
| Rated power | 5.2 kW |
| Bore diameter | 87.5 mm |
| Stroke length | 110 mm |
| Compression ratio | 17.5:1 |
The experimental setup is used without any modification (originally converted from DI to CRDi) to employ the WPO-diesel blends. Before starting with the experimental test for the study, the engine is run on a default map using diesel (in CRDi mode) to optimise the indicated thermal efficiency. The engine load is indicated by brake mean effective pressure and is varied from 2.1, 4.15, and 6.2 bar at a constant speed, i.e. at 1,500 rpm. The injection pressure is varied in the range of 30, 35, and 40 deg BTDC. The fuel flow is measured by using a flow meter. AVL Digas-444 is used for measuring emissions. Thereafter, findings are noted for engine combustion, performance, and emission characteristics. For avoiding cyclic variations, an average of 50 cycles is taken during the analysis. The data are recorded three times and are averaged before being reported and analysed. To be certain about the accuracy of the equipment, they are calibrated and tested before conducting the experiments. For independent parameters, the average of data points is taken, and statistical analyses [27] are performed by calculating the mean, standard deviation, and standard error for the repetitive set of 50 readings. The maximum value of the standard error for exhaust gas temperature is noted as ±1.1°C.
4 Work methodology and implementation of RSM
4.1 Work methodology of the current work
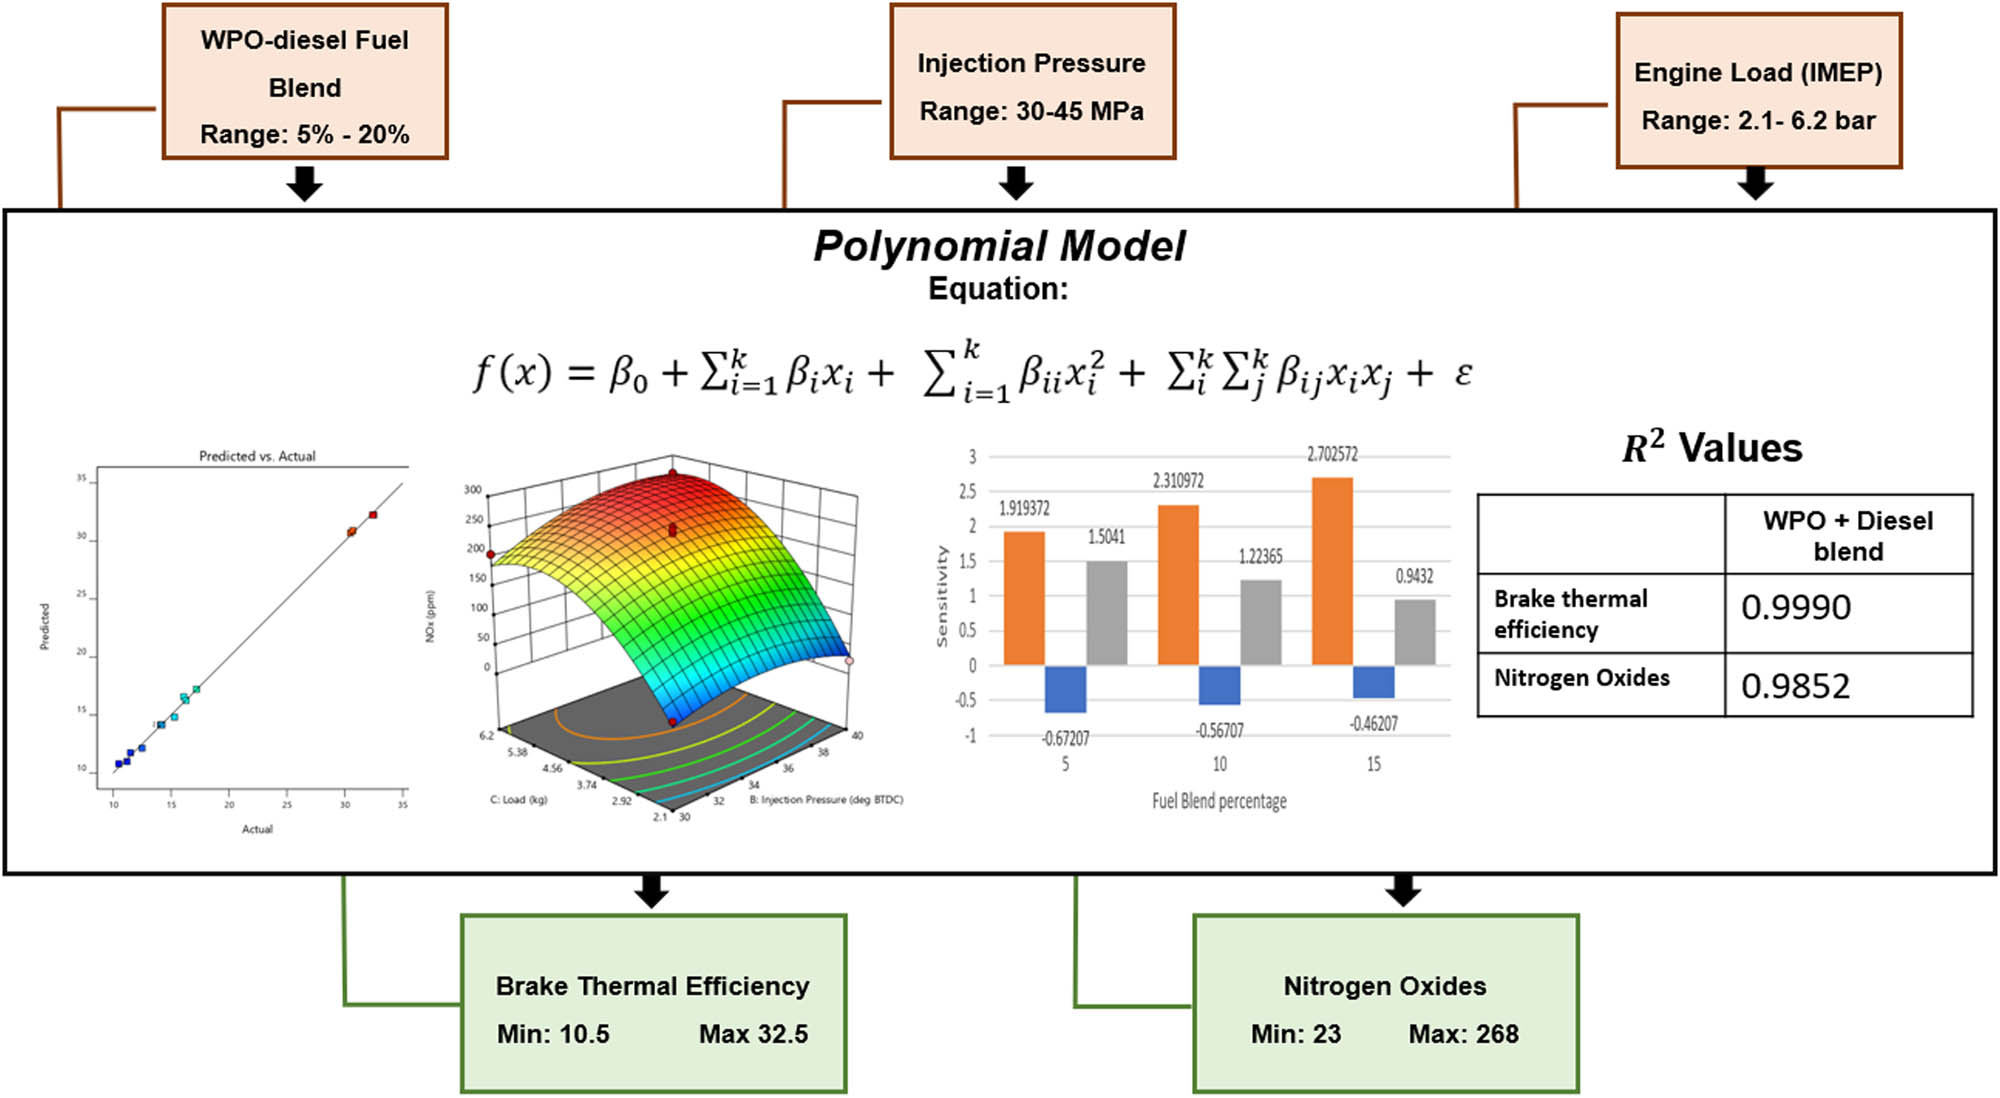
The important parameters which determine engine performance and emissions are injection strategies, varying fuel blends, and engine load. It is pertinent to mention here that this study takes into account only the injection pressure to find its optimal values using a statistical approach, along with optimal varying fuel blend and engine load for enhanced performance and emission output. Furthermore, engine output characteristics such as BTE and NOx are examined for maximising and minimising their values, respectively. The bird eye view engine model of the study depicting the input and output is shown in Figure 3. The permissible range of every input operational parameter is designated by the prior observations based on the rate of pressure rise and stable operation of the preferred engine operation. The range estimation according to prior experimentation of each input operational parameter is shown in Table 4.
Bird’s eye view of the employed engine model with input and output variables.
Identification of range for input variable parameters
| S. No. | Variable parameters | Units | Range of individual variable parameters adopted for design | |
|---|---|---|---|---|
| Minimum | Maximum | |||
| 1 | WPO + diesel fuel blend | % | 5 | 20 |
| 2 | Engine load (IMEP) | bar | 2.1 | 6.2 |
| 3 | Injection pressure | MPa | 30 | 45 |
The work methodology adopted for the current work is shown in Figure 4. It can be observed from Figure 4 that the whole methodology is divided into four phases, i.e. first, identification and range estimation of input operational parameters and output responses. Second, the development of a polynomial regression model using reduced ANOVA and its analysis. Third, carrying confirmation studies based on normality plots, leverage plot, contour and 3D surface plots, Box–Cox plot, Cook’s plot, DDFITS analysis, and DFBETAS analysis, and fourth the authentication phase. The current work presents the comprehensive analysis of the experimental design to optimise outcomes in the subsequent sections.

Block diagram of work methodology for multi-parametric optimisation.
4.2 RSM setup
RSM is used to model and analyse a process using mathematical and statistical models in which the response is affected by process variables [23]. This technique aids in developing a correlation between the input operational parameters and the output responses. Using this technique, the influence, level of influence, and depth of interaction between the input and output responses are determined, by implying the Box–Cox plot, Cook’s distance, contour and 3D surface plots, and DFFITS and DFBETAS analyses. In the current study, the effect of input operational parameters, such as injection pressure, load, and WPO + blends, on output parameters, such as BTE and NOx, is determined for WPO-fuelled CRDi diesel engines. This process helps in the optimisation of the engineering process to obtain an optimum response with multiple variables that significantly influence the response. Any output parameter that gives an idea of the quality of the process is known as a response, and the RSM outlines a functional relation between the input variables and the output responses, as given in Eq. 1, where
where
The response data are used in the equations to find out the RSM model regression coefficient. ANOVA is carried out to know the influential process parameters for the output responses. The RSM is designed as per the BBD so that a minimum number of experimental runs can be generated as compared to other design methods. Further, the R-squared value and the adjusted and predicted R-squared values are noted for validation of the regression equation.
4.2.1 BBD for multivariate optimisation
In an exhaustive study done by Ferreira et al. [29], they discussed the fundamentals, advantages, and limitations of the BBD. In the current work, BBD is used to design the experimental matrix, where three input operational parameters show interaction with two output responses to obtain 15 sets of experiments. The goal, weights, and importance for each adopted parameter are tabulated as shown in Table 5.
Goal, weights, and importance of each selected input and output parameters
| Name | Goal | Lower limit | Upper limit | Lower weight | Upper weight | Importance |
|---|---|---|---|---|---|---|
| A: fuel blend | is in range | 5 | 15 | 1 | 1 | 3 |
| B: injection pressure | is in range | 30 | 40 | 1 | 1 | 3 |
| C: load (IMEP) | is in range | 2.1 | 6.2 | 1 | 1 | 3 |
| BTE | maximise | 10.5 | 32.5 | 1 | 1 | 3 |
| NOx | minimise | 23 | 268 | 1 | 1 | 3 |
The number of experiments (N) required for the development of BBD can be simply written as Eq. 3:
where k is the number of factors and
Thus, with the given formula and the underlying theory that BBD designs always have three levels for each parameter to fit a polynomial model for three input operational parameters and two output responses, and we realised 15 experimental runs. The input operational parameters taken are injection pressure, load and fuel blends, and the output responses taken are BTE and NOx emission. The experimental matrix with coded and non-coded forms developed using the BBD under the RSM technique is displayed in Table 6.
Experimental layout as per the BBD with output responses
| Fuel blend | Injection pressure | Load (IMEP) | BTE | NOx emission | |
|---|---|---|---|---|---|
| Units | % | MPa | Bar | % | ppm |
| 1 | 5 | 30 | 4.15 | 17.2 | 165 |
| 2 | 5 | 35 | 2.1 | 30.5 | 34 |
| 3 | 5 | 35 | 6.2 | 11.5 | 255 |
| 4 | 5 | 40 | 4.15 | 15.3 | 230 |
| 5 | 10 | 30 | 2.1 | 32.4 | 43 |
| 6 | 10 | 30 | 6.2 | 12.5 | 205 |
| 7 | 10 | 35 | 4.15 | 14.1 | 250 |
| 8 | 10 | 35 | 4.15 | 14.2 | 240 |
| 9 | 10 | 35 | 4.15 | 14.2 | 245 |
| 10 | 10 | 40 | 2.1 | 30.7 | 23 |
| 11 | 10 | 40 | 6.2 | 10.5 | 268 |
| 12 | 15 | 30 | 4.15 | 16.1 | 180 |
| 13 | 15 | 35 | 2.1 | 32.5 | 92 |
| 14 | 15 | 35 | 6.2 | 11.2 | 236 |
| 15 | 15 | 40 | 4.15 | 16.3 | 230 |
5 Results and discussion
The results obtained from the experiments performed are provided in the following sections where the impact and assessment analysis of the input operational parameters on the output responses is done by dividing the analysis into two categories. First, after developing a reduced ANOVA table, diagnostics plots are drawn for BTE and NOx. Second, an influence plot is drawn to find the significant parameter affecting the output response. Thereafter, the desirability and sensitivity analysis is carried out to know the depth of influence of input parameters over the output responses. Moreover, a comparison between the experimental value and the predicted value of the regression model for the output response is done and percentage change is noted.
5.1 Statistical response analysis
5.1.1 ANOVA
Design-Expert v12 is used for the current study. The ANOVA test is carried out to know the significant process parameters influencing the output responses. The ANOVA table of BTE is shown in Table 7. From the ANOVA table, the insignificant interaction term is removed and a new reduced ANOVA test is done. So, the accuracy of the prediction data will be increased than that obtained from the regression equation model of BTE [30].
ANOVA for BTE
| Source | Sum of squares | Df | Mean square | F-value | p-value |
|---|---|---|---|---|---|
| Model | 962.10 | 9 | 106.90 | 583.09 | <0.0001 |
| A – fuel blend | 0.3200 | 1 | 0.3200 | 1.75 | 0.2437 |
| B – injection pressure | 3.64 | 1 | 3.64 | 19.88 | 0.0066 |
| C – load | 808.02 | 1 | 808.02 | 4407.38 | <0.0001 |
| AB | 1.10 | 1 | 1.10 | 6.01 | 0.0578 |
| AC | 1.32 | 1 | 1.32 | 7.21 | 0.0435 |
| BC | 0.0225 | 1 | 0.0225 | 0.1227 | 0.7404 |
| A² | 3.54 | 1 | 3.54 | 19.31 | 0.0071 |
| B² | 4.30 | 1 | 4.30 | 23.45 | 0.0047 |
| C² | 145.58 | 1 | 145.58 | 794.07 | <0.0001 |
| Residual | 0.9167 | 5 | 0.1833 | ||
| Lack of fit | 0.9100 | 3 | 0.3033 | 91.00 | 0.0109 |
| Pure error | 0.0067 | 2 | 0.0033 | ||
| Cor total | 963.02 | 14 |
From Table 7, it can be observed that the model F value is 583.09, which states that the model is significant. The predicted R² of 0.9849 is in reasonable agreement with the adjusted R² of 0.9973. P-values less than 0.0500 indicates that model terms are significant. In this case, B, C, AC, A², B², and C² are significant model terms. Since the process parameter cannot be removed, the reduced ANOVA is formed by removing the interaction term BC, as shown in Table 8.
Reduced ANOVA for BTE
| Source | Sum of squares | Df | Mean square | F-value | p-value |
|---|---|---|---|---|---|
| Model | 962.08 | 8 | 120.26 | 768.30 | <0.0001 |
| A – fuel blend | 0.3200 | 1 | 0.3200 | 2.04 | 0.2027 |
| B – injection Pressure | 3.64 | 1 | 3.64 | 23.29 | 0.0029 |
| C – load | 808.02 | 1 | 808.02 | 5162.15 | <0.0001 |
| AB | 1.10 | 1 | 1.10 | 7.04 | 0.0378 |
| AC | 1.32 | 1 | 1.32 | 8.45 | 0.0271 |
| A² | 3.54 | 1 | 3.54 | 22.62 | 0.0031 |
| B² | 4.30 | 1 | 4.30 | 27.47 | 0.0019 |
| C² | 145.58 | 1 | 145.58 | 930.06 | <0.0001 |
| Residual | 0.9392 | 6 | 0.1565 | ||
| Lack of fit | 0.9325 | 4 | 0.2331 | 69.94 | 0.0141 |
| Pure error | 0.0067 | 2 | 0.0033 | ||
| Cor total | 963.02 | 14 |
From the reduced ANOVA table, Table 8, it can be observed that the model F-value increases to 768.30, which implies the model is more accurate. The value of predicted R² increases to 0.9879 and the adjusted R² increases to 0.9977. Hence, this ANOVA model can be considered for further analysis. Engine load is the most significant parameter that influences the BTE, followed by injection pressure and WPO + diesel fuel blend with p-values of 0.0001, 0.0029, and 0.2027, respectively. Similarly, the ANOVA test is done for NOx emission, as shown in Table 9.
ANOVA for the NOx emission
| Source | Sum of squares | Df | Mean square | F-value | p-value |
|---|---|---|---|---|---|
| Model | 1.066 × 10⁵ | 9 | 11,840.71 | 59.77 | 0.0001 |
| A – fuel blend | 364.50 | 1 | 364.50 | 1.84 | 0.2330 |
| B – injection pressure | 3,120.50 | 1 | 3,120.50 | 15.75 | 0.0106 |
| C – load | 74,498.00 | 1 | 74,498.00 | 376.06 | <0.0001 |
| AB | 56.25 | 1 | 56.25 | 0.2839 | 0.6169 |
| AC | 1,482.25 | 1 | 1,482.25 | 7.48 | 0.0410 |
| BC | 1,722.25 | 1 | 1,722.25 | 8.69 | 0.0319 |
| A² | 542.83 | 1 | 542.83 | 2.74 | 0.1588 |
| B² | 3,692.83 | 1 | 3,692.83 | 18.64 | 0.0076 |
| C² | 22,825.44 | 1 | 22,825.44 | 115.22 | 0.0001 |
| Residual | 990.50 | 5 | 198.10 | ||
| Lack of fit | 940.50 | 3 | 313.50 | 12.54 | 0.0748 |
| Pure error | 50.00 | 2 | 25.00 | ||
| Cor total | 1.076 × 10⁵ | 14 |
From the ANOVA table, Table 9, it can be observed that the model F-value of 59.77 recommends that the model is significant. P-values less than 0.0500 indicate that model terms of NOx emission are significant. In this case, B, C, AC, BC, B², and C² are significant model terms. The predicted R² of 0.8590 is in reasonable agreement with the adjusted R² of 0.9742. Since the process parameter cannot be removed, the reduced ANOVA is formed by removing the interaction term AB and A², as shown in Table 10.
Reduced ANOVA table of NOx emission
| Source | Sum of squares | Df | Mean square | F-value | p-value |
|---|---|---|---|---|---|
| Model | 1.060 ×10⁵ | 7 | 15,138.19 | 66.66 | <0.0001 |
| A – fuel blend | 364.50 | 1 | 364.50 | 1.61 | 0.2457 |
| B – injection pressure | 3,120.50 | 1 | 3,120.50 | 13.74 | 0.0076 |
| C – load | 74,498.00 | 1 | 74,498.00 | 328.07 | <0.0001 |
| AC | 1,482.25 | 1 | 1,482.25 | 6.53 | 0.0378 |
| BC | 1,722.25 | 1 | 1,722.25 | 7.58 | 0.0283 |
| B² | 3,498.92 | 1 | 3,498.92 | 15.41 | 0.0057 |
| C² | 22,419.78 | 1 | 22,419.78 | 98.73 | <0.0001 |
| Residual | 1,589.58 | 7 | 227.08 | ||
| Lack of fit | 1,539.58 | 5 | 307.92 | 12.32 | 0.0768 |
| Pure error | 50.00 | 2 | 25.00 | ||
| Cor total | 1.076 × 10⁵ | 14 |
From the reduced ANOVA table, Table 10, it can be observed that the model F-value increases to 66.66. The predicted R² increases to 0.8988 and is in reasonable agreement with the adjusted R² of 0.9704. It is observed that engine load is the most significant parameter that influences NOx emission, followed by injection pressure and WPO + diesel fuel blend with p-values of 0.0001, 0.0076, and 0.2457, respectively [30,31].
5.2 Diagnostic plot of the model for BTE and NOx
It is pertinent to mention here that authors have divided the statistical response analysis into two phases, i.e. diagnostic and influence plots. Investigative analysis of the model prepared is done to validate whether the proposed model will be accurate or not.
5.2.1 Surface plots, contours, interactions, and residuals have the following implications
It is essential to include succinct explanations regarding the consequences of contours, interactions, residuals, and surface plots. The visualisations function in multiple manners to aid in the confirmation and comprehension of the regression model [32,33].
5.2.2 Surface contours and 3D plots
The interaction effects among various input parameters and the output responses (BTE and NOx) are graphically depicted in these plots.
Implications: Define regions of optimum performance and emissions, demonstrating the influence of operational parameter variations on the engine’s behaviour.
5.2.3 Plots of residuals versus expected
By examining the residual distribution, these graphs aid in evaluating the statistical validity and mathematical reliability of the regression model.
Implications: The presence of a consistent pattern in residuals serves as an indicator of the accuracy of the model, whereas anomalies may indicate potential areas that require refinement of the model.
5.2.4 Plots of normal probability
By examining the residuals for normality, these graphs verify that the model’s assumptions are satisfied.
Implications: The reliability of the model is indicated by a linear distribution along the expected line.
5.2.5 Prediction and validation accuracy
It is vital to discuss the methods utilised for validation, including diagnostic and influence diagrams in the regression model, such as Box–Cox, Cook’s distance, leverage, and DFFITS, which enhance its credibility.
5.2.6 Normal probability and residuals versus predicted
Elucidate how validating the randomness and normality of residuals through these plots ensures the accuracy of predictions.
Compare the Run Plot with Residuals Plot and explain how the latter aids in the detection of unknown variables and assures the experiment’s stability.
5.2.7 Plots predicted versus actual
Explore on the agreement between anticipated predicted and observed values, underscoring the reliability of the model.
5.2.8 Box–Cox analysis of plots
The Box–Cox plots’ role in determining the necessity for power transformations will be examined. The absence of any transformation indicates that the model is robust.
5.3 Implications of residuals versus expected plots and normal probability plots
5.3.1 Plots for normal probability
Normal probability graphs are valuable plots for determining whether residuals follow a normal distribution. The presence of a linear distribution accompanied by minimal fluctuations offers assurance regarding the accuracy of the model’s predictions. The lack of substantial deviations from the mean value indicates that the model’s assumptions are valid, thereby strengthening the reliability of the predictions.
5.3.2 Plots of residuals versus expected
Plots for residuals versus expected validate the regression model. The absence of a discernible pattern in the random distribution of points indicates that the model is adequate. The lack of discernible patterns indicates that the output response is not being influenced by unknown variables, which provides additional evidence for the regression model’s accuracy.
5.3.2.1 Normal probability
The normality plots of residuals for the BTE and NOx emission are shown in Figure 5a and b, respectively. It can be seen that the error value and the residual value are distributed along a linear line with a small fluctuation in both cases, which indicate the model predictions will give an accurate result.
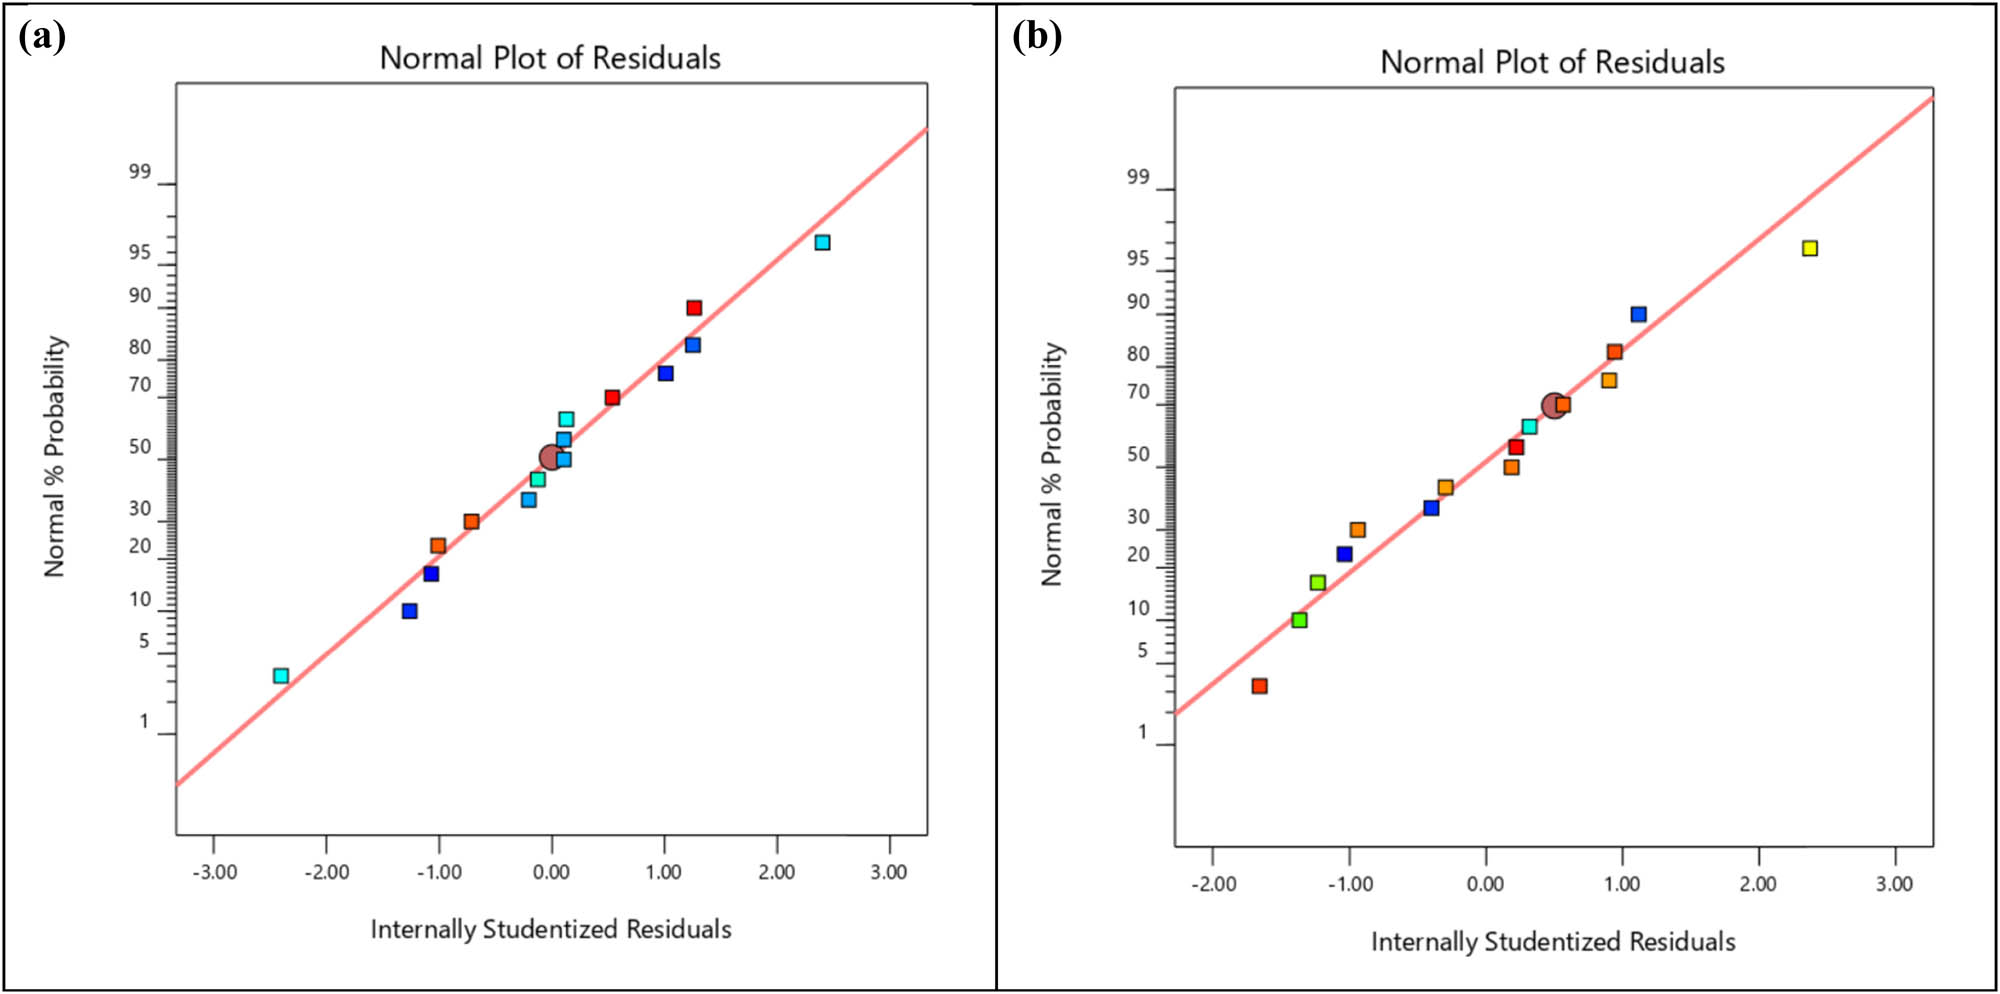
(a) Normal probability residual plot of BTE. (b) Normal probability residual plot of NOx emission.
5.3.2.2 Residuals vs predicted
The residuals versus predicted plots are shown in Figure 6a and b for BTE and NOx emissions, respectively. It can be visualised from these plots that the model created till now is satisfactory and can be further used to generate the regression equations. No specific pattern is observed in these plots as the points are randomly distributed, which signifies the accuracy of the proposed regression model. This is observed for both BTE and NOx emissions.
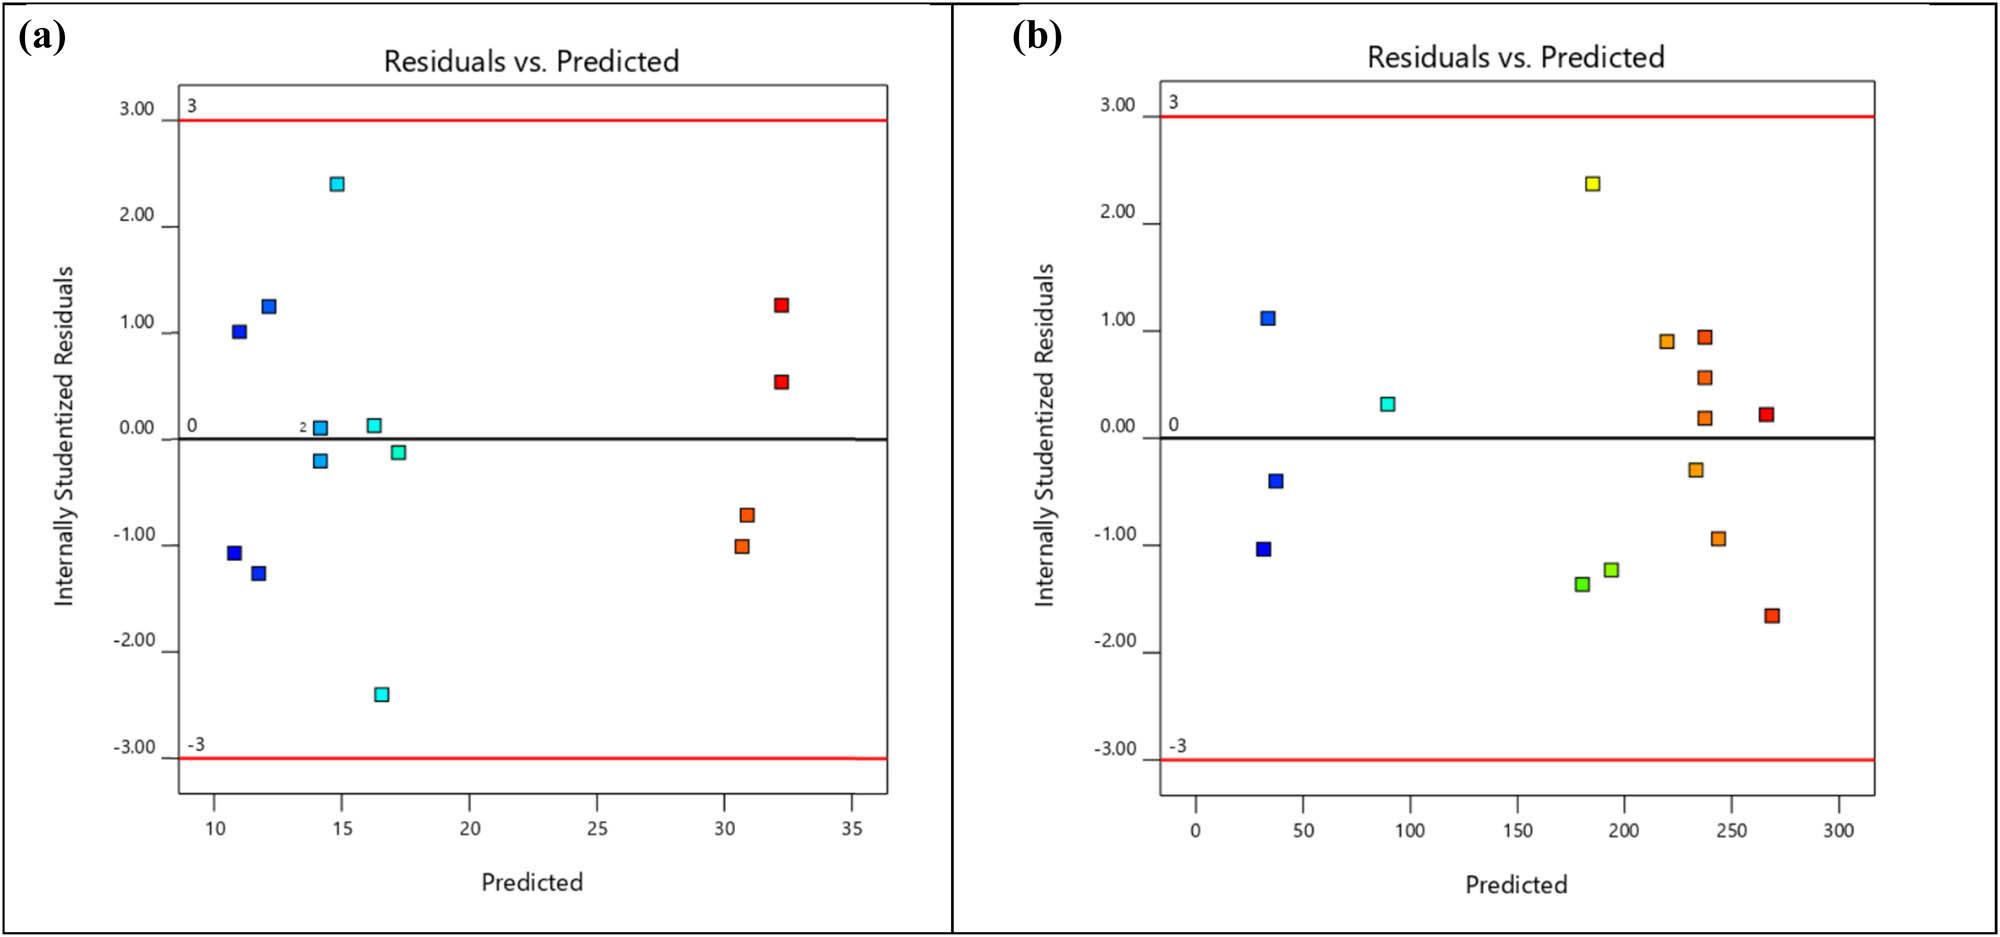
(a) Residuals versus predicted plot of BTE. (b) Residuals versus predicted plot of NOx emission.
5.3.2.3 Residuals vs run plot
The residuals versus run plots for BTE and NOx are plotted in Figure 7a and b, respectively. These plots help to check the unknown and not controlled variable or lurking variable that influences the output response during the experiment. A trend in the plot time-related variable is present in the background. A random scatter plot is observed, which indicates that no lurking variables are present in the experiment. The residual versus run plot of BTE varies the internally studentized residuals from −2.401 to 2.401. Similarly, the NOx emission varies the internally studentized residuals from −1.656 to 2.374.
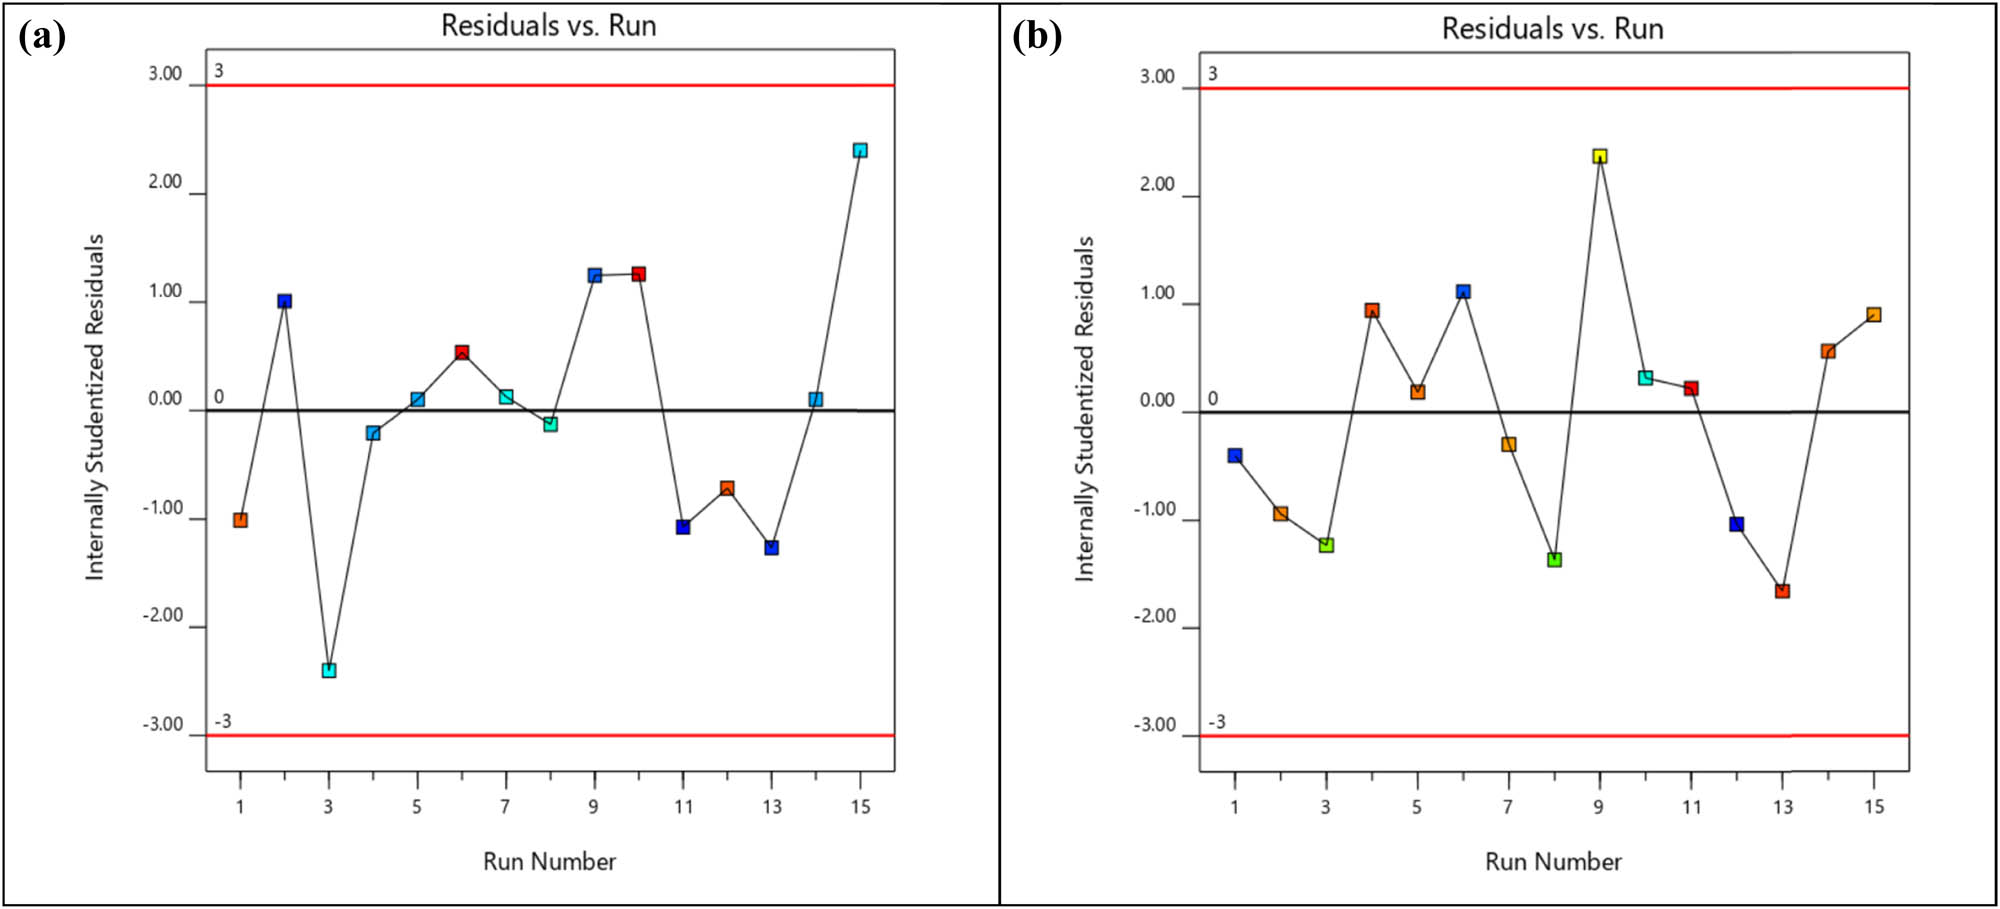
(a) Residual versus run plot of BTE. (b) Residual versus run plot of NOx emission.
5.3.2.4 Predicted vs actual plots
The predicted versus actual plots for BTE and NOx emission are shown in Figure 8a and b, respectively. The plots show an agreement of the actual values with the predicted value of the proposed regression model. It can be observed that the BTE and NOx emission data are approximately normally distributed along the linear line with minor fluctuations (especially in the case of NOx).
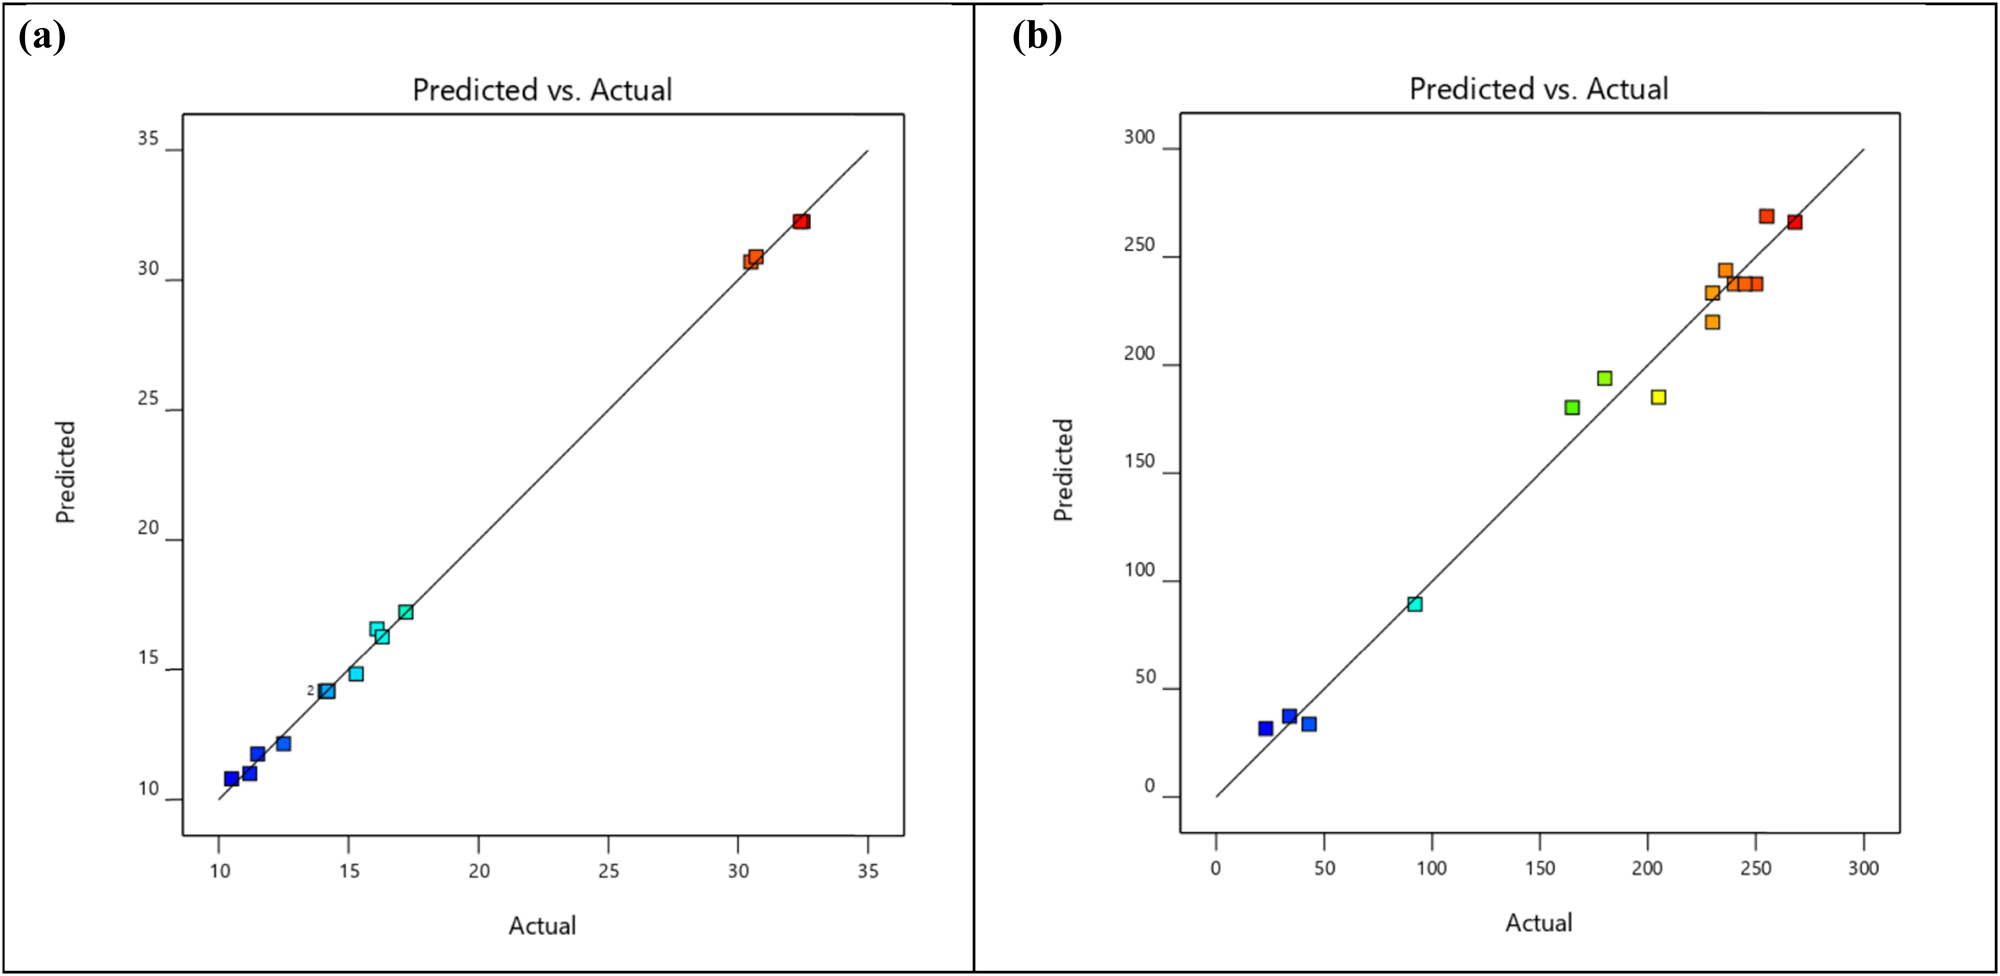
(a) Predicted versus actual values of BTE. (b) Predicted versus actual values of NOx emission.
5.3.2.5 Box–Cox plot analyses of BTE and NOx
The Box–Cox plot for the power transforms for BTE and NOx emission is plotted in Figure 9a and b, respectively. The Box–Cox plot helps to find out the most suitable power transformation that can be applied to the response data. The power law transformations can be applied to the responses if the value is greater than zero. The transformations lead to improvement in statistical analysis and diagnostic plots of the responses. The power transformation is represented by lambda.
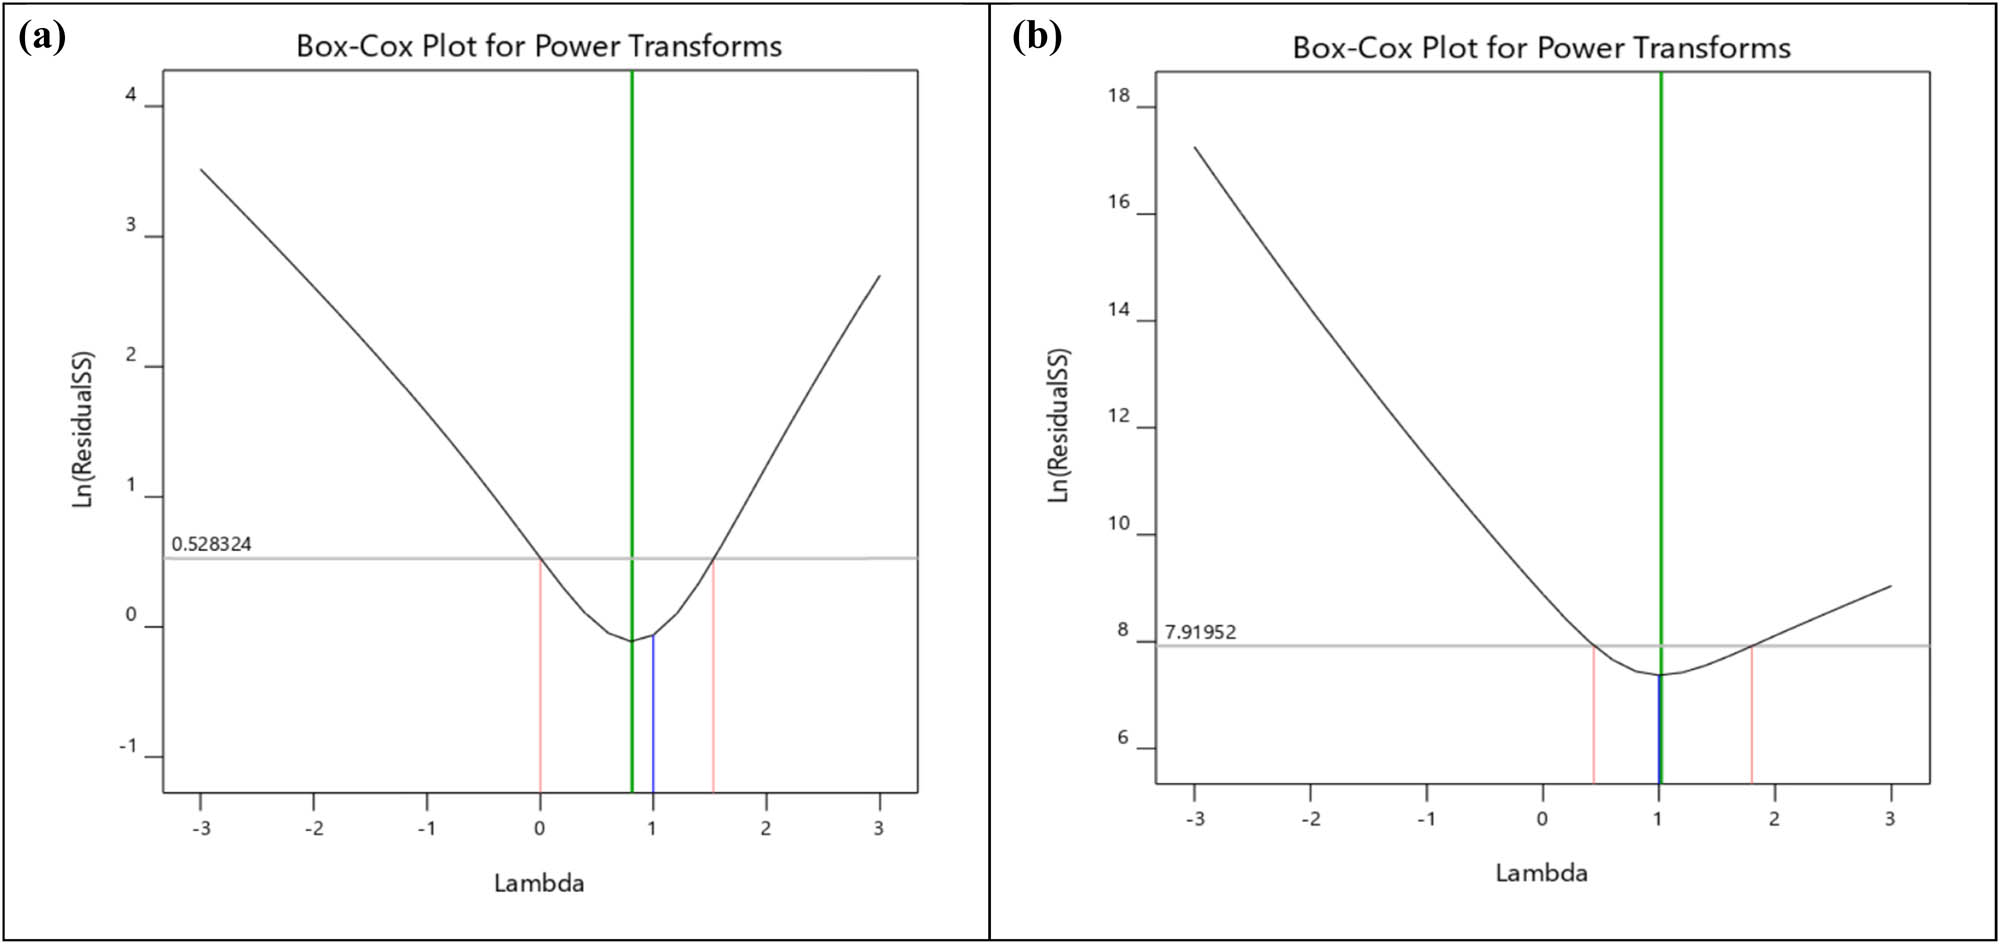
(a) Box–Cox plot for power transforms of BTE. (b) Box–Cox plot for power transforms of NOx emission.
Lambda = 1 indicates no transformation; Lambda = 0.5 indicates the square root; Lambda = 0 indicates the natural log; Lambda = −0.5 indicates the inverse square root; Lambda = −1 indicates inverse.
In this study, the lambda value for BTE is 0.81, and for NOx emission it is 1, including the 95% confidence interval. Since the lambda values of both BTE and NOx emissions are nearly equal to 1, no transformation is suggested.
After analysing the diagnostic plots, the following observations are noticed:
The residuals and predicted vs actual points of the BTE and NOx emissions are aligned along the normalised lines, which indicates that the prediction of the proposed regression model will be more accurate.
No power transform for both BTE and NOx is suggested as the lambda values are near 1.
5.3.3 Influence plots of BTE and NOx
5.3.3.1 Leverage vs run number plots of BTE and NOx
Figure 10a and b shows the leverage versus run plot for BTE and NOx emission, respectively. The leverage plot shows the impact of individual design points on the model’s predicted values. The leverage value of the individual run varies from 0 to 1. The leverage value of 1 signifies that the residuals will be zero. It indicates the predicted value of regression model is equal to the experimental value. An experiment can have a maximum leverage of 1/k, where k is termed as the number of times the experiment is repeated. For calculating the leverage value, Eq. 4 is used.
where H represents the (n × n) symmetric matrix, X is the term used as the model matrix, and T is the transpose. It has one row for every design (n) and one column for every term in the model (p). The leverage represents the diagonal elements of the H matrix. It is observed that the leverage value of BTE lies between 0.333 and 0.75, and the leverage value range for NOx emission lies within the range of 0.231–0.692. This shows that the deviations of the leverage value for BTE and NOx lie within the defined range of 0 to 1 and are inclined towards 1. This implies predictions of the proposed regression model will be accurate for both.
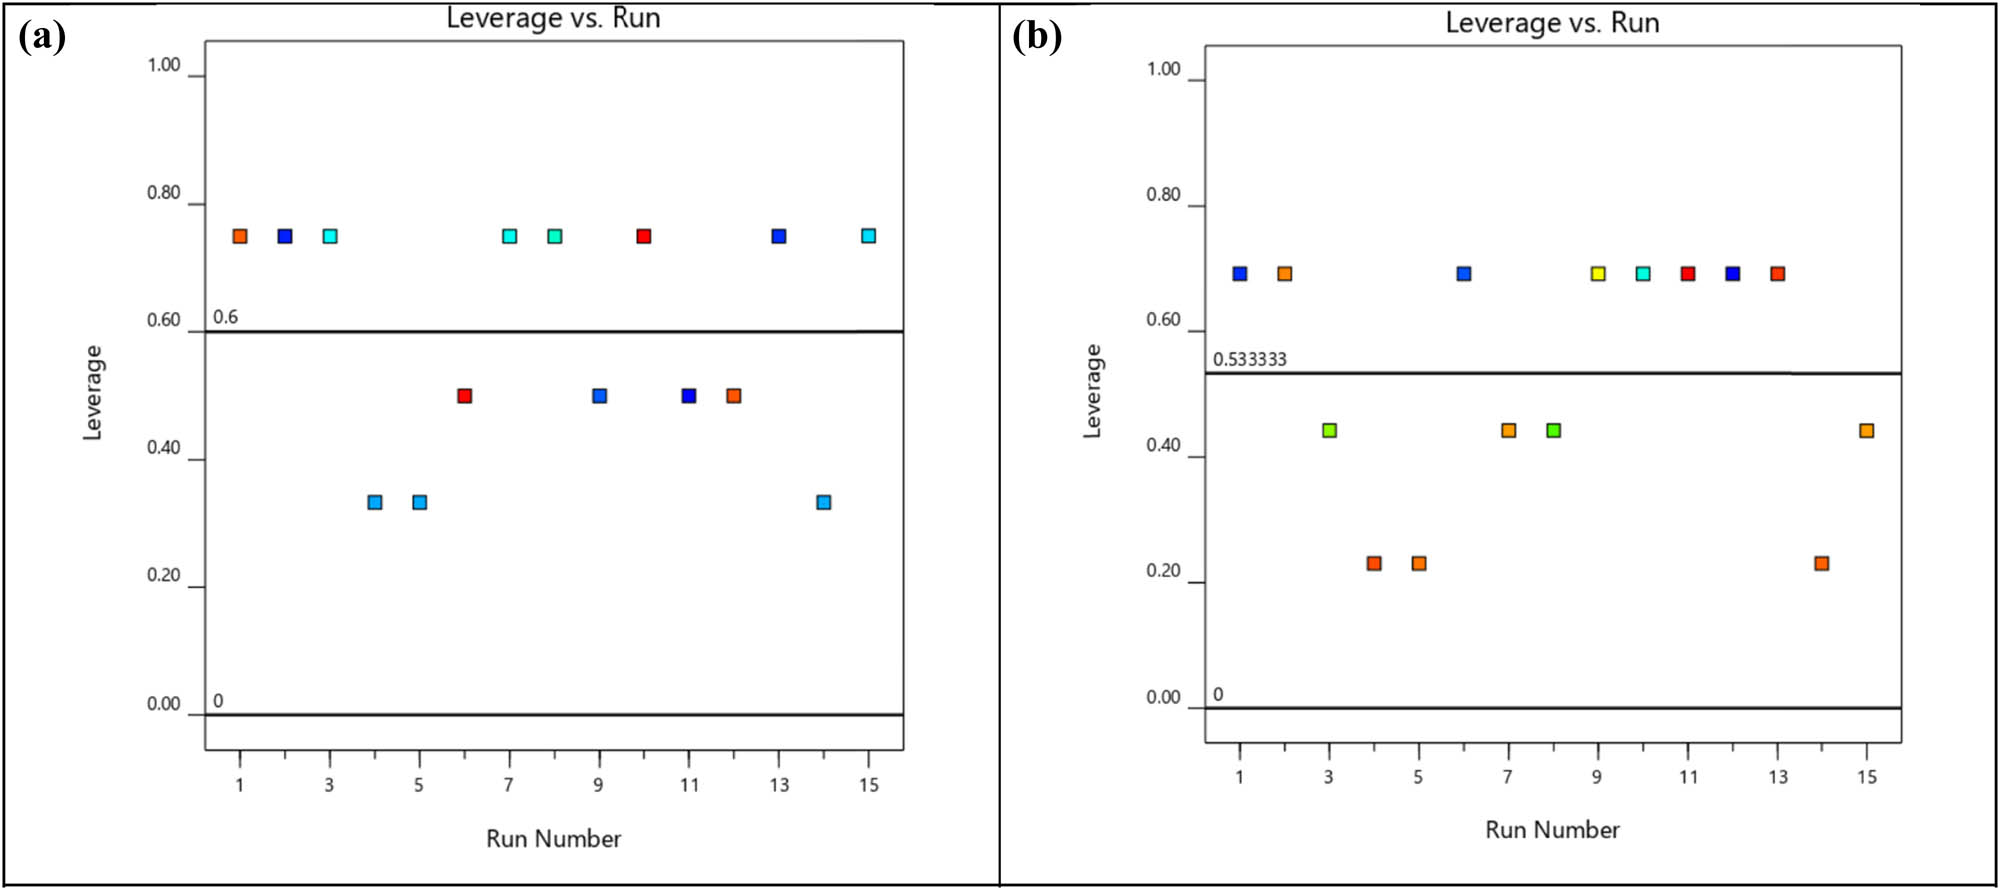
(a) Leverage versus run plot of BTE. (b) Leverage versus run plot of NOx emission.
5.3.3.2 DDFITS vs run analysis of BTE and NOx
Figure 11a and b shows the DFFITS versus run plot for BTE and NOx emission. The DFFITS value analyses the effect of ith observation on the predicted value. It is calculated as the difference between the predicted value with the observed i and the predicted value without considering i. This is shown in Eq. 5.
The range of DFFITS value for most of the BTE responses is –2.33 to 2.33. The range of DFFITS value for most of the NOx emission responses is −2.950 to 3.308.
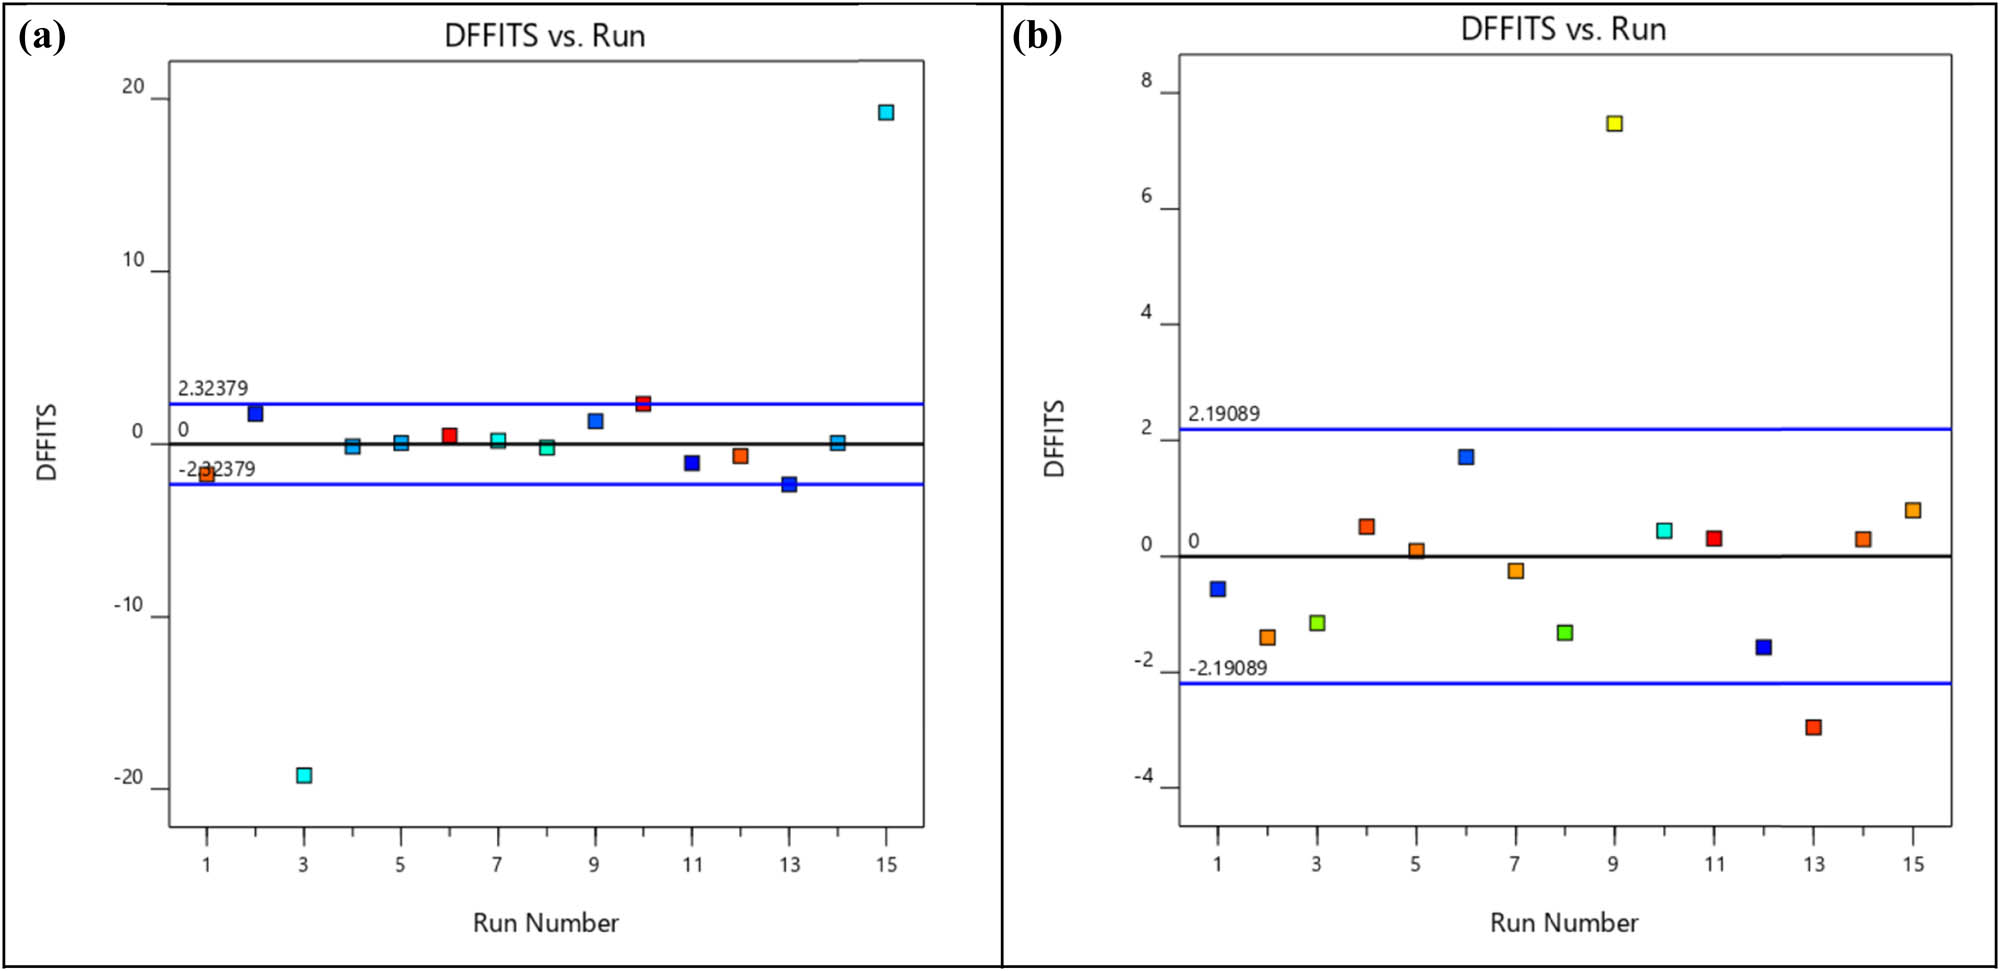
(a) DFFITS versus run plot of BTE. (b) DFFITS versus run plot of NOx emission.
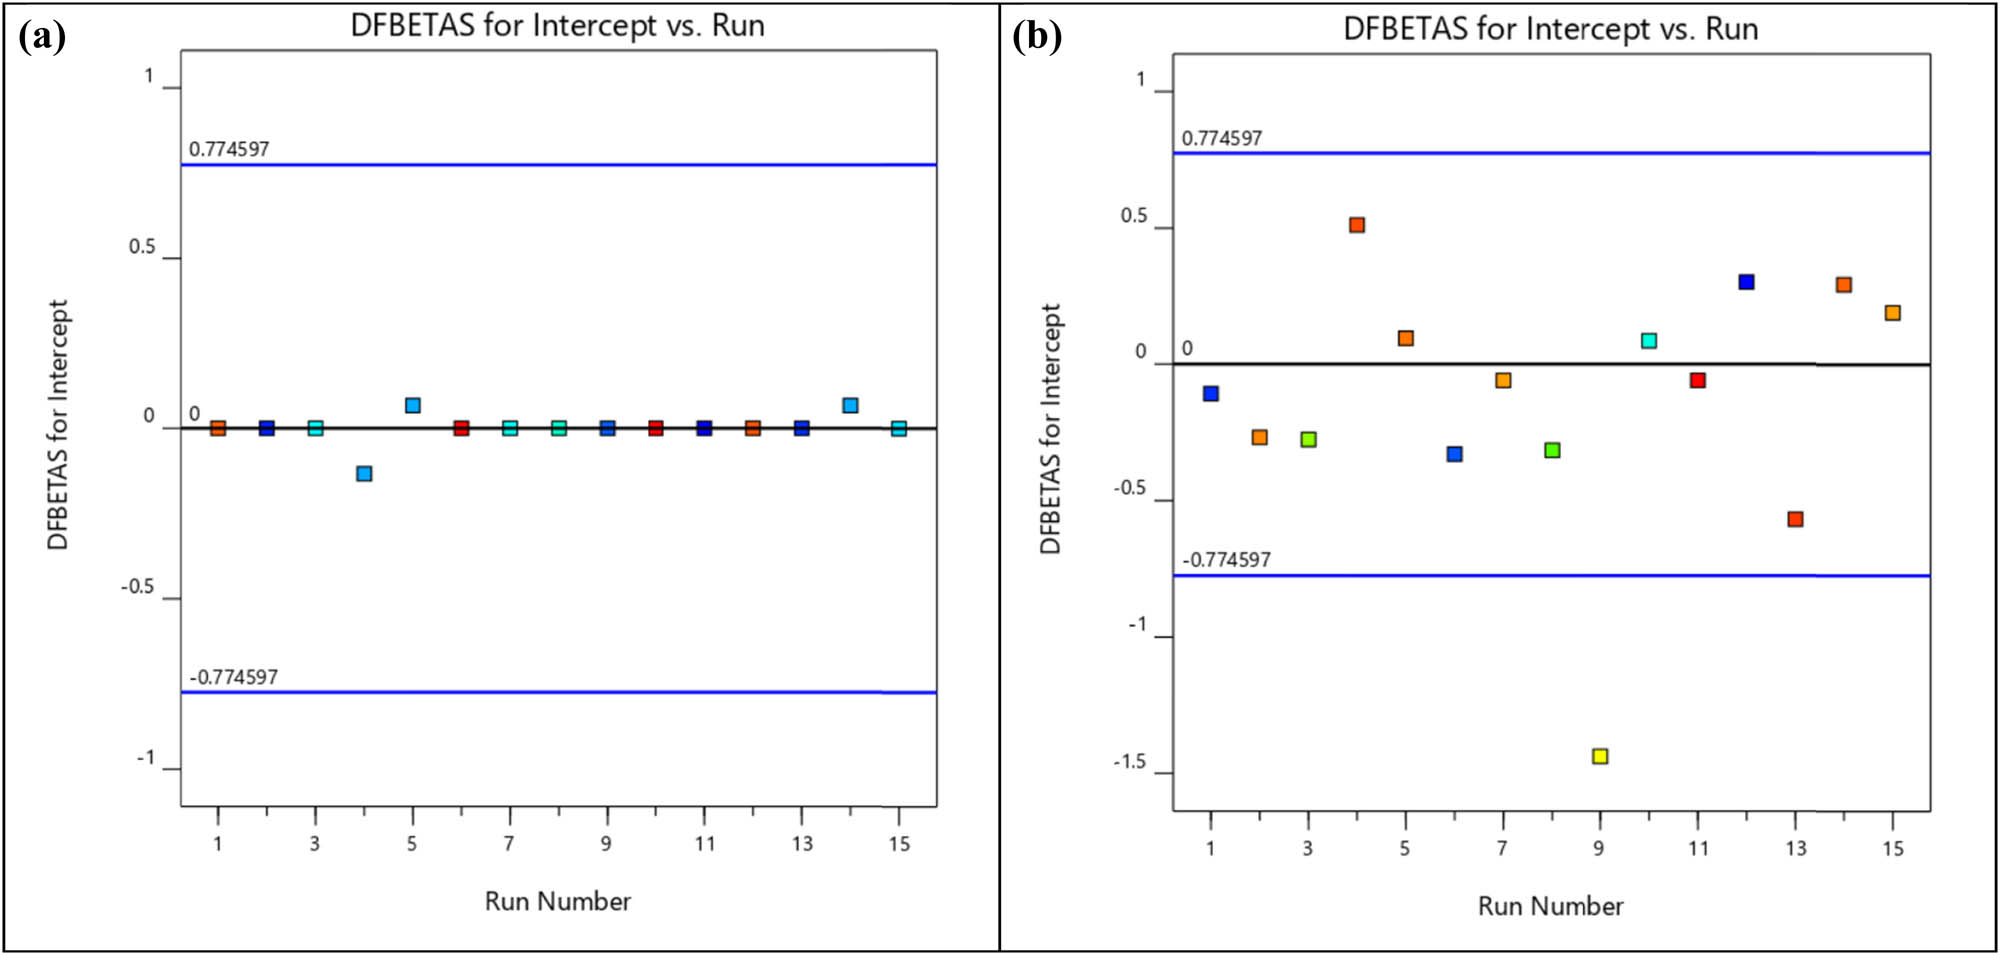
5.3.3.3 DFBETAS for intercept vs run analysis of BTE and NOx
The DFBETAS plot for the BTE and NOx emission is shown in Figure 12a and b, respectively. It shows the impacts of ith observation on each of the regression coefficients. If the ith observation is removed, then the number of standard order that the jth coefficients vary is termed DFBETAS j,i. This is shown in Eq. 6.
A large value of DFBETAS j,i signifies that the ith observation has higher impacts on the jth regression coefficient. From the BTE DFBETAS intercept versus run plot, the range of DFBETAS j,i is found to be −0.13369 to 0.066667, and the NOx emission DFBETAS j,i range is found to be −0.567747 to 0.51179.
(a) DFBETAS versus run plot of BTE. (b) DFBETAS versus run plot of NOx emission.
5.3.3.4 Cook’s distance vs run number analysis
Figure 13a and b shows the Cook’s distance with the run number for BTE and NOx. The Cook’s distance measures the variation of the regression model if the ith point will not be considered at the time of fitting the model. Cook’s distance (D i) is calculated by the product of the square of ith internally studentized residual and a monotonic function of the leverage, as shown in Eq. 7.
It is a standardised weighted distance that is calculated between the vector of regression coefficients found from the test set and the reduced test set compared with the error mean squared of the fitted model. The less the value of the Cook’s distance, the better the fitting of the model is achieved [36,37]. It can be seen that the model fitting is adequate.
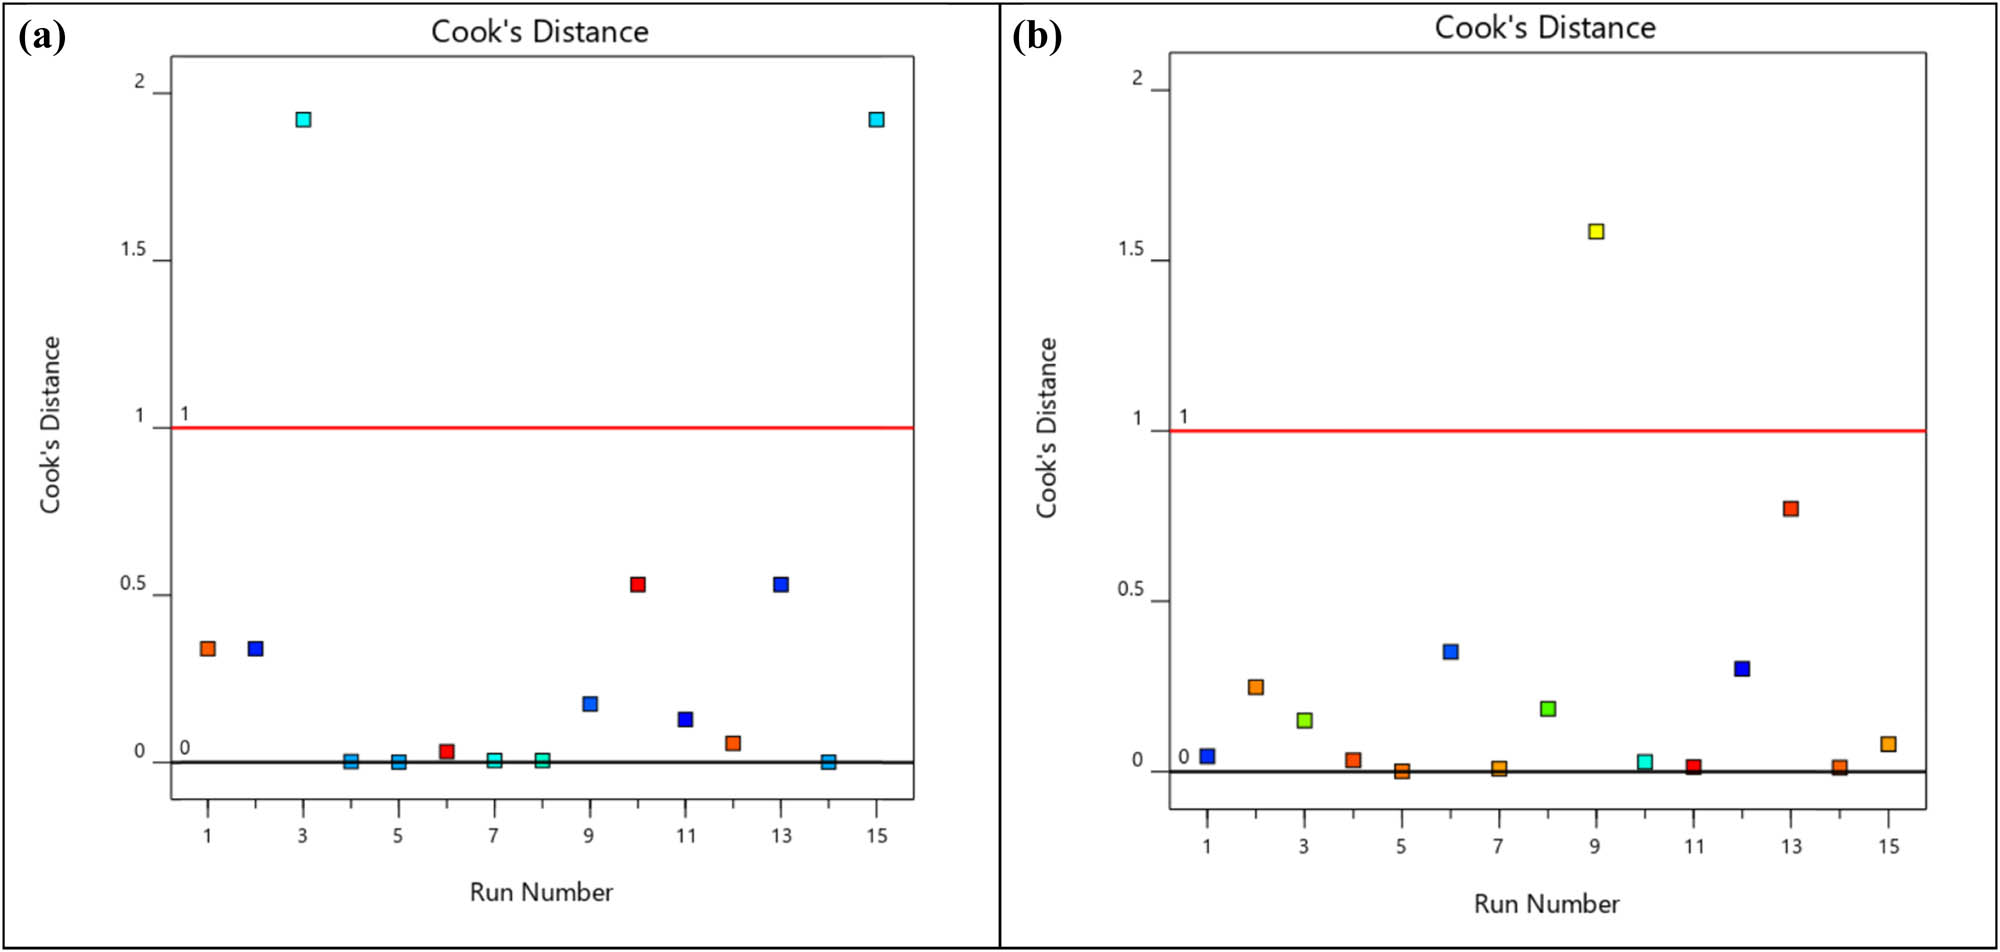
(a) Cook’s distance plot of BTE. (b) Cook’s distance plot of NOx emission.
6 Regression equation
It can be visualised from all obtained diagnostics and influence plots that the model created till now is satisfactory and can be further used to generate the regression equations. The final regression equation for the BTE and NOx emission is generated and mentioned as Eqs 8 and 9.
These regression equations can be further used to predict the given process parameter and their levels to find out the BTE and NOx emission values at the defined point. Figures 14 and 15 show the actual data versus predicted data from the regression equation of BTE and NOx emission, respectively. It depicts that regression model-predicted data are predicted accurately with average percentage errors of 1.3% and 8.2% when compared with the experimental value of BTE and NOx emission.
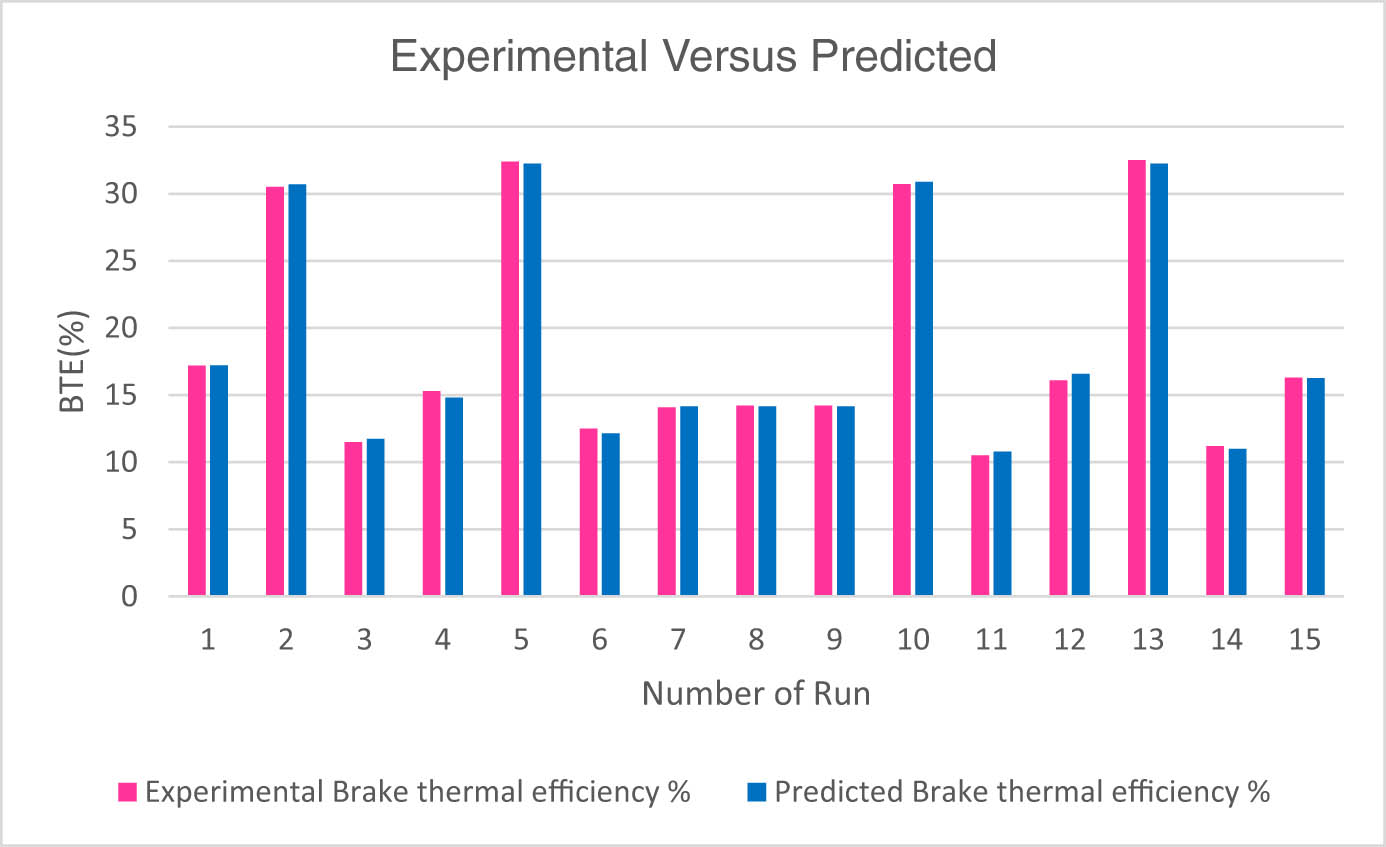
Comparison of experimental versus predicted values of BTE.
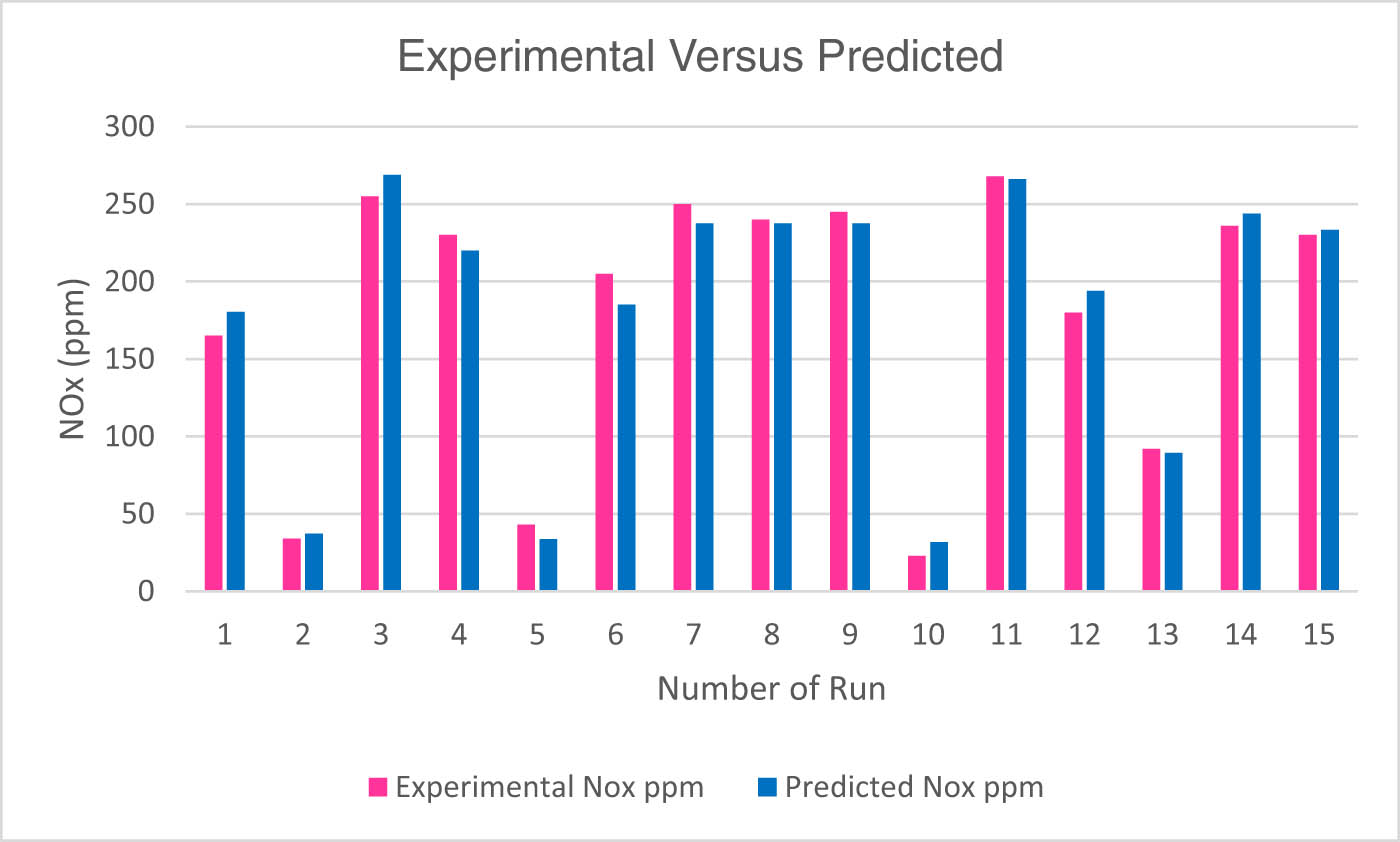
Comparison of experimental versus predicted values of NOx emission.
7 Optimisation of the input operational parameters
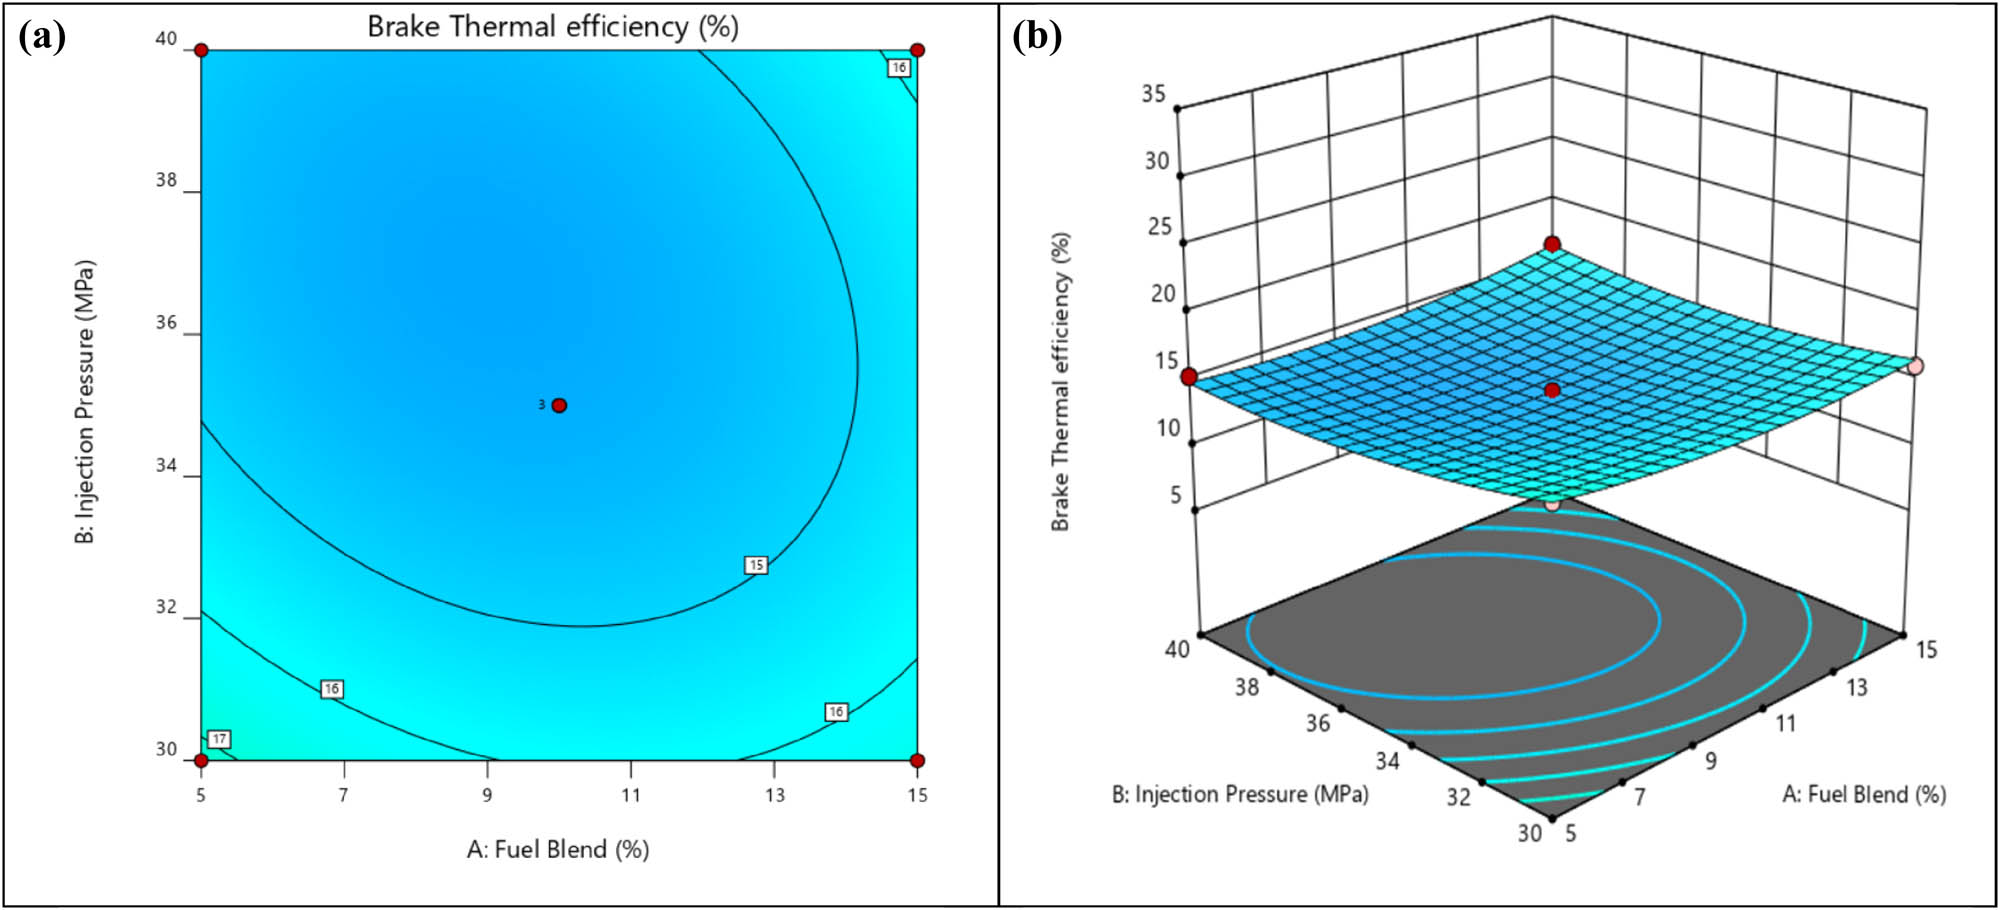
(a) Contour plot for BTE with the fuel blend and injection pressure. (b) 3D surface plot for BTE with fuel blend and injection pressure.
(a) Contour plot for BTE with the fuel blend and load. (b) 3D surface plot for BTE with fuel blend and load.
(a) Contour plot for BTE with injection pressure and load. (b) 3D surface plot for BTE with injection pressure and load.
7.1 BTE
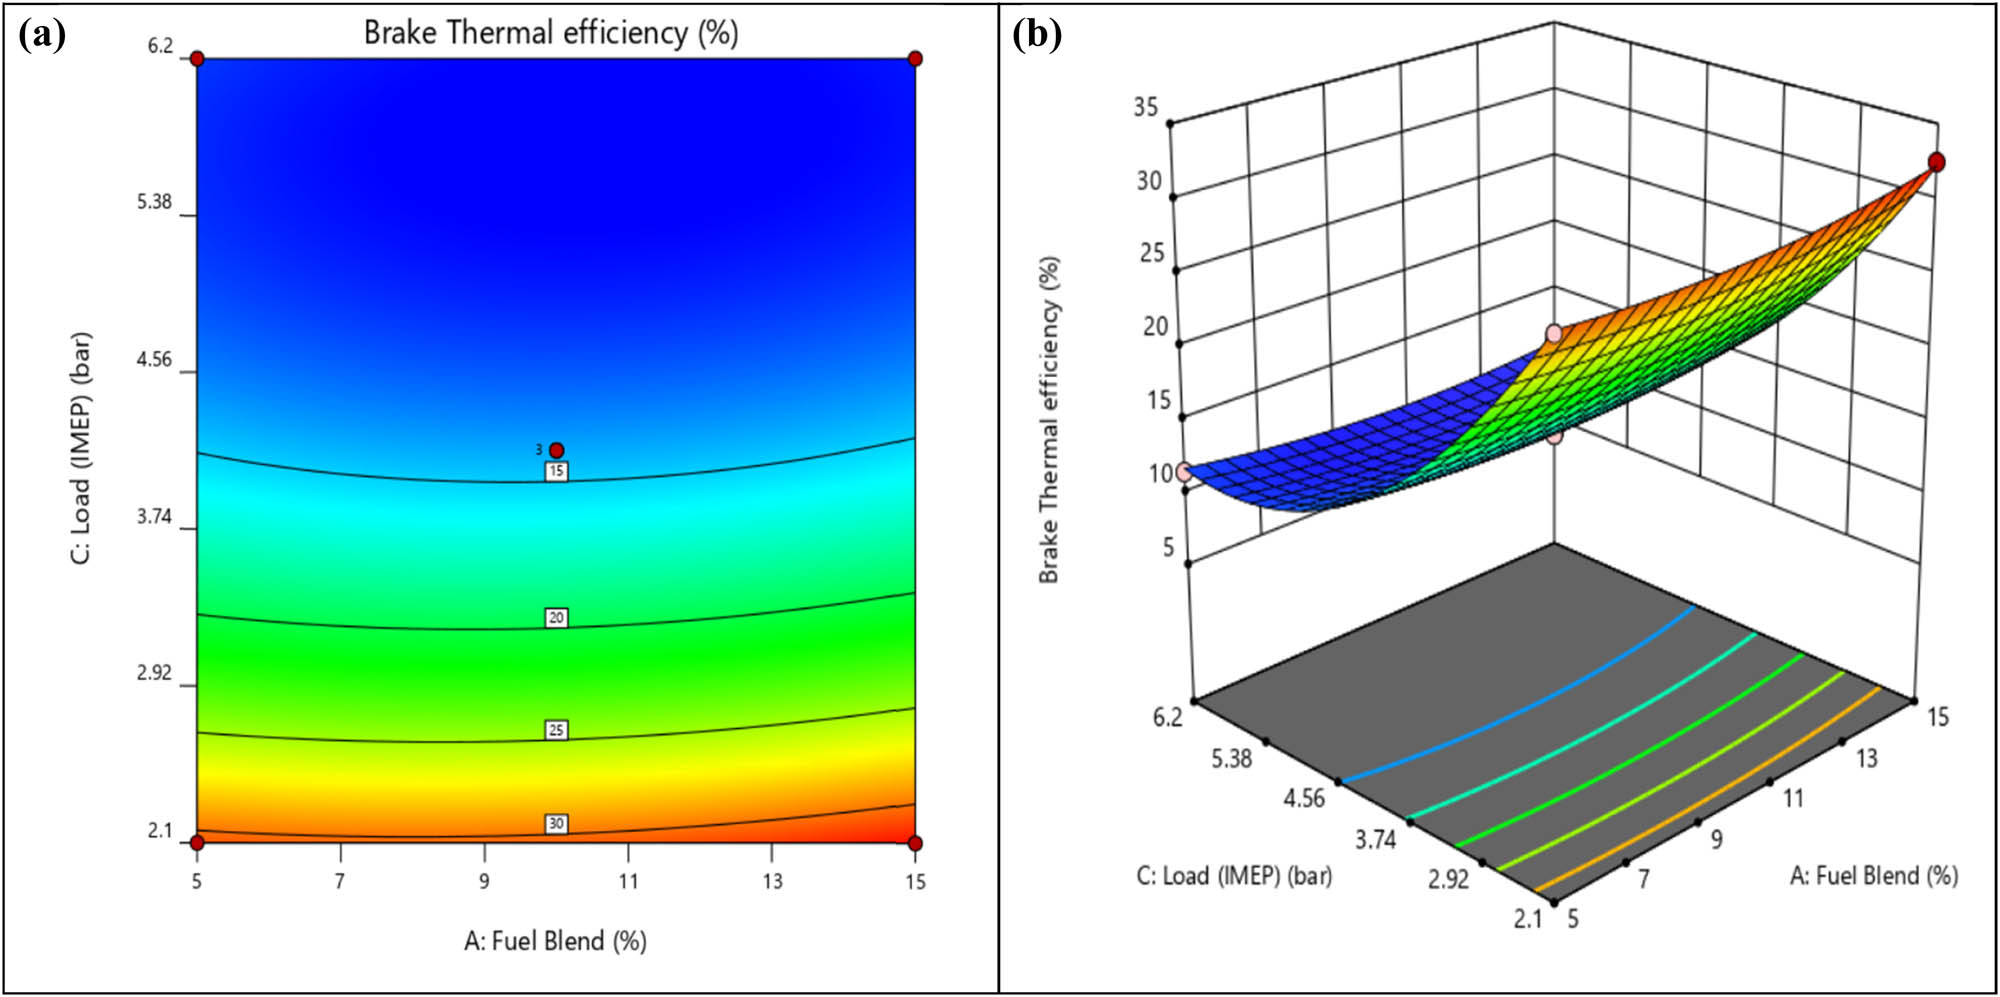
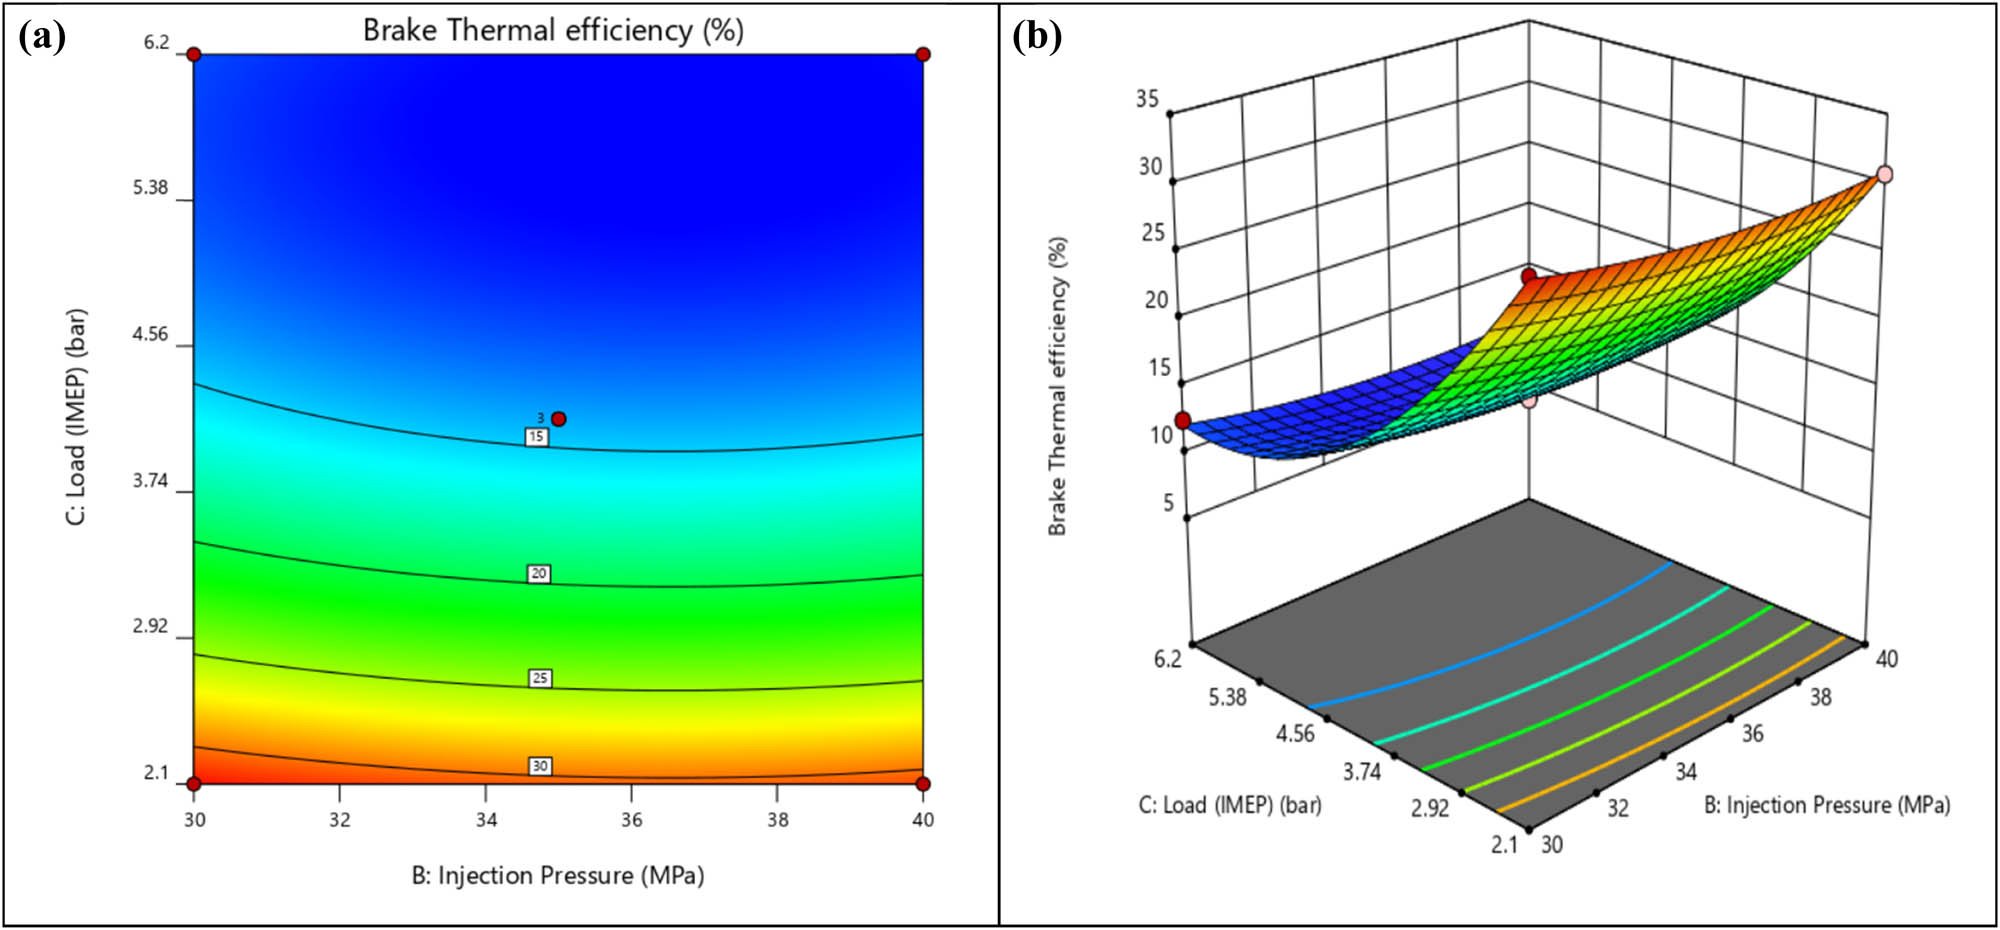
Figure 16a and b shows the contour and 3D surface plots for a combined effect of the fuel blend and injection pressure on the BTE. It can be observed that combining both does not significantly affect the change in BTE. Figure 17a and b shows the contour and 3D surface plots for the combined effect of fuel blend and load on the BTE. It can be detected that by increasing the fuel blend percentage and increasing the load value the BTE increases. Figure 18a and b shows the contour and 3D surface plots for the combined effect of injection pressure and load on the BTE. It can be seen that by increasing both the injection pressure and load the BTE increases.
7.2 NOx emission
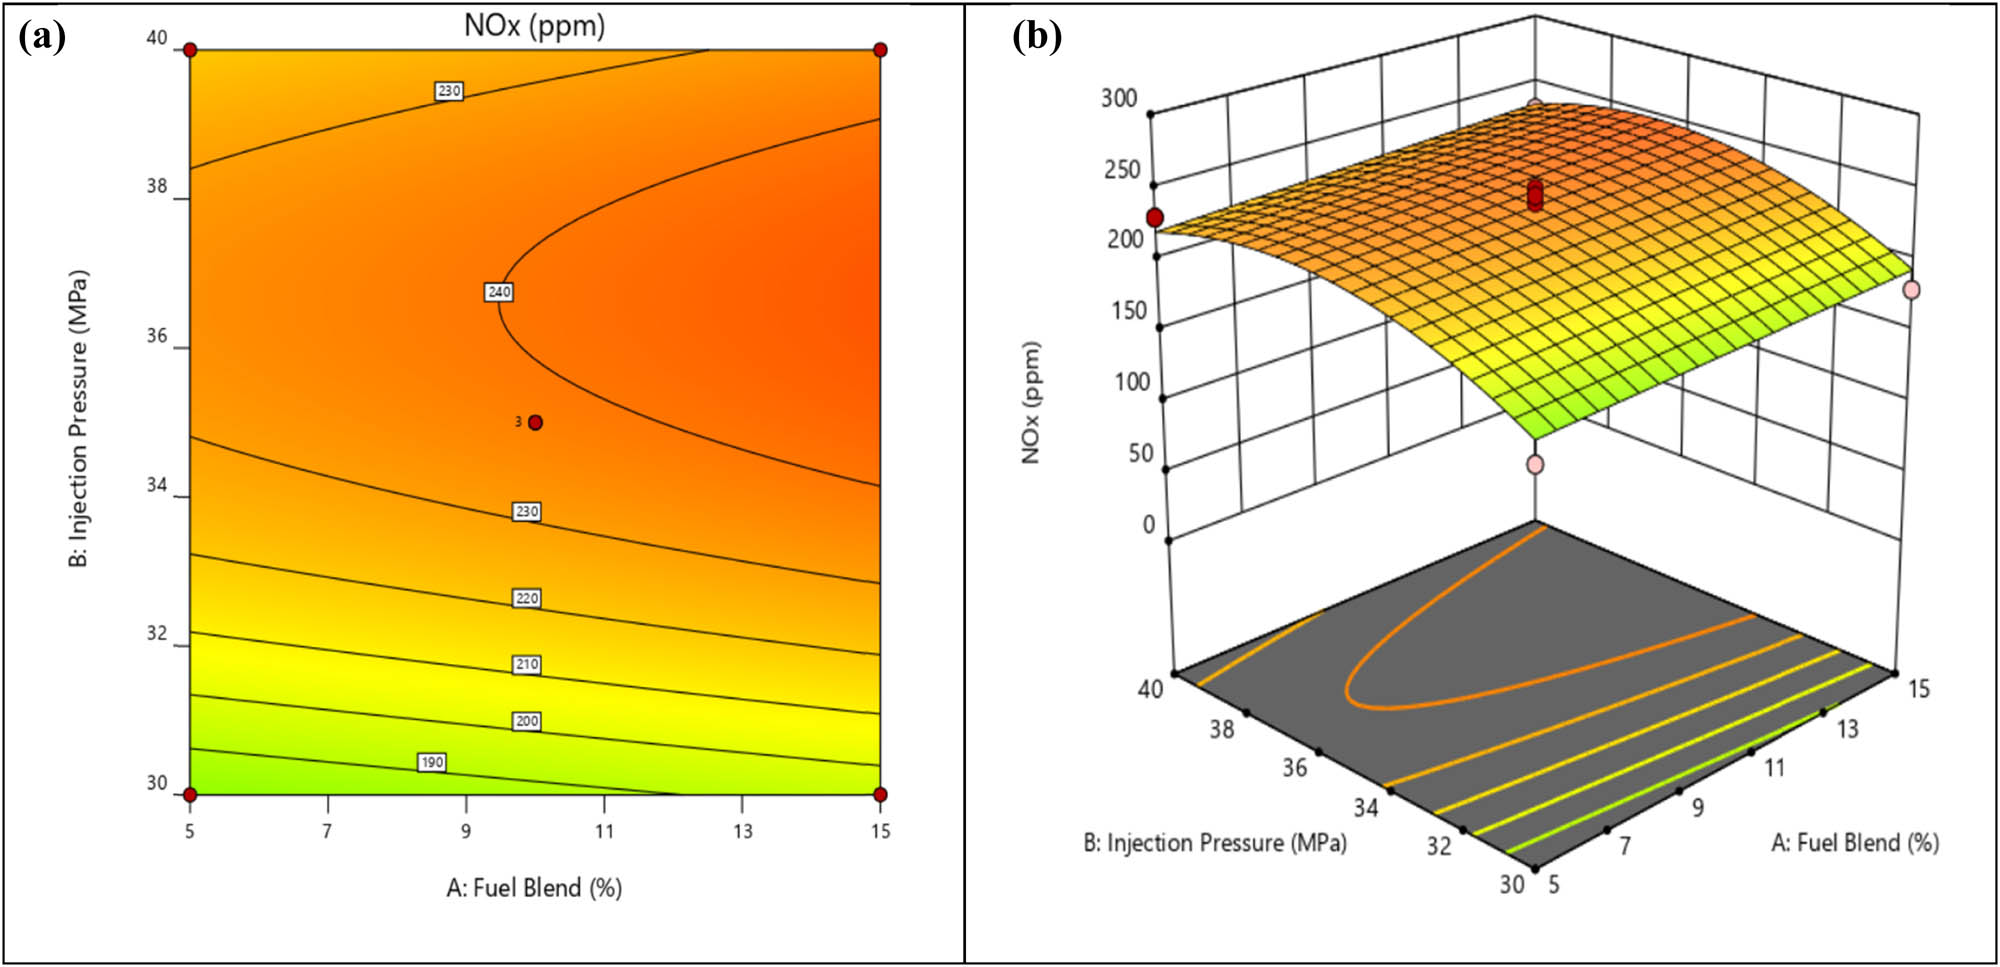
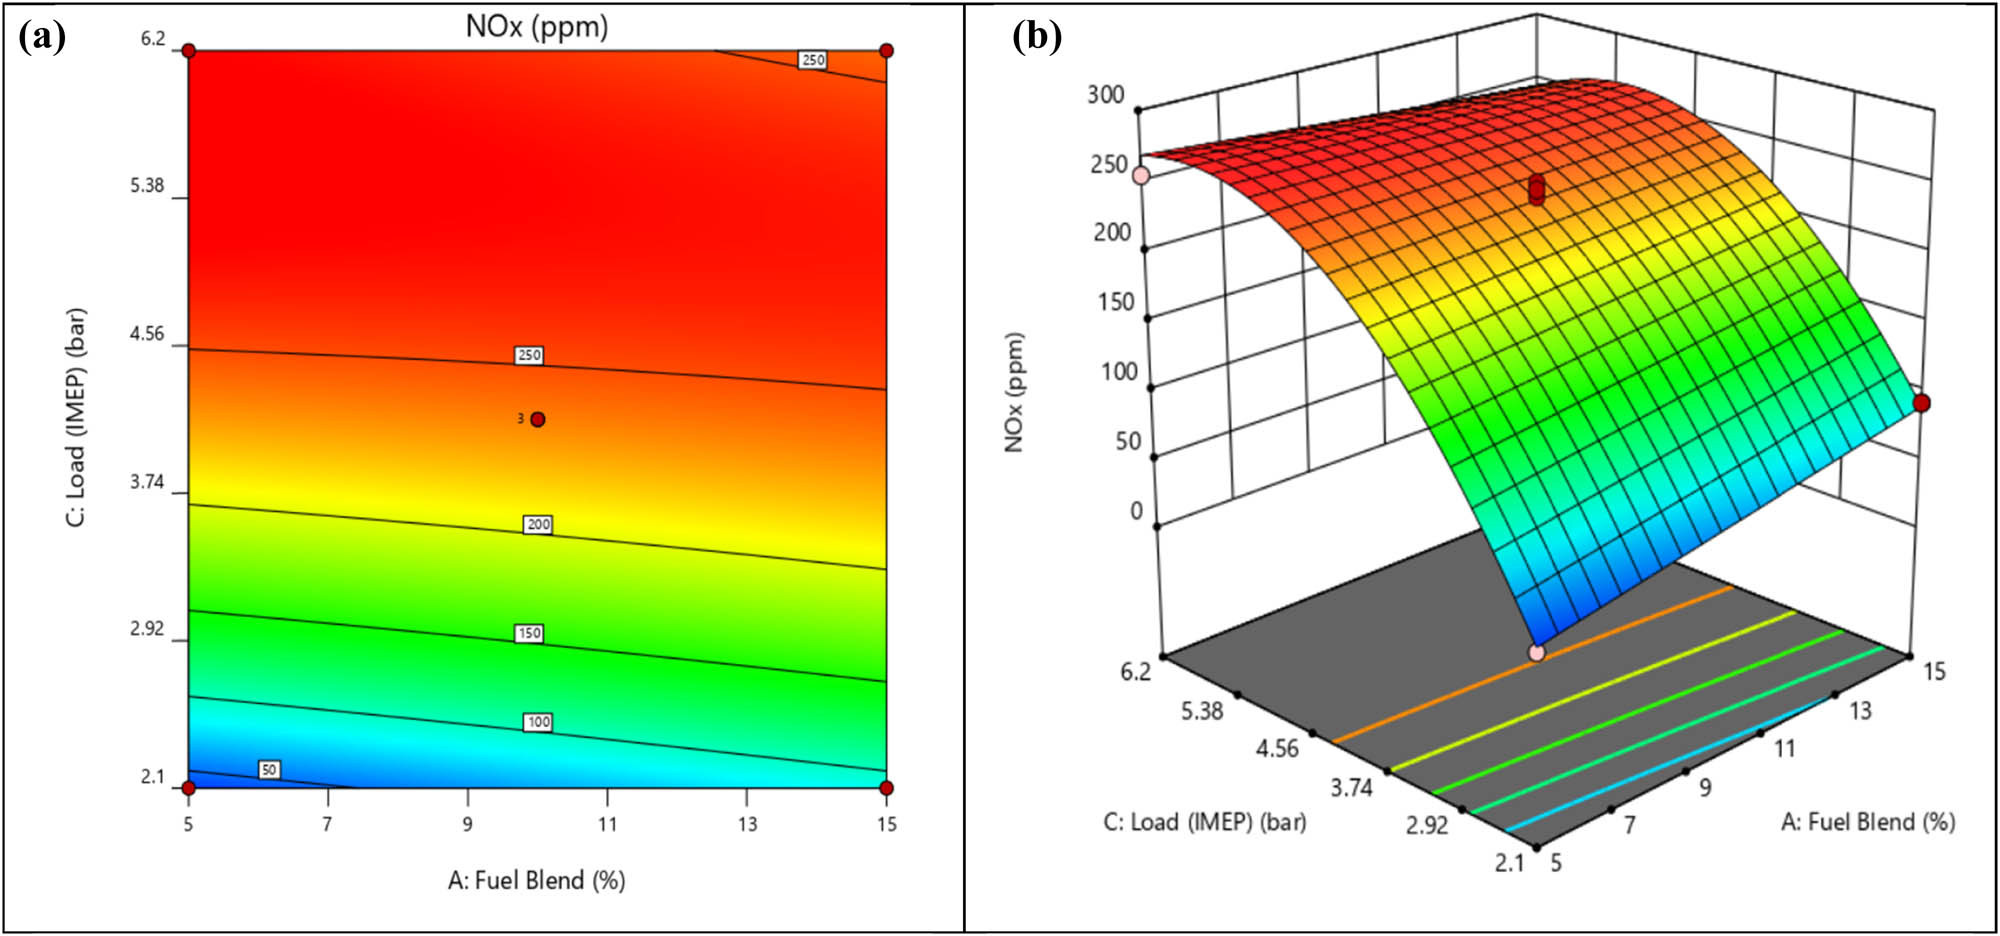
Figure 19a and b depicts that by increasing the fuel blend percentage and injection pressure the NOx emission will be reduced. The NOx emission will increase if the lower injection pressure is combined with any type of fuel blend percentage considered in this study. From Figure 20a and b, it can be observed that with a low fuel blend percentage and high load value the NOx emission decreases [38]. The NOx emission can be reduced by combinedly increasing the injection pressure and the load value, as shown in Figure 21a and b of contour and 3D surface plots, respectively.
(a) Contour plot for BTE with fuel blend and injection pressure. (b) 3D surface plot for BTE with fuel blend and injection pressure.
(a) Contour plot for BTE with fuel blend and load. (b) 3D surface plot for BTE with fuel blend and load.
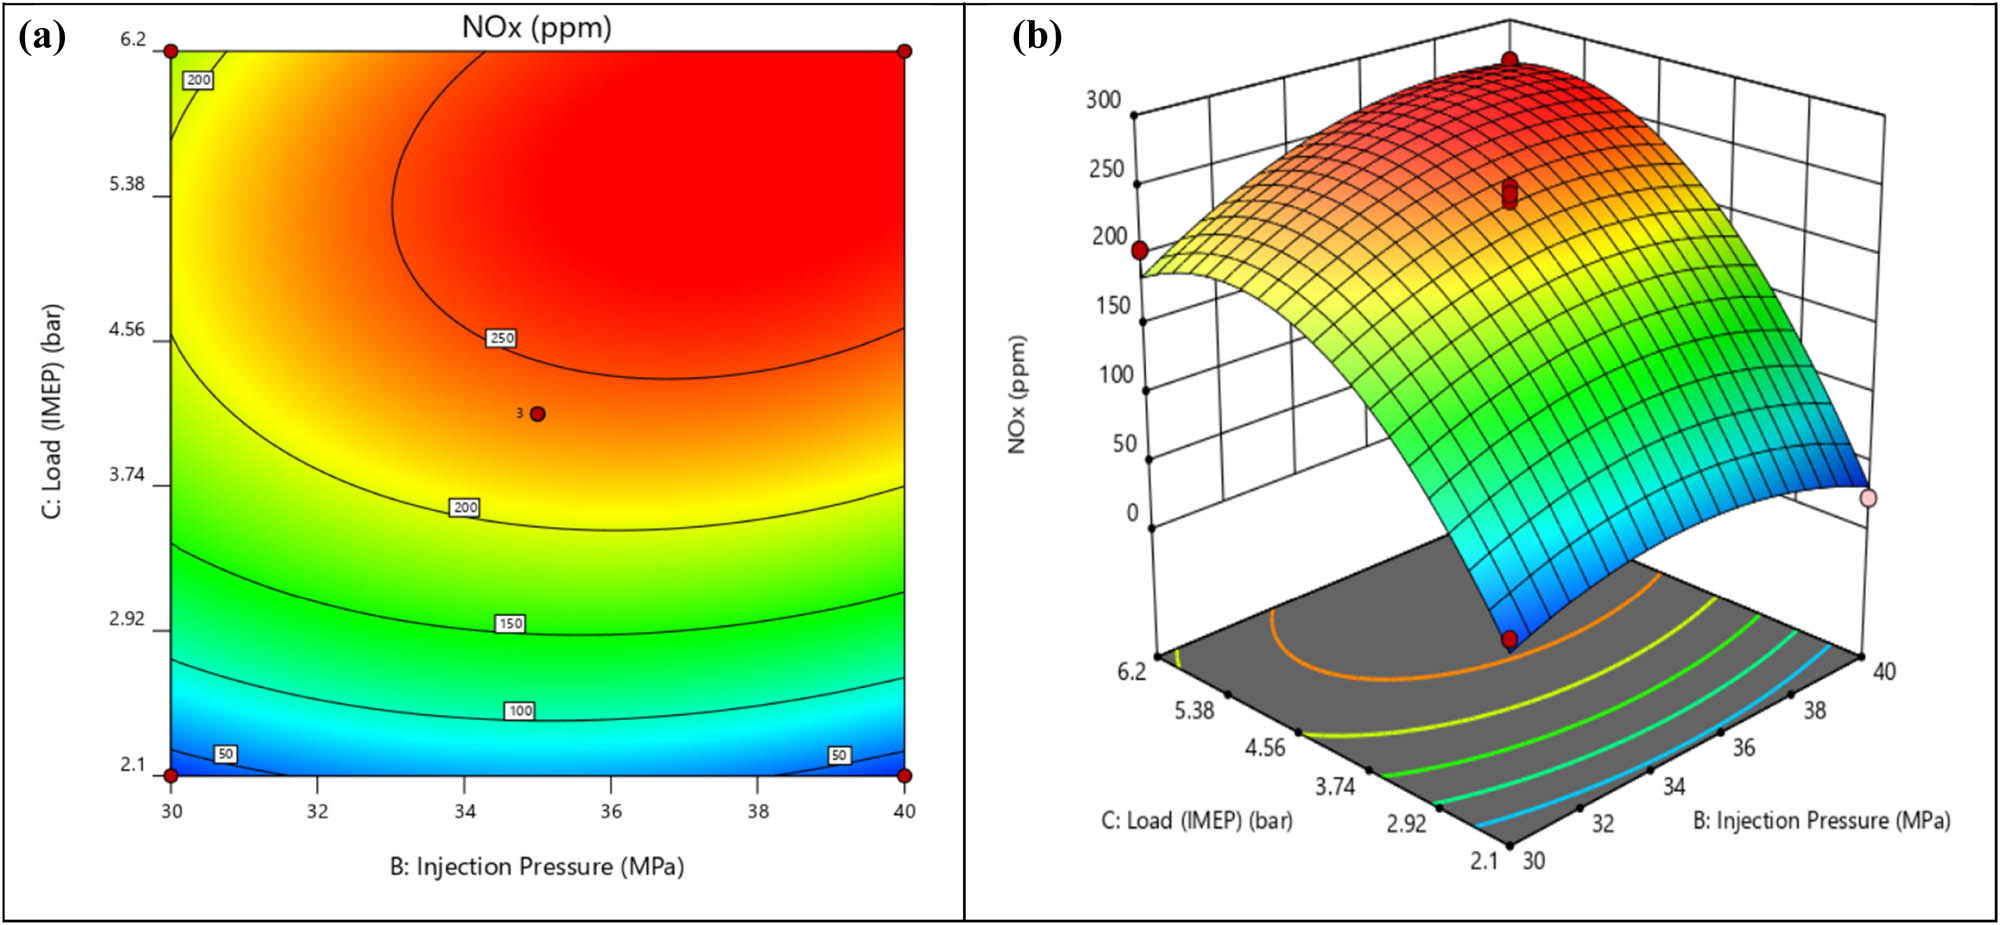
(a) Contour plot for BTE with injection pressure and load. (b) 3D surface plot for BTE with injection pressure and load.
8 Optimisation of multi-responses by the desirability function approach
Since maximising BTE performance and minimising NOx emission is generally beneficial for engines, the engine's performance through BTE and exhaust emission NOx emissions are two opposing output reactions. Hence, both need to be improved altogether, thus the process parameter needs to be optimised through multiple-response optimisation methods. The respective goal, limits, weights, and importance are listed in Table 5.
The desirability function method is applied in this study to find out the optimal process parameter for higher BTE and lower NOx emissions.
Figures 22 and 23 show the effect of the process parameter and contour plot on the output responses with the desirability approach. In Figure 22, the red cross mark indicates that the BTE will be maximum and NOx will be minimum at lower values of WPO + diesel fuel blend, injection pressure, and engine load. The actual values of the optimised process parameter are found to be 5.46616% for WPO + diesel fuel blend, 30.2124 MPa for injection pressure, and 2.10022 bar for engine load. The same can be observed from the contour plot in Figure 23. In this process parameter setting, the engine performance will be optimised well with the D value of 1, BTE of 32.5605, and NOx emission of 14.8757, as shown in Figure 24.
Multi-response optimisation using the desirability function method.
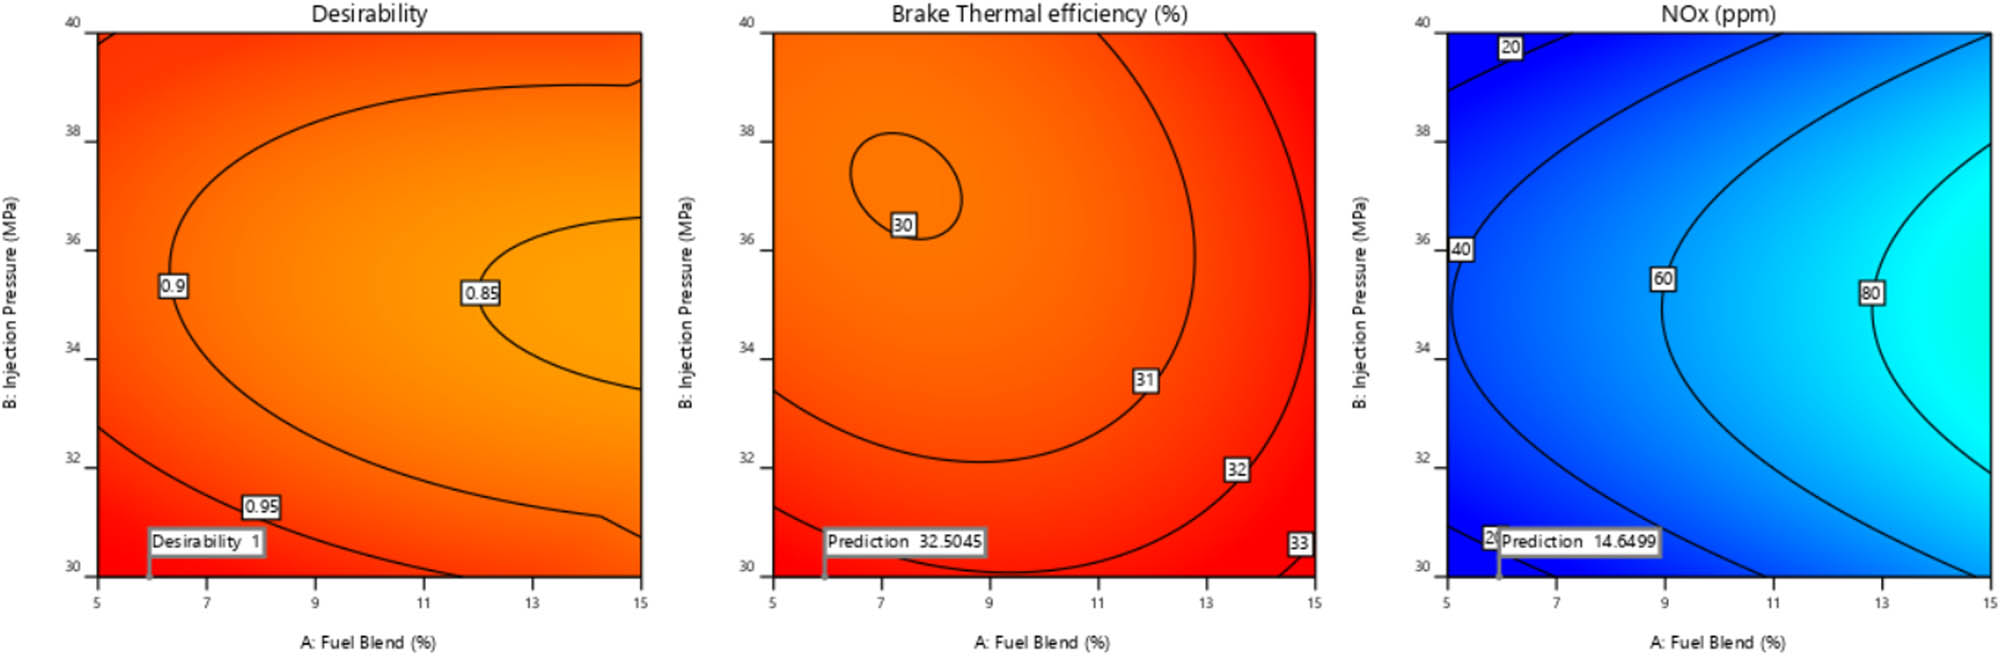
Contour plots for the desirability approach of output responses.
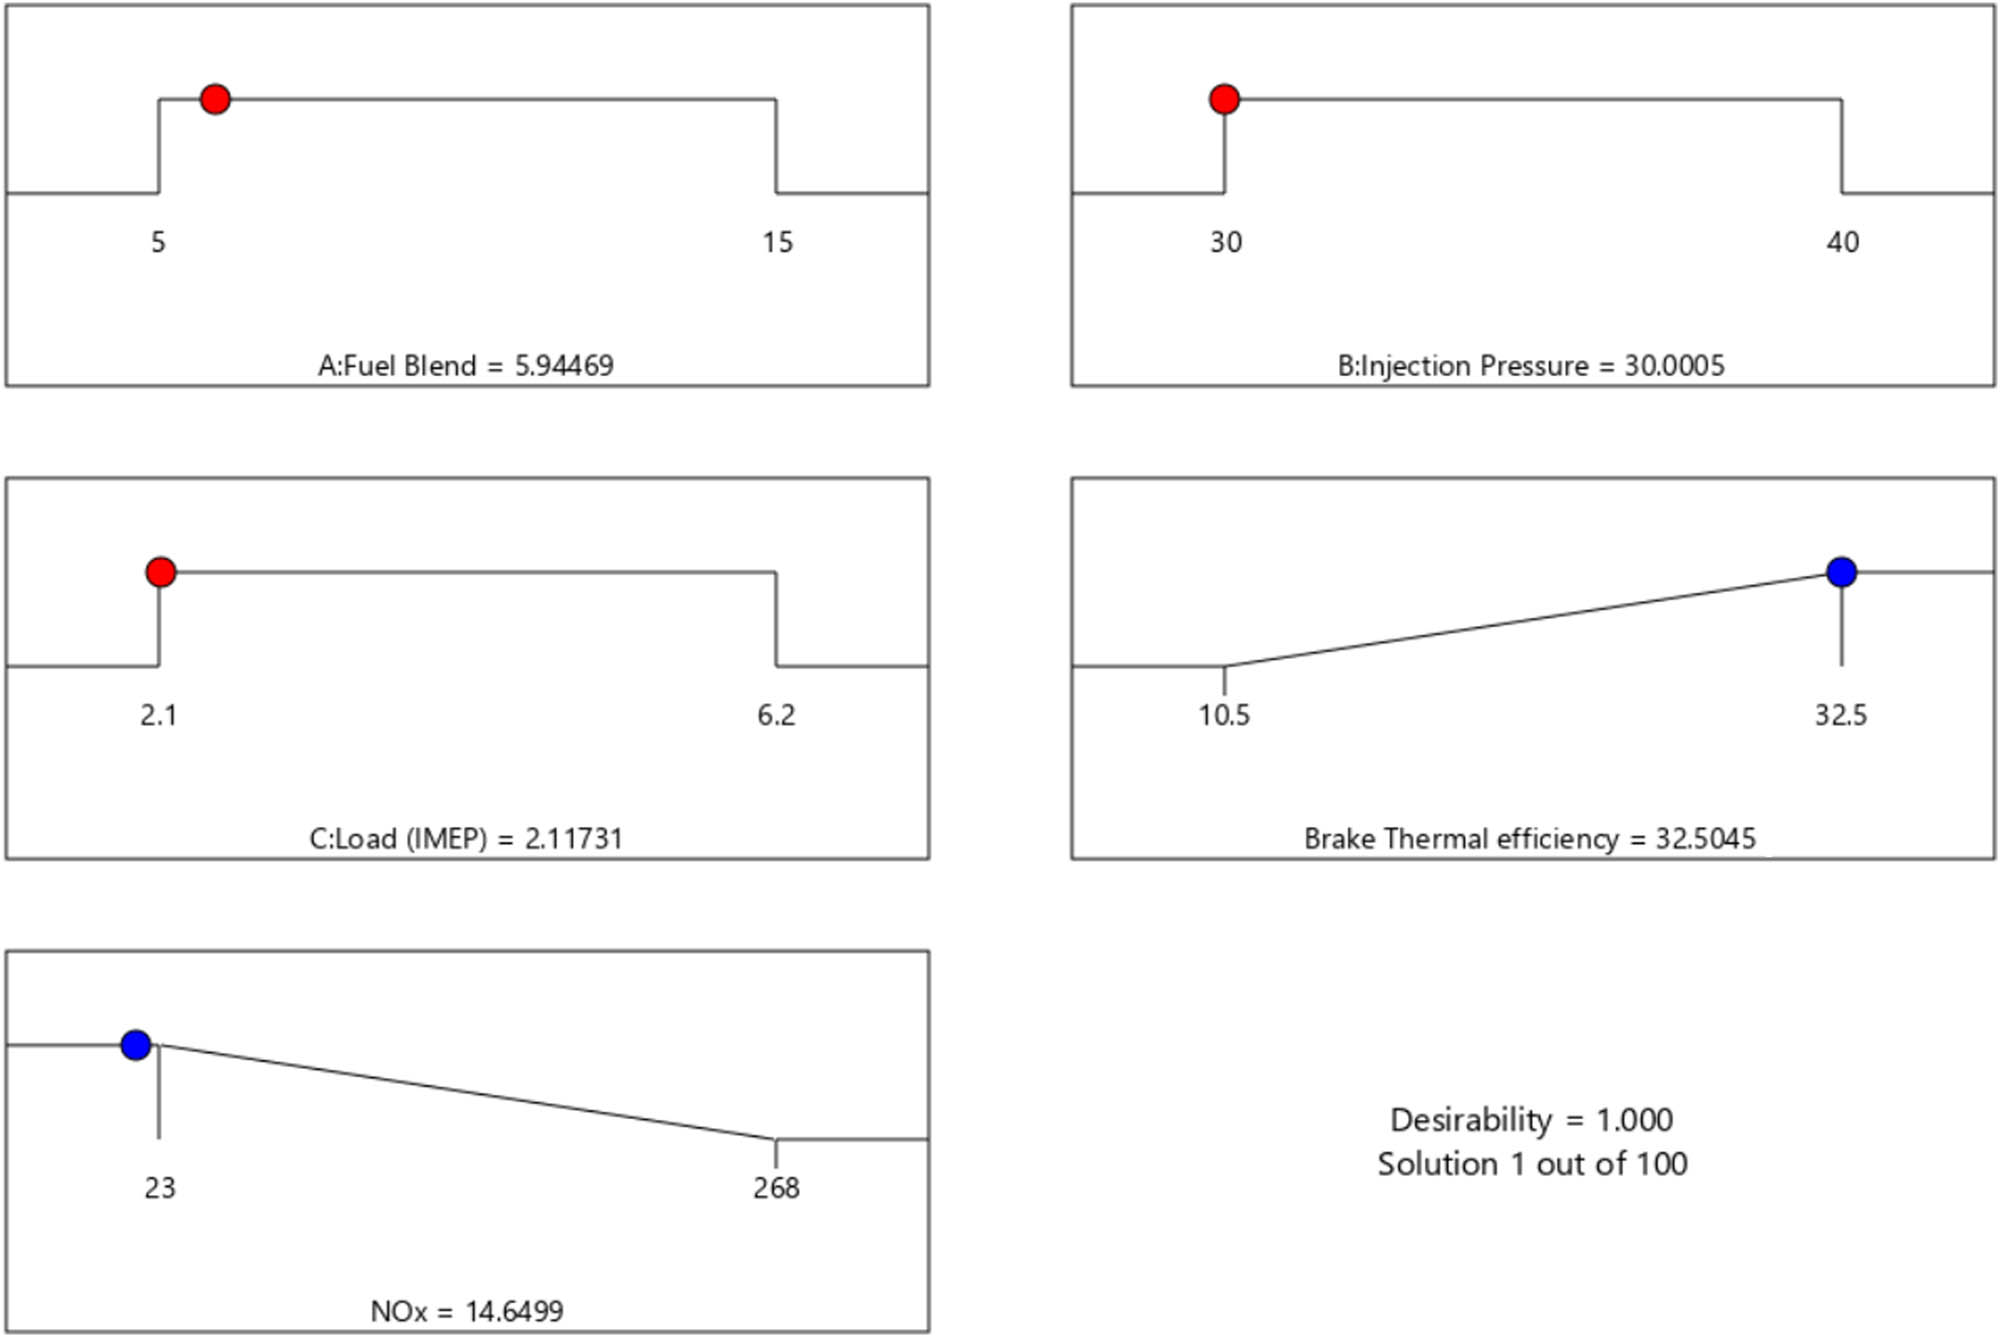
Optimal process parameter conditions using the desirability approach.
8.1 Overlay plots
Figures 25a and 26b show the overlay plot between the BTE and NOx emission at various one-side intervals. The overlay plot shows the critical response contours on a contour plot, so that the common area can be picked as the best solution among all responses. In the overlay plot, grey colour indicates the area that is not fit for the optimisation criteria. The dark gold colour of the overlay plot portrays the area where the point estimate meets the criterion requirements. The bright yellow colour represents the area where the entire range of all intervals meet the specified criteria. The one-side interval estimation can be added to the overlay plot, which helps to comprehend the influence of uncertainty on accomplishing process goals. Three types of one-side interval are considered, and the overlay plots of BTE and NOx emission with the interval of confidence, prediction, and tolerance with an alpha value of 0.05 are plotted as shown in the Figures 25a and 26b. Figure 25b shows the overlay plot of BTE and NOx emission with interval of confidence. The confidence interval of the BTE is consider to be high and that of the NOx emission is considered to be low, and the overlay plot is plotted. In this plot, the bright yellow colour area shows the sweet spot or the area where the entire range of all intervals meet the specified criteria. Figure 26a depicts the overlay plot of BTE and NOx emission with 95% interval of prediction. The BTE prediction interval is considered as high, and the NOx emission prediction interval is considered as low. The bright yellow area in the plot depicts the suitable criteria. Figure 26b portrays the overlay plot of BTE and NOx emission with 0.99 tolerance interval. In this, the dark gold colour area of the plot is the area where the point design estimation meets the requirement criteria.
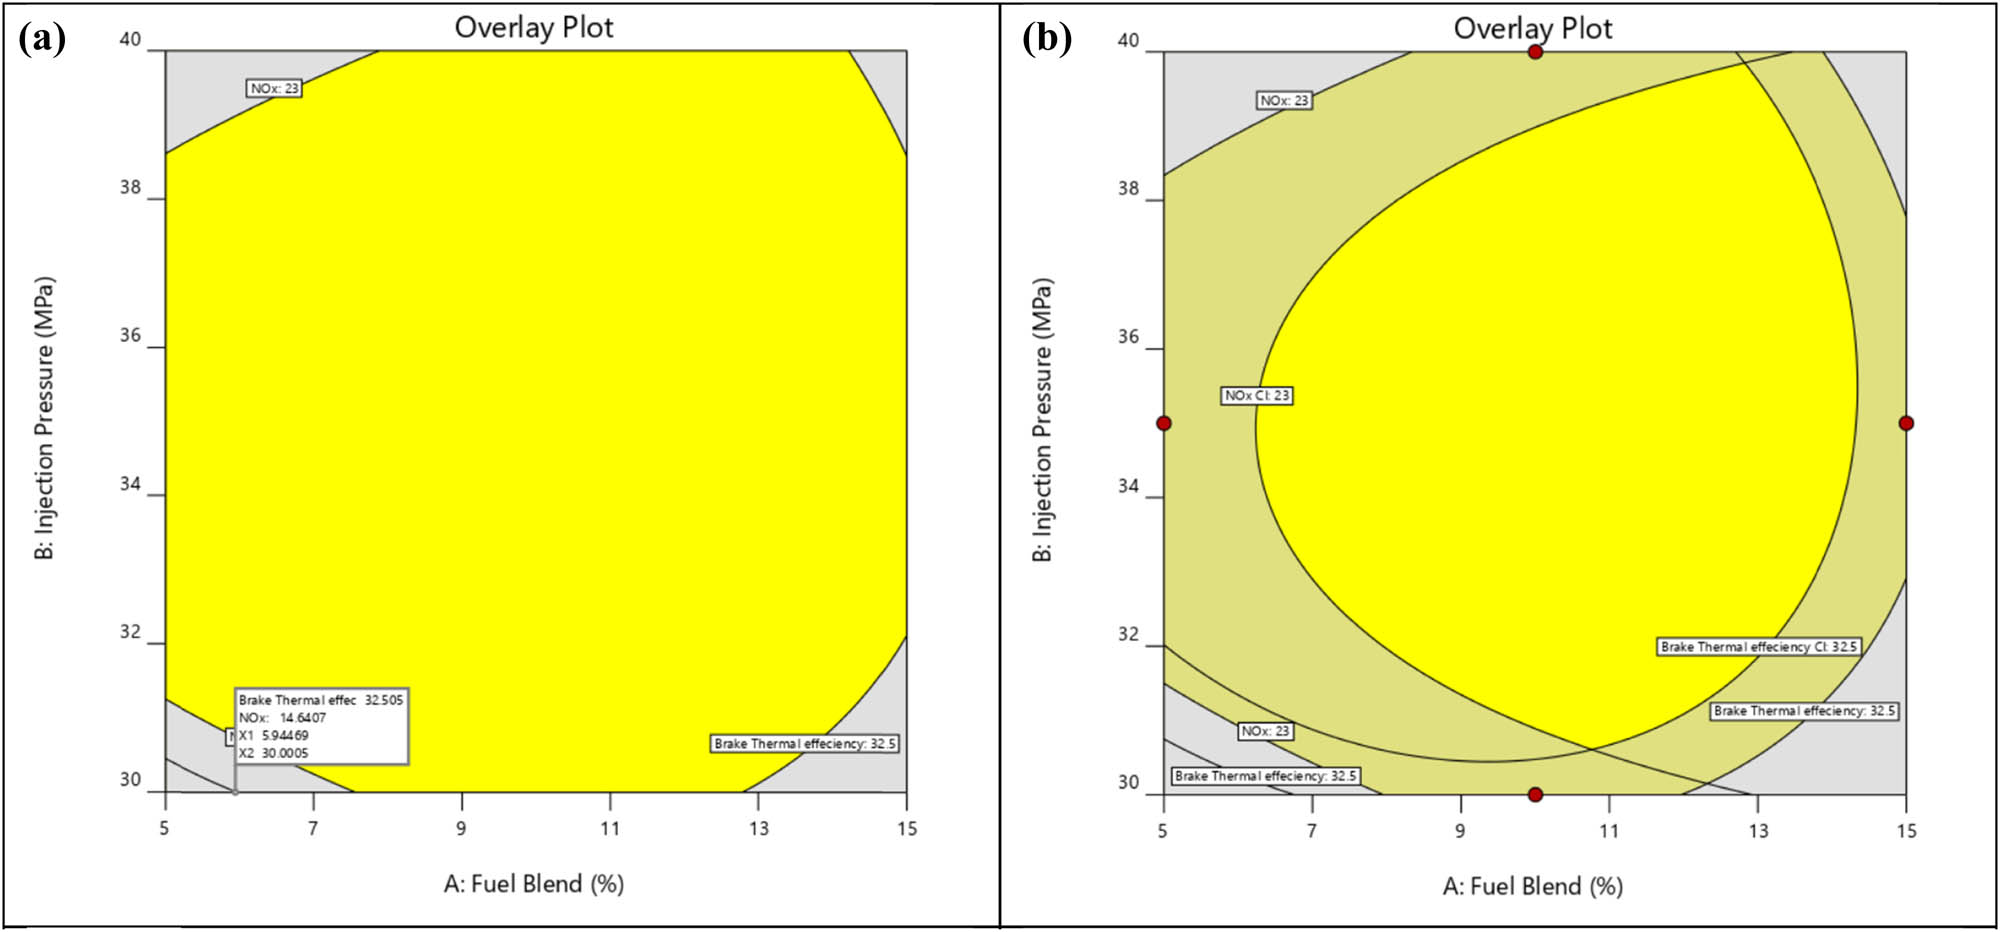
(a) Overlay plot of BTE and NOx emission. (b) Overlay plot of BTE and NOx emissions with 95% confidence level.
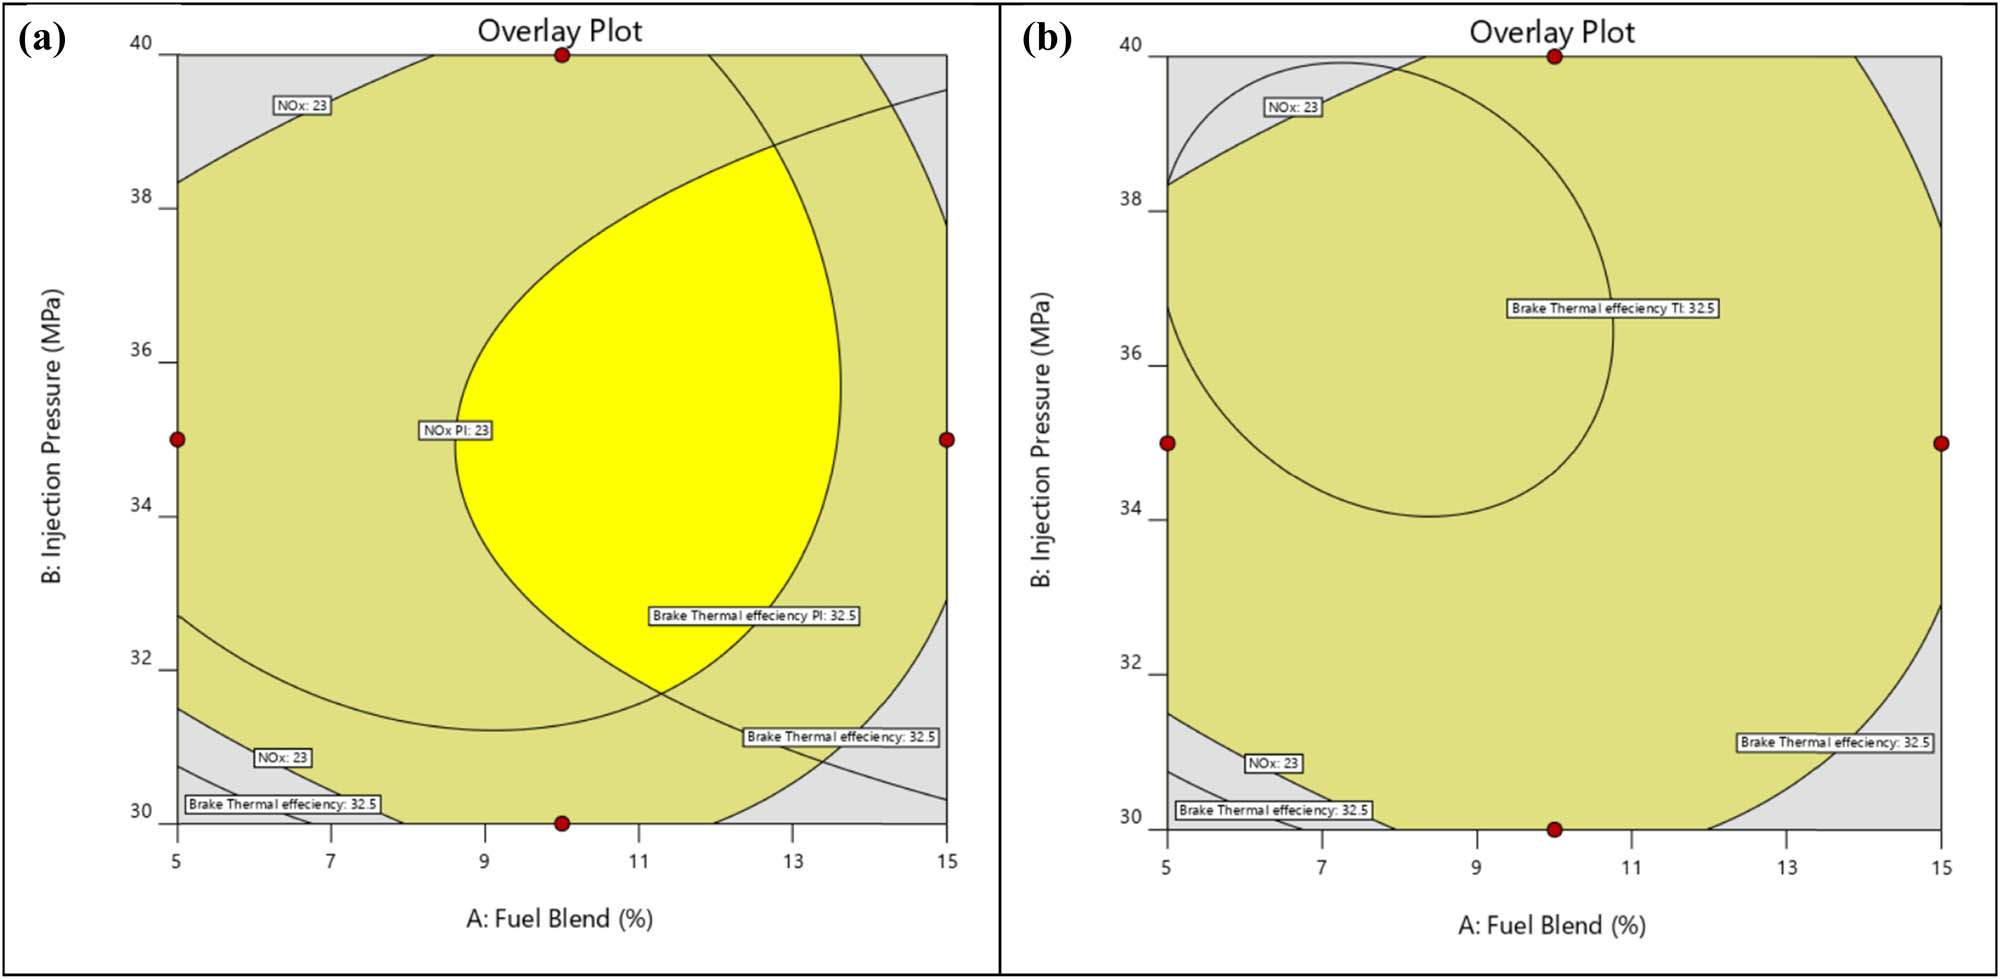
(a) Overlay plot of BTE and NOx emissions with 95% prediction level. (b) Overlay plot of BTE and NOx emissions with 0.99 tolerance level.
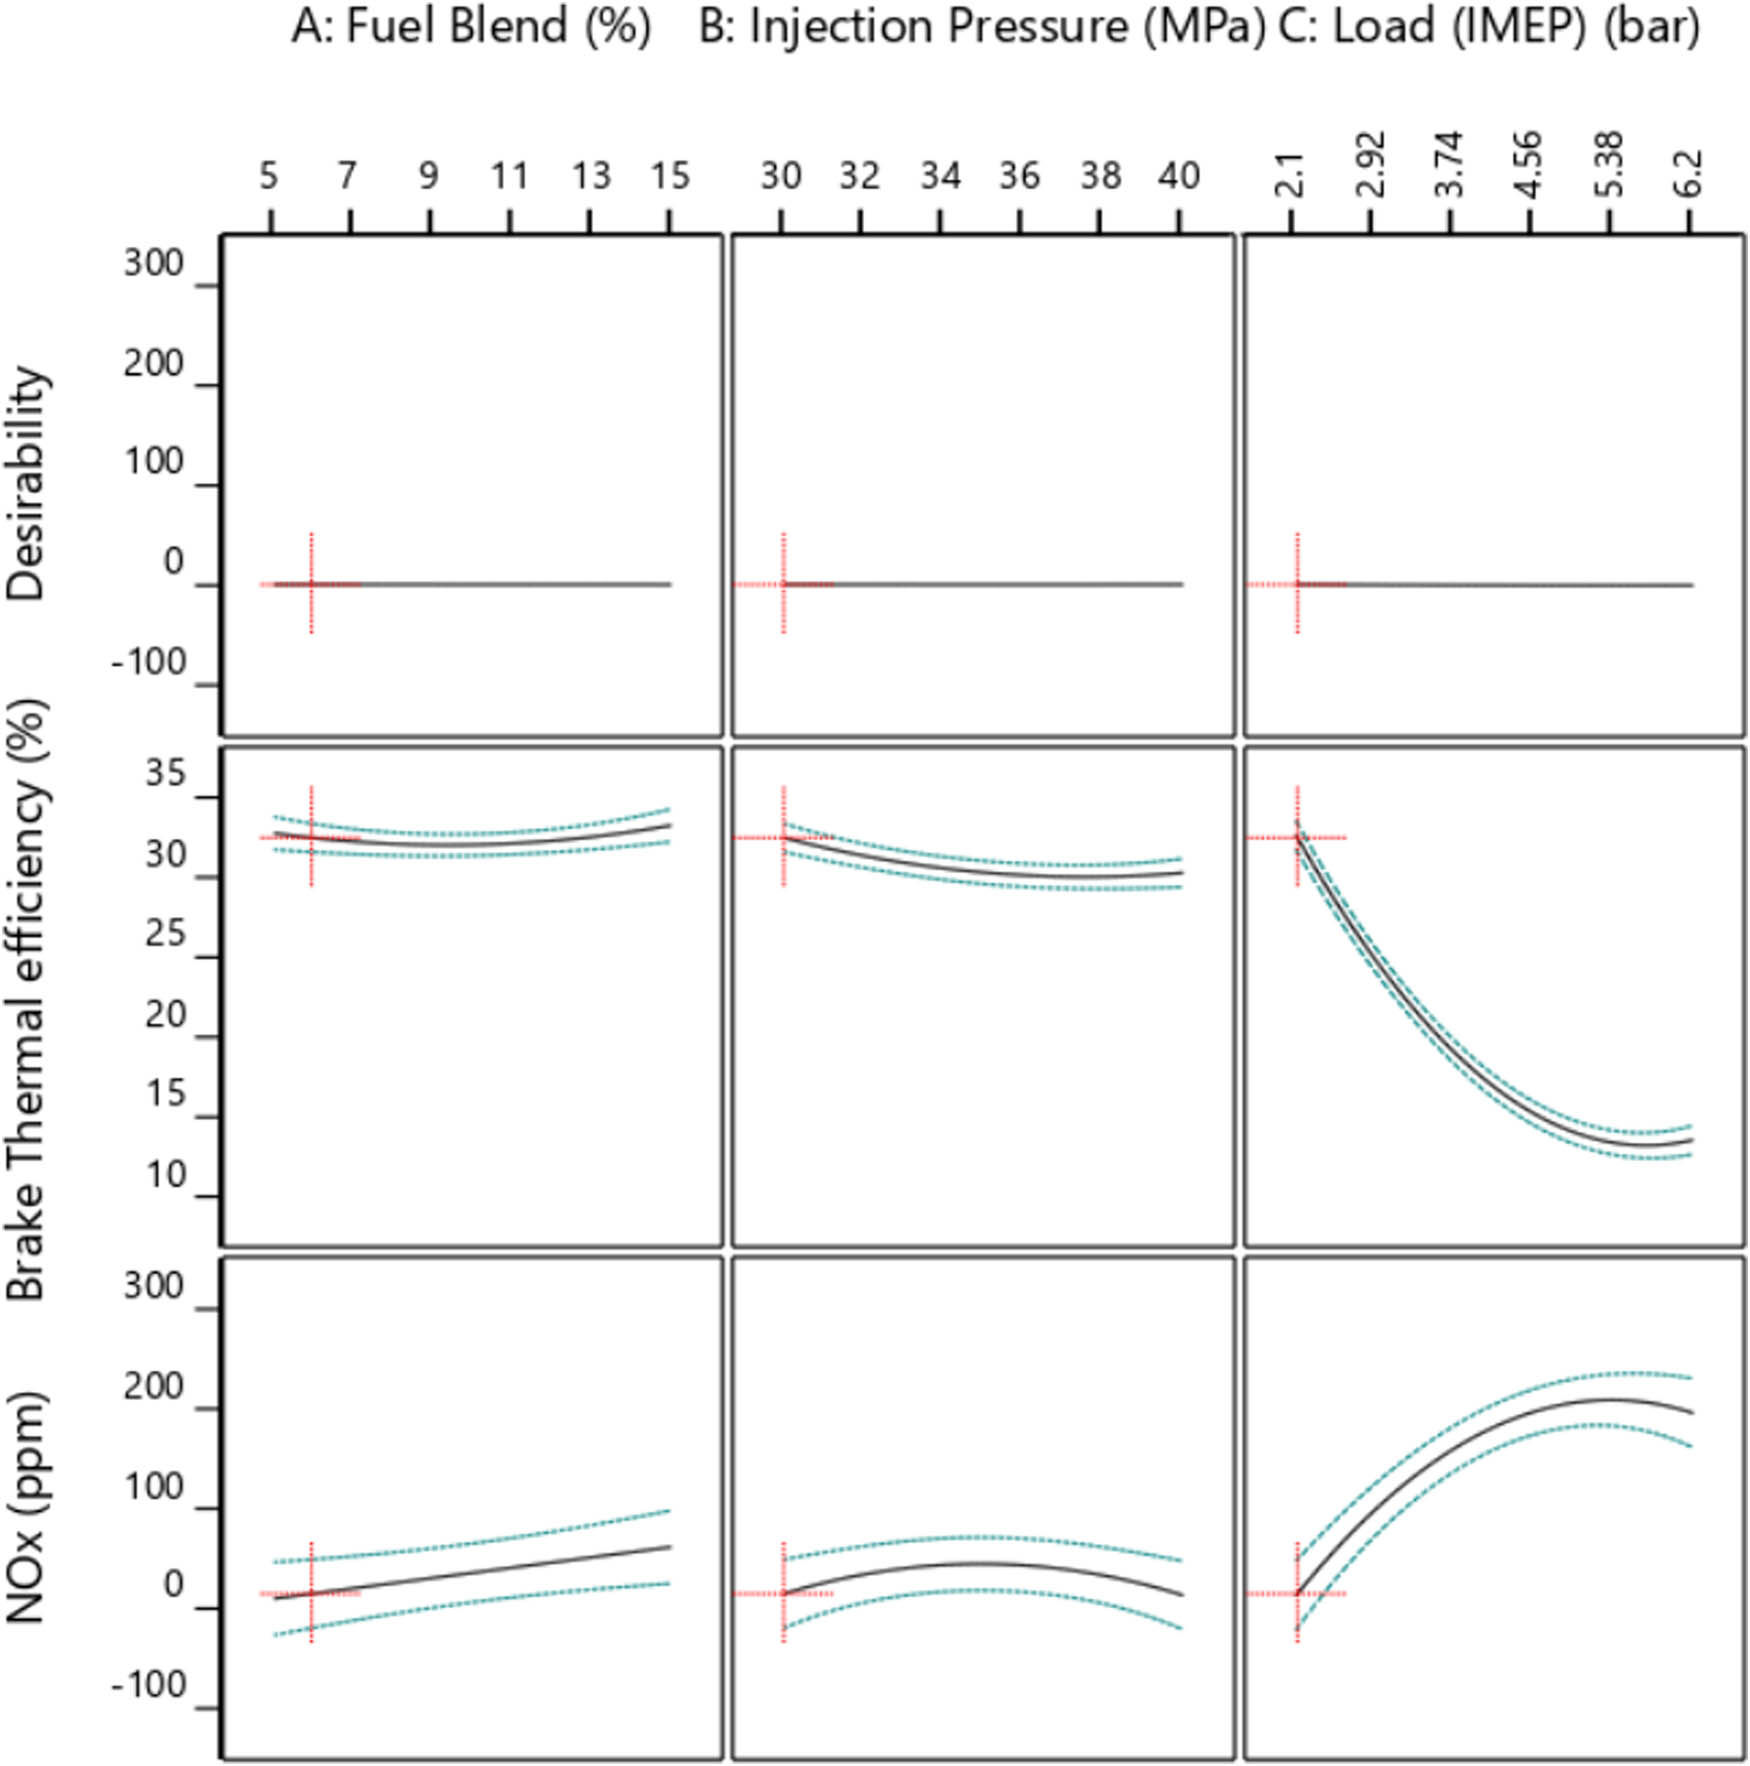
9 Sensitivity analysis
Sensitivity analysis is carried out to know the effect of the minor change in the important values of the outputs BTE and NOx emission on the optimal value of the process parameters and their correlation with distinct uncertainty obtained from the RSM method. This uncertainty has a major influence on the sensitivity of the model outputs. Hence, the sensitivity analysis has to be done to know the sustainability of the regression equation by examining the design functions of the objectives with the process parameter of the design [24–26]. The sensitivity analysis is performed for BTE and NOx emission with the three-process parameter, i.e. fuel blend percentage, injection pressure, and load. A total of six sensitivity Eqs. 10–15 are found by differentiating the regression equations of BTE and NOx emission.
The sensitivity analysis depicts the best possible engine performance and their uncertainty to any variation made in the defined regression model process parameters of the engine. The sensitivity values of the BTE and NOx emission of the engine are calculated using the process parameter value considered in this study. The injection pressure considered in sensitivity analysis is low, i.e. 30 MPa, and the load is considered to be low and high, i.e. 2.1 and 6.2 bar, respectively, with low medium and high values of fuel blend percentage. The sensitivity values of BTE and NOx emission are graphically plotted in Figures 27 and 28, respectively.
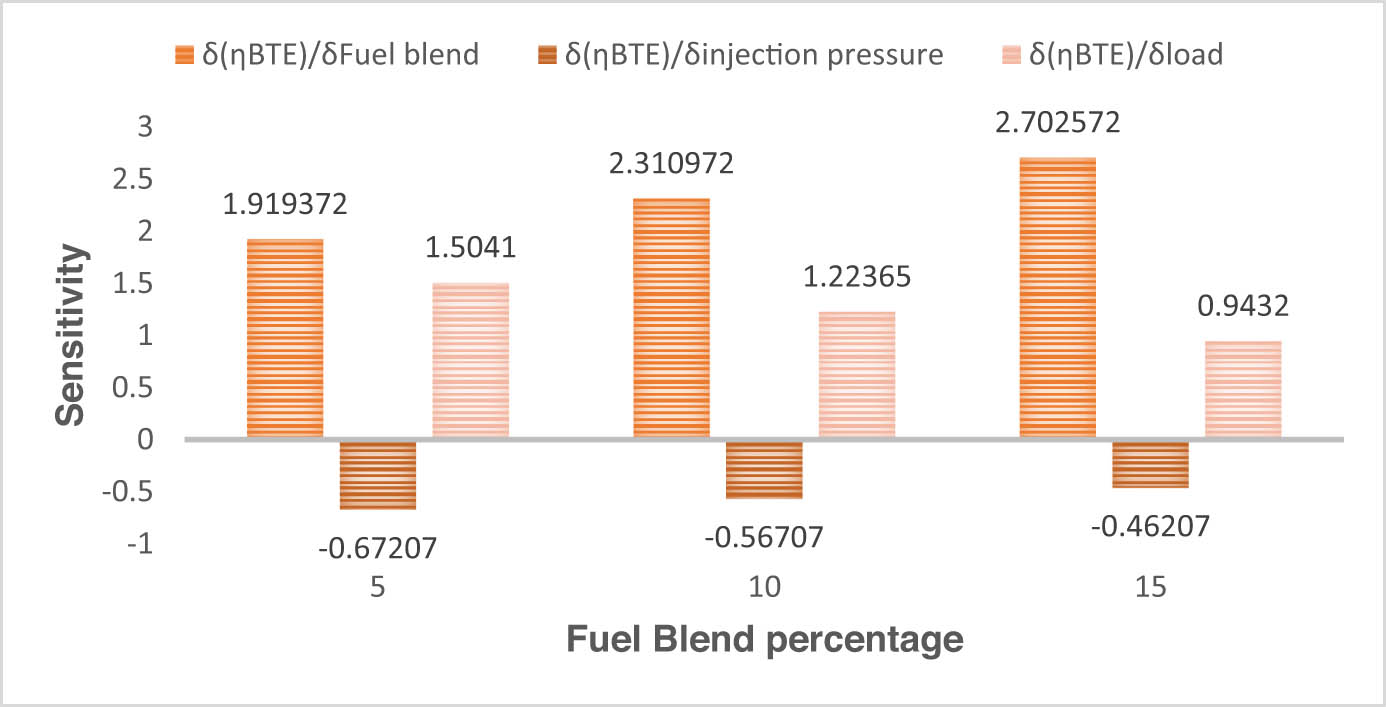
Sensitivity analysis for BTE.
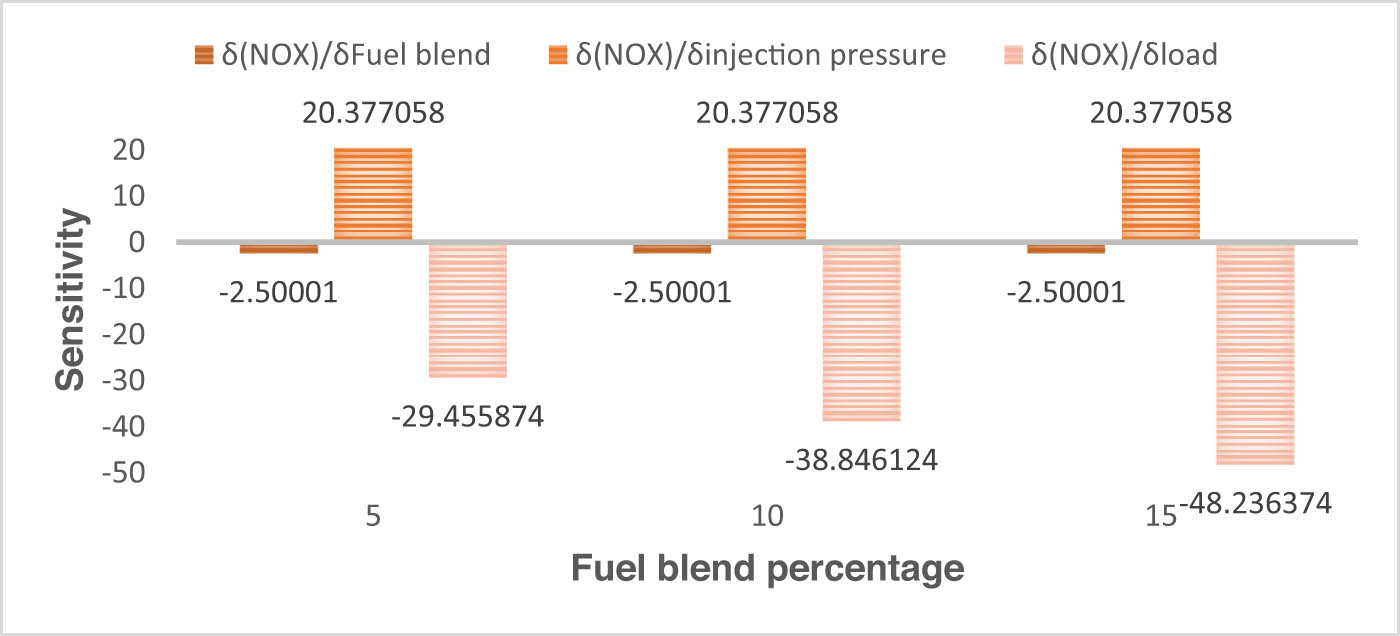
Sensitivity analysis for NOx emission.
From Figure 27, it can be depicted that the sensitivity of BTE with WPO + diesel fuel blend increases as the waste plastic energy share increases. The sensitivity of BTE to the load decreases, with the increase in the WPO + diesel fuel blend. The sensitivity of BTE to the injection pressure increases marginally with an increase of the WPO + diesel fuel blend.
Figure 28 shows the sensitivity analysis for NOx emission. It can be observed that the sensitivity of NOx emission with engine load decreases with increases in the WPO + diesel fuel blend. Further, the sensitivity of NOx emission to the fuel blend and injection pressure remains constant.
10 Conclusions
From the objectives defined, experiments performed, and analysis, as reported in the above sections, the following conclusions could be drawn from the work.
Investigation performed using diagnostic plots revealed that the prediction value from the proposed regression model for BTE and NOx emission could be considered equal to the experimental tests.
Engine load and injection pressure are found to be a significant factor for both BTE and NOx emission.
The order of importance of the input parameter affecting the output response is found to be first as the injection pressure, followed by engine load and WPO + diesel fuel blend.
It is found from sensitivity analysis that the sensitivity of BTE to the injection pressure increases slightly with an increase in fuel blend percentage and sensitivity of NOx emission to the load decreases with increases in the fuel blend percentage.
The highest value of BTE and the lowest value of NOx emission after the optimisation are found to be BTE at 32.5605 and NOx emission at 14.8757, respectively.
The developed regression model from the RSM approach predicted accurately with average percentage errors of 1.3% and 8.2% when compared with the experimental value of BTE and NOx emission, respectively.
The confirmatory tests are carried out to validate the optimised input operational parameters developed by using the desirability function approach. The findings are within the 95% permissible limits.
In terms of primarily scientific discoveries,
The reliability of the regression model in predicting the engine behaviour is substantiated by diagnostic diagrams and statistical analyses.
The fuel blend, injection pressure, and engine load have a substantial impact on BTE and NOx emissions as exhibited by contour and three-dimensional surface plots.
By incorporating multiple responses via desirability functions, the optimisation procedure generates optimal parameter values which culminate to enhanced BTE and reduced NOx emissions.
By demonstrating how variations in the fuel blend, injection pressure, and load impact BTE and NOx emissions, sensitivity analyses offer valuable insightful evidence regarding the optimisation model’s reliability.
In accordance with the implications concerning the discipline:
The investigation enhances the area by presenting an exhaustive comprehensive methodology for optimising CRDi diesel engines, taking into account both environment and performance considerations.
By repurposing plastic waste, the use of WPO as a fuel source illustrates the sustainability of the environment.
Future engine optimisation studies may be influenced by the regression model as well as optimisation strategies which have been developed, with a particular emphasis on reducing emissions and enhancing the efficiency.
11 Future outlook
In future, other optimisation methods like WASPASS can be used, and data can be analysed using a meta-heuristic approach. The optimisation studies using the WPO derived from other plastic designs (mixture and individual) can be performed and compared with the work presented in this study.
Examine the long-lasting implications of WPO–diesel fuel blends in the reliability as well as the durability of engines.
Determine whether the developed optimisation model is applicable to different engine configurations and size capabilities.
Evaluate the scalability, financial sustainability, along with economic viability of incorporating WPO into diesel engine applications on a broader scale.
Further expand the scope of the investigation to include operational parameters that have the potential to impact engine performance and emissions.
Investigate the possibility of incorporating advanced sophisticated control strategies in conjunction with optimised operational parameters to enable real-time instantaneous modifications to the engine performance.
Acknowledgment
Researchers Supporting Project number (RSPD2024R576), King Saud University, Riyadh, Saudi Arabia.
-
Funding information: Researchers Supporting Project number (RSPD2024R576), King Saud University, Riyadh, Saudi Arabia.
-
Author contributions: Conceptualisation: SK, MP, PK, RC, SP, RK, and SS; formal analysis: SK, MP, PK, RC, SP, RK, SS, FAA, and MIK; investigation: SK, MP, PK, RC, SP, RK, and SS; writing – original draft preparation: SK, MP, PK, RC, SP, RK, and SS; writing – review and editing: SS, FAA, MIK, and EAAI; supervision: SS, FAA, MIK, and EAAI; work administration: SS, FAA, MIK, and EAAI; funding acquisition: SS, FAA, MIK, and EAAI. All authors have read and agreed to the published version of the manuscript.
-
Conflict of interest: The authors state no conflict of interest.
-
Data availability statement: The datasets generated during and/or analysed during the current study are available from the corresponding author on reasonable request.
References
[1] Sahu DK, Patel CH, Uppara SK, Kanchan S, Choudhary R. Parametric evaluation of B20 blend of mahua biodiesel with nanomaterial additives. Mater Today: Proc. 2022;50(5):804–11. 10.1016/j.matpr.2021.05.589.Search in Google Scholar
[2] Gopal K, Sathiyagnanam AP, Rajesh Kumar B, Damodharan D, De Poures MV, Saravanan S, et al. Prediction and optimization of engine characteristics of a DI diesel engine fueled with cyclohexanol/diesel blends. Energy Sources, Part A Recovery Util Environ Eff. 2020;42(16):2006–17. 10.1080/15567036.2019.1607923.Search in Google Scholar
[3] Damodharan D, Sathiyagnanam AP, Rana D, Saravanan S, Kumar BR, Sethuramasamyraja B. Effective utilization of waste plastic oil in a direct injection diesel engine using high carbon alcohols as oxygenated additives for cleaner emissions. Energy Convers Manag. 2018;166:81–97. 10.1016/j.enconman.2018.04.006.Search in Google Scholar
[4] Krishnamoorthy V, Dhanasekaran R, Rana D, Saravanan S, Kumar BR. A comparative assessment of ternary blends of three bio-alcohols with waste cooking oil and diesel for optimum emissions and performance in a CI engine using response surface methodology. Energy Convers Manag. 2018;156:337–57. 10.1016/j.enconman.2017.10.087.Search in Google Scholar
[5] Dogu O, Pelucchi M, Vijver RVD, Van Steenberge PHM, D’hooge DR, Cuoci A, et al. The chemistry of chemical recycling of solid plastic waste via pyrolysis and gasification: State-of-the-art, challenges, and future directions. Prog Energy Combust Sci. 2021;84:1–69. 10.1016/j.pecs.2020.100901.Search in Google Scholar
[6] Sibao L, Kots PA, Vance BC, Danielson A, Vlachos DG. Plastic waste to fuels by hydrocracking at mild conditions. Sci Adv. 2021;7(17):1–9. 10.1126/sciadv.abf8283.Search in Google Scholar PubMed
[7] Das AK, Padhi MR, Hansdah D, Panda AK. Optimization of engine parameters and ethanol fuel additive of a diesel engine fuelled with waste plastic oil blended diesel. Process Integr Optim Sustainability. 2020;4(4):465–79. 10.1007/s41660-020-00134-7.Search in Google Scholar
[8] Devaraj J, Robinson Y, Ganapathi P. Experimental investigation of performance, emission and combustion characteristics of waste plastic pyrolysis oil blended with diethyl ether used as fuel for diesel engine. Energy. 2015;85:304–9. 10.1016/j.energy.2015.03.075.Search in Google Scholar
[9] Kaimal VK, Vijayabalan P. An investigation on the effects of using DEE additive in a DI diesel engine fuelled with waste plastic oil. Fuel. 2016;180:90–6. 10.1016/j.fuel.2016.04.030.Search in Google Scholar
[10] Damodharan D, Sathiyagnanam AP, Rana D, Kumar BR, Saravanan S. Extraction and characterization of waste plastic oil (WPO) with the effect of n-butanol addition on the performance and emissions of a DI diesel engine fueled with WPO/diesel blends. Energy Convers Manag. 2017;131:117–26. 10.1016/j.enconman.2016.10.076.Search in Google Scholar
[11] Dillikannan D, De Poures MV, Kaliyaperumal G, Babu AP. Effective utilization of waste plastic oil/n-hexanol in an off-road, unmodified DI diesel engine and evaluating its performance, emission, and combustion characteristics. Energy Sources, Part A: Recovery, Util Environ Eff. 2020;42(11):1375–90. 10.1080/15567036.2019.1604853.Search in Google Scholar
[12] Venkatesan SP, Jeevahan JJ, Hemanandh J, Ganesan S, Rajakavieswaran R, Saravanan V. Performance and emission characteristics of diesel engine using waste plastic oil with N-hexanol as an additive. AIP Conf Proc. 2311, AIP Publishing LLC; 2020. p. e020025. 10.1063/5.0034393.Search in Google Scholar
[13] Kaewbuddee C, Sukjit E, Srisertpol J, Maithomklang S, Wathakit K, Klinkaew N, et al. Evaluation of waste plastic oil-biodiesel blends as alternative fuels for diesel engines. Energies. 2020;13(11):1–16. 10.3390/en13112823.Search in Google Scholar
[14] Syamsiro M, Saptoadi H, Kismurtono M, Mufrodi Z, Yoshikawa K. Utilization of waste polyethylene pyrolysis oil as partial substitute for diesel fuel in a DI diesel engine. Int J Smart Grid Clean Energy. 2019;8(1):38–47. 10.12720/sgce.8.1.38-47.Search in Google Scholar
[15] Jing Z, Zhang C, Cai P, Li Y, Chen Z, Li S, et al. Multiple-objective optimization of a methanol/diesel reactivity-controlled compression ignition engine based on non-dominated sorting genetic algorithm-II. Fuel. 2021;300:1–15. 10.1016/j.fuel.2021.120953.Search in Google Scholar
[16] Biswas S, Kakati D, Chakraborti P, Banerjee R. Performance-emission-stability mapping of CI engine in RCCI-PCCI modes under varying ethanol and CNG induced reactivity profiles: A comparative study through experimental and optimization perspectives. Energy. 2022;254:1–20. 10.1016/j.energy.2022.124231.Search in Google Scholar
[17] Said Z, Le DTN, Sharma P, Dang VH, Le HS, Nguyen DT, et al. Optimization of combustion, performance, and emission characteristics of a dual-fuel diesel engine powered with microalgae-based biodiesel/diesel blends and oxyhydrogen. Fuel. 2022;326:1–17. 10.1016/j.fuel.2022.124987.Search in Google Scholar
[18] Bora BJ, Tran TD, Shadangi KP, Sharma P, Said Z, Kalita P, et al. Improving combustion and emission characteristics of a biogas/biodiesel-powered dual-fuel diesel engine through trade-off analysis of operation parameters using response surface methodology. Sustainable Energy Technol Assess. 2022;53:102455. 10.1016/j.seta.2022.102455.Search in Google Scholar
[19] Vali RH, Hoang AT, Wani MM, Pali HS, Balasubramanian D, Arıcı M, et al. Optimization of variable compression ratio diesel engine fueled with Zinc oxide nanoparticles and biodiesel emulsion using response surface methodology. Fuel. 2022;323:1–17. 10.1016/j.fuel.2022.124290.Search in Google Scholar
[20] Singh Y, Singh P, Sharma A, Choudhary P, Singla A, Singh NK. Optimization of wear and friction characteristics of Phyllanthus Emblica seed oil-based lubricant using response surface methodology. Egypt J Pet. 2018;27(4):1145–55. 10.1016/j.ejpe.2018.04.001.Search in Google Scholar
[21] Sakthivel R, Ramesh K, Marshal SJJ, Sadasivuni KK. Prediction of performance and emission characteristics of diesel engine fuelled with waste biomass pyrolysis oil using response surface methodology. Renew Energy. 2019;136:91–103. 10.1016/j.renene.2018.12.109.Search in Google Scholar
[22] Das AK, Hansdah D, Panda AK. Thermal balancing and exergetic performance evaluation of a compression ignition engine fueled with waste plastic pyrolytic oil and different fuel additives. Energy. 2021;229:1–10. 10.1016/j.energy.2021.120629.Search in Google Scholar
[23] Refinery NP, Braimah MN, Odejobi OJ. Utilization of response surface methodology (RSM) in the optimization of crude oil refinery. J Multidiscip Eng Sci Technol (JMEST). 2016;3(3):4361–9, https://api.semanticscholar.org/CorpusID:201047208.Search in Google Scholar
[24] Mohapatra T, Sahoo SS, Padhi BN. Analysis, prediction and multi-response optimization of heat transfer characteristics of a three fluid heat exchanger using response surface methodology and desirability function approach. Appl Therm Eng. 2019;151:536–55. 10.1016/j.applthermaleng.2019.02.001.Search in Google Scholar
[25] Lambert J, Gosselin L. Sensitivity analysis of heat exchanger design to uncertainties of correlations. Appl Therm Eng. 2018;136:531–40. 10.1016/j.applthermaleng.2018.03.037.Search in Google Scholar
[26] Rashidi S, Bovand M, Esfahani JA. Heat transfer enhancement and pressure drop penalty in porous solar heat exchangers: A sensitivity analysis. Energy Convers Manag. 2015;103:726–38. 10.1016/j.enconman.2015.07.019.Search in Google Scholar
[27] Ayodhya AS, Lamani VT, Bedar P, Kumar GN. Effect of exhaust gas recirculation on a CRDI engine fueled with waste plastic oil blend. Fuel. 2018;227:394–400. 10.1016/j.fuel.2018.04.128.Search in Google Scholar
[28] Awad OI, Mamat R, Ali OM, Azmi WH, Kadirgama K, Yusri IM, et al. Response surface methodology (RSM) based multi-objective optimization of fuel oil -gasoline blends at different water content in SI engine. Energy Convers Manag. 2017;150:222–41. 10.1016/j.enconman.2017.07.047.Search in Google Scholar
[29] Ferreira SLC, Bruns RE, Ferreira HS, Matos GD, David JM, Brandão GC, et al. Box-Behnken design: An alternative for the optimization of analytical methods. Anal Chim Acta. 2007;597(2):179–86. 10.1016/j.aca.2007.07.011.Search in Google Scholar PubMed
[30] Das AK, Mohapatra T, Panda AK, Sahoo SS. Study on the performance and emission characteristics of pyrolytic waste plastic oil operated CI engine using response surface methodology. J Clean Prod. 2021;328:129646. 10.1016/j.jclepro.2021.129646.Search in Google Scholar
[31] Ashok A, Gugulothu SK, Reddy RV, Deepanraj B, Rajendran S, Arthi M. Experimental assessment and multi-objective optimization on the engine characteristics of reactivity-controlled compression ignition engine powered by ternary fuel. Fuel. 2022;328:1–14. 10.1016/j.fuel.2022.125260.Search in Google Scholar
[32] Muhammad N, Khan MI, Kehili S, Khedher NB. The shortfall and rise in energy deposition and combustion via OpenFOAM. Case Stud Therm Eng. 2022;40:1–12. 10.1016/j.csite.2022.102563.Search in Google Scholar
[33] Ahmad S, Dawood O, Lashin MM, Khattak SU, Javed MF, Aslam F, et al. Effect of coconut fiber on low-density polyethylene plastic-sand paver blocks. Ain Shams Eng J. 2023;14(8):1–7. 10.1016/j.asej.2022.101982.Search in Google Scholar
[34] Iftikhar B, Alih SC, Vafaei M, Javed MF, Rehman MF, Abdullaev SS, et al. Predicting compressive strength of eco-friendly plastic sand paver blocks using gene expression and artificial intelligence programming. Sci Rep. 2023;13(1):1–17. 10.1038/s41598-023-39349-2.Search in Google Scholar PubMed PubMed Central
[35] Thejas R, Naveen CS, Khan MI, Prasanna GD, Reddy S, Oreijah M, et al. A review on electrical and gas-sensing properties of reduced graphene oxide-metal oxide nanocomposites. Biomass Convers Biorefin. 2022;2022:1–11. 10.1007/s13399-022-03258-7.Search in Google Scholar
[36] Li S, Chithra SM, Sudha PN, Sankeshwari SN, Vignesh S, Vairavel TM, et al. Mathematical modelling of the biofiltration treating mixtures of toluene and N-propanol in the biofilm and gas phase. Int J Hydrog Energy. 2023;48(76):29759–70. 10.1016/j.ijhydene.2023.03.421.Search in Google Scholar
[37] Hasnain SMM, Chatterjee R, Ranjan P, Kumar G, Sharma S, Kumar A, et al. Performance, emission, and spectroscopic analysis of diesel engine fuelled with ternary biofuel blends. Sustainability. 2023;15(9):1–18. 10.3390/su15097415.Search in Google Scholar
[38] Singh G, Sharma S, Singh J, Kumar S, Singh Y, Ahmadi MH, et al. Optimization of performance, combustion and emission characteristics of acetylene aspirated diesel engine with oxygenated fuels: An Experimental approach. Energy Rep. 2021;7:1857–74. 10.1016/j.egyr.2021.03.022.Search in Google Scholar
© 2024 the author(s), published by De Gruyter
This work is licensed under the Creative Commons Attribution 4.0 International License.
Articles in the same Issue
- Research Articles
- Green polymer electrolyte and activated charcoal-based supercapacitor for energy harvesting application: Electrochemical characteristics
- Research on the adsorption of Co2+ ions using halloysite clay and the ability to recover them by electrodeposition method
- Simultaneous estimation of ibuprofen, caffeine, and paracetamol in commercial products using a green reverse-phase HPTLC method
- Isolation, screening and optimization of alkaliphilic cellulolytic fungi for production of cellulase
- Functionalized gold nanoparticles coated with bacterial alginate and their antibacterial and anticancer activities
- Comparative analysis of bio-based amino acid surfactants obtained via Diels–Alder reaction of cyclic anhydrides
- Biosynthesis of silver nanoparticles on yellow phosphorus slag and its application in organic coatings
- Exploring antioxidant potential and phenolic compound extraction from Vitis vinifera L. using ultrasound-assisted extraction
- Manganese and copper-coated nickel oxide nanoparticles synthesized from Carica papaya leaf extract induce antimicrobial activity and breast cancer cell death by triggering mitochondrial caspases and p53
- Insight into heating method and Mozafari method as green processing techniques for the synthesis of micro- and nano-drug carriers
- Silicotungstic acid supported on Bi-based MOF-derived metal oxide for photodegradation of organic dyes
- Synthesis and characterization of capsaicin nanoparticles: An attempt to enhance its bioavailability and pharmacological actions
- Synthesis of Lawsonia inermis-encased silver–copper bimetallic nanoparticles with antioxidant, antibacterial, and cytotoxic activity
- Facile, polyherbal drug-mediated green synthesis of CuO nanoparticles and their potent biological applications
- Zinc oxide-manganese oxide/carboxymethyl cellulose-folic acid-sesamol hybrid nanomaterials: A molecularly targeted strategy for advanced triple-negative breast cancer therapy
- Exploring the antimicrobial potential of biogenically synthesized graphene oxide nanoparticles against targeted bacterial and fungal pathogens
- Biofabrication of silver nanoparticles using Uncaria tomentosa L.: Insight into characterization, antibacterial activities combined with antibiotics, and effect on Triticum aestivum germination
- Membrane distillation of synthetic urine for use in space structural habitat systems
- Investigation on mechanical properties of the green synthesis bamboo fiber/eggshell/coconut shell powder-based hybrid biocomposites under NaOH conditions
- Green synthesis of magnesium oxide nanoparticles using endophytic fungal strain to improve the growth, metabolic activities, yield traits, and phenolic compounds content of Nigella sativa L.
- Estimation of greenhouse gas emissions from rice and annual upland crops in Red River Delta of Vietnam using the denitrification–decomposition model
- Synthesis of humic acid with the obtaining of potassium humate based on coal waste from the Lenger deposit, Kazakhstan
- Ascorbic acid-mediated selenium nanoparticles as potential antihyperuricemic, antioxidant, anticoagulant, and thrombolytic agents
- Green synthesis of silver nanoparticles using Illicium verum extract: Optimization and characterization for biomedical applications
- Antibacterial and dynamical behaviour of silicon nanoparticles influenced sustainable waste flax fibre-reinforced epoxy composite for biomedical application
- Optimising coagulation/flocculation using response surface methodology and application of floc in biofertilisation
- Green synthesis and multifaceted characterization of iron oxide nanoparticles derived from Senna bicapsularis for enhanced in vitro and in vivo biological investigation
- Potent antibacterial nanocomposites from okra mucilage/chitosan/silver nanoparticles for multidrug-resistant Salmonella Typhimurium eradication
- Trachyspermum copticum aqueous seed extract-derived silver nanoparticles: Exploration of their structural characterization and comparative antibacterial performance against gram-positive and gram-negative bacteria
- Microwave-assisted ultrafine silver nanoparticle synthesis using Mitragyna speciosa for antimalarial applications
- Green synthesis and characterisation of spherical structure Ag/Fe2O3/TiO2 nanocomposite using acacia in the presence of neem and tulsi oils
- Green quantitative methods for linagliptin and empagliflozin in dosage forms
- Enhancement efficacy of omeprazole by conjugation with silver nanoparticles as a urease inhibitor
- Residual, sequential extraction, and ecological risk assessment of some metals in ash from municipal solid waste incineration, Vietnam
- Green synthesis of ZnO nanoparticles using the mangosteen (Garcinia mangostana L.) leaf extract: Comparative preliminary in vitro antibacterial study
- Simultaneous determination of lesinurad and febuxostat in commercial fixed-dose combinations using a greener normal-phase HPTLC method
- A greener RP-HPLC method for quaternary estimation of caffeine, paracetamol, levocetirizine, and phenylephrine acquiring AQbD with stability studies
- Optimization of biomass durian peel as a heterogeneous catalyst in biodiesel production using microwave irradiation
- Thermal treatment impact on the evolution of active phases in layered double hydroxide-based ZnCr photocatalysts: Photodegradation and antibacterial performance
- Preparation of silymarin-loaded zein polysaccharide core–shell nanostructures and evaluation of their biological potentials
- Preparation and characterization of composite-modified PA6 fiber for spectral heating and heat storage applications
- Preparation and electrocatalytic oxygen evolution of bimetallic phosphates (NiFe)2P/NF
- Rod-shaped Mo(vi) trichalcogenide–Mo(vi) oxide decorated on poly(1-H pyrrole) as a promising nanocomposite photoelectrode for green hydrogen generation from sewage water with high efficiency
- Green synthesis and studies on citrus medica leaf extract-mediated Au–ZnO nanocomposites: A sustainable approach for efficient photocatalytic degradation of rhodamine B dye in aqueous media
- Cellulosic materials for the removal of ciprofloxacin from aqueous environments
- The analytical assessment of metal contamination in industrial soils of Saudi Arabia using the inductively coupled plasma technology
- The effect of modified oily sludge on the slurry ability and combustion performance of coal water slurry
- Eggshell waste transformation to calcium chloride anhydride as food-grade additive and eggshell membranes as enzyme immobilization carrier
- Synthesis of EPAN and applications in the encapsulation of potassium humate
- Biosynthesis and characterization of silver nanoparticles from Cedrela toona leaf extracts: An exploration into their antibacterial, anticancer, and antioxidant potential
- Enhancing mechanical and rheological properties of HDPE films through annealing for eco-friendly agricultural applications
- Immobilisation of catalase purified from mushroom (Hydnum repandum) onto glutaraldehyde-activated chitosan and characterisation: Its application for the removal of hydrogen peroxide from artificial wastewater
- Sodium titanium oxide/zinc oxide (STO/ZnO) photocomposites for efficient dye degradation applications
- Effect of ex situ, eco-friendly ZnONPs incorporating green synthesised Moringa oleifera leaf extract in enhancing biochemical and molecular aspects of Vicia faba L. under salt stress
- Biosynthesis and characterization of selenium and silver nanoparticles using Trichoderma viride filtrate and their impact on Culex pipiens
- Photocatalytic degradation of organic dyes and biological potentials of biogenic zinc oxide nanoparticles synthesized using the polar extract of Cyperus scariosus R.Br. (Cyperaceae)
- Assessment of antiproliferative activity of green-synthesized nickel oxide nanoparticles against glioblastoma cells using Terminalia chebula
- Chlorine-free synthesis of phosphinic derivatives by change in the P-function
- Anticancer, antioxidant, and antimicrobial activities of nanoemulsions based on water-in-olive oil and loaded on biogenic silver nanoparticles
- Study and mechanism of formation of phosphorus production waste in Kazakhstan
- Synthesis and stabilization of anatase form of biomimetic TiO2 nanoparticles for enhancing anti-tumor potential
- Microwave-supported one-pot reaction for the synthesis of 5-alkyl/arylidene-2-(morpholin/thiomorpholin-4-yl)-1,3-thiazol-4(5H)-one derivatives over MgO solid base
- Screening the phytochemicals in Perilla leaves and phytosynthesis of bioactive silver nanoparticles for potential antioxidant and wound-healing application
- Graphene oxide/chitosan/manganese/folic acid-brucine functionalized nanocomposites show anticancer activity against liver cancer cells
- Nature of serpentinite interactions with low-concentration sulfuric acid solutions
- Multi-objective statistical optimisation utilising response surface methodology to predict engine performance using biofuels from waste plastic oil in CRDi engines
- Microwave-assisted extraction of acetosolv lignin from sugarcane bagasse and electrospinning of lignin/PEO nanofibres for carbon fibre production
- Biosynthesis, characterization, and investigation of cytotoxic activities of selenium nanoparticles utilizing Limosilactobacillus fermentum
- Highly photocatalytic materials based on the decoration of poly(O-chloroaniline) with molybdenum trichalcogenide oxide for green hydrogen generation from Red Sea water
- Highly efficient oil–water separation using superhydrophobic cellulose aerogels derived from corn straw
- Beta-cyclodextrin–Phyllanthus emblica emulsion for zinc oxide nanoparticles: Characteristics and photocatalysis
- Assessment of antimicrobial activity and methyl orange dye removal by Klebsiella pneumoniae-mediated silver nanoparticles
- Influential eradication of resistant Salmonella Typhimurium using bioactive nanocomposites from chitosan and radish seed-synthesized nanoselenium
- Antimicrobial activities and neuroprotective potential for Alzheimer’s disease of pure, Mn, Co, and Al-doped ZnO ultra-small nanoparticles
- Green synthesis of silver nanoparticles from Bauhinia variegata and their biological applications
- Synthesis and optimization of long-chain fatty acids via the oxidation of long-chain fatty alcohols
- Eminent Red Sea water hydrogen generation via a Pb(ii)-iodide/poly(1H-pyrrole) nanocomposite photocathode
- Green synthesis and effective genistein production by fungal β-glucosidase immobilized on Al2O3 nanocrystals synthesized in Cajanus cajan L. (Millsp.) leaf extracts
- Green stability-indicating RP-HPTLC technique for determining croconazole hydrochloride
- Green synthesis of La2O3–LaPO4 nanocomposites using Charybdis natator for DNA binding, cytotoxic, catalytic, and luminescence applications
- Eco-friendly drugs induce cellular changes in colistin-resistant bacteria
- Tangerine fruit peel extract mediated biogenic synthesized silver nanoparticles and their potential antimicrobial, antioxidant, and cytotoxic assessments
- Green synthesis on performance characteristics of a direct injection diesel engine using sandbox seed oil
- A highly sensitive β-AKBA-Ag-based fluorescent “turn off” chemosensor for rapid detection of abamectin in tomatoes
- Green synthesis and physical characterization of zinc oxide nanoparticles (ZnO NPs) derived from the methanol extract of Euphorbia dracunculoides Lam. (Euphorbiaceae) with enhanced biosafe applications
- Detection of morphine and data processing using surface plasmon resonance imaging sensor
- Effects of nanoparticles on the anaerobic digestion properties of sulfamethoxazole-containing chicken manure and analysis of bio-enzymes
- Bromic acid-thiourea synergistic leaching of sulfide gold ore
- Green chemistry approach to synthesize titanium dioxide nanoparticles using Fagonia Cretica extract, novel strategy for developing antimicrobial and antidiabetic therapies
- Green synthesis and effective utilization of biogenic Al2O3-nanocoupled fungal lipase in the resolution of active homochiral 2-octanol and its immobilization via aluminium oxide nanoparticles
- Eco-friendly RP-HPLC approach for simultaneously estimating the promising combination of pentoxifylline and simvastatin in therapeutic potential for breast cancer: Appraisal of greenness, whiteness, and Box–Behnken design
- Use of a humidity adsorbent derived from cockleshell waste in Thai fried fish crackers (Keropok)
- One-pot green synthesis, biological evaluation, and in silico study of pyrazole derivatives obtained from chalcones
- Bio-sorption of methylene blue and production of biofuel by brown alga Cystoseira sp. collected from Neom region, Kingdom of Saudi Arabia
- Synthesis of motexafin gadolinium: A promising radiosensitizer and imaging agent for cancer therapy
- The impact of varying sizes of silver nanoparticles on the induction of cellular damage in Klebsiella pneumoniae involving diverse mechanisms
- Microwave-assisted green synthesis, characterization, and in vitro antibacterial activity of NiO nanoparticles obtained from lemon peel extract
- Rhus microphylla-mediated biosynthesis of copper oxide nanoparticles for enhanced antibacterial and antibiofilm efficacy
- Harnessing trichalcogenide–molybdenum(vi) sulfide and molybdenum(vi) oxide within poly(1-amino-2-mercaptobenzene) frameworks as a photocathode for sustainable green hydrogen production from seawater without sacrificial agents
- Magnetically recyclable Fe3O4@SiO2 supported phosphonium ionic liquids for efficient and sustainable transformation of CO2 into oxazolidinones
- A comparative study of Fagonia arabica fabricated silver sulfide nanoparticles (Ag2S) and silver nanoparticles (AgNPs) with distinct antimicrobial, anticancer, and antioxidant properties
- Visible light photocatalytic degradation and biological activities of Aegle marmelos-mediated cerium oxide nanoparticles
- Physical intrinsic characteristics of spheroidal particles in coal gasification fine slag
- Exploring the effect of tea dust magnetic biochar on agricultural crops grown in polycyclic aromatic hydrocarbon contaminated soil
- Crosslinked chitosan-modified ultrafiltration membranes for efficient surface water treatment and enhanced anti-fouling performances
- Study on adsorption characteristics of biochars and their modified biochars for removal of organic dyes from aqueous solution
- Zein polymer nanocarrier for Ocimum basilicum var. purpurascens extract: Potential biomedical use
- Green synthesis, characterization, and in vitro and in vivo biological screening of iron oxide nanoparticles (Fe3O4) generated with hydroalcoholic extract of aerial parts of Euphorbia milii
- Novel microwave-based green approach for the synthesis of dual-loaded cyclodextrin nanosponges: Characterization, pharmacodynamics, and pharmacokinetics evaluation
- Bi2O3–BiOCl/poly-m-methyl aniline nanocomposite thin film for broad-spectrum light-sensing
- Green synthesis and characterization of CuO/ZnO nanocomposite using Musa acuminata leaf extract for cytotoxic studies on colorectal cancer cells (HCC2998)
- Review Articles
- Materials-based drug delivery approaches: Recent advances and future perspectives
- A review of thermal treatment for bamboo and its composites
- An overview of the role of nanoherbicides in tackling challenges of weed management in wheat: A novel approach
- An updated review on carbon nanomaterials: Types, synthesis, functionalization and applications, degradation and toxicity
- Special Issue: Emerging green nanomaterials for sustainable waste management and biomedical applications
- Green synthesis of silver nanoparticles using mature-pseudostem extracts of Alpinia nigra and their bioactivities
- Special Issue: New insights into nanopythotechnology: current trends and future prospects
- Green synthesis of FeO nanoparticles from coffee and its application for antibacterial, antifungal, and anti-oxidation activity
- Dye degradation activity of biogenically synthesized Cu/Fe/Ag trimetallic nanoparticles
- Special Issue: Composites and green composites
- Recent trends and advancements in the utilization of green composites and polymeric nanocarriers for enhancing food quality and sustainable processing
- Retraction
- Retraction of “Biosynthesis and characterization of silver nanoparticles from Cedrela toona leaf extracts: An exploration into their antibacterial, anticancer, and antioxidant potential”
- Retraction of “Photocatalytic degradation of organic dyes and biological potentials of biogenic zinc oxide nanoparticles synthesized using the polar extract of Cyperus scariosus R.Br. (Cyperaceae)”
- Retraction to “Green synthesis on performance characteristics of a direct injection diesel engine using sandbox seed oil”