Green stability-indicating RP-HPTLC technique for determining croconazole hydrochloride
-
Prawez Alam
 ,
Faiyaz Shakeel
,
Faiyaz Shakeel

Abstract
The objective of the proposed investigation is the development and validation of a green stability-indicating reverse-phase high-performance thin-layer chromatographic method to determine croconazole hydrochloride (CCZ). The developing system used was an 80:20 v/v mixture of acetone and water. The measurement of CCZ was done at 198 nm. With the use of the Analytical Eco-Scale (AES), ChlorTox, and Analytical GREEnness (AGREE) tools, greenness was evaluated. The linearity was demonstrated by the present method in the 25–1,200 ng/band range. The present approach was additionally reliable, accurate, sensitive, precise, and green. An exceptional greenness profile was demonstrated by the AES, total ChlorTox, and AGREE scales, which were determined to be 89, 1.08 g, and 0.82, respectively. The greenness metrics of the present method were much better than the reported high-performance liquid chromatography approach. Under acid and oxidative degradation circumstances, CCZ was shown to be unstable, while under alkaline and thermal-stress settings, it was sufficiently stable. Furthermore, the stability-indicating component determined by analytical method identified CCZ in the presence of its degradation products. Commercial CCZ cream was found to contain 0.98% w/w of CCZ. The investigation’s results suggested that CCZ in commercially available creams might be regularly examined with the help of the recommended green technology.
Graphical abstract
1 Introduction
Fungal infections, such as candidiasis and dermatophytosis, are on the rise and are prevalent issues in dermatology [1]. A class of closely related fungi known as dermatophytes are capable of invading human and animal keratinized tissues, such as skin, hair, and nails, and causing dangerous infections [2]. Numerous peptides produced by certain animals or synthetic chemicals have antifungal properties that effectively inhibit the growth of filamentous fungus and yeast [3,4,5]. Synthetic imidazole derivative croconazole hydrochloride (CCZ) has demonstrated strong topical antifungal activity against yeasts (Candida albicans) and dermatophytes, the organisms that cause Tinea pedis infections [6]. In vitro, it exhibits broad-spectrum action against a range of fungus species [7]. It has been demonstrated to be more effective against C. albicans than clotrimazole, but less effective than miconazole and econazole [8]. The molecular structure of CCZ is depicted in Figure 1 [8,9]. It is commercially available in the form of cream and marketed by the trade name of Pilzcin by Merz and Co. (Frankfurt, Germany) [9,10,11]. Commercial Pilzcin cream is used to treat T. pedis infection [12]. The inclusion of CCZ in commercial cream formulations is common, thus it is important to standardize and measure its contents.
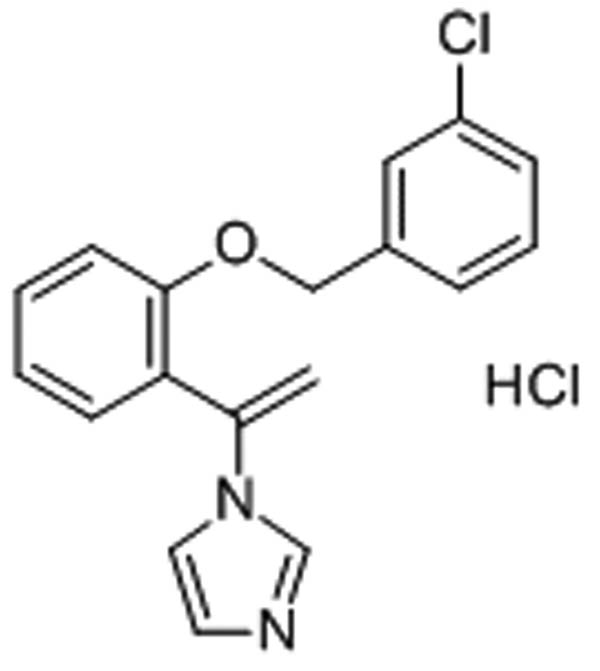
Molecular structure of CCZ (Source: https://www.chemicalbook.com/ChemicalProductProperty_EN_CB0841566.htm?N=Europe).
A comprehensive review of the literature found that there are scarcity of analytical methods for determining the content of CCZ in pharmaceutical dosage forms and biological materials. The determination of CCZ concentration in its pure or bulk form is limited to the use of a solitary high-performance liquid chromatography (HPLC) method in conjunction with parabens such as methyl, ethyl, n-propyl, iso-butyl, and n-butyl [13]. But there is nothing in the literature about using green high-performance thin-layer chromatography (HPTLC) analytical methods to find CCZ in biological or pharmaceutical products. Furthermore, the current HPTLC method is greener compared to the reported HPLC method, which is an advantage of the current method from the separation science viewpoint. When it comes to drug analysis, green HPTLC methods provide a number of advantages over traditional HPLC approaches [14,15]. Pharmaceuticals and pharmaceutical products are currently the subject of green analysis using HPTLC techniques [16,17].
Reducing the adverse impact of toxic eluents on the environment by utilizing environmentally acceptable alternatives is one of the 12 tenets of green analytical chemistry (GAC) [18]. An analysis of the literature showed that over the preceding decades, the usage of greener or more environmentally friendly solvents had enhanced to a greater extent [19,20,21]. To evaluate the eco-friendliness and greenness of analytical procedures, a variety of green analytical tools are available [22,23,24,25,26,27,28,29,30]. The Analytical Eco-Scale (AES) [25], ChlorTox [29], and Analytical GREEnness (AGREE) [30] tools were utilized in the current study to predict the greenness aspects of the suggested CCZ analysis technique. Based on the above information and observations, the proposed investigation attempts to establish and verify a green reversed-phase HPTLC approach for CCZ quantification in marketed creams. The protocol of “The International Council for Harmonization (ICH)-Q2-R2” [31] was used to verify the present HPTLC approach for CCZ analysis.
2 Materials and methods
2.1 Materials
The reference CCZ (purity: 99% by HPLC) was obtained from Shionogi & Co. Ltd. (Tokyo, Japan). The LC-grade green solvents, such as acetone, ethanol, and ethyl acetate, were acquired from E-Merck (Darmstadt, Germany). With the help of a Milli-Q® (Milli-Q, Lyon, France) device, ultra-pure water was produced. The commercial CCZ cream (containing 1.0% w/w of CCZ) was obtained from pharmaceutical stores in Karachi, Pakistan. The remaining chemicals/reagents used were of AR grade.
2.2 Chromatography procedures and analysis
CCZ in commercial cream formulation was quantified using the HPTLC system (CAMAG, Muttenz, Switzerland). Using an Automatic TLC Sampler 4 (ATS4) Applicator (CAMAG, Geneva, Switzerland), the solutions were identified as bands measuring 6 mm. The stationary phase employed to elute CCZ was RP-60F254S TLC plates (E-Merck, Darmstadt, Germany). Microliter Syringe (Hamilton, Bonaduz, Switzerland) was put into the sample applicator. About 150 nL·s−1 was the fixed application rate for every measurement. The TLC plates were positioned 8 cm apart inside an automated development chamber 2 (CAMAG, Muttenz, Switzerland). The developing system used an 80:20 v/v binary mixture of acetone and water. For 30 min at 22°C, the development chamber was filled to capacity with fumes of the proposed developing system. The detection of CCZ was done at 198 nm. The scanning speed of 20 mm·s−1 was maintained in conjunction with the set slit dimensions of 4 × 0.45 mm2. We used either three or six replications for every analysis. The results and data were processed using the program WinCAT’s (CAMAG, Muttenz, Switzerland).
2.3 Calibration curve of CCZ
About 10 mg of CCZ was dissolved in 100 mL of the developing system (acetone/water, 80:20 v/v) to yield a concentration of 100 µg·mL−1, which was taken as the CCZ stock solution. This stock solution was diluted several times to provide CCZ concentrations between 25 and 1,200 ng/band. About 10 µL of each CCZ solution was spotted on TLC plates, and the required peak area was noted. The CCZ calibration curve was plotted against the measured peak area as a function of CCZ concentrations. For each one of these trials and answers, there were six replications (n = 6).
2.4 Sample preparation for CCZ determination in commercial cream formulation
An accurately measured 1.5 g of a commercial cream formulation was transferred to a separating funnel. The cream was then mixed with 75 mL of the developing system (acetone/water, 80:20 v/v) and shaken for approximately 30 min at 25°C. With the use of a rotary vacuum evaporator, the resultant mixture was mixed and dried under reduced pressure. The residues obtained were reconstituted with 10 mL of developing system. This procedure was carried out in triplicates (n = 3). The CCZ contents of the resulting cream formulation samples were assessed using the current analysis method.
2.5 Validation assessment
The ICH-Q2-R2 protocols [31] were used to validate the current CCZ analysis method for a number of parameters, as explained subsequently.
2.5.1 System suitability
To predict the system’s applicability for the suggested CCZ analysis technique, estimates of the retardation factor (R f), peak asymmetry factor (As), and theoretical plates number per meter (N·m−1) were required. Their published formulae were used to generate the data of “R f, As, and N·m−1” [21].
2.5.2 Linearity
The acquired peak area was plotted against CCZ concentrations to assess the linearity of CCZ. The linearity of the CCZ analytical method was obtained over the range from 25 to 1,200 ng/band using six repetitions (n = 6).
2.5.3 Accuracy
In terms of percentage recoveries, the accuracy of the present CCZ analytical approach was evaluated using the spiking technology [31]. The concentrations of 50%, 100%, and 150% CCZ were added to the previously quantified CCZ concentration (300 ng/band) to provide the following amounts of CCZ: 450 ng/band for low quality control, 600 ng/band for middle quality control (MQC), and 750 ng/band for high quality control. Accuracy was evaluated for each CCZ quality control (QC) solution. Six repetitions (n = 6) were used to derive the percentage recovery at every level of QC.
2.5.4 Precision
The precision of the current CCZ analytical method was assessed at two different levels, i.e., inter-day (intermediate) precision and repeatability (intra-day precision). On the same day, newly generated CCZ samples could be assessed at predefined QC levels. Consequently, the CCZ intra-assay precision or repeatability may be ascertained. To assess the CCZ inter-batch variation, evaluation of freshly generated CCZ samples at previously mentioned QC samples was conducted for 3 days [31]. There were six replicates (n = 6) included in the evaluation of both precisions. As a percentage of relative standard deviation (% RSD), the precisions were provided.
2.5.5 Robustness
To assess the robustness of the analytical approaches, several intentional modifications can be made to the content of the relevant developing system. The robustness of the current analysis method was ascertained by making small, purposeful modifications to the developing system’s composition during CCZ analysis. The initial acetone/water (80:20 v/v) developing system was modified to acetone/water (82:18 v/v) and acetone/water (78:22 v/v) for this purpose. At each set of conditions, the necessary alterations in peak area (quantitative parameter) and R f (separation parameter) values were recorded [31].
2.5.6 Sensitivity
The suggested CCZ analytical technique’s sensitivity was determined by utilizing the standard deviation methodology to compute the limit of detection (LOD) and limit of quantification (LOQ) [31]. Using the suggested methodology, six replicates (n = 6) of the blank solution (without CCZ) were assessed, and the standard deviation was calculated. Then, utilizing the established techniques and their standard equations, the CCZ LOD and LOQ were derived [31,32].
2.5.7 Specificity
To assess the method’s specificity for CCZ analysis, the R f data and UV-absorption spectrum of reference CCZ and CCZ in commercial cream formulation were compared with each other.
2.6 Forced degradation studies
No chromatograms were recorded before chromatographic development. Studies on forced degradation used four stress conditions: acid (HCl), base (NaOH), oxidative (H2O2), and thermal degradation conditions [31,33]. Using the developing system, a fresh CCZ MQC sample (600 ng/band) was created for every deterioration evaluation. Acid and base hydrolysis was performed by mixing 1 mL of MQC solution with 4 mL of either 1 M HCl or 1 M NaOH. Alkaline hydrolysis solutions and acid solutions were diluted using the developing system. These samples were subjected to 48 h of refluxing at 60°C before being assessed for CCZ degradation using the present analysis technique [31].
Using the developing system, a new CCZ MQC sample was made for oxidative degradation conditions. Next, 4 mL of 30% H2O2 was added to 1 mL of this solution to oxidize it. The developing system efficiently diluted this mixture. The CCZ degradation of this combination was assessed using the current analysis method [31] following 48 h of refluxing it at 60°C.
The CCZ MQC sample was heated to 60°C for 48 h in a hot air oven after it had been suitably diluted using the developing system. This resulted in the thermal hydrolysis of the MQC (600 ng/band) solution. Then, the present analysis approach was applied to evaluate CCZ thermal deterioration [31].
2.7 CCZ analysis in marketed cream formulation using the current assay
The commercial cream formulation solutions were spotted onto reverse-phase TLC plates for the current investigation. To determine CCZ, three peak area measurements were taken using the same experimental setup as for a typical CCZ. The current analysis method was used to evaluate the amount of CCZ in pharmaceutical cream formulation by CCZ calibration plot.
2.8 Greenness evaluation
Three distinct tools were used in this work to derive the greenness scale of the current analytical approach: the AGREE [30], ChlorTox [29], and AES [25]. AES is a semi-quantitative approach that considers waste, instruments, and every step of the analytical process. Reagent usage, energy consumption, and waste are all anticipated to be negligible or absent in materials with an optimum analysis of 100 points. If any of these guidelines are broken, penalty points are given and subtracted from the total of 100 [25]. The ChlorTox scale was determined with the help of Eq. 1 as per the ChlorTox approach [29]:
where CHsub represents the substance of interest’s chemical risks,
where the toxicity numbers for the 1, 2, 3, and 4 categories are denoted, respectively, by the letters N cat1, N cat2, N cat3, and N cat4.
For acetone, N cat1 = 0, N cat2 = 2, N cat3 = 1, and N cat4 = 0 were derived from SDS of Sigma Aldrich.
Hence for acetone,
For substance acetonitrile, N cat1 = 0, N cat2 = 2, N cat3 = 0, and N cat4 = 3 were derived from SDS of Sigma Aldrich.
Hence for acetonitrile,
For substance methanol, N cat1 = 1, N cat2 = 1, N cat3 = 3, and N cat4 = 0 were derived from SDS of Sigma Aldrich.
Hence for methanol,
For standard chloroform, N cat1 = 1, N cat2 = 4, N cat3 = 3, and N cat4 = 1 were derived from SDS of Sigma Aldrich.
Hence for standard chloroform,
Section 3 includes the m sub data required for a single analysis. Ultimately, the ChlorTox levels were determined utilizing Eq. 1.
The AGREE score of the suggested CCZ analysis technique was evaluated by the AGREE-approach [30]. The “AGREE: The Analytical Greenness Calculator (version 0.5, Gdansk University of Technology, Gdansk, Poland, 2020)” was utilized to derive the AGREE scores for the current analysis approach. Based on 12 different GAC components, the values varied from 0.0 to 1.0.
3 Results and discussion
3.1 Development and optimization of HPTLC procedure
Based on previous research, HPTLC plates precoated with silica gel 60F254 on an aluminum backing were selected and employed as the stationary phase for the development and optimization of a green HPTLC method for the determination of CCZ in its commercial cream formulation [34,35,36]. Various pure green solvents such as ethanol, acetone, ethyl acetate, and water were evaluated for the optimization of R f value and peak shape of CCZ. Subsequently, a variety of binary combinations in varying proportions, such as ethanol/water, acetone/water, ethanol/ethyl acetate, and acetone/ethyl acetate, were evaluated based on the preliminary results using pure green solvents. The use of high-volatile organic solvents such as chloroform, methanol, or acetonitrile is usually recommended as the developing system for HPTLC analysis. The use of these volatile solvents results in identifying and quantifying the drugs/pharmaceuticals efficiently. These solvents are highly toxic and hazardous to the environment. The use of green organic solvents including water to reduce the harmful effects of hazardous solvents on the environment is emphasized in one of the 12 principles of GAC [18]. Ethanol, water, acetone, and ethyl acetate are the solvents under examination; they are categorized as green solvents because they pose no environmental harm [37,38]. Because, water is the greenest solvent, it was utilized in combination with different green organic solvents in order to reduce the environmental toxicity of the present analytical method. In addition, the studied analyte CCZ is very soluble in water [8], which could be the additional advantage of using water in combination with green organic solvents. We did not study the influence of pH on drug analysis. As a result, the drug pka value and pH of the developing system were not mentioned in the trials of the developing system. In HPTLC analysis, the developing system is used for the development of TLC plates. After the development of plates, the solvents are completely evaporated. During analysis, there is no use of developing system. Therefore, all these physicochemical factors are not important for the analysis of drugs using HPTLC technique. As a result, we did not consider these factors.
Every single developing system was developed within a saturation chamber. The forced-degradation samples, reference CCZ samples, and commercial cream formulation based on the best-developing systems are all represented by a typical TLC image in Figure 2. Table 1 summarizes the components of several developing systems as well as the measured chromatographic characteristics. When various combinations, such as ethanol/water (50:50 v/v), ethanol/water (80:20 v/v), ethanol/ethyl acetate (50:50 v/v), ethanol/ethyl acetate (80:20 v/v), acetone/ethyl acetate (50:50 v/v), and acetone/ethyl acetate (80:20 v/v), were studied, inconsistent CCZ peaks with larger As (As = 1.28–1.45) and low N·m−1 (N·m−1 = 1,782–2,914) were recorded.
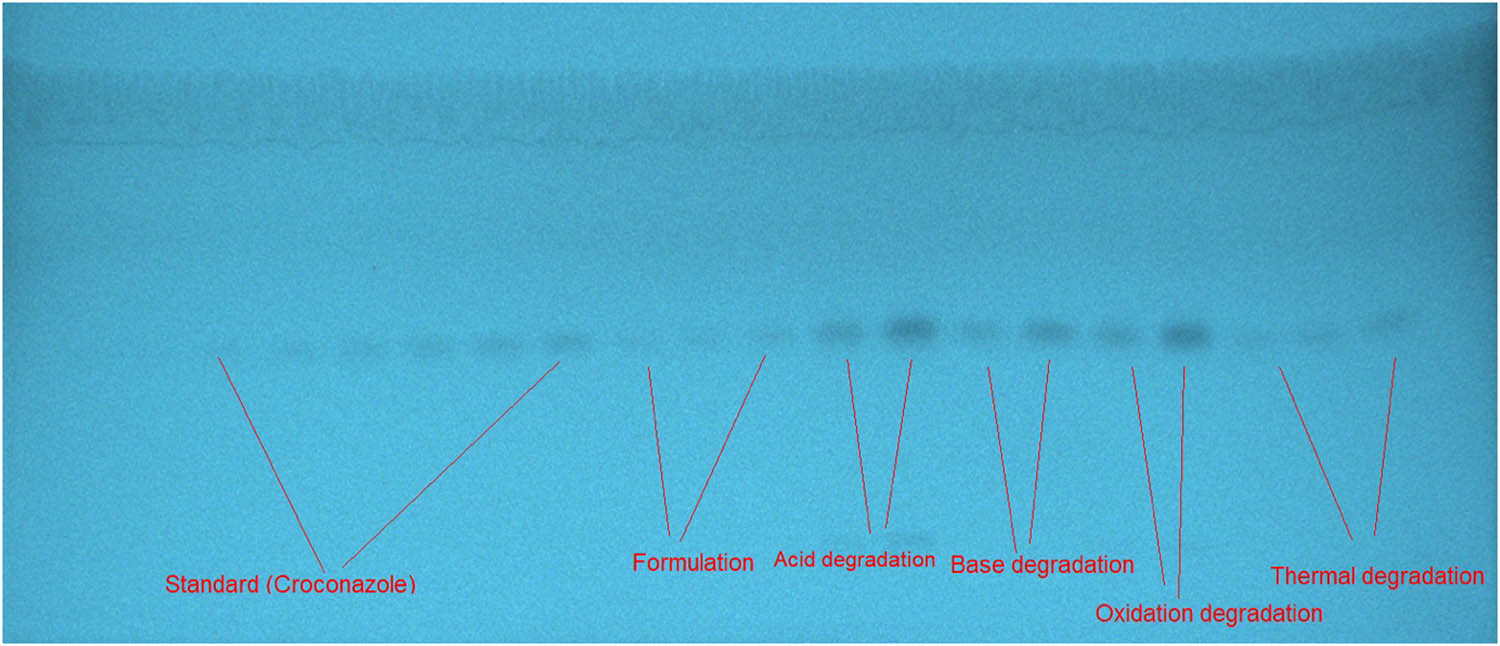
The TLC image for reference CCZ, commercial cream, and forced-degradation samples were derived utilizing the developing system acetone/water (80:20 v/v) for the proposed analysis method.
CCZ measured parameters and composition of developing systems for the current analysis method (mean ± SD; n = 3)
| Developing system | As | N·m−1 | R f |
|---|---|---|---|
| Ethanol/water (50:50 v/v) | 1.32 ± 0.05 | 2,874 ± 2.64 | 0.58 ± 0.05 |
| Ethanol/water (80:20 v/v) | 1.28 ± 0.04 | 2,914 ± 2.77 | 0.56 ± 0.04 |
| Acetone/water (50:50 v/v) | 1.21 ± 0.05 | 3,814 ± 2.87 | 0.50 ± 0.02 |
| Acetone/water (80:20 v/v) | 1.12 ± 0.03 | 4,612 ± 2.96 | 0.46 ± 0.01 |
| Ethanol/ethyl acetate (50:50 v/v) | 1.38 ± 0.06 | 1,814 ± 1.58 | 0.72 ± 0.04 |
| Ethanol/ethyl acetate (80:20 v/v) | 1.41 ± 0.07 | 1,782 ± 1.52 | 0.74 ± 0.05 |
| Acetone/ethyl acetate (50:50 v/v) | 1.43 ± 0.08 | 2,124 ± 1.84 | 0.77 ± 0.06 |
| Acetone/ethyl acetate (80:20 v/v) | 1.45 ± 0.09 | 2,041 ± 1.77 | 0.79 ± 0.07 |
R f: retardation factor; As: peak asymmetry factor; N·m−1: theoretical plates number per meter.
When the combinations of acetone/water (50:50 v/v) and acetone/water (80:20 v/v) were explored, it was observed that narrow As (As = 1.12–1.21) and higher N·m−1 (N·m−1 = 3,814–4,612) improved the CCZ chromatographic signals (Table 1). The chromatogram of blank sample is presented in Figure 3a, which showed no peak of CCZ. The most unique system among all of these combinations was the green acetone/water (80:20 v/v) developing system, which displayed a continuous and uninterrupted CCZ signal at R f = 0.46 ± 0.01 (Figure 3b). Additionally, it was discovered that CCZ had an As value of 1.12, which is suitable for CCZ analysis. Therefore, the most environmentally friendly development system for the current CCZ analysis method has been determined to be acetone/water (80:20 v/v). The absorbance mode was used to record the CCZ spectral bands in the range of 190–400 nm in order to select the optimal wavelengths. It was found that the greatest chromatographic response was detected at 198 nm. Consequently, the optimal wavelength for the full CCZ investigation was determined to be 198 nm.
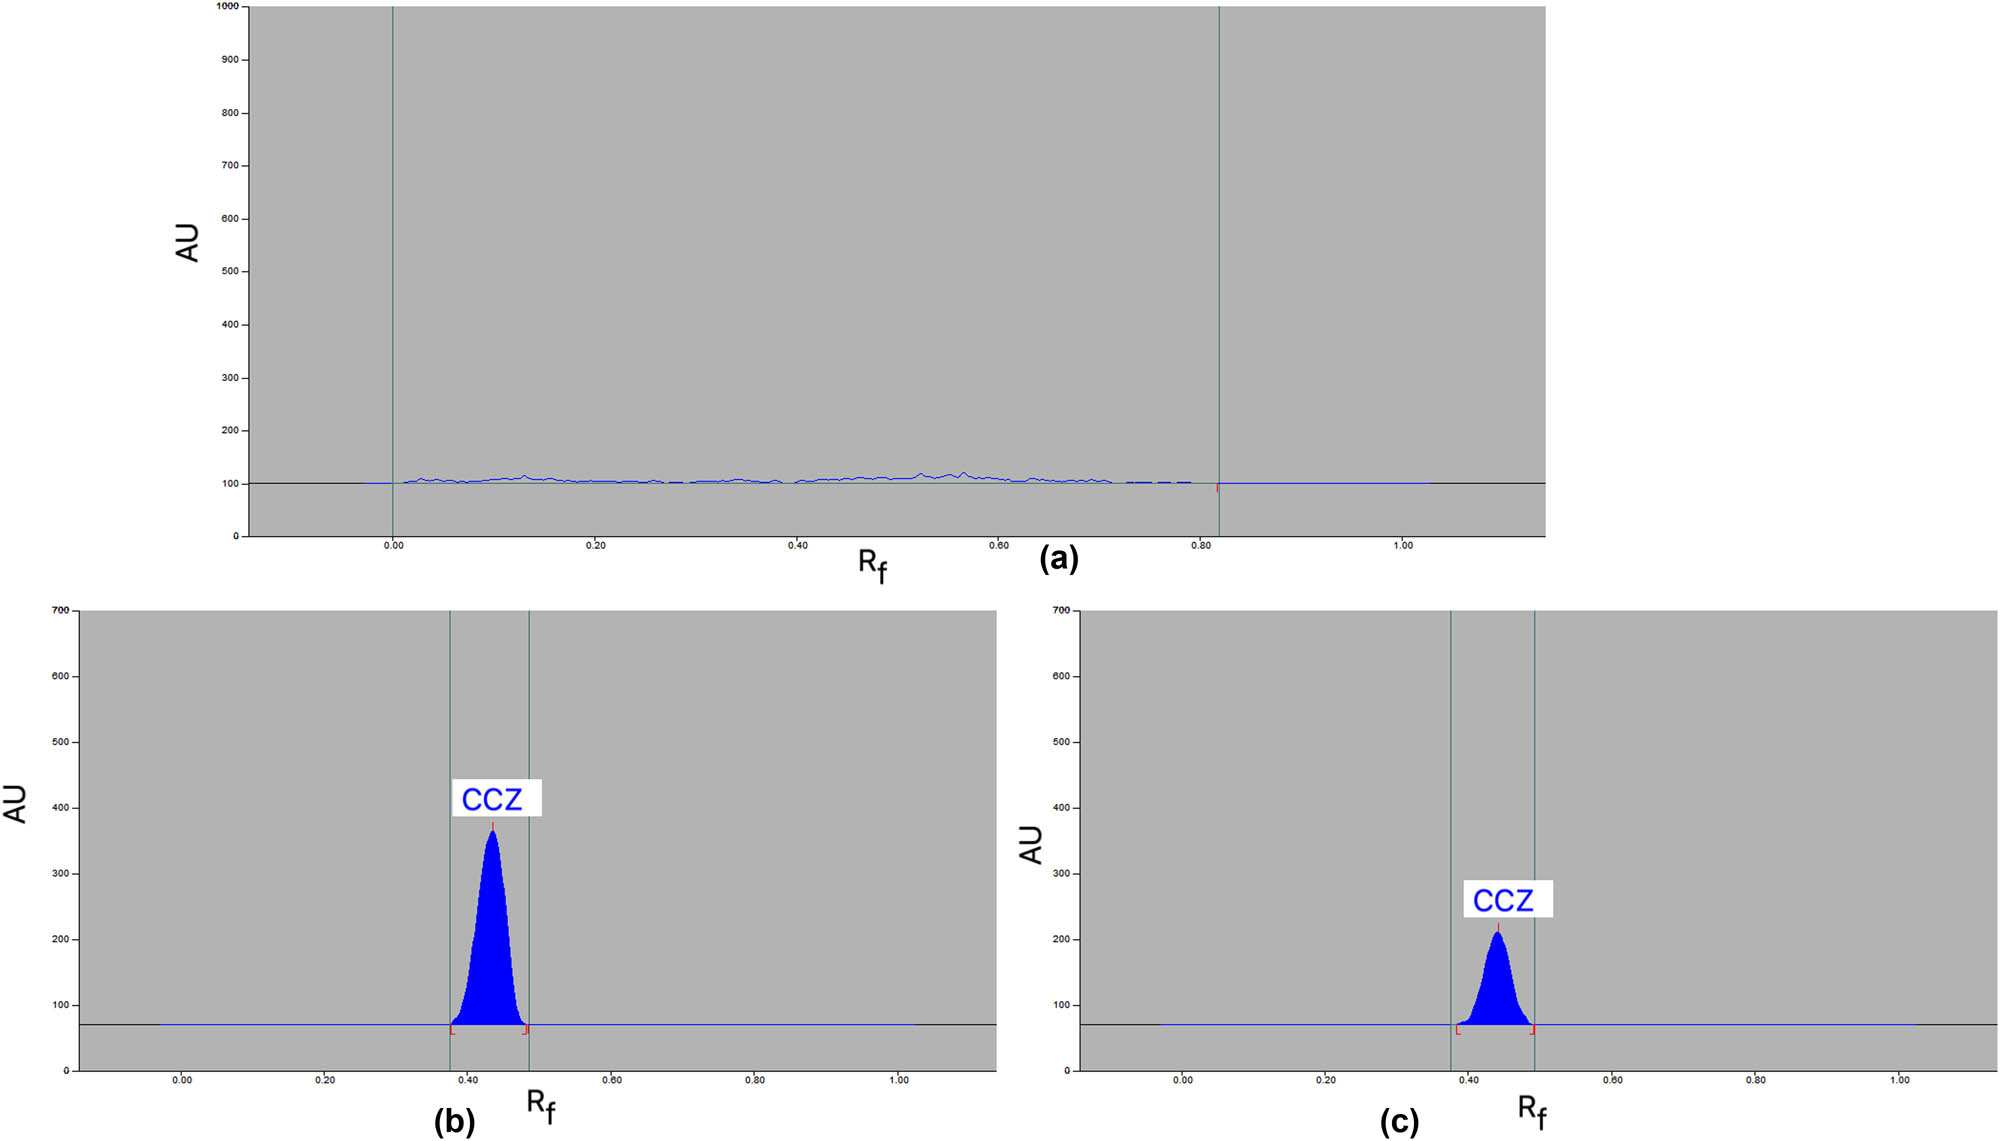
Typical chromatograms of (a) blank, (b) reference CCZ, and (c) commercial cream formulation for the proposed analysis method.
3.2 Validation assessment
As described below, the ICH-Q2-R2 procedures [31] were utilized to assess numerous validation metrics for CCZ analysis:
3.2.1 System suitability
For the current analysis approach, the system suitability parameters were calculated using their standard equations. “R f, As, and N·m−1” were calculated for the CCZ study utilizing the current analytical approach, and the results showed that they were 0.46 ± 0.01, 1.12 ± 0.03, and 4,612 ± 2.96, respectively. These specifications worked well for CCZ detection.
3.2.2 Linearity
The outcomes of the linear regression analysis for the CCZ calibration curve utilizing the suggested analytical technique are shown in Table 2. It was observed that the CCZ calibration plot for the suggested analysis method was linear over the concentration range of 25–1,200 ng/band. The correlation coefficient (R) and determination coefficient (R 2) for the CCZ under the current analysis approach were 0.9995 and 0.9991, respectively. Furthermore, the slope and calibration curves’ standard deviations and standard error values were excessively low in relation to their mean values. In addition, the 95% confidence interval values for slope and intercept were within the narrow range. These findings demonstrated a significant correlation between the CCZ concentrations and the observed peak area. These results proved that the current CCZ analysis method is linear.
Linear regression data of CCZ for the proposed analysis approach (mean ± SD; n = 6)
| Parameters | Data |
|---|---|
| Linearity range (ng/band) | 25–1,200 |
| Regressed equation | y = 18.027x + 314.11 |
| R 2 | 0.9991 |
| R | 0.9995 |
| Slope ± SD | 18.027 ± 0.84 |
| Intercept ± SD | 314.1 ± 1.76 |
| Standard error of slope | 0.34 |
| Standard error of intercept | 0.71 |
| 95% confidence interval of slope | 16.55–19.50 |
| 95% confidence interval of intercept | 311.01–317.20 |
| LOD ± SD (ng/band) | 1.62 ± 0.05 |
| LOQ ± SD (ng/band) | 4.87 ± 0.15 |
3.2.3 Accuracy
The accuracy of the current CCZ analysis method was obtained by applying the spiking approach that is covered in the experimental section. The data obtained from the % recovery utilizing the current analytical approach are shown in Table 3. The percentage recoveries of CCZ at three distinct QC levels ranged from 100.72% to 101.87%, according to the research done using the current methodology. The high percentage of recoveries showed that the existing analysis method could measure CCZ with accuracy.
Accuracy results of CCZ for the proposed analysis approach (mean ± SD; n = 6)
| Conc. (ng/band) | Conc. found (ng/band) ± SD | Recovery (%) | RSD (%) |
|---|---|---|---|
| 450 | 453.24 ± 4.87 | 100.72 | 1.07 |
| 600 | 611.23 ± 5.76 | 101.87 | 0.94 |
| 750 | 763.45 ± 6.89 | 101.79 | 0.90 |
3.2.4 Precision
The CCZ analysis precision for two degrees of precision is expressed as %RSD. The resulting data of both precisions for the suggested CCZ analysis approach are displayed in Table 4. It was discovered that the suggested analysis approach’s intra-day precision RSD of CCZ ranged from 0.83% to 0.92%. It was found that the current analytical method’s inter-day precision has an RSD of CCZ ranging from 0.87% to 0.98%. The obtained outcomes demonstrated that the suggested analysis methodology can precisely identify the CCZ.
Precision results of CCZ for the proposed analysis method (mean ± SD; n = 6)
| Conc. (ng/band) | Intra-day precision | Inter-day precision | ||||
|---|---|---|---|---|---|---|
| Conc. (ng/band) ± SD | SE | RSD (%) | Conc. (ng/band) ± SD | SE | RSD (%) | |
| 450 | 447.81 ± 4.12 | 1.68 | 0.92 | 456.23 ± 4.48 | 1.82 | 0.98 |
| 600 | 605.58 ± 5.22 | 2.13 | 0.86 | 591.41 ± 5.49 | 2.24 | 0.92 |
| 750 | 741.25 ± 6.21 | 2.53 | 0.83 | 756.33 ± 6.61 | 2.69 | 0.87 |
3.2.5 Robustness
The percentage of the green developing system was purposefully changed in order to determine how robust the existing CCZ analysis method is. Table 5 presents the results of the robustness measurement for the current analytical methodology. According to calculations, the current analysis method’s CCZ %RSD falls between 0.99% and 1.02%. The present analysis approach yielded CCZ R f values ranging from 0.45 to 0.47. These findings proved that the CCZ analysis method currently in use is robust.
Results of CCZ robustness for the current analysis method (mean ± SD; n = 6)
| Conc. (ng/band) | Developing system (acetone/water) | Results | ||||
|---|---|---|---|---|---|---|
| Original | Used | Level | Conc. (ng/band) ± SD | RSD (%) | R f | |
| 82:18 | +2.0 | 584.94 ± 5.84 | 0.99 | 0.45 | ||
| 600 | 80:20 | 80:20 | 0.0 | 593.61 ± 5.98 | 1.00 | 0.46 |
| 78:22 | −2.0 | 603.65 ± 6.21 | 1.02 | 0.47 | ||
3.2.6 Sensitivity
To find out how sensitive the current CCZ analytical method is, the “LOD and LOQ” were computed. CCZ “LOD and LOQ” computed using the current analytical method are listed in Table 2. CCZ “LOD and LOQ” are 1.62 ± 0.05 and 4.87 ± 0.15 ng/band, respectively, according to the data in Table 2. The outcomes demonstrated the sensitivity of the existing CCZ analysis technique.
3.2.7 Specificity
The specificity of the current CCZ analytical method was assessed by comparing the R f data and UV-absorption spectrum of CCZ in commercial cream formulation to that of reference CCZ. Figure 4 shows the overlaid UV-absorption spectrum of the commercial cream formulation and standard CCZ.
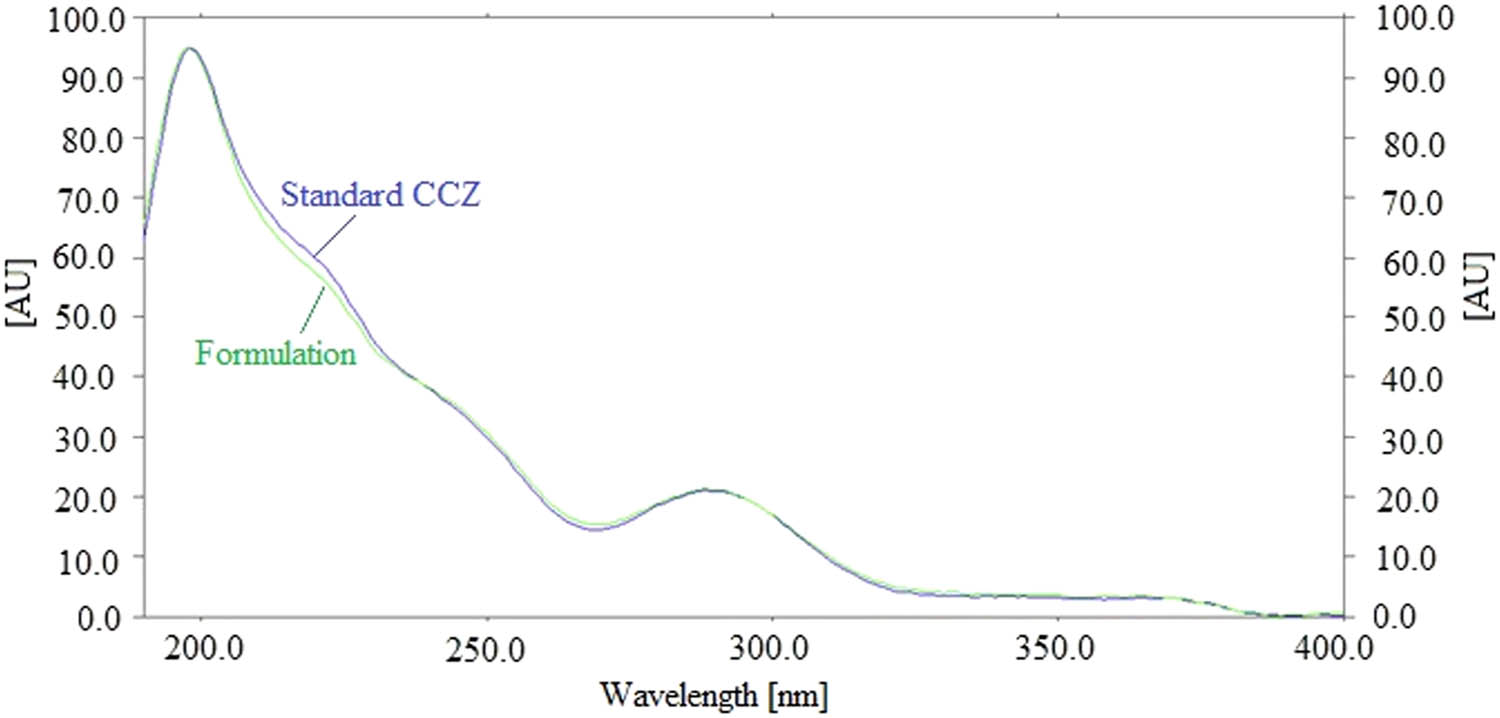
UV-absorption spectra of standard CCZ and commercial cream formulation.
By comparing the spectra at the peak start (S), peak apex (M), and peak end (E) positions of the spots, the peak purity of standard CCZ and CCZ in commercial cream formulation was assessed [39,40]. The homogeneity of the peaks was shown by the estimated values of r (S,M) and r (M,E) of the commercial cream formulation and standard CCZ, which were found to be greater than 0.99 [39,40,41]. The standard and commercial cream formulations had identical UV absorption spectra. The greatest chromatography signal was seen for CCZ in both reference and commercial cream formulations at a wavelength of 198 nm. Additionally, the R f values of the commercial cream formulation and the standard CCZ were identical. Overall, the standard and commercial cream formulations had the same wavelengths, R f measurements, and UV-absorption spectra. These findings demonstrated the existing CCZ analysis method’s specificity.
3.3 Forced degradation studies
Using four distinct stress conditions, the suggested CCZ analytical technique’s forced degradation was investigated. The findings of forced-degradation investigations are shown in Table 6 and Figure 5. It was observed that CCZ remained at 82.07%, while 17.93% was decomposed under acid hydrolysis stress conditions (Table 6). Consequently, it was shown that under acid hydrolysis conditions, CCZ was unstable. Chromatographic peaks 1, 3, and 4 in Figure 5a reflect the peaks of degradation compounds, which were divided using R f values of 0.07, 0.59, and 0.67, respectively. Under acid hydrolysis, the R f value for CCZ stayed at 0.46. Since no breakdown products were detected under base hydrolysis conditions, it was concluded that CCZ demonstrated exceptional stability under alkaline hydrolysis. It was discovered that under base hydrolysis stress settings (Table 6 and Figure 5b), the CCZ R f value was not shifted (R f = 0.46). CCZ stayed at 82.79% under oxidative degradation conditions, and following stress setting, 17.21% broke down (Table 6 and Figure 5c). Consequently, it was shown that CCZ was unstable in oxidative environments. The breakdown product signals, represented by chromatographic peaks 1 and 3 in Figure 5c, were separated by R f values of 0.07 and 0.65, respectively. Under oxidative degradation, the R f value for CCZ was slightly moved (R f = 0.45). Conversely, it was discovered that under thermal deterioration circumstances, no degradation products were observed, indicating that CCZ demonstrated exceptional stability under thermal hydrolysis. Under thermal hydrolysis stress settings (Table 6 and Figure 5d), it was observed that the CCZ R f value was not shifted (R f = 0.46). The purpose of forced-degradation studies was to evaluate the selectivity and stability-indicating features of the present analytical method. Using the suggested CCZ analysis methodology, the highest CCZ breakdown was observed under acid degradation test. Based on the current research approach, all of these data revealed that CCZ might be detected in the presence of its degradation products. These observations and data confirmed the suggested technique’s selectivity and stability-indicating capabilities.
Results of forced-degradation studies of CCZ for the current analysis method under varied stress conditions (mean ± SD; n = 3)
| Stress condition | Degradation products (R f) | CCZ R f | CCZ remained (ng/band) | CCZ recovered (%) |
|---|---|---|---|---|
| 1 M HCl | 3 (0.07, 0.59, 0.67) | 0.46 | 492.42 | 82.07 ± 2.52 |
| 1 M NaOH | 0 | 0.46 | 600.00 | 100.00 ± 0.00 |
| 30% H2O2 | 2 (0.07, 0.65) | 0.45 | 497.82 | 82.79 ± 2.57 |
| Thermal | 0 | 0.46 | 600.00 | 100.00 ± 0.00 |
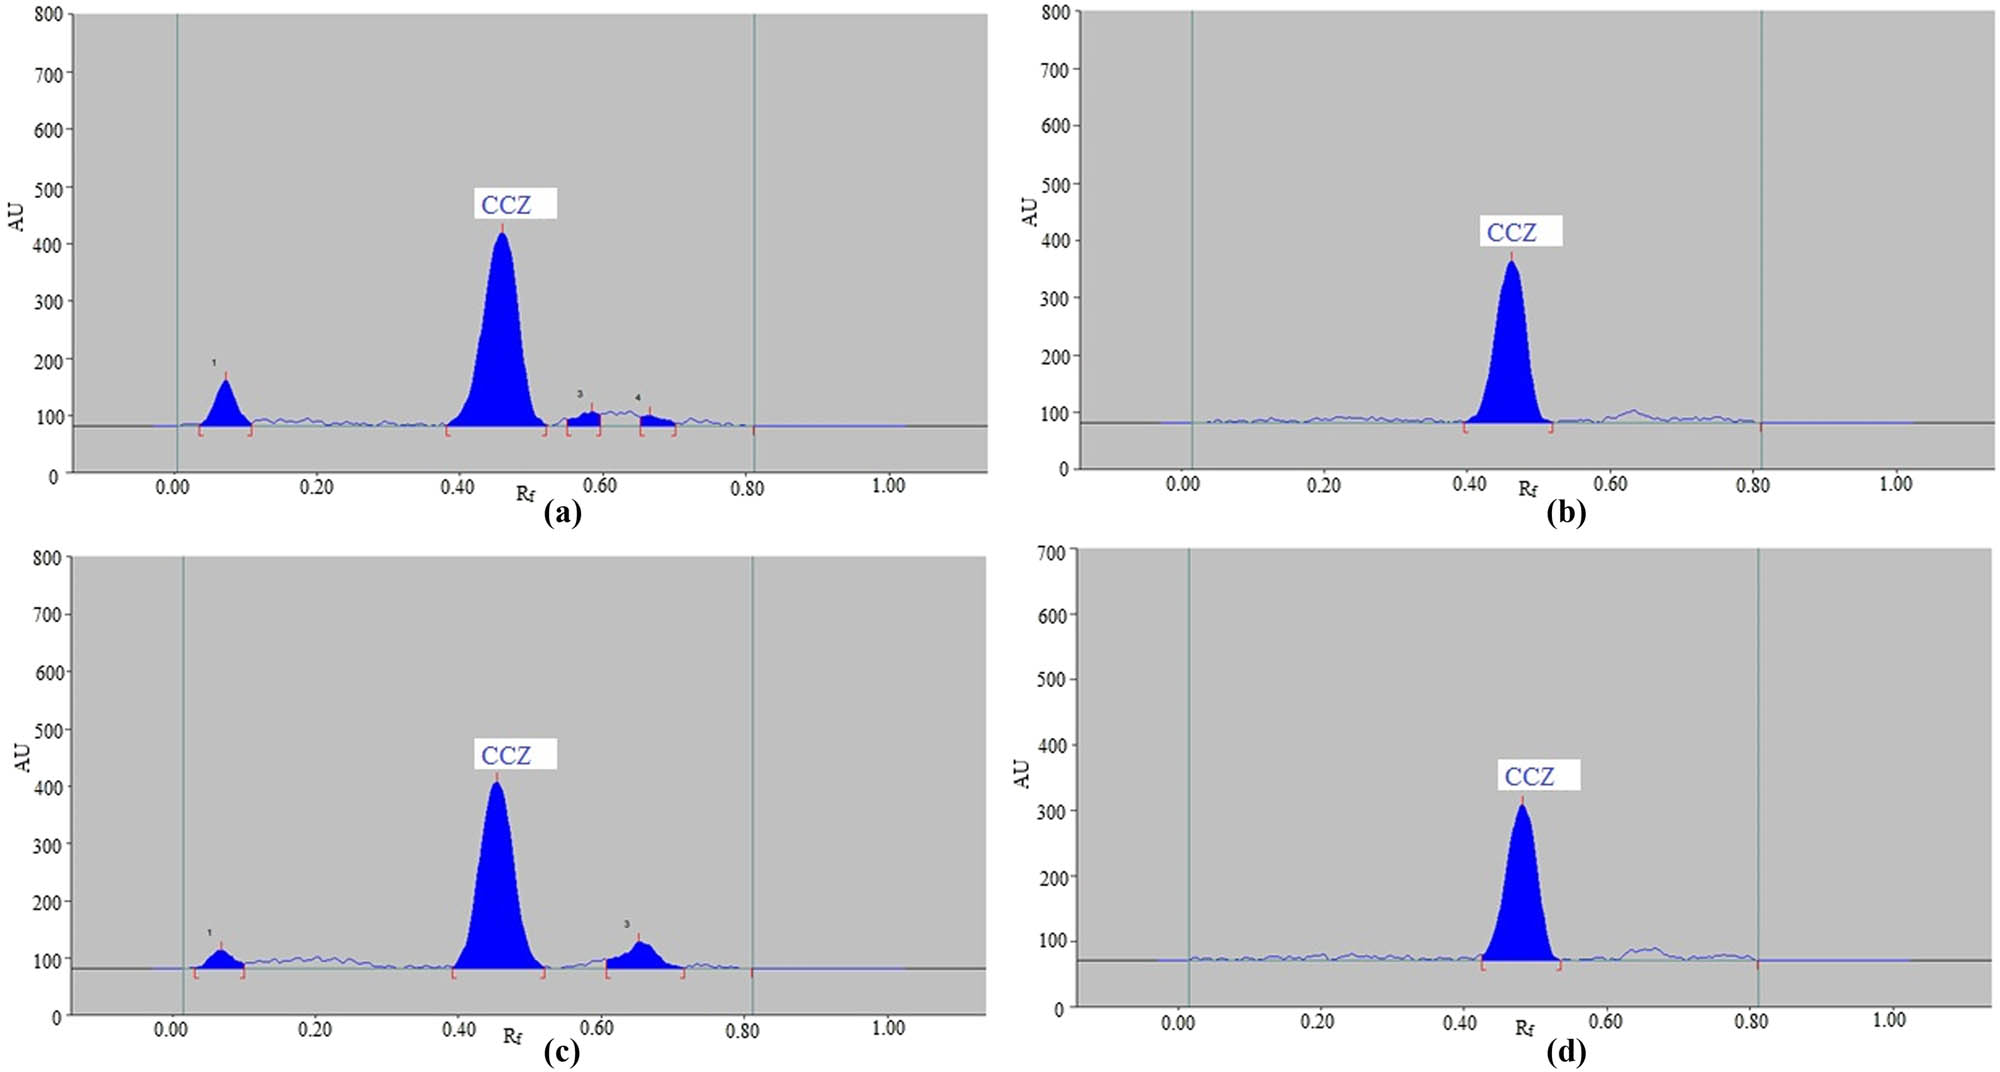
Representative CCZ chromatograms taken under the following conditions: (a) acidic, (b) basic, (c) oxidative, and (d) thermal stress degradation.
3.4 CCZ analysis in marketed cream formulation using the current assay
The proposed analysis approach was used to determine CCZ in pharmaceutical creams instead of classic HPLC procedures. The CCZ was extracted from creams using the proposed developing system, i.e., acetone/water (80:20 v/v). After reconstitution of cream with the proposed developing system, the CCZ contents were analyzed using the present method. The chromatogram of the commercial cream formulation of CCZ was confirmed by contrasting the TLC spot at R f = 0.46 ± 0.01 for CCZ with reference CCZ utilizing the present analysis approach. When analyzed with the current analysis method, the chromatograms of CCZ in commercial cream formulation were identical to the reference CCZ. The absence of excipient peaks in the formulation of commercial creams suggested that there was no interaction between the CCZ and the components in the creams (Figure 3c). Using the CCZ calibration curve, the amount of CCZ in commercial cream formulation was determined. Using the current analysis method, the amount of CCZ in commercial cream formulation was determined to be 0.98 ± 0.02% w/w (label claim 1.0% w/w). These results demonstrated that the current analytical method was reliable for the pharmaceutical analysis of CCZ.
3.5 Greenness evaluation
Numerous methods for assessing the greenness of drug analysis methods have been developed, including green analysis [22,23,24,25,26,27,28,29,30]. In this article, the greenness of the suggested CCZ analytical assay was obtained by three different methods: AES [25], ChlorTox [29], and AGREE [30] tools. The AES scales with penalty points for the current analysis method in comparison to the reported HPLC method are displayed in Table 7. The AES score for the current analysis approach, which came out to be 89, displayed an extremely good greenness profile. The literature HPLC approach’s AES score was 65, according to the findings of Akhtar et al. [13]. The AES analysis demonstrated that the present analytical strategy was substantially more environmentally friendly than the previously described HPLC method [13].
Current analysis method’s AES with penalty points compared to the reported HPLC method
| Reagents/instruments/waste | Penalty points | |
|---|---|---|
| HPLC [13] | Present HPTLC | |
| Acetone | — | 8 |
| Water | — | 0 |
| Methanol | 18 | — |
| Acetonitrile | 12 | — |
| KH2PO4 (0.05 M) | 0 | — |
| Instruments | 0 | 0 |
| Waste | 5 | 3 |
| Total penalty points | 35 | 11 |
| AES scale | 65 | 89 |
Together with a comparison to the published HPLC method, Table 8 shows the data of the overall ChlorTox score and the particular greener solvent ChlorTox score for the current analysis method. The total ChlorTox score for the current analysis approach was expected to be 1.08 g, which makes it safer and better for the environment [29]. Reported HPLC method was expected to have a total ChlorTox scale of 3.66 g, suggesting that the published HPLC method was both unsafe and less green [13]. The proposed analysis method is safer and greener over the reported HPLC method [13], according to the ChlorTox data.
Findings from the ChlorTox scales for the current analysis method in comparison to reported HPLC technique for the relative risks associated with chloroform (CHsub/
| Stage | Solvent/reagent | Relative hazard (CHsub/
|
msub (mg) | ChlorTox (g) | Total ChlorTox (g) | Ref. |
|---|---|---|---|---|---|---|
| Sample preparation | Acetone | 0.34 | 1,600 | 0.54 | 1.08 | Present HPTLC |
| HPTLC analysis | Acetone | 0.34 | 1,600 | 0.54 | ||
| Sample preparation | Methanol | 0.56 | 792 | 0.44 | 3.66 | [13] |
| HPLC analysis | Acetonitrile | 0.39 | 8,253 | 3.22 |
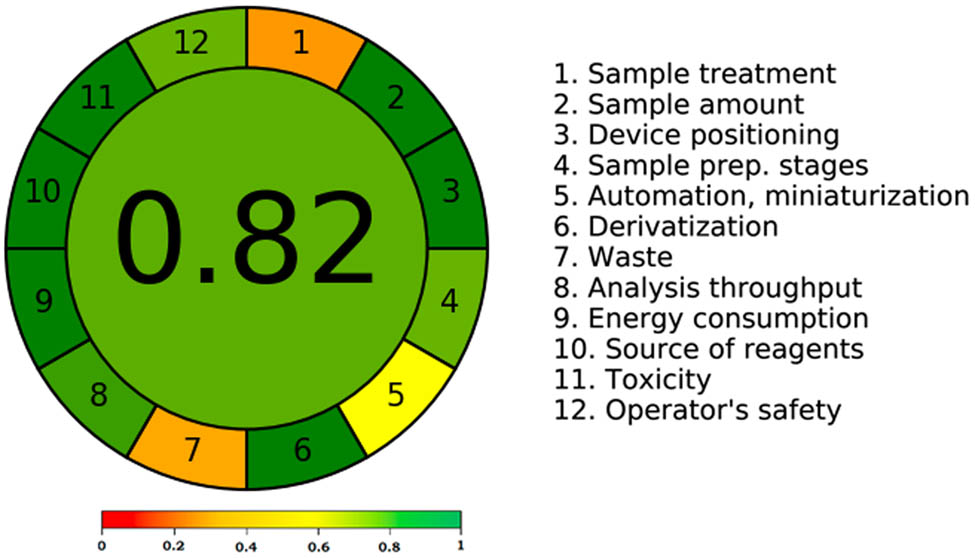
Because it considers all 12 GAC principles, AGREE is the most widely used quantitative method for evaluating greenness [30]. An AGREE score of 0.75 or above suggested outstanding greenness, 0.75 but greater than 0.50 indicated adequate greenness, and 0.50 or lower indicated insufficient greenness, according to the reports [30]. Using the 12 GAC principles, Figure 6 presents a summary of the recorded total AGREE scale. The overall AGREE scale for the current HPTLC approach was found to be 0.82. The AGREE results demonstrated the existing analysis method’s outstanding green features once more. When compared to the existing HPLC methodology, the new analysis method for CCZ evaluation in commercial cream formulation demonstrated an excellent greenness profile based on the evaluation of all greenness tools [13].

The scale of AGREE for the present CCZ analysis technique.
4 Conclusions
For the quantitative analysis of CCZ in the commercial cream formulation, a green reverse-phase HPTLC method was created and verified. It was discovered that the current CCZ analytical approach for CCZ estimate is simple, accurate, sensitive, selective, stability-indicating, and green. As evidenced by the results of the AES and ChlorTox analyses, the present analysis method has significantly greener properties over the reported HPLC method for CCZ determination. It was demonstrated that CCZ was unstable in the presence of acid and oxidative stress, but that it was relatively stable in the presence of basic and thermal degradation conditions. The present analysis approach was selective and stability-indicating, as evidenced by its ability to measure CCZ in the presence of its degradation products. Moreover, it proved to be an effective tool for quantifying CCZ in commercial cream formulation. Overall, it has been found that compared to the previously reported HPLC approach, the present analysis approach is safer and greener. When CCZ is present in pharmaceutical dosage forms, the current analysis approach may be utilized to perform a quantitative study of the compound.
Acknowledgements
The authors are thankful to the Researchers Supporting Project number (RSPD2024R1040), King Saud University, Riyadh, Saudi Arabia for supporting this work. The authors also thank Prince Sattam bin Abdulaziz University for supporting this work via project number (PSAU/2024/R/1445). Sultan Alshehri would like to express sincere gratitude to AlMaarefa University, Riyadh, Saudi Arabia for providing funding to conduct this research.
-
Funding information: This work was funded by the Researchers Supporting Project number (RSPD2024R1040), King Saud University, Riyadh, Saudi Arabia and Prince Sattam bin Abdulaziz University via project number (PSAU/2024/R/1445).
-
Author contributions: PA: conceptualization, supervision, project administration, methodology, investigation, funding acquisition; FS: conceptualization, methodology, software; data curation, formal analysis, funding acquisition, validation, resources, writing original draft; SA: validation, funding acquisition, visualization, software; AA: formal analysis, data curation, validation; MHA: methodology, investigation, validation AIF: methodology, investigation, validation; TMA: methodology, investigation, software; FMAB: formal analysis, software, data curation, validation. Finally, all the authors have read, edited, and approved the final version of the manuscript.
-
Conflict of interest: The authors state no conflict of interest.
-
Data availability statement: All the data generated or analyzed during this work are included in this published work.
References
[1] Gousy N, Sateesh BA, Denning DW, Latchman K, Mansoor E, Joseph J, et al. Fungal infections in the Caribbean: A review of the literature to date. J Fungi. 2023;9:E1177.10.3390/jof9121177Search in Google Scholar PubMed PubMed Central
[2] Kruithoff C, Gamal A, McCormick TS, Ghannoum MA. Dermatophyte infections worldwide: Increase in incidence and associated antifungal resistance. Life. 2024;14:E1.10.3390/life14010001Search in Google Scholar PubMed PubMed Central
[3] De-Lucca AJ, Walsh TJ. Antifungal peptides: novel therapeutic compound against emerging pathogens. Antimic Agents Chemother. 1999;43:1–41.10.1128/AAC.43.1.1Search in Google Scholar PubMed PubMed Central
[4] Spiewak R. Patch tests with popular topical antifungal drugs in eczema patients. Int Rev Allergol Clin Immunol. 2000;6:136–8.Search in Google Scholar
[5] Konakbayeva D, Karlsson AJ. Strategies and opportunities for engineering antifungal peptides for therapeutic applications. Curr Opin Biotechnol. 2023;81:E102926.10.1016/j.copbio.2023.102926Search in Google Scholar PubMed PubMed Central
[6] Thesen R. Croconazol, ein neues antimykotikum. Pharm Ztg. 1995;30:1120–1.Search in Google Scholar
[7] Fromtling RA. Overview of medically important antifungal azole derivatives. Clin Microbiol Rev. 1988;1:187–217.10.1128/CMR.1.2.187Search in Google Scholar PubMed PubMed Central
[8] Ogata M, Matsumoto H, Hamada Y, Takehara M, Tawara K. 1-[1-[2-[(3-chlorobenzyl) oxy] phenyl] vinyl]-1H-imidazole hydrochloride, a new potent antifungal agent. J Med Chem. 1983;26:768–70.10.1021/jm00359a026Search in Google Scholar PubMed
[9] Scherr N, Roltgen K, Witschel M, Pluschke G. Screening of antifungal azole drugs and agrochemicals with an adapted alamarblue-based assay demonstrates antibacterial activity of croconazole against Mycobacterium ulcerans. Antimic Agents Chemother. 2012;56:6410–3.10.1128/AAC.01383-12Search in Google Scholar PubMed PubMed Central
[10] Meinicke K, Michel G. Croconazole: A new broad spectrum agent in the treatment of fungal skin infections. Int J Clin Pharmacol Res. 1994;14:139–48.Search in Google Scholar
[11] El-Badry M, Fetih G, Shakeel F. Comparative topical delivery of antifungal drug croconazole using liposome and microemulsion-based gel formulations. Drug Deliv. 2014;21:34–43.10.3109/10717544.2013.843610Search in Google Scholar PubMed
[12] Saitoh I, Ikeda K, Kido S, Doi Y, Egawa S. Pharmaceutical preparation for Tinea pedis. US4935241A. 1990. Accessed on May 13, 2024.Search in Google Scholar
[13] Akhtar MJ, Khan S, Roy IM, Jafri IA. High performance liquid chromatographic determination of phenoxetol, methyl paraben, ethyl paraben, n-propyl paraben, iso-butyl paraben, n-butyl paraben and croconazole. HCl. J Pharm Biomed Anal. 1996;14:1609–13.10.1016/0731-7085(96)01777-3Search in Google Scholar PubMed
[14] Alam P, Shakeel F, Iqbal M, Foudah AI, Alqarni MH, Aljarba TM, et al. Quantification of pomalidomide using conventional and eco-friendly stability-indicating HPTLC assays: A contrast of validation parameters. ACS Omega. 2023;8:30655–64.10.1021/acsomega.3c04382Search in Google Scholar PubMed PubMed Central
[15] Alqarni MH, Shakeel F, Alshehri S, Foudah AI, Aljarba TM, Bar FMA, et al. Simultaneous estimation of ibuprofen, caffeine, and paracetamol in commercial products using a green reverse-phase HPTLC method. Green Proc Synth. 2024;13:E20230220.10.1515/gps-2023-0220Search in Google Scholar
[16] Alam P, Shakeel F, Alshehri S, Iqbal M, Foudah AI, Aljarba TM, et al. Simultaneous estimation of lesinurad and allopurinol in the new FDA-approved products using a greener normal-phase HPTLC method: Greenness assessment using the NEMI, analytical eco-score, ChlorTox, and AGREE methods. ACS Sustain Eng Chem. 2024;12:1526–35.10.1021/acssuschemeng.3c06229Search in Google Scholar
[17] Alam P, Shakeel F, Alshehri S, Iqbal M, Foudah AI, Aljarba TM, et al. Simultaneous determination of lesinurad and febuxostat in commercial fixed-dose combinations using a greener normal-phase HPTLC method. Green Proc Synth. 2024;13:E20230264.10.1515/gps-2023-0264Search in Google Scholar
[18] Galuszka A, Migaszewski Z, Namiesnik J. The 12 principles of green analytical chemistry and the significance mnemonic of green analytical practices. Trends Anal Chem. 2013;50:78–84.10.1016/j.trac.2013.04.010Search in Google Scholar
[19] Abdelrahman MM, Abdelwahab NS, Hegazy MA, Fares MY, El-Sayed GM. Determination of the abused intravenously administered madness drops (tropicamide) by liquid chromatography in rat plasma; an application to pharmacokinetic study and greenness profile assessment. Microchem J. 2020;159:E105582.10.1016/j.microc.2020.105582Search in Google Scholar
[20] Alam P, Salem-Bekhit MM, Al-Joufi FA, Alqarni MH, Shakeel F. Quantitative analysis of cabozantinib in pharmaceutical dosage forms using green RP-HPTLC and green NP-HPTLC methods: A comparative evaluation. Sus Chem Pharm. 2021;21:E100413.10.1016/j.scp.2021.100413Search in Google Scholar
[21] Foudah AI, Shakeel F, Alqarni MH, Alam P. A rapid and sensitive stability-indicating green RP-HPTLC method for the quantitation of flibanserin compared to green NP-HPTLC method: Validation studies and greenness assessment. Microchem J. 2021;164:E105960.10.1016/j.microc.2021.105960Search in Google Scholar
[22] Keith LH, Brass HJ, Sullivan DJ, Boiani JA, Alben KT. An introduction to the national environmental methods index. Env Sci Technol. 2005;39:173A–6.10.1021/es053241lSearch in Google Scholar PubMed
[23] Gaber Y, Tornvall U, Kumar MA, Ali Amin M, Hatti-Kaul R. HPLC-EAT (Environmental Assessment Tool): A tool for profiling safety, health and environmental impacts of liquid chromatography methods. Green Chem. 2011;13:2021–5.10.1039/c0gc00667jSearch in Google Scholar
[24] Hartman R, Helmy R, Al-Sayah M, Welch CJ. Analytical method volume intensity (AMVI): A green chemistry metric for HPLC methodology in the pharmaceutical industry. Green Chem. 2011;13:934–9.10.1039/c0gc00524jSearch in Google Scholar
[25] Galuszka A, Konieczka P, Migaszewski ZM, Namiesnik J. Analytical eco-scale for assessing the greenness of analytical procedures. Trends Anal Chem. 2012;37:61–72.10.1016/j.trac.2012.03.013Search in Google Scholar
[26] Plotka-Wasylka J. A new tool for the evaluation of the analytical procedure: Green analytical procedure index. Talanta. 2018;181:204–9.10.1016/j.talanta.2018.01.013Search in Google Scholar PubMed
[27] Hicks MB, Farrell W, Aurigemma C, Lehmann L, Weisel L, Nadeau K, et al. Making the move towards modernized greener separations: introduction of the analytical method GREEnness score (AMGS) calculator. Green Chem. 2019;21:1816–26.10.1039/C8GC03875ASearch in Google Scholar
[28] Nowak PM, Koscielniak P. What color is your method? Adaptation of the RGB additive color model to analytical method evaluation. Anal Chem. 2019;91:10343–52.10.1021/acs.analchem.9b01872Search in Google Scholar PubMed
[29] Nowak PM, Wietecha-Posluszny R, Plotka-Wasylka J, Tobiszewski M. How to evaluate methods used in chemical laboratories in terms of the total chemical risk? a ChlorTox Scale. Green Anal Chem. 2023;5:E100056.10.1016/j.greeac.2023.100056Search in Google Scholar
[30] Pena-Pereira F, Wojnowski W, Tobiszewski M. AGREE-Analytical GREEnness metric approach and software. Anal Chem. 2020;92:10076–82.10.1021/acs.analchem.0c01887Search in Google Scholar PubMed PubMed Central
[31] International Conference on Harmonization (ICH), Q2 (R2). Guideline on validation of analytical procedures–text and methodology, Geneva, Switzerland; 2023.Search in Google Scholar
[32] Alam P, Shakeel F, Ali A, Alqarni MH, Foudah AI, Aljarba TM, et al. Simultaneous determination of caffeine and paracetamol in commercial formulations using greener normal-phase and reversed-phase HPTLC methods: a contrast of validation parameters. Molecules. 2022;27:E405.10.3390/molecules27020405Search in Google Scholar PubMed PubMed Central
[33] Haq N, Alshehri S, Alsarra IA, Alenazi M, Alwhaibi A, Shakeel F. Environmentally friendly stability-indicating HPLC method for the determination of isotretinoin in commercial products and solubility samples. Heliyon. 2023;9:E18405.10.1016/j.heliyon.2023.e18405Search in Google Scholar PubMed PubMed Central
[34] Patel RB, Patel MR, Patel NM. Box–Behnken experimental design aided optimization of stability indicating HPTLC-based assay method: Application in pharmaceutical dosage form containing model drugs-roxithromycin and ambroxol hydrochloride. Anal Chem Lett. 2019;9:816–34.10.1080/22297928.2019.1700158Search in Google Scholar
[35] Patel RB, Patel MR, Patni NR, Agrawal V. Efinaconazole: DoE supported development and validation of quantitative HPTLC method and its application for assay of drug in solution, and microemulsion based formulations. Anal Methods. 2020;12:1380–8.10.1039/C9AY02599ESearch in Google Scholar
[36] Patel RB, Patel MR. A novel validated stability-indicating analytical HPTLC method for quantitation of hydrochlorothiazide and lisinopril in tablet formulation. Indian Drugs. 2022;59:47–51.10.53879/id.59.06.11791Search in Google Scholar
[37] Cue BW, Zhang J. Green process chemistry in the pharmaceutical industry. Green Chem Lett Rev. 2009;2:193–211.10.1080/17518250903258150Search in Google Scholar
[38] Prat D, Wells A, Hayler J, Sneddon H, McElroy CB, Abou-Snehada S, et al. CHEM21 selection guide of classical- and less-classical solvents. Green Chem. 2016;18:288–96.10.1039/C5GC01008JSearch in Google Scholar
[39] Youssef RM, Khamis EF, El-Sayed MA, Abdel Moneim MM. Development and validation of a high-performance thin-layer chromatographic method for the assay of ternary mixtures containing cetirizine dihydrochloride in pharmaceutical dosage forms. J Plan Chromatogr. 2014;27:58–65.10.1556/JPC.27.2014.1.11Search in Google Scholar
[40] Shakeel F, Alam P, Alqarni MH, Iqbal M, Anwer MK, Alshehri S. A greener RP-HPTLC-densitometry method for the quantification of apremilast in nanoformulations and commercial tablets: Greenness assessment by analytical eco-scale, ChlorTox, and AGREE methods. Arab J Chem. 2024;17:E105571.10.1016/j.arabjc.2023.105571Search in Google Scholar
[41] Alam P, Shakeel F, Alshehri S, Alhaiti A, Alqarni MH, Foudah AI, et al. Analysis of the greenness to determine risperidone in commercial products using a green stability-indicating HPTLC method. Arab J Chem. 2024;17:E105693.10.1016/j.arabjc.2024.105693Search in Google Scholar
© 2024 the author(s), published by De Gruyter
This work is licensed under the Creative Commons Attribution 4.0 International License.
Articles in the same Issue
- Research Articles
- Green polymer electrolyte and activated charcoal-based supercapacitor for energy harvesting application: Electrochemical characteristics
- Research on the adsorption of Co2+ ions using halloysite clay and the ability to recover them by electrodeposition method
- Simultaneous estimation of ibuprofen, caffeine, and paracetamol in commercial products using a green reverse-phase HPTLC method
- Isolation, screening and optimization of alkaliphilic cellulolytic fungi for production of cellulase
- Functionalized gold nanoparticles coated with bacterial alginate and their antibacterial and anticancer activities
- Comparative analysis of bio-based amino acid surfactants obtained via Diels–Alder reaction of cyclic anhydrides
- Biosynthesis of silver nanoparticles on yellow phosphorus slag and its application in organic coatings
- Exploring antioxidant potential and phenolic compound extraction from Vitis vinifera L. using ultrasound-assisted extraction
- Manganese and copper-coated nickel oxide nanoparticles synthesized from Carica papaya leaf extract induce antimicrobial activity and breast cancer cell death by triggering mitochondrial caspases and p53
- Insight into heating method and Mozafari method as green processing techniques for the synthesis of micro- and nano-drug carriers
- Silicotungstic acid supported on Bi-based MOF-derived metal oxide for photodegradation of organic dyes
- Synthesis and characterization of capsaicin nanoparticles: An attempt to enhance its bioavailability and pharmacological actions
- Synthesis of Lawsonia inermis-encased silver–copper bimetallic nanoparticles with antioxidant, antibacterial, and cytotoxic activity
- Facile, polyherbal drug-mediated green synthesis of CuO nanoparticles and their potent biological applications
- Zinc oxide-manganese oxide/carboxymethyl cellulose-folic acid-sesamol hybrid nanomaterials: A molecularly targeted strategy for advanced triple-negative breast cancer therapy
- Exploring the antimicrobial potential of biogenically synthesized graphene oxide nanoparticles against targeted bacterial and fungal pathogens
- Biofabrication of silver nanoparticles using Uncaria tomentosa L.: Insight into characterization, antibacterial activities combined with antibiotics, and effect on Triticum aestivum germination
- Membrane distillation of synthetic urine for use in space structural habitat systems
- Investigation on mechanical properties of the green synthesis bamboo fiber/eggshell/coconut shell powder-based hybrid biocomposites under NaOH conditions
- Green synthesis of magnesium oxide nanoparticles using endophytic fungal strain to improve the growth, metabolic activities, yield traits, and phenolic compounds content of Nigella sativa L.
- Estimation of greenhouse gas emissions from rice and annual upland crops in Red River Delta of Vietnam using the denitrification–decomposition model
- Synthesis of humic acid with the obtaining of potassium humate based on coal waste from the Lenger deposit, Kazakhstan
- Ascorbic acid-mediated selenium nanoparticles as potential antihyperuricemic, antioxidant, anticoagulant, and thrombolytic agents
- Green synthesis of silver nanoparticles using Illicium verum extract: Optimization and characterization for biomedical applications
- Antibacterial and dynamical behaviour of silicon nanoparticles influenced sustainable waste flax fibre-reinforced epoxy composite for biomedical application
- Optimising coagulation/flocculation using response surface methodology and application of floc in biofertilisation
- Green synthesis and multifaceted characterization of iron oxide nanoparticles derived from Senna bicapsularis for enhanced in vitro and in vivo biological investigation
- Potent antibacterial nanocomposites from okra mucilage/chitosan/silver nanoparticles for multidrug-resistant Salmonella Typhimurium eradication
- Trachyspermum copticum aqueous seed extract-derived silver nanoparticles: Exploration of their structural characterization and comparative antibacterial performance against gram-positive and gram-negative bacteria
- Microwave-assisted ultrafine silver nanoparticle synthesis using Mitragyna speciosa for antimalarial applications
- Green synthesis and characterisation of spherical structure Ag/Fe2O3/TiO2 nanocomposite using acacia in the presence of neem and tulsi oils
- Green quantitative methods for linagliptin and empagliflozin in dosage forms
- Enhancement efficacy of omeprazole by conjugation with silver nanoparticles as a urease inhibitor
- Residual, sequential extraction, and ecological risk assessment of some metals in ash from municipal solid waste incineration, Vietnam
- Green synthesis of ZnO nanoparticles using the mangosteen (Garcinia mangostana L.) leaf extract: Comparative preliminary in vitro antibacterial study
- Simultaneous determination of lesinurad and febuxostat in commercial fixed-dose combinations using a greener normal-phase HPTLC method
- A greener RP-HPLC method for quaternary estimation of caffeine, paracetamol, levocetirizine, and phenylephrine acquiring AQbD with stability studies
- Optimization of biomass durian peel as a heterogeneous catalyst in biodiesel production using microwave irradiation
- Thermal treatment impact on the evolution of active phases in layered double hydroxide-based ZnCr photocatalysts: Photodegradation and antibacterial performance
- Preparation of silymarin-loaded zein polysaccharide core–shell nanostructures and evaluation of their biological potentials
- Preparation and characterization of composite-modified PA6 fiber for spectral heating and heat storage applications
- Preparation and electrocatalytic oxygen evolution of bimetallic phosphates (NiFe)2P/NF
- Rod-shaped Mo(vi) trichalcogenide–Mo(vi) oxide decorated on poly(1-H pyrrole) as a promising nanocomposite photoelectrode for green hydrogen generation from sewage water with high efficiency
- Green synthesis and studies on citrus medica leaf extract-mediated Au–ZnO nanocomposites: A sustainable approach for efficient photocatalytic degradation of rhodamine B dye in aqueous media
- Cellulosic materials for the removal of ciprofloxacin from aqueous environments
- The analytical assessment of metal contamination in industrial soils of Saudi Arabia using the inductively coupled plasma technology
- The effect of modified oily sludge on the slurry ability and combustion performance of coal water slurry
- Eggshell waste transformation to calcium chloride anhydride as food-grade additive and eggshell membranes as enzyme immobilization carrier
- Synthesis of EPAN and applications in the encapsulation of potassium humate
- Biosynthesis and characterization of silver nanoparticles from Cedrela toona leaf extracts: An exploration into their antibacterial, anticancer, and antioxidant potential
- Enhancing mechanical and rheological properties of HDPE films through annealing for eco-friendly agricultural applications
- Immobilisation of catalase purified from mushroom (Hydnum repandum) onto glutaraldehyde-activated chitosan and characterisation: Its application for the removal of hydrogen peroxide from artificial wastewater
- Sodium titanium oxide/zinc oxide (STO/ZnO) photocomposites for efficient dye degradation applications
- Effect of ex situ, eco-friendly ZnONPs incorporating green synthesised Moringa oleifera leaf extract in enhancing biochemical and molecular aspects of Vicia faba L. under salt stress
- Biosynthesis and characterization of selenium and silver nanoparticles using Trichoderma viride filtrate and their impact on Culex pipiens
- Photocatalytic degradation of organic dyes and biological potentials of biogenic zinc oxide nanoparticles synthesized using the polar extract of Cyperus scariosus R.Br. (Cyperaceae)
- Assessment of antiproliferative activity of green-synthesized nickel oxide nanoparticles against glioblastoma cells using Terminalia chebula
- Chlorine-free synthesis of phosphinic derivatives by change in the P-function
- Anticancer, antioxidant, and antimicrobial activities of nanoemulsions based on water-in-olive oil and loaded on biogenic silver nanoparticles
- Study and mechanism of formation of phosphorus production waste in Kazakhstan
- Synthesis and stabilization of anatase form of biomimetic TiO2 nanoparticles for enhancing anti-tumor potential
- Microwave-supported one-pot reaction for the synthesis of 5-alkyl/arylidene-2-(morpholin/thiomorpholin-4-yl)-1,3-thiazol-4(5H)-one derivatives over MgO solid base
- Screening the phytochemicals in Perilla leaves and phytosynthesis of bioactive silver nanoparticles for potential antioxidant and wound-healing application
- Graphene oxide/chitosan/manganese/folic acid-brucine functionalized nanocomposites show anticancer activity against liver cancer cells
- Nature of serpentinite interactions with low-concentration sulfuric acid solutions
- Multi-objective statistical optimisation utilising response surface methodology to predict engine performance using biofuels from waste plastic oil in CRDi engines
- Microwave-assisted extraction of acetosolv lignin from sugarcane bagasse and electrospinning of lignin/PEO nanofibres for carbon fibre production
- Biosynthesis, characterization, and investigation of cytotoxic activities of selenium nanoparticles utilizing Limosilactobacillus fermentum
- Highly photocatalytic materials based on the decoration of poly(O-chloroaniline) with molybdenum trichalcogenide oxide for green hydrogen generation from Red Sea water
- Highly efficient oil–water separation using superhydrophobic cellulose aerogels derived from corn straw
- Beta-cyclodextrin–Phyllanthus emblica emulsion for zinc oxide nanoparticles: Characteristics and photocatalysis
- Assessment of antimicrobial activity and methyl orange dye removal by Klebsiella pneumoniae-mediated silver nanoparticles
- Influential eradication of resistant Salmonella Typhimurium using bioactive nanocomposites from chitosan and radish seed-synthesized nanoselenium
- Antimicrobial activities and neuroprotective potential for Alzheimer’s disease of pure, Mn, Co, and Al-doped ZnO ultra-small nanoparticles
- Green synthesis of silver nanoparticles from Bauhinia variegata and their biological applications
- Synthesis and optimization of long-chain fatty acids via the oxidation of long-chain fatty alcohols
- Eminent Red Sea water hydrogen generation via a Pb(ii)-iodide/poly(1H-pyrrole) nanocomposite photocathode
- Green synthesis and effective genistein production by fungal β-glucosidase immobilized on Al2O3 nanocrystals synthesized in Cajanus cajan L. (Millsp.) leaf extracts
- Green stability-indicating RP-HPTLC technique for determining croconazole hydrochloride
- Green synthesis of La2O3–LaPO4 nanocomposites using Charybdis natator for DNA binding, cytotoxic, catalytic, and luminescence applications
- Eco-friendly drugs induce cellular changes in colistin-resistant bacteria
- Tangerine fruit peel extract mediated biogenic synthesized silver nanoparticles and their potential antimicrobial, antioxidant, and cytotoxic assessments
- Green synthesis on performance characteristics of a direct injection diesel engine using sandbox seed oil
- A highly sensitive β-AKBA-Ag-based fluorescent “turn off” chemosensor for rapid detection of abamectin in tomatoes
- Green synthesis and physical characterization of zinc oxide nanoparticles (ZnO NPs) derived from the methanol extract of Euphorbia dracunculoides Lam. (Euphorbiaceae) with enhanced biosafe applications
- Detection of morphine and data processing using surface plasmon resonance imaging sensor
- Effects of nanoparticles on the anaerobic digestion properties of sulfamethoxazole-containing chicken manure and analysis of bio-enzymes
- Bromic acid-thiourea synergistic leaching of sulfide gold ore
- Green chemistry approach to synthesize titanium dioxide nanoparticles using Fagonia Cretica extract, novel strategy for developing antimicrobial and antidiabetic therapies
- Green synthesis and effective utilization of biogenic Al2O3-nanocoupled fungal lipase in the resolution of active homochiral 2-octanol and its immobilization via aluminium oxide nanoparticles
- Eco-friendly RP-HPLC approach for simultaneously estimating the promising combination of pentoxifylline and simvastatin in therapeutic potential for breast cancer: Appraisal of greenness, whiteness, and Box–Behnken design
- Use of a humidity adsorbent derived from cockleshell waste in Thai fried fish crackers (Keropok)
- One-pot green synthesis, biological evaluation, and in silico study of pyrazole derivatives obtained from chalcones
- Bio-sorption of methylene blue and production of biofuel by brown alga Cystoseira sp. collected from Neom region, Kingdom of Saudi Arabia
- Synthesis of motexafin gadolinium: A promising radiosensitizer and imaging agent for cancer therapy
- The impact of varying sizes of silver nanoparticles on the induction of cellular damage in Klebsiella pneumoniae involving diverse mechanisms
- Microwave-assisted green synthesis, characterization, and in vitro antibacterial activity of NiO nanoparticles obtained from lemon peel extract
- Rhus microphylla-mediated biosynthesis of copper oxide nanoparticles for enhanced antibacterial and antibiofilm efficacy
- Harnessing trichalcogenide–molybdenum(vi) sulfide and molybdenum(vi) oxide within poly(1-amino-2-mercaptobenzene) frameworks as a photocathode for sustainable green hydrogen production from seawater without sacrificial agents
- Magnetically recyclable Fe3O4@SiO2 supported phosphonium ionic liquids for efficient and sustainable transformation of CO2 into oxazolidinones
- A comparative study of Fagonia arabica fabricated silver sulfide nanoparticles (Ag2S) and silver nanoparticles (AgNPs) with distinct antimicrobial, anticancer, and antioxidant properties
- Visible light photocatalytic degradation and biological activities of Aegle marmelos-mediated cerium oxide nanoparticles
- Physical intrinsic characteristics of spheroidal particles in coal gasification fine slag
- Exploring the effect of tea dust magnetic biochar on agricultural crops grown in polycyclic aromatic hydrocarbon contaminated soil
- Crosslinked chitosan-modified ultrafiltration membranes for efficient surface water treatment and enhanced anti-fouling performances
- Study on adsorption characteristics of biochars and their modified biochars for removal of organic dyes from aqueous solution
- Zein polymer nanocarrier for Ocimum basilicum var. purpurascens extract: Potential biomedical use
- Green synthesis, characterization, and in vitro and in vivo biological screening of iron oxide nanoparticles (Fe3O4) generated with hydroalcoholic extract of aerial parts of Euphorbia milii
- Novel microwave-based green approach for the synthesis of dual-loaded cyclodextrin nanosponges: Characterization, pharmacodynamics, and pharmacokinetics evaluation
- Bi2O3–BiOCl/poly-m-methyl aniline nanocomposite thin film for broad-spectrum light-sensing
- Green synthesis and characterization of CuO/ZnO nanocomposite using Musa acuminata leaf extract for cytotoxic studies on colorectal cancer cells (HCC2998)
- Review Articles
- Materials-based drug delivery approaches: Recent advances and future perspectives
- A review of thermal treatment for bamboo and its composites
- An overview of the role of nanoherbicides in tackling challenges of weed management in wheat: A novel approach
- An updated review on carbon nanomaterials: Types, synthesis, functionalization and applications, degradation and toxicity
- Special Issue: Emerging green nanomaterials for sustainable waste management and biomedical applications
- Green synthesis of silver nanoparticles using mature-pseudostem extracts of Alpinia nigra and their bioactivities
- Special Issue: New insights into nanopythotechnology: current trends and future prospects
- Green synthesis of FeO nanoparticles from coffee and its application for antibacterial, antifungal, and anti-oxidation activity
- Dye degradation activity of biogenically synthesized Cu/Fe/Ag trimetallic nanoparticles
- Special Issue: Composites and green composites
- Recent trends and advancements in the utilization of green composites and polymeric nanocarriers for enhancing food quality and sustainable processing
- Retraction
- Retraction of “Biosynthesis and characterization of silver nanoparticles from Cedrela toona leaf extracts: An exploration into their antibacterial, anticancer, and antioxidant potential”
- Retraction of “Photocatalytic degradation of organic dyes and biological potentials of biogenic zinc oxide nanoparticles synthesized using the polar extract of Cyperus scariosus R.Br. (Cyperaceae)”
- Retraction to “Green synthesis on performance characteristics of a direct injection diesel engine using sandbox seed oil”