Study on the photoelectrocatalytic activity of reduced TiO2 nanotube films for removal of methyl orange
-
Mai Thi Thanh Thuy


Abstract
The reduced TiO2 film on which a photoelectrocatalytic (PEC) process had occurred was created from TiO2 nanotube film electrodes by the electrochemical reduction method. The obtained samples’ structure and morphology were characterized using UV-Vis diffuse reflectance spectroscopy, scanning electron microscopy, high-resolution transmission electron microscopy, photoluminescence, and X-ray diffraction. Cyclic voltammetry, linear sweep voltammetry, electrochemical impedance spectroscopy, chronoamperometry, UV-Vis absorbance spectroscopy, and Mott–Schottky plots were employed to examine the electrochemical and photoelectrochemical activities of the prepared electrodes. The results showed that the optimal conditions of cathodic polarization were a potential of −1.4 V for 60 min. The reduced TiO2 nanotube film electrode had better photoelectrochemical activities than pristine TiO2 under UV light due to the higher photocurrent density (13.7 mA‧cm−2) at 1.5 V (vs Ag/AgCl, sat. KCl reference electrode) compared to pristine TiO2 achieving 7.3 mA‧cm−2, indicating more effective charge separation and transport. The degradation of methyl orange (MO) on pristine TiO2 and reduced TiO2 electrodes was carried out in electrocatalytic (EC) and PEC conditions. The PEC process on the reduced TiO2 electrode had the highest MO processing efficiency (98.4%), and the EC process for MO removal on reduced TiO2 had higher efficiency (95.1%) than the PEC process on pristine TiO2 (89.2%).
1 Introduction
In recent years, TiO2-based photoelectrochemical catalyst materials have been attracting the attention of many scientists all over the world because of their great potential in many fields such as solar cells, environmental treatment, solar water splitting, etc. [1,2,3]. TiO2 is a wide band-gap semiconductor (3.0–3.2 eV) so it only works well in the UV domain that has less than 5% of the solar light [4]. Besides, the easy recombination of photogenerated charge carriers or photogenerated electron–hole (e––h+) pairs has significantly reduced the photocatalytic activity of TiO2. There are many methods to improve materials such as doping with transitional metal oxides like V2O5, SnO2, ZnO, WO3, SiO2, etc. [5,6,7], transitional metals like V, Cu, Ni, and Zn, or precious metals like Rh, Ru, Ir, Pt, Au, etc. [8,9]. Many studies showed that nonmetal-doped TiO2, such as N, P, S, C, and F [10,11,12], narrowed the band-gap energy of TiO2 and enhanced photocatalytic activities in visible light. Similar to increasing solar harvesting, a number of TiO2 composites were investigated like Sn3O4/TiO2, Bi/CdS/TiO2, ZnS/TiO2, In2S3/TiO2, Bi2S3/BiOBr/TiO2, Bi2WO6/TiO2, and TiO2/Ti3C2 [13,14,15,16,17,18,19]. However, dopants create donor or acceptor states inside the TiO2 band gap, leading to crystal instability and an increase in charge carrier trapping [20]. Reductive doping, often known as self-doping, is a recent approach to overcome these disadvantages. This reduction can be performed by two methods: (i) thermal hydrogenation and (ii) electrochemical reduction that changes the intrinsic defect concentration of TiO2. In thermal hydrogenation, TiO2 is heated in a hydrogen (H2) atmosphere at high temperatures, and the reductive agent is a hydrogen atom. Also, they get inserted into the TiO2 lattice as mobile donor sites. But, this process takes place at high temperatures and requires complicated equipment [21]. In contrast, electrochemical reduction has a different mechanism. According to previous research [22], the reaction mechanism on the surface of TiO2 in electrolyte solution occurs as shown in Eq. 1:
where the electrons are transferred from the cathode, and the protons from the electrolyte are adsorbed and interleaved into the TiO2 surface concurrently. The most important factor in the reduced process is the suitable voltage to avoid excessive hydrogen evolution, leading to interface fracturing [23]. The advantages of this method are that it does not require excessive heat treatment and the equipment is simple. This reductive doping causes the variation in the intrinsic defect concentrations in the semiconductor by creating oxygen vacancies and Ti3+, which can significantly improve the photoelectrochemical characteristics [24]. As shallow donors, oxygen vacancies and Ti3+ play an important role in the electronic properties of TiO2, and the separation of charge carriers improves the charge transport behavior and light absorption. In fact, by reductive doping, the semiconductor behavior of TiO2 could be converted to almost semimetallic behavior.
One of the most widely used synthetic dyes is an azo dye, which has one or more azo bonds (–N═N–). Azo dyes typically cause significant pollution in wastewater released by the textile and dyeing industries, which not only potentially endanger humans and marine life but also seriously harm the biological environment [25]. Among azo dyes, owing to their complex structure and stability, it is difficult to remove and degrade MO because of high water solubility and low biodegradability [26]. To remove azo dyes from wastewater, a number of methods have been developed over the past few decades, including adsorption, biological treatment, photocatalysis, and electrocatalytic (EC) oxidation [27]. Among them, the EC oxidation method has many significant advantages due to its benefits of easy operation, affordability, environmental compatibility, high degradation efficiency, and no secondary pollution generation [28,29]. Recently, much attention has been paid to the EC degradation of MO with anodes based on TiO2 [30,31]. The photoelectrocatalytic (PEC) method, in which an external potential bias combined with light irradiation effectively separates charge pairs into a cathode and an anode, is an ideal method for achieving various photochemical conversions such as the degradation of aqueous pollutants. By applying positive voltage bias to the photoanode, photoelectrocatalysis can further enhance the photocatalytic activity by preventing carrier charge recombination and extending the lifetime of photogenerated active holes [32,33]. A previous study has proved that mesoporous TiO2 films and V-TiO2 film electrodes can remove more than 90% MO in 2 h under UV light by the PEC method [34]. PEC degradation of MO on porous TiO2 film electrodes was higher than that on smooth TiO2 films. The removal efficiency of MO on porous TiO2 films and smooth TiO2 films could be achieved at 95.2% and 79.9% after 50 min, respectively. EC degradation of these two film electrodes almost had no effect on MO [35].
There have been a number of studies on modifying TiO2 by electrochemical reduction [36,37], but there is still a lack of studies investigating PEC and EC degradation of MO on reduced TiO2 nanotube electrodes. Hence, this research focuses on enhancing the electrochemical and photoelectrochemical activities by electrochemical cathodic polarization, and various methods such as UV-Vis diffuse reflectance spectroscopy (DRS), scanning electron microscopy (SEM), high-resolution transmission electron microscopy (HRTEM), photoluminescence (PL) spectroscopy, and X-ray diffraction (XRD). Cyclic voltammetry (CV), linear sweep voltammetry (LSV), electrochemical impedance spectroscopy (EIS), chronoamperometry, UV-Vis absorbance spectroscopy, and Mott–Schottky plots were carried out to explain the characteristics of materials and the improvement of the photoelectrochemical properties. Moreover, activity tests toward MO degradation on pristine and reduced TiO2 nanotube electrodes were determined by the PEC method under UV light irradiation and EC methods.
2 Materials and methods
All chemicals used in this work were purchased from Merck (Germany). Titanium foils from China (1 cm × 1 cm × 0.1 mm, 99.7% purity) were first degreased and were then chemically polished in 20% HCl for 10 min. Finally, they were washed with deionized water and then dried at room temperature.
2.1 Synthesis of materials
TiO2 nanotube arrays were prepared as described in our previous research by anodizing titanium foils in a solution consisting of 0.25% NH4F, 5% H2O, and 94.75% ethylene glycol at 40 V for 2 h [38]. After that, the electrode was annealed at 450°C for 1 h to form a pristine TiO2 electrode.
After anodizing, the TiO2 electrode was subjected to cathodic electrochemical polarization in a 1 M Na2SO4 solution at different potentials from −1.2 to −1.6 V and annealed at 450°C for 1 h to obtain a reduced TiO2 electrode.
2.2 Characterization of materials
The diffuse reflectances of the samples were measured using a spectrophotometer (Model UV-2600, Shimadzu, Japan). The morphological structure and the microstructure of samples were observed with SEM images obtained on a FE-SEM Hitachi S-4800 (Japan) and HRTEM images obtained on a JEM-2100 (JEOL) respectively. The crystalline phase of samples was determined by XRD on a D8-ADVANCE (Germany).
The photoelectrochemical properties of TiO2 before and after doping were carried out by CV, LSV, and EIS measurements on an electrochemical workstation system (Zahner Zenium Pro, Zahner-Elektrik, Germany) at ambient temperature. All experiments were carried out in a cell with the three-electrode system, including an Ag/AgCl electrode in saturated KCl solution as a reference electrode, a platinum rod as a counter electrode, and the prepared samples as a working electrode. The response photocurrent densities of the light on–off process with a pulse of 30 s at a voltage of 1.5 V (vs Ag/AgCl, sat. KCl reference electrode) were measured by the potentiostatic technique. All the working electrodes were irradiated with a lamp LS365-1 at a wavelength of 365 nm and an intensity of 100 W‧m−2.
The following equation (Eq. 2) was used to quantify the photoconversion efficiency (PCE) of light energy into chemical energy in the presence of an externally applied potential [39]:
where η is the PCE (%), i p is the photocurrent density (mA‧cm−2), E 0 rev is the standard reversible potential (1.23 V vs RHE), ǀE appǀ is an externally applied potential (vs RHE) of the working electrode at which the photocurrent was measured under illumination, and I o is the power density of the incident light (mW‧cm−2).
The applied potentials versus Ag/AgCl were converted to the RHE scale using the Nernst equation (Eq. 3):
where E 0 Ag/AgCl = 0.1976 V at 25°C.
2.3 Removal of MO
The MO degradation tests were carried out on a three-electrode system, including the counter electrode (platinum plate), working electrode (pristine TiO2 or reduced TiO2 nanotube film electrodes), and reference electrode (Ag/AgCl, sat. KCl). The electrolyte solution contained 50 mg‧L−1 MO and 0.08 M Na2SO4 at pH values varying from 4 to 10. In the EC degradation of MO, the current density applied in each experiment was 3 mA‧cm−2 and the treatment time varied from 5 to 40 min. The volume of the MO solution was 15 mL, and the solution was stirred continuously during experiments. Photoelectrochemical degradation experiments were performed under the same conditions as in the case of electrochemical degradation but under UV light irradiation.
The concentration of MO before and after the degradation was determined using a UV-Vis spectrophotometer (the S80, England) at specific time intervals to confirm the change in the degradation over time. The MO removal efficiency (H) at various times was calculated according to the following equation:
where C 0 is the initial MO concentration and C t is the residual MO concentration after a time (t) of MO treatment.
3 Results and discussion
3.1 Structural and morphological characterization
Figure 1a shows the UV-Vis diffuse reflectance spectra of pristine TiO2 and reduced TiO2 nanotube electrodes in the range of 250–700 nm. Compared to pristine TiO2, the absorption peak of the reduced TiO2 shifted to a longer wavelength ranging from 385 to 405 nm. From the reflectance spectrum data, the band-gap energy can be calculated by the Tauc function (Eq. 5),
where h is Planck’s constant, n is the frequency of vibration, a is the absorption coefficient, E g is the band gap, and A is the proportional constant.

UV-Vis DRS analysis of TiO2 materials: (a) DRS spectra and (b) Tauc plots of their reflectance data.
The band-gap energy estimated from Tauc plots in Figure 1b was about 3.2 eV for pristine and 2.9 eV for reduced TiO2. The results demonstrated that the reductive doping process created oxygen vacancies and Ti3+ and made the band gap narrow, thus, improving the light absorption of TiO2 [36].
The XRD patterns of pristine, reduced TiO2 nanotube electrodes, and reduced TiO2 after six cycles of MO removal by the PEC method are shown in Figure 2. From the XRD patterns, the diffraction peaks located at 2θ of 40.26° and 53° derived from the Ti substrate, and peaks at 25.28°, 37.94°, 48.19°, 54.33°, 55.43°, and 63.18° were attributed to the tetragonal anatase TiO2, indicating that the prepared TiO2 nanotubes exist in the anatase phase [1,36]. Furthermore, there are no clear differences between the XRD patterns of all samples, so implying that the crystalline structure is not affected by the reductive doping process and the degradation process of MO by the PEC method.

XRD patterns of TiO2 materials.
Figure 3 shows the SEM images of pristine, reduced TiO2 nanotube film electrodes, and the reduced TiO2 after six cycles of MO degradation. Observing Figure 3, it is clear that there is no difference between the surface morphologies of all samples, and relatively uniform TiO2 nanotubes were formed with a diameter ranging from about 140 to 150 nm and a wall thickness of about 20 nm. The reason is that all electrodes have the same conditions of anodizing and annealing processes. Moreover, the reductive doping process of TiO2 modified the electronic and defect levels of the material but did not change the surface morphology and the size of the TiO2 nanotubes [37]. After six cycles of MO degradation by the PEC method, the surface morphology of reduced TiO2 nanotubes had not changed significantly. Hence, reduced TiO2 has remarkable stability for the PEC degradation of MO.

SEM images of pristine TiO2 (a and b), reduced TiO2 (c and d), and reduced TiO2 after six cycles of MO degradation (e and f).
Figure 4 shows the microstructure characteristics of the reduced TiO2 sample determined by TEM and HRTEM. The lattice stripes in different directions are observed in Figure 4b, and the lattice spacing, calculated to be d = 0.358 nm, corresponds to the (101) crystal plane of anatase TiO2 [19]. Besides, the lattice spacing of 0.336 nm appears in a region due to the lattice distortion of atom layers at the surface of reduced TiO2. Thus, reductive doping creates oxygen vacancies or Ti3+, which may cause crystal distortion.

TEM images (a) and HR-TEM images (b) of the reduced TiO2 sample.
3.2 Optimal conditions of the cathodic polarization process
3.2.1 Effect of reduction potential
The anodized TiO2 electrodes were prepared by cathodic polarization in 1 M Na2SO4 solution at potentials of −1.2, −1.4, and −1.6 V for 60 min. The reduction potentials particularly affected the electrochemical and photoelectrochemical properties of TiO2 electrodes because the amount of charge passing through the reductive process from which the doping level can be estimated that affected the defect level in the crystal structure of samples. Figure 5 shows CV diagrams of the reduced TiO2 electrode at different potentials without UV and with UV illumination. In the dark, the pristine TiO2 electrode revealed a very low current density (Figure 5a), so TiO2 was almost non-conductive. Meanwhile, the CV curves of reduced TiO2 electrodes have a rectangle shape, which indicates a modest dependence of the current density on the potential. The results improved the semi-metallic behavior of reduced TiO2 electrodes, and the conductivity of reduced TiO2 electrodes increased due to the reduction of Ti4+ to Ti3+ changing the stoichiometry or the intrinsic defect concentration of the semiconductor [37,40]. As seen from Figure 5a, the reduced TiO2 synthesized at −1.2 V shows a lower current density and still slightly maintains semiconducting features because of the low density of the Ti3+ state. The sample synthesized at −1.4 V has the largest current density because of a higher concentration of the Ti3+ state. This indicated that the sample with a high concentration of Ti3+ states had more effective charge separation and transport. Additionally, increasing the cathodic voltage to −1.6 V caused more generation of H2, so the current density was decreased [37]. Furthermore, under UV light (Figure 5b), the anode current density of all samples increased rapidly with anodic polarization. This illustrates that TiO2, an n-type semiconductor, has photoelectrochemical activities. Besides, the photoelectrochemical properties of TiO2 electrodes also depended on the reduction potential during the synthesis process. The results in Figure 5b and Table 1 indicate that the photoelectrochemical activity of the reduced TiO2 samples at −1.2 and −1.4 V is higher than that of unreduced TiO2. Among them, the highest photocurrent (12.3 mA‧cm−2) was obtained at −1.4 V; however, at higher reduced potential (−1.6 V), the photocurrent decreased. This means that at a too-high reducing voltage, the surface of the sample was fractured and dropped due to the strong generation of H2 and the photocurrent density decreased noticeably [23]. Therefore, the optimal reduction potential at the TiO2 electrode was −1.4 V and had the best photoelectrochemical properties.

Influence of the reduction potential on the CV diagrams of reduced TiO2 in 1 M Na2SO4 without UV (a) and with UV illumination (b) compared with pristine TiO2.
Photocurrent densities at a voltage of 1.5 V for the pristine TiO2 electrode and reduced TiO2 electrodes at different potentials (−1.2, −1.4, and −1.6 V)
| TiO2 samples | Reduced potential (V) | i (mA‧cm−2) |
|---|---|---|
| Pristine TiO2 | 7.98 | |
| Reduced TiO2 | −1.2 | 9.75 |
| Reduced TiO2 | −1.4 | 12.30 |
| Reduced TiO2 | −1.6 | 5.20 |
3.2.2 Effect of the reduction time
The photoelectrochemical properties of TiO2 electrodes depend not only on the reduction potential but also on the reduction time in the synthesis process of TiO2 nanotubes. From the obtained results on the effect of the reduction potential on TiO2 properties, the reduction potential was chosen as −1.4 V with a reduction time ranging from 20 to 80 min.
On the CV diagrams of Figure 6a, in the dark, the anode current density is low and fluctuates following the reduced time. However, when UV is irradiated, the photocurrent density increases significantly. Out of the four reducing times, the most favorable one is 60 min because the photocurrent density reached the highest peak at 12.3 mA‧cm−2 (Table 2). Thus, the optimum conditions for cathodic polarization are a potential of −1.4 V within 60 min.

Influence of the reduction time on the CV diagrams of reduced TiO2 in 1 M Na2SO4 without UV (a) and with UV illumination (b).
Photocurrent densities at a voltage of 1.5 V for reduced TiO2 electrodes at −1.4 V with different reduction times
| Reduction time (min) | i (mA‧cm−2) |
|---|---|
| 20 | 8.9 |
| 40 | 10.9 |
| 60 | 12.3 |
| 80 | 11.8 |
3.3 Photoelectrochemical characterization
The LSV of pristine TiO2 and reduced TiO2 in the dark and under UV illumination are shown in Figure 7a and b. It can be observed from Figure 7a that the pristine sample shows negligible dark current density, demonstrating that there was no EC activity in the dark. However, the reduced TiO2 shows higher current density with a peak at −0.024 V due to the oxidation process Ti3+ to Ti4+, which proved that the electrical conductivity of the material was enhanced after cathodic polarization. As shown in Figure 7b, the reduced TiO2 had better photoelectrochemical activities under UV light, with a higher photocurrent density (13.7 mA‧cm−2) at 1.5 V compared with that of pristine TiO2 achieving 7.3 mA‧cm−2, indicating more effective charge separation and transport.

LSV of samples in the dark (a), under UV illumination (b), PCE (c), and chronoamperometry (I–t) plots (d).
The PCE of both samples with UV illumination, shown in Figure 7c, indicates that the PCE of the reduced TiO2 photoanode was higher than that of pristine TiO2, achieving 41.3% at a potential of 0.417 V vs Ag/AgCl. The obtained efficiency was nearly 1.8 times higher than that of pure TiO2 (23.5%). Moreover, Figure 7d shows the photoelectrochemical response current of the samples measured by the static potential method; the potential applied to the working electrode was 1.5 V. There was a noticeable increase or decrease in the response current for samples depending on whether UV illumination was used or not. The response currents were very small in the dark, but they increased considerably under UV light. The results proved that the reduced TiO2 photoanode had a higher photocurrent response (16.1 mA‧cm−2), showing higher photoelectrochemical activity.
To further study the charge separation and recombination of photogenerated electron–hole pairs, PL spectroscopy of samples was carried out. The PL spectra shown in Figure 8 indicate that pristine and reduced TiO2 samples present an emission peak at 450 nm, which can be attributed to the electron trapped at shallowed level defects [41]. The reduced TiO2 electrode exhibited a lower PL intensity, indicating a higher separation efficiency of photogenerated carriers. The PL result is consistent with the aforementioned results.

PL spectra of pristine and reduced TiO2 samples.
EIS diagrams in the Nyquist form have been used to study the electrode–electrolyte interfacial behavior and doping level of pristine TiO2 and reduced TiO2 samples. Figure 9a–c shows the Nyquist plots of pristine TiO2 and reduced TiO2 in the dark and under illumination in 1 M Na2SO4 solution. EIS diagrams were simulated by using Thales software following equivalent electrical circuits (EECs) from Figure 9d, and the values of elements in EECs are given in Table 3. The first EEC with four elements and the second one with six elements are presented for pristine TiO2 and reduced TiO2 electrodes, respectively. This result was the same as the one proposed in the previous literature [37].

Nyquist diagrams including EECs of different TiO2 samples in 1 M Na2SO4: (a) pristine TiO2 without UV illumination, (b) pristine TiO2 with UV illumination, (c) reduced TiO2 with and without UV illumination, (d) the EEC (I) for (a and b) and EEC (II) for (c).
The values of ECC elements for the samples
| Sample | Condition | R s (Ω) | C d (F) | R f (kΩ) | C CPE | R ct (Ω) | W | |
|---|---|---|---|---|---|---|---|---|
| µF | n | σ (kΩ‧s−1/2) | ||||||
| Pristine TiO2 | Dark | 1.577 | — | — | 2.505 | 0.944 | 18.5 | 46.56 |
| UV light | 1.248 | — | — | 7.194 | 0.94 | 2.1 | 17.21 | |
| Reduced TiO2 | Dark | 3.158 | 7 | 17.95 | 8.406 | 0.98 | 0.059 | 28.54 |
| UV light | 1.939 | 116.5 | 7.85 | 21.34 | 0.99 | 0.007 | 0.66 | |
Note: R s, electrolyte resistance; C d and R f, capacitance and resistance of the material film, respectively. On the inside of nanotubes, CPE, constant phase element that has been used to replace the pure capacitor in non-ideality; R ct, charge transfer resistance; W, Warburg diffusion element that relates to the mass transfer and ionic diffusion in nanotubes.
As seen in Table 3, under UV illumination conditions, the charge transfer resistance (R ct) values of pristine TiO2 and reduced TiO2 samples decreased about eight times in comparison with those in the dark. This proved that both samples show n-type semiconducting behavior because under UV light the charge carriers in the valence band get excited to the conduction band, which improves the electrical conductivity of samples. In addition, the R ct of pristine TiO2 was around 300 times higher than that of reduced TiO2 in dark or light conditions. This result was in agreement with the above LSV and chronoamperometry data because the reductive doping process creates more Ti3+ states or forms oxygen vacancy states, which improved charge transfer properties and reduced charge transfer resistance (R ct). A number of studies revealed that by lowering the resistance, electrons are more easily transported to the underlying TiO2, resulting in increased electron injection and improved photoelectrochemical properties of the electrode [42].
The Mott–Schottky measurements were carried out at 1 kHz in 0.5 M Na2SO4 solution to study further their electronic properties. The Mott–Schottky plots of pristine TiO2 and reduced TiO2 electrodes in Figure 10 display a positive slope, demonstrating n-type semiconducting behavior. Obviously, the slope of pristine TiO2 nanotubes is much higher than that of reduced TiO2, which increases the charge carrier density for the reduced TiO2 sample. The carrier density can be calculated by the Mott–Schottky plots using the following equation [43]:
where N D is the carrier density, e is the electron charge (= 1.6 × 10⁻¹⁹ C), ε is the dielectric constant (= 48 for TiO2 anatase), ε 0 is the permittivity of vacuum (= 8.86 × 10⁻¹⁴ F‧cm−1), C is the space charge capacitance, and E is the applied potential. Based on the Mott–Schottky plots and Eq. 6, the carrier densities of pristine TiO2 and reduced TiO2 were determined to be 1.25 × 10²⁰ and 1.7 × 1025 cm−3, respectively. The carrier density of reduced TiO2 was significantly greater than that of pristine TiO2 nanotubes. The results demonstrated that the conductivity of TiO2 nanotubes remarkably increased via reductive doping. As seen in Figure 10, the capacitance of the pristine sample depends strongly on the applied voltage, which is typical for the space-charge layer-controlled capacity of an n-type semiconductor [44], and the flat-band potential of pristine TiO2 can be estimated as −0.253 V. On the other hand, the reduced TiO2 sample showed little capacity dependence on the applied voltage, indicating semimetallic behavior. Because the capacitance of the metal was controlled by the Helmholtz layer at the solid–liquid interface, a flat-band potential of reduced TiO2 cannot be determined [37]. Thus, by the Mott–Schottky measurement, the reductive doping process significantly enhanced the donor density of TiO2, which tends to improve the electrochemical and photoelectrochemical characterization of the material.

The Mott–Schottky plots of pristine and reduced TiO2 electrodes.
3.4 EC and PEC degradation of MO
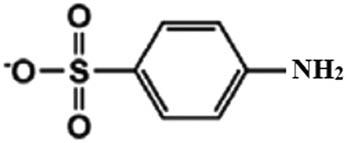
The EC and PEC activities of pristine TiO2 and reduced TiO2 electrodes for MO degradation were measured by the galvanostatic method with a current density of 3 mA‧cm−2, and the treatment time varied from 5 to 40 min. TiO2 is an n-type semiconductor and almost non-conductive; therefore, the EC activity on the pristine TiO2 electrode almost had no effect on MO. However, the reduced TiO2 nanotube film electrode had almost semimetallic behavior, so the electrical conductivity and charge carrier density of reduced TiO2 was much higher than those of pristine TiO2. As a result, the reduced TiO2 electrode can catalyze the EC degradation of MO. From the UV-Vis spectrum of the MO solution, the characteristic peaks of MO can be determined. Figure 11 shows the UV-Vis spectra of the MO solution that revealed two distinct absorption peaks: the peak of the aromatic ring at roughly 270 nm and the peak of the azo chromophores (–N═N–) at about 467 nm [30,45]. The intensity of the two peaks decreased gradually with increasing treatment time, demonstrating that the azo bond was broken and the aromatic rings were slowly destroyed. After 40 min of degradation, the two peaks were very faint, indicating that the majority of the MO and the intermediate organic compounds were degraded and eliminated [30].

UV-Vis spectra of MO solution after different treatment times.
According to previous studies [29,30], the EC degradation of MO on the reduced TiO2 anode (r-TiO2) occurs as follows. First, the hydroxyl radicals (˙OH) were created by direct oxidation of water following Eq. 7 and physically adsorbed on the anode surface. Consequently, it attacks the conjugated structure of the azo bond (–N═N–) and oxidizes MO to intermediates (Eq. 8). After that, the MO reduction intermediates will further oxidize to form aromatic metabolites, which ultimately mineralize into CO2 and water as shown in Eq. 9:
Under UV light, the conductivity of pristine TiO2 and reduced TiO2 significantly increased, and both electrodes had high photoelectrochemical properties due to the fact that the PEC degradation of MO occurred on both electrodes. A possible PEC mechanism for the MO degradation of both anodes is proposed in Figure 12. Similar to photocatalytic activity [46], when TiO2 was exposed to UV light, a photogenerated electron (e−) in the valence band is excited into the conduction band, leaving a positive hole (h+) in the valence band. The holes oxidized water to generate hydroxyl radicals (˙OH) (Eq. 10) on the surface of photoanodes, which interacted with MO following Eqs. 8 and 9:

The degradation mechanism of MO on pristine and reduced TiO2 photoanodes by the PEC method.
Besides, a positive potential is applied to a photoanode under the PEC condition, which creates hydroxyl radicals (˙OH) on the surface of the anode (Eq. 7) similar to the EC condition and transfers the photogenerated electrons to the cathode. The transferred electrons reduce the absorbed oxygen (O2) on the cathode to form superoxide anions (
To demonstrate that the degradation of MO was caused by hydroxyl radicals (˙OH), tert-butanol as a quenching agent was added to the MO solution before treatment by the PEC method. The results are shown in Figure 13, which indicate that the presence of tert-butanol in the MO solution enhanced the residual MO concentration and reduced the decolorization efficiency of the MO solution after different treatment times. The higher the tert-butanol, the lower the decolorization efficiency achieved. This can be explained as follows: the part of the newly produced ˙OH radicals were quenched by tert-butanol following Eq. 15 [29,49]; consequently, the ability to oxidize MO was reduced:

Influence of the tert-butanol concentration on the residual MO concentration (a) and (b) the decolorization efficiency of MO by the PEC method on the reduced TiO2 photoanode.
The intermediates generated during the PEC process of the MO solution were studied by LC-MS analysis. LC-MS chromatograms of the MO solution before and after treatment for 5 and 40 min by the PEC method are shown in Figure 14. The results showed that MO was fragmented into intermediates (Table 4) before being decomposed into CO2 and H2O.

LC-MS chromatograms of MO solution before and after treatment by the PEC method: (a) initial MO solution, (b) MO solution after 5 min treatment, and (c) MO solution after 40 min treatment.
Intermediates of the degradation of MO by the PEC method
| Molecular weight | Structure | Molecular weight | Structure |
|---|---|---|---|
| 304 |

|
139 |

|
| 202 |

|
132 |

|
| 172 |
|
110 |

|
| 166 |

|
94 |

|
MO has a quinoid structure with red color at a low pH value and an azo structure with yellow color at a high pH value [50]. Thus, the effect of solution pH on the degradation of MO was studied. Figure 15 shows that the residual MO concentration decreased, and the decolorization efficiency increased when the pH was increased from 4 to 6. After that, when the pH value increased from 7 to 10, the residual MO concentration increased and the decolorization efficiency decreased sharply. The removal efficiency was very high (95–99%) when the pH value was in the range of 5–7, and a pH of 6 was optimal for the MO treatment by the PEC method. This result was in agreement with previous studies [29,50].

Effect of solution pH on the decolorization efficiency and residual MO concentration after 40 min treatment by the PEC method on reduced TiO2 (initial MO concentration = 50 mg‧L–1).
Figure 16 shows the residual MO concentrations and the decolorization efficiencies of MO solution after different treatment times by different degradation processes, in which the EC process on the reduced TiO2 electrode and the PEC process on both pristine and reduced TiO2 electrodes. As seen in Figure 16, the residual MO concentration significantly decreases and the MO removal efficiency considerably increases with the increase in the treatment time. However, after 30 min of the processing time, the removal efficiency of MO of all samples increase slightly: from 98.4% to 99.5% for PEC on reduced TiO2, from 95.1% to 97.4% for EC on reduced TiO2, and from 89.2% to 91.8% for PEC on pristine TiO2. The PEC process for the degradation of MO on the reduced TiO2 electrode had the highest efficiency, and the EC process for MO removal on reduced TiO2 had higher efficiency than the PC process on pristine TiO2. This can be explained by the synergetic effect of EC and photocatalytic oxidations, and the PEC condition decreasing the charge–carrier recombination. This result is consistent with the results of the above study that, under UV illumination, the reduced TiO2 had the best photoelectrochemical properties.

The residual MO concentration (a) and the decolorization efficiency of MO (b) after different treatment times (initial MO concentration = 50 mg‧L–1 at pH 6).
There is a linear relationship between ln(C 0/C t ) and the treatment time t, as shown in Figure 17, which indicates the EC and PEC processes on reduced TiO2, and the PEC process on pure TiO2 following the pseudo-first-order kinetic reaction [29] described in the following equation:
where C 0 (in mg‧L−1) is the initial MO concentration, C t (in mg‧L−1) is the MO concentration after processing at time t (in min), and k (in min−1) is the first-order rate constant. The rate constant k can be determined from the plot ln(C 0/C t ) vs t; they are 0.1358 min−1 (R 2 = 0.997), 0.0934 min−1 (R 2 = 0.990), and 0.0688 min−1 (R 2 = 0.976) for PEC and EC processes on reduced TiO2 and the PEC process on pure TiO2, respectively. This result demonstrated that the degradation of MO on reduced TiO2 by the PEC process was faster than the EC process and almost two times faster than that on pristine TiO2.

The plots of ln(C 0/C t ) with different MO treatment times.
The comparison of pristine and reduced TiO2 samples with other systems of TiO2 for MO treatment is listed in Table 5. The reduced TiO2 showed outstanding PEC performances and prospective potential in the treatment of MO.
Comparison of MO treatment with other systems of TiO2
| Samples | Preparation methods | Light sources | Treatment method | Efficiency (%) | Ref. |
|---|---|---|---|---|---|
| Sb3+-doped Bi2WO6/TiO2 | Solvothermal method | Solar light | PEC | 77.23 | [18] |
| Bi2WO6-WO3/TiO2 | Hydrothermal method | Solar light | PEC | 75.65 | [51] |
| Ag3PO4/TiO2 | SILAR deposition | Solar light | PEC | 81.4 | [52] |
| CdS/TiO2 | Sonication-assisted | Visible light | PC | 61.4 | [53] |
| SILAR deposition | |||||
| Fe3+-doped TiO2NTs | Water-assisted crystallization method | Visible light | PC | 52 | [54] |
| TiO2/Ti3C2 | Electrostatic self‐assembly method | UV light | PC | 99.6 | [19] |
| Au-TiO2 | Electrodeposition | UV light | PEC | 83 | [55] |
| V-TiO2/ITO | Sol–gel method | Solar light | PEC | 43 | [34] |
| Pristine TiO2 | Anodization method | UV light | PEC | 91.8 | This work |
| Reduced TiO2 | Anodization and electrochemical reduction method | UV light | PEC | 99.5 | This work |
In order to examine the stability of the reduced TiO2 sample, six cycles of the degradation of MO by the PEC method were carried out. The applied current density was 3.0 mA‧cm−2 and the treatment time of one cycle was 40 min. As seen in Figure 18, after 40 min treatment, the removal efficiency of MO varied slightly from 99.5% to 96.8% in six cycling runs, indicating the remarkable stability of reduced TiO2 nanotubes. Moreover, the results of SEM and X-ray of reduced TiO2 after six cycles revealed that the crystal phase and surface morphology of the TiO2 nanotubes had not changed significantly. Therefore, reduced TiO2 possesses excellent stability for PEC degradation of MO.

Cycling runs in the PEC degradation of MO solution on the reduced TiO2 photoanode (initial MO concentration = 50 mg‧L–1 at pH 6).
4 Conclusions
Reduced TiO2 nanotube film electrodes have been synthesized successfully by cathodic polarization under optimal conditions of −1.4 V potential and 60 min. The obtained samples were characterized by using DRS, SEM, XRD, and a variety of electrochemical methods such as CV, LSV, EIS, chronoamperometry, and Mott–Schottky plots. The main results of this study are as follows: (i) the photoelectrochemical properties of reduced TiO2 are higher than those of pristine TiO2 materials due to the creation of more Ti3+ states or oxygen vacancy states, which significantly increased the donor density (from 1.25 × 10²⁰ to 1.7 × 1025 cm−3) and photocurrent density (from 7.3 to 13.7 mA‧cm−2 at 1.5 V vs Ag/AgCl) and (ii) the degradation of MO on pristine TiO2 and reduced TiO2 electrodes was carried out by EC and PEC processes, in which the PEC process on the reduced TiO2 electrode after 30 min had the highest efficiency (98.4%) and the EC process for MO removal on reduced TiO2 had higher efficiency (95.1%) than the PEC process on pristine TiO2 (89.2%). This can be explained by the synergetic effect of EC and photocatalytic oxidations as well as the PEC process decreasing the charge–carrier recombination.
Acknowledgments
The author team would like to thank Vietnam Academy of Science and Technology for assigning the topic and providing financial support to implement it (Grant number: CSCL06.02/22-23).
-
Funding information: This study was funded by the Vietnam Academy of Science and Technology (Grant number: CSCL06.02/22-23).
-
Author contributions: Mai Thi Thanh Thuy: writing – original draft, writing – review and editing, methodology, formal analysis, and project administration; Nguyen Thi Van Anh: writing – original draft, formal analysis, visualization, and resources; Mai Thi Xuan: resources; Tran Quang Vinh: resources; Phan Thi Binh: writing – review and editing, methodology, and formal analysis.
-
Conflict of interest: The authors state no conflict of interest.
-
Data availability statement: All data generated or analyzed during this study are included in this published article.
References
[1] Cho H, Joo H, Kim H, Kim J, Kang K, Yoon J. Improved photoelectrochemical properties of TiO2 nanotubes doped with Er and effects on hydrogen production from water splitting. Chemosphere. 2021;267:129289. 10.1016/j.chemosphere.2020.129289.Search in Google Scholar PubMed
[2] Li R, Li T, Zhou Q. Impact of Titanium Dioxide (TiO2) modification on its application to pollution treatment-A review. Catalysts. 2020;10:804–33. 10.3390/catal10070804.Search in Google Scholar
[3] Preethi LK, Antony RP, Mathews T, Walczak L, Gopinath CS. A study on doped heterojunctions in TiO2 nanotubes: An efficient photocatalyst for solar system. Water Splitting. 2017;7:14314–5. 10.1038/s41598-017-14463-0.Search in Google Scholar PubMed PubMed Central
[4] Yoo I-h, Kalanur SS, Seo H. A nanoscale p–n junction photoelectrode consisting of an NiOx layer on a TiO2/CdS nanorod core-shell structure for highly efficient solar water splitting. Appl Catal B Env. 2019;250:200–12. 10.1016/j.apcatb.2019.02.063.Search in Google Scholar
[5] Alagarasi A, Rajalakshmi PU, Shanthi K, Selvam P. Solar-light driven photocatalytic activity of mesoporous nanocrystalline TiO2, SnO2, and TiO2-SnO2 composites. Mater Today Sustain. 2019;5:100016–8. 10.1016/j.mtsust.2019.100016.Search in Google Scholar
[6] Ali MM, Haque MJ, Kabir MH, Kaiyum MA, Rahman MS. Nano synthesis of ZnO–TiO2 composites by sol-gel method and evaluation of their antibacterial, optical and photocatalytic activities. Results Mater. 2021;11:100199. 10.1016/j.rinma.2021.100199.Search in Google Scholar
[7] Zhang M, Lei E, Zhang R, Liu Z. The effect of SiO2 on TiO2-SiO2 composite film for self-cleaning application. Surf Interfaces. 2019;16:194. 10.1016/j.surfin.2018.10.005.Search in Google Scholar
[8] Pan Y, Wen M. Noble metals enhanced catalytic activity of anatase TiO2 for hydrogen evolution reaction. Int J Hydrogen Energy. 2018;43:22055–63. 10.1016/j.ijhydene.2018.10.093.Search in Google Scholar
[9] Jin C, Dai Y, Wei W, Ma X, Li M, Huang B. Effects of single metal atom (Pt, Pd, Rh and Ru) adsorption on the photocatalytic properties of anatase TiO2. Appl Surf Sci. 2017;426:639–46. 10.1016/j.apsusc.2017.07.065.Search in Google Scholar
[10] Dahl M, Liu Y, Yin Y. Composite titanium dioxide nanomaterials. Chem Rev. 2014;114:9853–89. 10.1021/cr400634p.Search in Google Scholar PubMed
[11] Malini B, Raj GAG. C, N, and S-doped TiO2-characterization and photocatalytic performance for rose bengal dye degradation under daylight. J Env Chem Eng. 2018;6:5763. 10.1016/j.jece.2018.09.002.Search in Google Scholar
[12] Li L, Wu X, Liu S. Fluorinated TiO2 hollow photocatalysts for photocatalytic applications. Acta Phys Chim Sin. 2021;37:2009038. 10.3866/PKU.WHXB202009038.Search in Google Scholar
[13] Wang Q, Zhao Y, Zhang Z, Liao S, Deng Y, Wang X, et al. Hydrothermal preparation of Sn3O4/TiO2 nanotube arrays as effective photocatalysts for boosting photocatalytic dye degradation and hydrogen production. Ceram Int. 2023;49:5977–85. 10.1016/j.ceramint.2022.11.113.Search in Google Scholar
[14] Wang Q, Zhu S, Zhao S, Li C, Wang R, Cao D, et al. Construction of Bi-assisted modified CdS/TiO2 nanotube arrays with ternary S-scheme heterojunction for photocatalytic wastewater treatment and hydrogen production. Fuel. 2022;322:124163. 10.1016/j.fuel.2022.124163.Search in Google Scholar
[15] Wang Q, Wang G, Wang J, Li J, Wang K, Zhou S, et al. In situ hydrothermal synthesis of ZnS/TiO2 nanofibers S-scheme heterojunction for enhanced photocatalytic H2 evolution. Adv Sustain Syst. 2023;7:2200027. 10.1002/adsu.202200027.Search in Google Scholar
[16] Liu Y, Yu F, Wang F, Bai S, He G. Construction of Z-scheme In2S3-TiO2 for CO2 reduction under concentrated natural sunlight. Chin J Struct Chem. 2022;41:2201034–9. 10.14102/j.cnki.0254-5861.2021-0046.Search in Google Scholar
[17] Jia Y, Liu P, Wang Q, Wu Y, Cao D, Qiao Q-A. Construction of Bi2S3-BiOBr nanosheets on TiO2 NTA as the effective photocatalysts: Pollutant removal, photoelectric conversion and hydrogen generation. J Colloid Interface Sci. 2021;585:459–69. 10.1016/j.jcis.2020.10.027.Search in Google Scholar PubMed
[18] Wang Q, Li H, Yu X, Jia Y, Chang Y, Gao S. Morphology regulated Bi2WO6 nanoparticles on TiO2 nanotubes by solvothermal Sb3+ doping as effective photocatalysts for wastewater treatment. Electrochim Acta. 2020;330:135167. 10.1016/j.electacta.2019.135167.Search in Google Scholar
[19] Li H, Sun B, Gao T, Li H, Ren Y, Zhou G. Ti3C2 MXene co‐catalyst assembled with mesoporous TiO2 for boosting photocatalytic activity of methyl orange degradation and hydrogen production. Chin J Catal. 2022;43:461–71. 10.1016/S1872-2067(21)63915-3.Search in Google Scholar
[20] Xing M, Zhang J, Chen F, Tian B. An economic method to prepare vacuum-activated photocatalysts with high photo-activities and photosensitivities. Chem Comm. 2011;47(17):4947–9. 10.1002/anie.201206375.Search in Google Scholar PubMed
[21] Ansari SA, Khan MM, Ansari MO, Cho MH. Nitrogen-doped titanium dioxide (N-doped TiO2) for visible light photocatalysis. N J Chem. 2016;40:3000–10. 10.1039/x0xx00000x.Search in Google Scholar
[22] Liu H, Ma HT, Li XZ, Wu M, Bao XH. The enhancement of TiO2 photocatalytic activity by hydrogen thermal treatment. Chemosphere. 2003;50(1):39–46. 10.1016/S0045-6535(02)00486-1.Search in Google Scholar
[23] Lyon LA, Hupp JT. Energetics of the nanocrystalline titanium dioxide/aqueous solution interface: Approximate conduction band edge variations between Ho = -10 and H- = +26. J Phys Chem B. 1999;103(22):4623–8. 10.1021/jp9908404.Search in Google Scholar
[24] Zuo F, Wang L, Wu T, Zhang Z, Borchardt D, Feng P. Self-doped Ti3+ enhanced photocatalyst for hydrogen production under visible light. J Am Chem Soc. 2010;132(34):11856–7. 10.1021/ja103843d.Search in Google Scholar PubMed
[25] Yan Y, Geng ZQ, Dai K, Guo X, Zhang F. Decoupling mechanism of Acid Orange 7 decolorization and sulfate reduction by a caldanaerobacter dominated extreme-thermophilic consortium. J Hazard Mater. 2021;419:126498–9. 10.1016/j.jhazmat.2021.126498.Search in Google Scholar PubMed
[26] Zou H, Wang Y. Functional collaboration of biofilm-cathode electrode and microbial fuel cell for biodegradation of methyl orange and simultaneous bioelectricity generation. Env Sci Pollut Res. 2019;26(22):23061–9. 10.1007/s11356-019-05617-w.Search in Google Scholar PubMed
[27] Ahmed MB, Zhou JL, Huu Hao N, Guo W, Thomaidis NS, Xu J. Progress in the biological and chemical treatment technologies for emerging contaminant removal from wastewater: a critical review. J Hazard Mater. 2017;323:274–98. 10.1016/j.jhazmat.2016.04.045.Search in Google Scholar PubMed
[28] Choudhary V, Vellingiri K, Thayyil MI, Philip L. Removal of antibiotics from aqueous solutions by electrocatalytic degradation. Env Sci Nano. 2021;8:1133–76. 10.1039/D0EN01276A.Search in Google Scholar
[29] Pham TT, Mai TTT, Phan TB. Removal of methyl orange from aqueous solution by electrochemical process using stainless steel/PbO2-TiO2 stable electrode. Desalin Water Treat. 2022;266:202–11. 10.5004/dwt.2022.28646.Search in Google Scholar
[30] Sun Z, Ni Y, Wu Y, Yue W, Zhang G, Bai J. Electrocatalytic degradation of methyl orange and 4-nitrophenol on a Ti/TiO2-NTA/La-PbO2 electrode: electrode characterization and operating parameters. Env Sci Pollut Res. 2023;30:6262–74. 10.1007/s11356-022-22610-y.Search in Google Scholar PubMed
[31] Gui L, Peng J, Li P, Peng R, Yu P, Luo Y. Electrochemical degradation of dye on TiO2 nanotube array constructed anode. Chemosphere. 2019;235:1189–96. 10.1016/j.chemosphere.2019.06.170.Search in Google Scholar PubMed
[32] Candal RJ, Zeltner WA, Anderson MA. Effects of pH and applied potential on photocurrent and oxidation rate of saline solutions of formic acid in a photoelectrocatalytic reactor. Env Sci Technol. 2000;34(16):3443–51. 10.1021/es991024c.Search in Google Scholar
[33] Selcuk H, Sarikaya HZ, Bekbolet M, Anderson MA. Bromate formation on the non-porous TiO2 photoanode in the photoelectrocatalytic system. Chemosphere. 2006;62(5):715–21. 10.1016/j.chemosphere.2005.04.086.Search in Google Scholar PubMed
[34] Li J, Wang J, Huang L, Lu G. Photoelectrocatalytic degradation of methyl orange over mesoporous film electrodes. Photochem Photobiol Sci. 2010;9:39–46. 10.1039/B9PP00084D.Search in Google Scholar
[35] Zhanga W, Bai J, Fu J. Photoelectrocatalytic Degradation of Methyl Orange on Porous TiO2 Film Electrode in NaCl Solution. Adv Mat Res. 2011;213:15–9. 10.4028/www.scientific.net/AMR.213.15.Search in Google Scholar
[36] Chang X, Thind SS, Chen A. Electrocatalytic enhancement of salicylic acid oxidation at electrochemically reduced TiO2 nanotubes. ACS Catal. 2014;4(8):2616–22. 10.1021/cs500487a.Search in Google Scholar
[37] Peighambardoust NS, Khameneh Asl S, Mohammadpour R, Asl SK. Band-gap narrowing and electrochemical properties in N-doped and reduced anodic TiO2 nanotube arrays. Electrochim Acta. 2018;270:245–55. 10.1016/j.electacta.2018.03.091.Search in Google Scholar
[38] Nguyen TVA, Mai TX, Phan TB, Mai TTT. Investigation of photoelectrochemical property of TiO2 nanotube arrays prepared by anodization method. Vietnam J Chem. 2020;58(2):180–4. 10.1002/vjch.201900147.Search in Google Scholar
[39] Hamid SBA, Teh SJ, Lai CW, Perathoner S. Applied bias photon-to-current conversion efficiency of ZnO enhanced by hybridization with reduced graphene oxide. J Energy Chem. 2017;26(2):302–8. 10.1016/j.jechem.2016.11.006.Search in Google Scholar
[40] Bessegato GG, Hudari FF, Zanoni MVB. Self-doped TiO2 nanotube electrodes: A powerful tool as a sensor platform for electroanalytical applications. Electrochim Acta. 2017;235:527–33. 10.1016/j.electacta.2017.03.141.Search in Google Scholar
[41] Li T, Wang Z, Liu C, Tang C, Wang X, Ding G, et al. TiO2 nanotubes/Ag/MoS2 meshy photoelectrode with excellent photoelectrocatalytic degradation activity for tetracycline hydrochloride. Nanomater. 2018;8:666. 10.3390/nano8090666.Search in Google Scholar PubMed PubMed Central
[42] Peighambardoust NS, Asl SK, Maghsoudi M. The effect of doping concentration of TiO2 nanotubes on energy levels and its direct correlation with photocatalytic activity. Thin Solid Films. 2019;690:137558. 10.1016/j.tsf.2019.137558.Search in Google Scholar
[43] Cheng X, Zhang Y, Bi Y. Spatial dual-electric fields for highly enhanced the solar water splitting of TiO2 nanotube arrays. Nano Energy. 2019;57:542–8. 10.1016/j.nanoen.2018.12.079.Search in Google Scholar
[44] Zhou H, Zhang Y. Electrochemically self-doped TiO2 nanotube arrays for supercapacitors. J Phys Chem C. 2014;118(11):5626–36. 10.1021/jp4082883.Search in Google Scholar
[45] Yang H, Bi YF, Wang M, Chen C, Xu ZW, Chen K, et al. β-FeOOH self-supporting electrode for efficient electrochemical anodic oxidation process. Chemosphere. 2020;261:127674. 10.1016/j.chemosphere.2020.127674.Search in Google Scholar PubMed
[46] Wang H, Li X, Zhao X, Li C, Song X, Zhang P, et al. A review on heterogeneous photocatalysis for environmental remediation: From semiconductors to modification strategies. Chin J Catal. 2022;43:178–214. 10.1016/S1872‐2067(21)63910‐4.Search in Google Scholar
[47] Egerton TA, Christensen PA, Kosa SAM, Onoka B. Photoelectrocatalysis by titanium dioxide for water treatment. Int J Env Pollut. 2006;27(1/2/3):2–19. 10.1504/IJEP.2006.010450.Search in Google Scholar
[48] Koo MS, Cho K, Yoon J, Choi W. Photoelectrochemical degradation of organic compounds coupled with molecular hydrogen generation using electrochromic TiO2 nanotube arrays. Env Sci Technol. 2017;51(11):6590–8. 10.1021/acs.est.7b00774.Search in Google Scholar PubMed
[49] Ervens B, Gligorovski S, Herrmann H. Temperature-dependent rate constants for hydroxyl radical reactions with organic compounds in aqueous solutions. Phys Chem Chem Phys. 2003;5:811–1824. 10.1039/B300072A.Search in Google Scholar
[50] Ma H, Wang B, Luo X. Studies on degradation of methyl orange wastewater by combined electrochemical process. J Hazard Mater. 2007;149:492–8. 10.1016/j.jhazmat.2007.04.020.Search in Google Scholar PubMed
[51] Liu Z, Wang Q, Rong W, Jin R, Cui Y, Gao S. CTAB assisted hydrothermal preparation of Bi2WO6-WO3 nanosheets on TiO2 nanotube arrays for photoelectrocatalytic applications. Sep Purif Technol. 2018;200:191–7. 10.1016/j.seppur.2018.02.034.Search in Google Scholar
[52] Wang Q, Zheng Q, Jin R, Gao S, Yuan Q, Rong W, et al. Photoelectrocatalytic removal of organic dyes and Cr(VI) ions using Ag3PO4 nanoparticles sensitized TiO2 nanotube arrays. Mater Chem Phys. 2017;199:209–15. 10.1016/j.matchemphys.2017.06.051.Search in Google Scholar
[53] Xie Y, Ali G, Yoo SH, Sung OC. Sonication-assisted synthesis of CdS quantum-dot-sensitized TiO2 nanotube arrays with enhanced photo-electrochemical and photocatalytic activity. ACS Appl Mater Interfaces. 2010;2:2910–4. 10.1021/am100605a.Search in Google Scholar PubMed
[54] Zhang J, Yang C, Li S, Xi Y, Cai C, Liu W, et al. Preparation of Fe3+ doped high- ordered TiO2 nanotubes arrays with visible photocatalytic activities. Nanomater. 2020;10:2107. 10.3390/nano10112107.Search in Google Scholar PubMed PubMed Central
[55] Fu C, Li M, Li H, Li C, Wu X, Yang B. Fabrication of Au nanoparticle/TiO2 hybrid films for photoelectrocatalytic degradation of methyl orange. J Alloy Compd. 2017;692:727–33. 10.1016/j.jallcom.2016.09.119.Search in Google Scholar
© 2023 the author(s), published by De Gruyter
This work is licensed under the Creative Commons Attribution 4.0 International License.
Articles in the same Issue
- Research Articles
- Value-added utilization of coal fly ash and recycled polyvinyl chloride in door or window sub-frame composites
- High removal efficiency of volatile phenol from coking wastewater using coal gasification slag via optimized adsorption and multi-grade batch process
- Evolution of surface morphology and properties of diamond films by hydrogen plasma etching
- Removal efficiency of dibenzofuran using CuZn-zeolitic imidazole frameworks as a catalyst and adsorbent
- Rapid and efficient microwave-assisted extraction of Caesalpinia sappan Linn. heartwood and subsequent synthesis of gold nanoparticles
- The catalytic characteristics of 2-methylnaphthalene acylation with AlCl3 immobilized on Hβ as Lewis acid catalyst
- Biodegradation of synthetic PVP biofilms using natural materials and nanoparticles
- Rutin-loaded selenium nanoparticles modulated the redox status, inflammatory, and apoptotic pathways associated with pentylenetetrazole-induced epilepsy in mice
- Optimization of apigenin nanoparticles prepared by planetary ball milling: In vitro and in vivo studies
- Synthesis and characterization of silver nanoparticles using Origanum onites leaves: Cytotoxic, apoptotic, and necrotic effects on Capan-1, L929, and Caco-2 cell lines
- Exergy analysis of a conceptual CO2 capture process with an amine-based DES
- Construction of fluorescence system of felodipine–tetracyanovinyl–2,2′-bipyridine complex
- Excellent photocatalytic degradation of rhodamine B over Bi2O3 supported on Zn-MOF nanocomposites under visible light
- Optimization-based control strategy for a large-scale polyhydroxyalkanoates production in a fed-batch bioreactor using a coupled PDE–ODE system
- Effectiveness of pH and amount of Artemia urumiana extract on physical, chemical, and biological attributes of UV-fabricated biogold nanoparticles
- Geranium leaf-mediated synthesis of silver nanoparticles and their transcriptomic effects on Candida albicans
- Synthesis, characterization, anticancer, anti-inflammatory activities, and docking studies of 3,5-disubstituted thiadiazine-2-thiones
- Synthesis and stability of phospholipid-encapsulated nano-selenium
- Putative anti-proliferative effect of Indian mustard (Brassica juncea) seed and its nano-formulation
- Enrichment of low-grade phosphorites by the selective leaching method
- Electrochemical analysis of the dissolution of gold in a copper–ethylenediamine–thiosulfate system
- Characterisation of carbonate lake sediments as a potential filler for polymer composites
- Evaluation of nano-selenium biofortification characteristics of alfalfa (Medicago sativa L.)
- Quality of oil extracted by cold press from Nigella sativa seeds incorporated with rosemary extracts and pretreated by microwaves
- Heteropolyacid-loaded MOF-derived mesoporous zirconia catalyst for chemical degradation of rhodamine B
- Recovery of critical metals from carbonatite-type mineral wastes: Geochemical modeling investigation of (bio)hydrometallurgical leaching of REEs
- Photocatalytic properties of ZnFe-mixed oxides synthesized via a simple route for water remediation
- Attenuation of di(2-ethylhexyl)phthalate-induced hepatic and renal toxicity by naringin nanoparticles in a rat model
- Novel in situ synthesis of quaternary core–shell metallic sulfide nanocomposites for degradation of organic dyes and hydrogen production
- Microfluidic steam-based synthesis of luminescent carbon quantum dots as sensing probes for nitrite detection
- Transformation of eggshell waste to egg white protein solution, calcium chloride dihydrate, and eggshell membrane powder
- Preparation of Zr-MOFs for the adsorption of doxycycline hydrochloride from wastewater
- Green nanoarchitectonics of the silver nanocrystal potential for treating malaria and their cytotoxic effects on the kidney Vero cell line
- Carbon emissions analysis of producing modified asphalt with natural asphalt
- An efficient and green synthesis of 2-phenylquinazolin-4(3H)-ones via t-BuONa-mediated oxidative condensation of 2-aminobenzamides and benzyl alcohols under solvent- and transition metal-free conditions
- Chitosan nanoparticles loaded with mesosulfuron methyl and mesosulfuron methyl + florasulam + MCPA isooctyl to manage weeds of wheat (Triticum aestivum L.)
- Synergism between lignite and high-sulfur petroleum coke in CO2 gasification
- Facile aqueous synthesis of ZnCuInS/ZnS–ZnS QDs with enhanced photoluminescence lifetime for selective detection of Cu(ii) ions
- Rapid synthesis of copper nanoparticles using Nepeta cataria leaves: An eco-friendly management of disease-causing vectors and bacterial pathogens
- Study on the photoelectrocatalytic activity of reduced TiO2 nanotube films for removal of methyl orange
- Development of a fuzzy logic model for the prediction of spark-ignition engine performance and emission for gasoline–ethanol blends
- Micro-impact-induced mechano-chemical synthesis of organic precursors from FeC/FeN and carbonates/nitrates in water and its extension to nucleobases
- Green synthesis of strontium-doped tin dioxide (SrSnO2) nanoparticles using the Mahonia bealei leaf extract and evaluation of their anticancer and antimicrobial activities
- A study on the larvicidal and adulticidal potential of Cladostepus spongiosus macroalgae and green-fabricated silver nanoparticles against mosquito vectors
- Catalysts based on nickel salt heteropolytungstates for selective oxidation of diphenyl sulfide
- Powerful antibacterial nanocomposites from Corallina officinalis-mediated nanometals and chitosan nanoparticles against fish-borne pathogens
- Removal behavior of Zn and alkalis from blast furnace dust in pre-reduction sinter process
- Environmentally friendly synthesis and computational studies of novel class of acridinedione integrated spirothiopyrrolizidines/indolizidines
- The mechanisms of inhibition and lubrication of clean fracturing flowback fluids in water-based drilling fluids
- Adsorption/desorption performance of cellulose membrane for Pb(ii)
- A one-pot, multicomponent tandem synthesis of fused polycyclic pyrrolo[3,2-c]quinolinone/pyrrolizino[2,3-c]quinolinone hybrid heterocycles via environmentally benign solid state melt reaction
- Green synthesis of silver nanoparticles using durian rind extract and optical characteristics of surface plasmon resonance-based optical sensor for the detection of hydrogen peroxide
- Electrochemical analysis of copper-EDTA-ammonia-gold thiosulfate dissolution system
- Characterization of bio-oil production by microwave pyrolysis from cashew nut shells and Cassia fistula pods
- Green synthesis methods and characterization of bacterial cellulose/silver nanoparticle composites
- Photocatalytic research performance of zinc oxide/graphite phase carbon nitride catalyst and its application in environment
- Effect of phytogenic iron nanoparticles on the bio-fortification of wheat varieties
- In vitro anti-cancer and antimicrobial effects of manganese oxide nanoparticles synthesized using the Glycyrrhiza uralensis leaf extract on breast cancer cell lines
- Preparation of Pd/Ce(F)-MCM-48 catalysts and their catalytic performance of n-heptane isomerization
- Green “one-pot” fluorescent bis-indolizine synthesis with whole-cell plant biocatalysis
- Silica-titania mesoporous silicas of MCM-41 type as effective catalysts and photocatalysts for selective oxidation of diphenyl sulfide by H2O2
- Biosynthesis of zinc oxide nanoparticles from molted feathers of Pavo cristatus and their antibiofilm and anticancer activities
- Clean preparation of rutile from Ti-containing mixed molten slag by CO2 oxidation
- Synthesis and characterization of Pluronic F-127-coated titanium dioxide nanoparticles synthesized from extracts of Atractylodes macrocephala leaf for antioxidant, antimicrobial, and anticancer properties
- Effect of pretreatment with alkali on the anaerobic digestion characteristics of kitchen waste and analysis of microbial diversity
- Ameliorated antimicrobial, antioxidant, and anticancer properties by Plectranthus vettiveroides root extract-mediated green synthesis of chitosan nanoparticles
- Microwave-accelerated pretreatment technique in green extraction of oil and bioactive compounds from camelina seeds: Effectiveness and characterization
- Studies on the extraction performance of phorate by aptamer-functionalized magnetic nanoparticles in plasma samples
- Investigation of structural properties and antibacterial activity of AgO nanoparticle extract from Solanum nigrum/Mentha leaf extracts by green synthesis method
- Green fabrication of chitosan from marine crustaceans and mushroom waste: Toward sustainable resource utilization
- Synthesis, characterization, and evaluation of nanoparticles of clodinofop propargyl and fenoxaprop-P-ethyl on weed control, growth, and yield of wheat (Triticum aestivum L.)
- The enhanced adsorption properties of phosphorus from aqueous solutions using lanthanum modified synthetic zeolites
- Separation of graphene oxides of different sizes by multi-layer dialysis and anti-friction and lubrication performance
- Visible-light-assisted base-catalyzed, one-pot synthesis of highly functionalized cinnolines
- The experimental study on the air oxidation of 5-hydroxymethylfurfural to 2,5-furandicarboxylic acid with Co–Mn–Br system
- Highly efficient removal of tetracycline and methyl violet 2B from aqueous solution using the bimetallic FeZn-ZIFs catalyst
- A thermo-tolerant cellulase enzyme produced by Bacillus amyloliquefaciens M7, an insight into synthesis, optimization, characterization, and bio-polishing activity
- Exploration of ketone derivatives of succinimide for their antidiabetic potential: In vitro and in vivo approaches
- Ultrasound-assisted green synthesis and in silico study of 6-(4-(butylamino)-6-(diethylamino)-1,3,5-triazin-2-yl)oxypyridazine derivatives
- A study of the anticancer potential of Pluronic F-127 encapsulated Fe2O3 nanoparticles derived from Berberis vulgaris extract
- Biogenic synthesis of silver nanoparticles using Consolida orientalis flowers: Identification, catalytic degradation, and biological effect
- Initial assessment of the presence of plastic waste in some coastal mangrove forests in Vietnam
- Adsorption synergy electrocatalytic degradation of phenol by active oxygen-containing species generated in Co-coal based cathode and graphite anode
- Antibacterial, antifungal, antioxidant, and cytotoxicity activities of the aqueous extract of Syzygium aromaticum-mediated synthesized novel silver nanoparticles
- Synthesis of a silica matrix with ZnO nanoparticles for the fabrication of a recyclable photodegradation system to eliminate methylene blue dye
- Natural polymer fillers instead of dye and pigments: Pumice and scoria in PDMS fluid and elastomer composites
- Study on the preparation of glycerylphosphorylcholine by transesterification under supported sodium methoxide
- Wireless network handheld terminal-based green ecological sustainable design evaluation system: Improved data communication and reduced packet loss rate
- The optimization of hydrogel strength from cassava starch using oxidized sucrose as a crosslinking agent
- Green synthesis of silver nanoparticles using Saccharum officinarum leaf extract for antiviral paint
- Study on the reliability of nano-silver-coated tin solder joints for flip chips
- Environmentally sustainable analytical quality by design aided RP-HPLC method for the estimation of brilliant blue in commercial food samples employing a green-ultrasound-assisted extraction technique
- Anticancer and antimicrobial potential of zinc/sodium alginate/polyethylene glycol/d-pinitol nanocomposites against osteosarcoma MG-63 cells
- Nanoporous carbon@CoFe2O4 nanocomposite as a green absorbent for the adsorptive removal of Hg(ii) from aqueous solutions
- Characterization of silver sulfide nanoparticles from actinobacterial strain (M10A62) and its toxicity against lepidopteran and dipterans insect species
- Phyto-fabrication and characterization of silver nanoparticles using Withania somnifera: Investigating antioxidant potential
- Effect of e-waste nanofillers on the mechanical, thermal, and wear properties of epoxy-blend sisal woven fiber-reinforced composites
- Magnesium nanohydroxide (2D brucite) as a host matrix for thymol and carvacrol: Synthesis, characterization, and inhibition of foodborne pathogens
- Synergistic inhibitive effect of a hybrid zinc oxide-benzalkonium chloride composite on the corrosion of carbon steel in a sulfuric acidic solution
- Review Articles
- Role and the importance of green approach in biosynthesis of nanopropolis and effectiveness of propolis in the treatment of COVID-19 pandemic
- Gum tragacanth-mediated synthesis of metal nanoparticles, characterization, and their applications as a bactericide, catalyst, antioxidant, and peroxidase mimic
- Green-processed nano-biocomposite (ZnO–TiO2): Potential candidates for biomedical applications
- Reaction mechanisms in microwave-assisted lignin depolymerisation in hydrogen-donating solvents
- Recent progress on non-noble metal catalysts for the deoxydehydration of biomass-derived oxygenates
- Rapid Communication
- Phosphorus removal by iron–carbon microelectrolysis: A new way to achieve phosphorus recovery
- Special Issue: Biomolecules-derived synthesis of nanomaterials for environmental and biological applications (Guest Editors: Arpita Roy and Fernanda Maria Policarpo Tonelli)
- Biomolecules-derived synthesis of nanomaterials for environmental and biological applications
- Nano-encapsulated tanshinone IIA in PLGA-PEG-COOH inhibits apoptosis and inflammation in cerebral ischemia/reperfusion injury
- Green fabrication of silver nanoparticles using Melia azedarach ripened fruit extract, their characterization, and biological properties
- Green-synthesized nanoparticles and their therapeutic applications: A review
- Antioxidant, antibacterial, and cytotoxicity potential of synthesized silver nanoparticles from the Cassia alata leaf aqueous extract
- Green synthesis of silver nanoparticles using Callisia fragrans leaf extract and its anticancer activity against MCF-7, HepG2, KB, LU-1, and MKN-7 cell lines
- Algae-based green AgNPs, AuNPs, and FeNPs as potential nanoremediators
- Green synthesis of Kickxia elatine-induced silver nanoparticles and their role as anti-acetylcholinesterase in the treatment of Alzheimer’s disease
- Phytocrystallization of silver nanoparticles using Cassia alata flower extract for effective control of fungal skin pathogens
- Antibacterial wound dressing with hydrogel from chitosan and polyvinyl alcohol from the red cabbage extract loaded with silver nanoparticles
- Leveraging of mycogenic copper oxide nanostructures for disease management of Alternaria blight of Brassica juncea
- Nanoscale molecular reactions in microbiological medicines in modern medical applications
- Synthesis and characterization of ZnO/β-cyclodextrin/nicotinic acid nanocomposite and its biological and environmental application
- Green synthesis of silver nanoparticles via Taxus wallichiana Zucc. plant-derived Taxol: Novel utilization as anticancer, antioxidation, anti-inflammation, and antiurolithic potential
- Recyclability and catalytic characteristics of copper oxide nanoparticles derived from bougainvillea plant flower extract for biomedical application
- Phytofabrication, characterization, and evaluation of novel bioinspired selenium–iron (Se–Fe) nanocomposites using Allium sativum extract for bio-potential applications
- Erratum
- Erratum to “Synthesis, characterization, and evaluation of nanoparticles of clodinofop propargyl and fenoxaprop-P-ethyl on weed control, growth, and yield of wheat (Triticum aestivum L.)”