3D simulation of double-needle bar warp-knitted clustered pile fabrics on DFS
-
Songsong Guan
 ,
Gaoming Jiang
und
Bingxian Li
,
Gaoming Jiang
und
Bingxian Li

Abstract
The shortcomings of traditional pile fabric design and simulation in simulating clustered structures are addressed in this study by proposing a new three-dimensional (3D) simulation method. To accurately capture the details of clustered pile fabrics, a fine geometric model of a single pile loop is first established, and a novel geometric transformation algorithm, combined with rotational transformations and trigonometric calculations, is employed to achieve the natural aggregation of pile fibers, resulting in a highly realistic clustered structure. Additionally, to enhance design flexibility and accuracy, a pile design pattern is introduced, and for the first time, a Depth-First Search (DFS) algorithm is utilized for precise pattern recognition and determination of the directions of pile fibers, effectively solving the challenges of clustered area identification. To enhance the visual realism of the simulation, the Phong illumination model is adopted to simulate the lighting effects on the fabric surface, and blurring processes are applied to eliminate sharp edges and noise, resulting in a softer and more natural simulation output. Based on the recognition results from the DFS algorithm, the directions of the pile fibers are finely adjusted to achieve a realistic simulation of clustered pile fabrics. Experimental validation demonstrates that the proposed method produces 3D simulation results that closely resemble actual pile fabrics, demonstrating significant practical value and innovation.
1 Introduction
Pile fabrics are widely used in apparel, home decor, and industrial applications due to their soft texture and intricate structure. In particular, warp-knitted tufted pile fabrics are highly favored for their unique tufted structure, which imparts a richer tactile and visual experience to the fabric. However, the high complexity and randomness of this structure make accurate 3D modeling and simulation of warp-knitted tufted pile fabrics a challenging task. Traditional modeling methods often rely on manual experience and simplified assumptions, making it difficult to fully capture the true physical properties and fine details of warp-knitted tufted pile fabrics. Therefore, achieving high-precision, highly realistic 3D simulations of these fabrics has become a focal point of current research.
Currently, some research has attempted to model and simulate double-needle bar warp-knitted fabrics and pile structures using different methods. In the case of double-needle bar warp-knitted fabrics, Wang [1] established yarn trajectories that conform to the loop using a spline cubic curve-fitting interpolation method based on quadrilateral mesh vertices. Zhang et al. [2,3,4] constructed models using non-uniform rational B-spline curves. In terms of pile simulation, Xu and Zhang [5] proposed an image processing-based modeling method that can capture the appearance features of pile fabrics, but it often lacks physical realism. Yang et al. [6] embedded a volumetric density model into a generalized cylinder to simulate clustered fibers, which is difficult to deal with the detailed structure. Fuhrer et al. [7] achieved the effect of fine hair on plant surfaces by mapping tiny hairs onto the surface mesh, allowing for a more accurate simulation of hair distribution and morphological differences in various areas. However, this method increases the complexity of implementation and debugging. Yang et al. [8], Zhang et al. [9,10,11,12], and Li [13] used sliced textures to render clustered pile, resulting in high realism and detailed expression, but it comes with high computational complexity and large storage requirements. Lee et al. [14] used two layered textures to represent the volume and edges of hair, which better simulates the complex appearance of hair but also increases the complexity of implementation and the hardware requirements. Additionally, Mo [15] introduced deep learning methods into pile modeling, training models to recognize fabric features. Jiang [16] treated multiple hairs as a whole during the simulation of clustered hair, forming a “bundle” or “bunch” to exhibit consistent characteristics without individually calculating each hair. Zheng et al. [17] used image data obtained from a single view to learn and reconstruct 3D hair models, simplifying the data collection process. However, the lack of multi-view information may lead to less accurate performance of the model in real environments. Qiao et al. [18] proposed a deep learning-based framework for rapidly synthesizing realistic hair. However, this approach requires a large amount of labeled data and has limited generalization capability. These methods address some aspects of pile modeling to a certain extent but still have many shortcomings.
This study proposes a method for identifying aggregated state regions in pile fabrics based on the Depth-First Search (DFS) algorithm. By combining the identification results with geometric modeling, it achieves three-dimensional (3D) simulation of clustered pile fabrics. The DFS algorithm, characterized by comprehensive traversal and flexible pathfinding, effectively identifies regions with different aggregated states within the fabric. This identification process provides a reliable data foundation for subsequent geometric modeling, enabling the generated 3D models to more accurately reflect the structure and appearance of actual pile fabrics.
2 Process and mathematical model
The unique manufacturing process and complex structure of double-needle bar warp-knitted clustered pile fabrics lead to their wide usage in the production of high-end textiles. To gain a deeper understanding and accurately simulate the performance of these fabrics, it is crucial that their production process is studied and corresponding mathematical models are constructed.
2.1 Knitting process and design
The production process of double-needle bar warp-knitted clustered pile fabrics primarily includes knitting on a double-needle bar warp-knitted machine, a pile splitting process, and subsequent finishing steps. First, the pile guide bars are knitted on the front and back needle bars using the double-needle bar warp-knitted machine, resulting in an initial fabric with a specific structure. This step employs double-needle bar warp-knitted technology to form a pile foundation within the fabric. Next, the pile splitting treatment is carried out, during which the fabric is split along the middle of the pile fibers, producing two single-sided pile fabrics [19,20]. This method ensures uniform pile distribution and structural stability. Finally, a series of finishing processes, such as sheering, heat setting, softening treatment, and anti-static treatment, are applied to further enhance the fabric’s physical properties and appearance, resulting in clustered pile fabrics with excellent hand feel and visual appeal [21]. As shown in Figure 1, the process flowchart for forming double-needle bar warp-knitted clustered pile fabrics is illustrated.
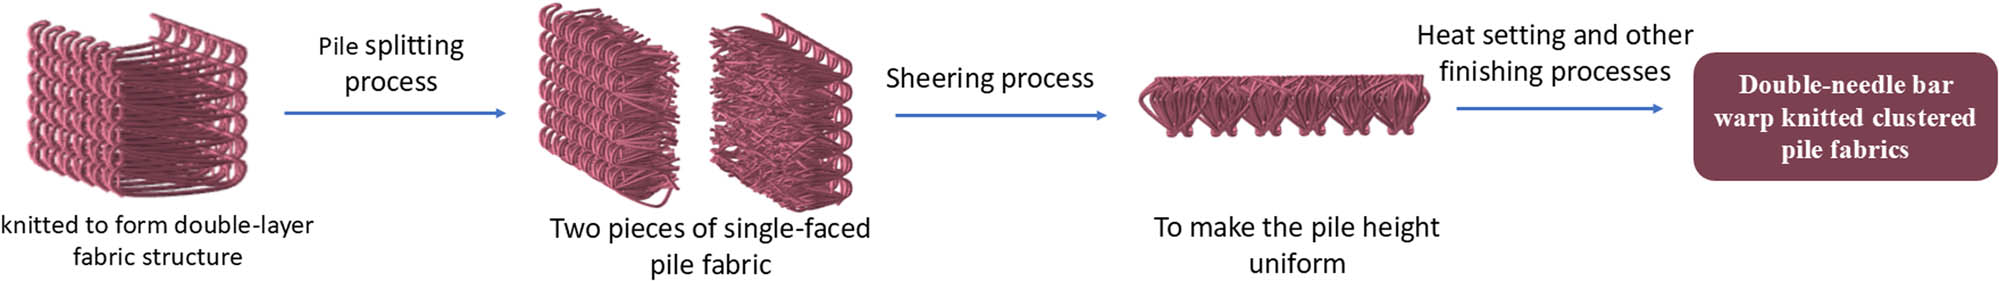
Process flowchart of the formation of double-needle bar warp-knitted clustered pile fabrics.
This study primarily focuses on the 3D simulation of solid color and jacquard double-needle bar knit pile fabrics. The fabrics are mainly produced using the Raschel double-needle bar with 6 guide bars, double plush loop machine, with the process parameters detailed in Tables 1 and 2. In the tables, A, B, C, and D represent the material specification numbers, and “” indicates an empty threading. For example, “6C, 4” indicates that material C is threaded six times, followed by four empty threads.
Process parameters of solid color clustered pile fabrics
| Guided bars | Chain notation | Yarn specifications | Threading | Warp run-in (mm rack−1) |
|---|---|---|---|---|
| GB1 | 5-5-5-5/0-0-0-0// | 8.3tex/36f semi-dull polyester FDY, white | Fully threaded A | 3,600 |
| GB2 | 0-1-1-1/1-0-0-0// | 8.3tex/36f semi-dull polyester FDY, white | Fully threaded A | 2,698 |
| GB3 | 0-1-0-1/1-0-1-0// | 16.7tex/288f polyester DTY, DARK Brown | Fully threaded B | 9,500 |
| GB5 | 0-0-0-1/1-1-1-0// | 8.3tex/36f semi-dull polyester FDY, white | Fully threaded A | 2,698 |
| GB6 | 0-0-5-5/5-5-0-0// | 8.3tex/36f semi-dull polyester FDY, white | Fully threaded A | 3,600 |
Process parameters of jacquard clustered pile fabrics
| Guided bars | Chain notation | Yarn specifications | Threading | Warp run-in (mm rack−1) |
|---|---|---|---|---|
| GB1 | 4-4-4-4/0-0-0-0/3-3-3-3/0-0-0-0// | 8.3tex/36f semi-dull polyester FDY, white | Fully threaded A | 2,912 |
| GB2 | 0-1-0-0// | 8.3tex/36f semi-dull polyester FDY, white | Fully threaded A | 2,145 |
| GB3 | 0-1-0-1// | 16.7tex/288f polyester DTY, dark green | 6C,4* | 10,150 |
| GB4 | 0-1-0-1// | 16.7tex/288f polyester DTY, dark blue | 6*,4D | 10,150 |
| GB5 | 0-0-0-1// | 8.3tex/36f semi-dull polyester FDY, white | Fully threaded A | 2,145 |
| GB6 | 4-4-0-0/0-0-3-3/3-3-0-0/0-0-4-4// | 8.3tex/36f semi-dull polyester FDY, white | Fully threaded A | 2,300 |
2.2 Chain notation model
In double-needle bar warp-knitted fabrics, the guide bars are alternately knitted on the front and back needle bars. Therefore, the actual unfolded height of the chain notation during knitting is represented as twice the pattern height of the fabric. This is represented by the matrix D i :
In the equation, j ∈ {1, 2, 3,…, m}, where m is represented as the total number of courses, i.e., the height of the fabric pattern. The chain notation of double-needle bar warp-knitted fabric is composed of four digits: the first two digits are represented as the needle positions knitted on the front needle bar, while the last two digits are represented as the needle positions knitted on the back needle bar. The starting needle position is indicated by the first course of the matrix, and the ending needle position is indicated by the second course. Here, d 2j−1,2k−1 and d 2j−1,2k are represented as the first two chain notations of the jth course and the kth wale, while d 2j,2k−1 and d 2j,2k are represented as the latter two chain notations of the jth course and the kth wale.
2.3 Threading model
Each guide bar in warp-knitted fabrics is followed by a specific threading pattern. To more clearly represent the corresponding threading method, a threading mathematical model is established [22] and is represented by the matrix C ik :
In the formula, i ∈ {1, 2, 3, …, p}, where p is represented as the total number of guide bars, and k ∈ {1, 2, 3, …, n}, where n is represented as the total number of wales, i.e., the fabric’s pattern width. The type of yarn material is indicated by c i,k .
2.4 Pile design pattern model
In the pile design pattern, a single design cell represents a pile loop. The height and width of the design pattern correspond to the pattern height and width of the pile fabric, respectively. When constructing the design pattern, the drawing is done from right to left and from bottom to top. The matrix is arranged in reverse order overall [23]. The matrix Q i is described as follows:
In the equation, i ∈ {1, 2, 3,…,p}, where p is represented as the total number of guide bars; j ∈ {1, 2, 3,…,m}, where m is represented as the total number of courses; and k ∈ {1, 2, 3,…,n}, where n is represented as the total number of wales. q j,k is defined as the status of the plush yarn loop at the jth course and kth wale. In this study, only two states are considered for the pile: one is a random state and the other is an aggregated clustered state. Therefore, the value of q j,k can be either q j,k = 1 or q j,k = 4. When q j,k = 1, the color of the design cell is represented as red, indicating that the current pile loop is classified as belonging to the clustered pile area and is in an aggregated state; when q j,k = 4, the design cell is colored green, indicating that the current pile loop is classified as belonging to a non-clustered pile area, and the pile fibers are in a randomly deflected state.
3 Geometric loop model
3.1 Single pile geometric loop structure
The structure of a single pile loop in double-needle bar warp-knitted clustered pile fabrics is composed of ten control points, labeled P0–P9. Specifically, the main loop section is formed by six points, P2–P7, which create the basic skeleton structure of the pile fabric. The pile fibers are made up of two segments: P0-P1-P2 and P7-P8-P9. By connecting these control points, the appearance and shape of the pile fibers are created.
In the geometric modeling process of pile fibers, the control points P0, P1, P8, and P9 are randomly deflected along the y-axis and z-axis to simulate the natural state and randomness of the pile fibers. This random deflection not only reflects the complex structure and appearance characteristics of the pile fabric more accurately but also enhances the realism and diversity of the simulation model. The number of pile fibers can be adjusted as needed. As shown in Figure 2, a total of eight pile fibers are present in the pile loop, and the deflection angle of each individual pile fiber within the loop is varied randomly. Through the reasonable configuration and adjustment of these control points, high-precision modeling of the pile fabric structure is achieved, providing a detailed geometric description and capturing randomness features, thus laying a solid foundation for subsequent 3D simulation.
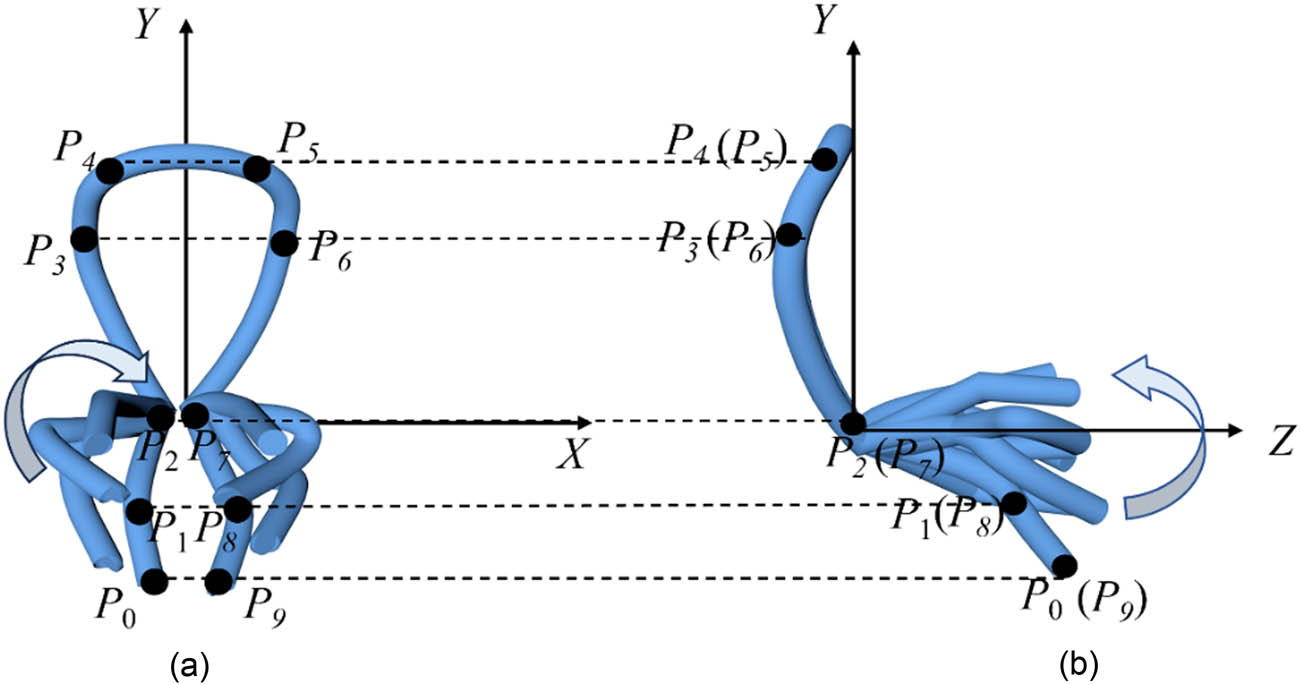
Geometric structure of a single pile loop: (a) front view and (b) side view.
3.2 Principle of pile cluster geometric structure
The surface pile structure of double-needle bar warp-knitted clustered pile fabrics is composed of clusters of pile fibers. Therefore, it is formed by the aggregation of multiple adjacent pile loop structures. To simulate a realistic clustered pile state, it is necessary for the model to ensure that the ends of the pile fibers converge toward a single point. However, since the pile fibers have been trimmed, their lengths are fixed. Consequently, as they converge toward a point, the edges of the pile cluster do not reach the height of the convergence point, but their ends still point in the direction of the convergence point.
Since the fabric is knitted in both longitudinal and transverse directions, the state of the fabric appears rectangular; however, the final clustered area may not be rectangular and must be determined based on the values of q j,k in Section 2.4. The positions where q j,k = 1 are identified as clustered areas, indicated by the light-colored region at the bottom of Figure 3. Regardless of whether the arrangement of the selected loop positions is regular, the final appearance of the clustering effect resembles the circular appearance shown in Figure 3. To better understand the effect of the clustered structure, the clustered positions on the fabric are depicted as circular areas. Thus, the position of each pile fiber shown in Figure 3 can be viewed as the pile fibers at different loop positions within the current clustered area. A single pile loop position can have multiple pile fibers, but ultimately, whether from different loop positions or multiple pile fibers from one pile loop position, all are directed toward the center of the clustering area. The position range for the central cluster is randomly selected from the pile loop positions of the current clustered area. The clustering effect shown in Figure 3 is represented as one such clustered effect within the fabric and can be applied throughout the fabric. Each clustered pile has only one central pile; therefore, the position of the central pile in the fabric is determined by the selected clustered pile area.
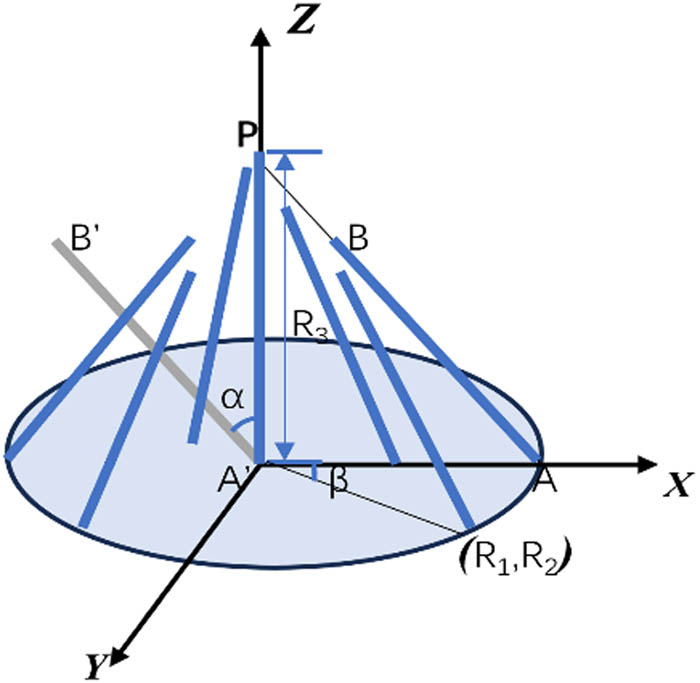
Principle of clustered pile aggregation.
The light-colored clustered structure area at the bottom of Figure 3 also indicates the direction of the main loop fibers, arranged along the XY direction. R1 and R2 represent the positions of the clustered structure on the XOY plane; R1 indicates the X direction relative to the current center coordinate of a cluster; and R2 indicates the Y direction. R3 represents the length of the pile fibers, where each point at the tail end of the pile fiber in Figure 3, directed toward point P, corresponds to the P0 (P9) control point of each pile loop. α is the deflection angle of the pile with respect to the Z-axis, representing the rotation range around the Y-axis, while β is the deflection angle with respect to the X-axis, indicating the rotation range around the Z-axis. Therefore, the principle for constructing the clustered structure model involves randomly selecting a central pile fiber as the aggregation coordinate, with its direction coinciding with the Z-axis and R3 being its length. The coordinates of the remaining pile fibers are translated to the position of the central fiber, rotated around the Y-axis, and the angle α is calculated using geometric principles. Similarly, the rotation around the Z-axis is calculated for β. The calculated angles are applied to the rotation matrices EY and EZ, resulting in A′B′, which represents the direction of the pile after rotation. Finally, these fibers are translated back to their original positions, denoted as AB, and the same process is applied to the other pile fibers, yielding the corresponding clustered geometric model.
4 DFS application
Section 3 provides a detailed explanation of the principles underlying the construction of the clustered pile fabrics model, elucidating the key elements of its structure and formation process. Next, the DFS method will be further explored to identify the design pattern, thereby achieving the simulation of the entire clustered pile fabrics. This method allows for a more accurate and efficient simulation of the real fabric effect, providing important technical support for subsequent design and production.
4.1 Recognition of pile design pattern
In the design pattern, each design block is represented by a two-dimensional (2D) array q j,k . The 2D array q j,k is traversed using DFS, with the values of all connected regions updated, ensuring that each node is correctly accessed and processed while identifying all red design cells belonging to the current aggregated region. As shown in Figure 4, the coordinates of the red design cells are (0,0), (0,1), (1,0), and (1,1). The traversal process identifies all design cells, where q j,k = 1 in the 2D array, as illustrated in Figure 5. The DFS function is called for each unvisited cell that meets the criteria, with all connected regions being detected and marked, while the entire 2D array is traversed. Each detected region is added to the “region” list, which represents all adjacent red area blocks, in other words, a clustered pile region. The number of these regions corresponds to the number of clustered pile areas.
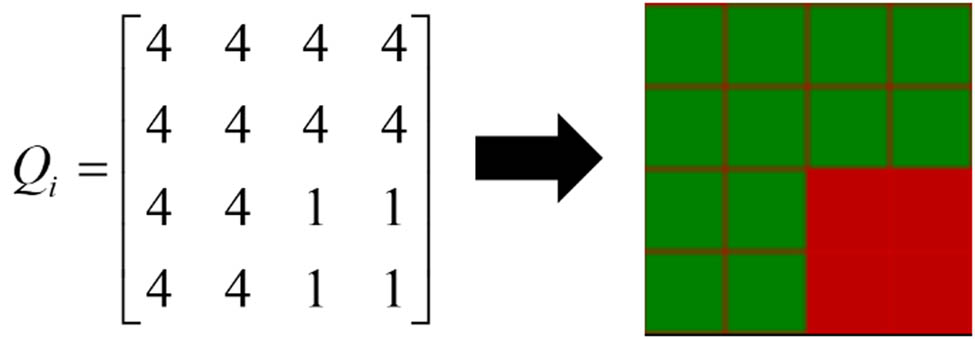
Conversion diagram from matrix to design pattern.
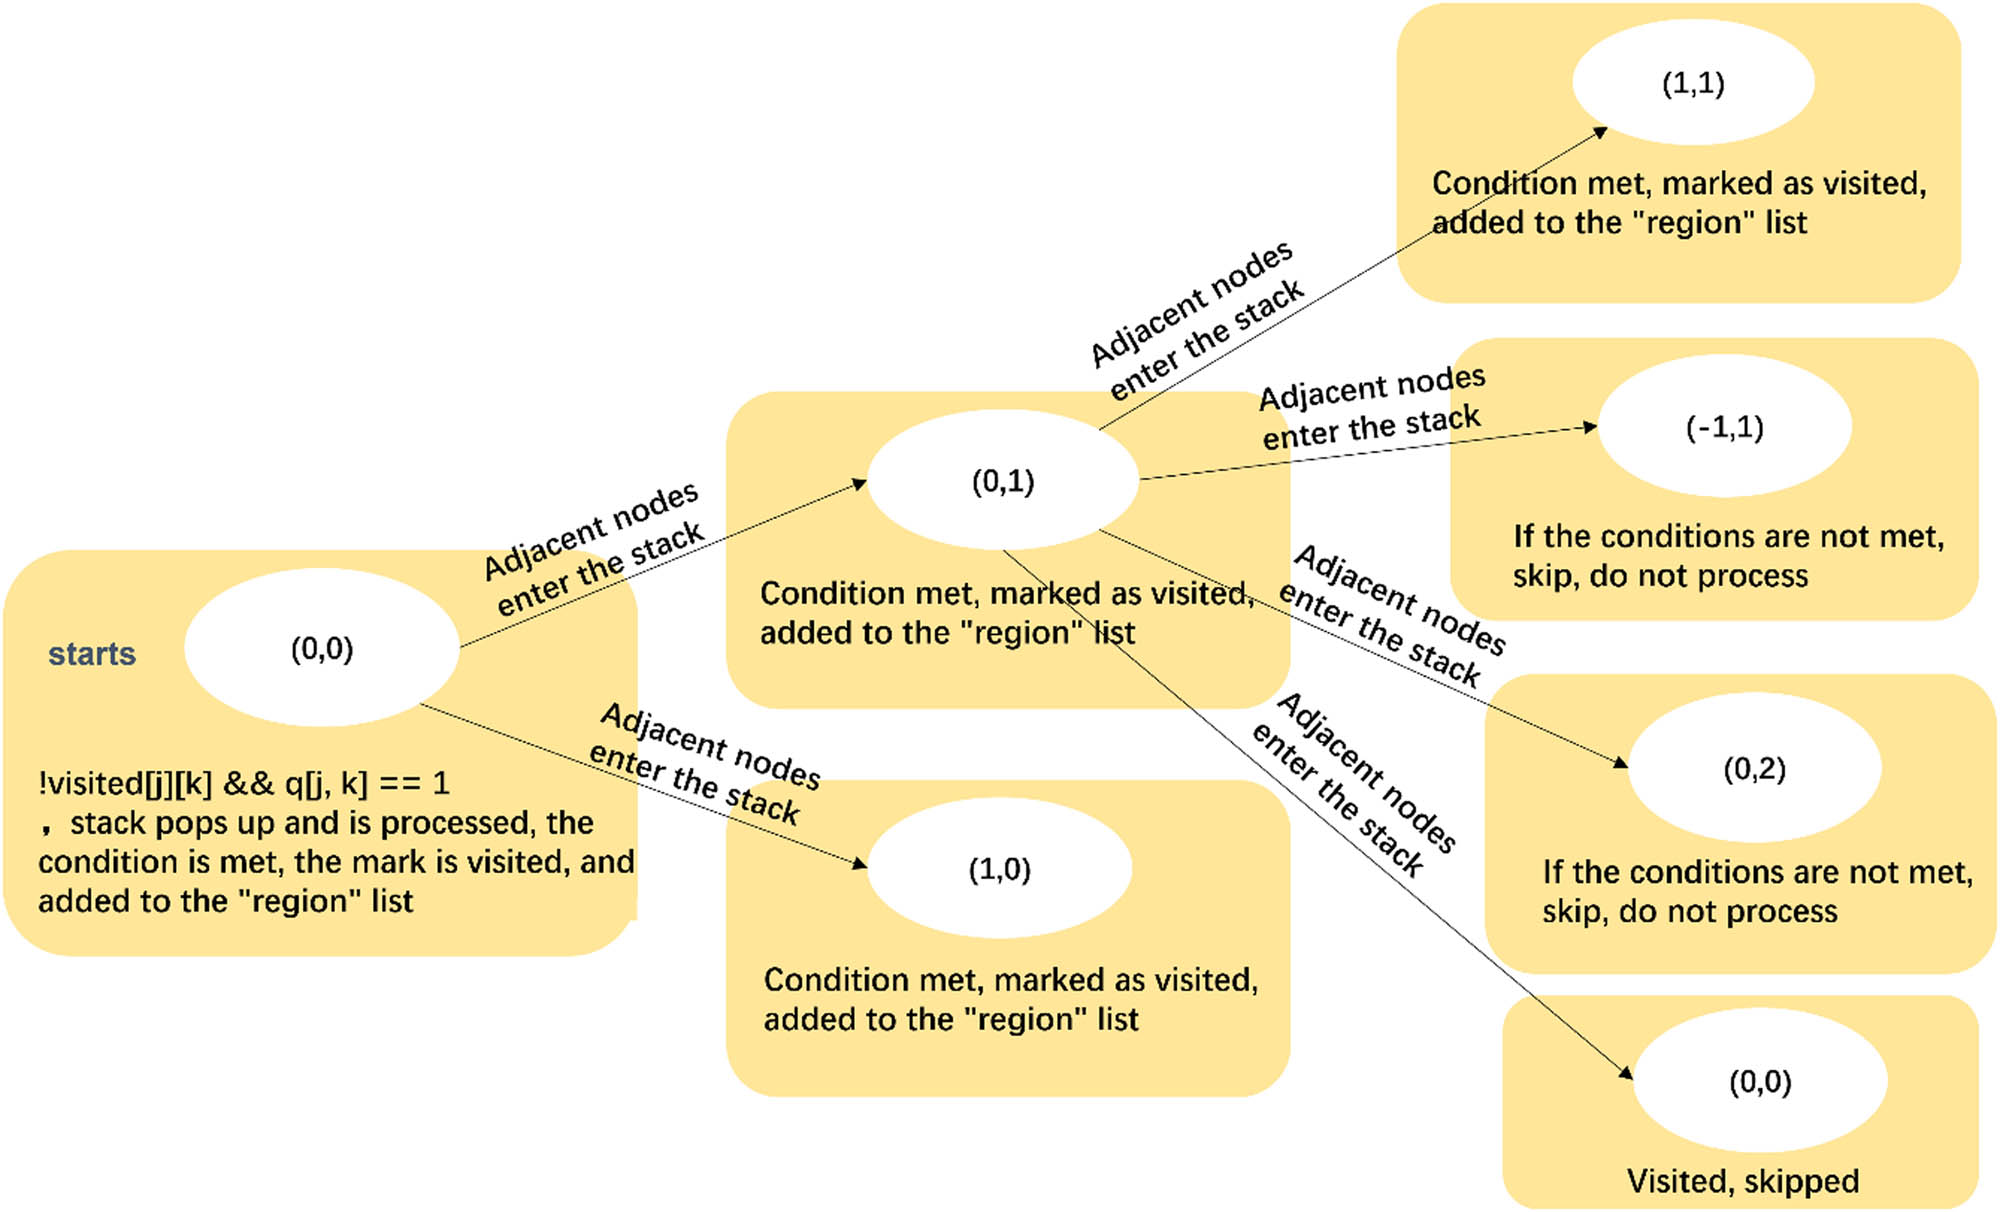
Diagram of specific region in 2D array using DFS.
4.2 Region segmentation of pile design pattern
After the clustered pile design block regions are identified, they need to be divided into multiple areas, with different red design cell regions representing different pile clusters. As shown in Figure 6, two clustered pile areas are present.
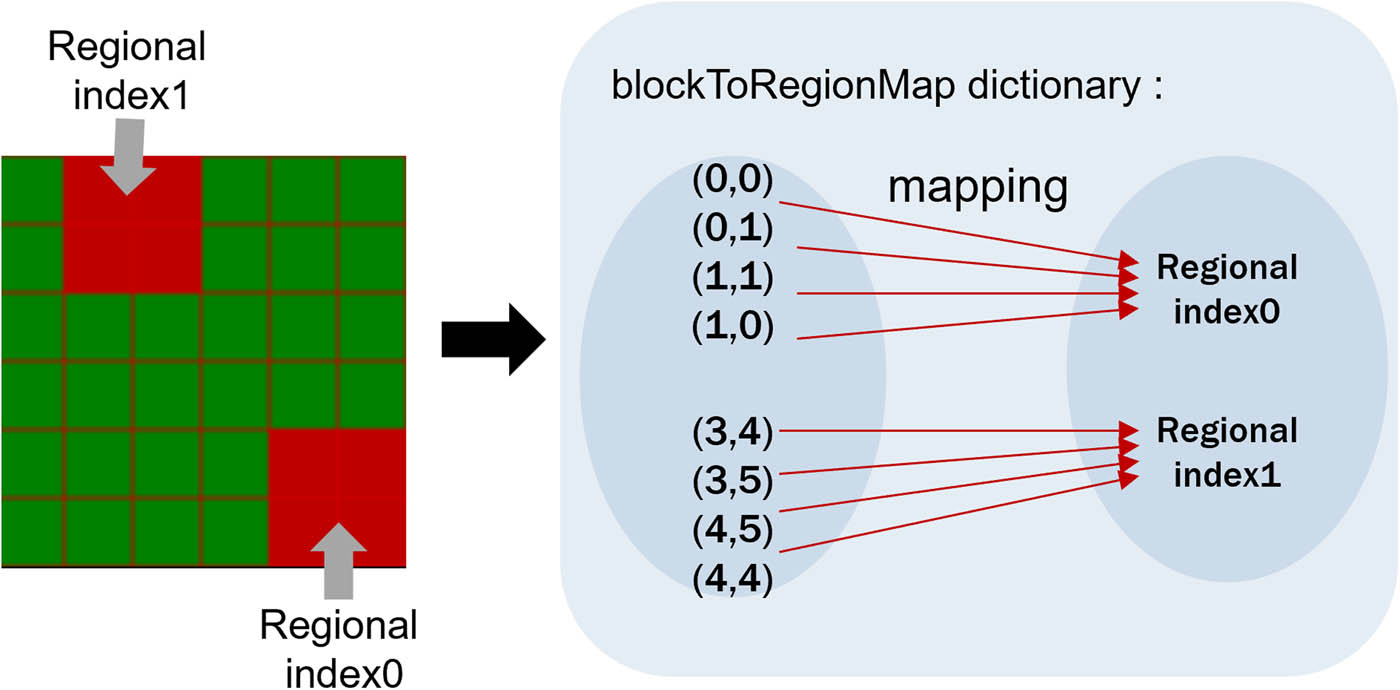
Region index mapping.
The “region” list is traversed, and each area is processed. In the design blocks of Figure 6, two clustered regions are identified. By traversing the “region” list, the corresponding coordinates identified are (0,0), (0,1), (1,0), (1,1), (3,4), (3,5), (4,5), and (4,4). From Section 2.4, it is known that adjacent red design cell coordinates form a single pile cluster. Therefore, using the “block ToRegionMap” dictionary, the coordinates are mapped to their respective index areas: (0,0), (0,1), (1,0), and (1,1) are mapped to region index 0, while (3,4), (3,5), (4,5), and (4,4) are mapped to region index 1. This segments the red design cells in the clustered state into different aggregation area blocks.
4.3 Rapid identification of aggregation coordinates
After the aggregated regions are identified and segmented, as noted in Section 3.2, the coordinates of the central pile need to be found to achieve the clustered state. Therefore, in each different pile cluster region, the corresponding central pile aggregation coordinates must be identified to achieve the pile clustering effect. Consequently, the central pile coordinates need to be queried. From the segmented region list “region,” a red design cell coordinate is randomly selected from each area as the central pile coordinate. The “selectedBlocks” list is created to store the coordinates of the randomly chosen aggregation points in each region. The “blockToRegionMap” dictionary provides an efficient way to map the location of the red blocks to their respective regions. During the traversal process, once a region index is found, the corresponding random block can be obtained from the “selectedBlocks” list to update the central pile coordinates (Figure 7).
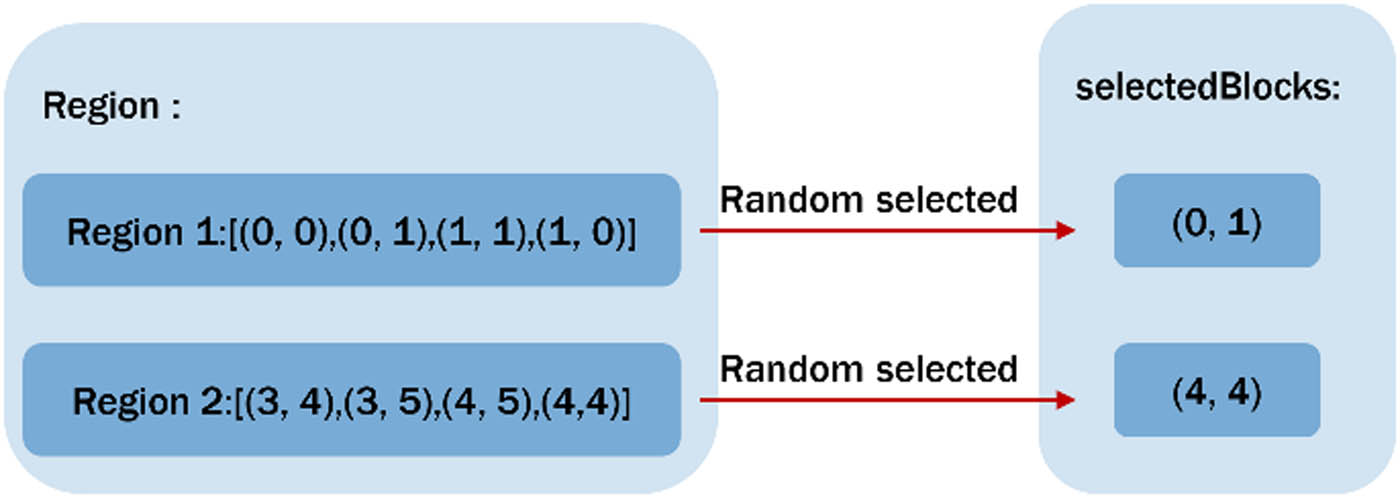
Schematic diagram of central coordinate selection.
5 3D simulation
The design and presentation of clustered pile fabrics are achieved through the crucial step of 3D simulation. The appearance and texture of pile fabrics are visually demonstrated, and their visual effects under different lighting conditions are accurately simulated through 3D simulation. In this study, Visual Studio 2019 was used as the simulation platform, with C# and JavaScript programming languages combined to accomplish the 3D simulation of clustered pile fabrics. The geometric model data are processed and coordinate points calculated by the back-end using C#, while model rendering is handled by the front-end using JavaScript.
5.1 Lighting model
In the 3D simulation of pile fabrics, the Phong lighting model [24] is employed to simulate lighting effects. Variations in light and shadow on the surface of objects are effectively reproduced by the Phong lighting model through the consideration of ambient light, diffuse light, and specular reflection. As illustrated in Figure 8, the superposition of these three lighting conditions is rendered, clearly demonstrating the influence of each type of reflected light on the model. Specifically, ambient light is used to simulate the base brightness uniformly distributed across the scene, diffuse light is applied to describe the isotropic scattering of light on the fabric surface, and specular reflection is responsible for simulating the gloss in highlight areas. By applying the Phong lighting model to the geometric model of the pile fabric, the lighting characteristics of the fabric are successfully recreated, enhancing the light and shadow effects from different directions, thereby improving the realism of the 3D simulation.
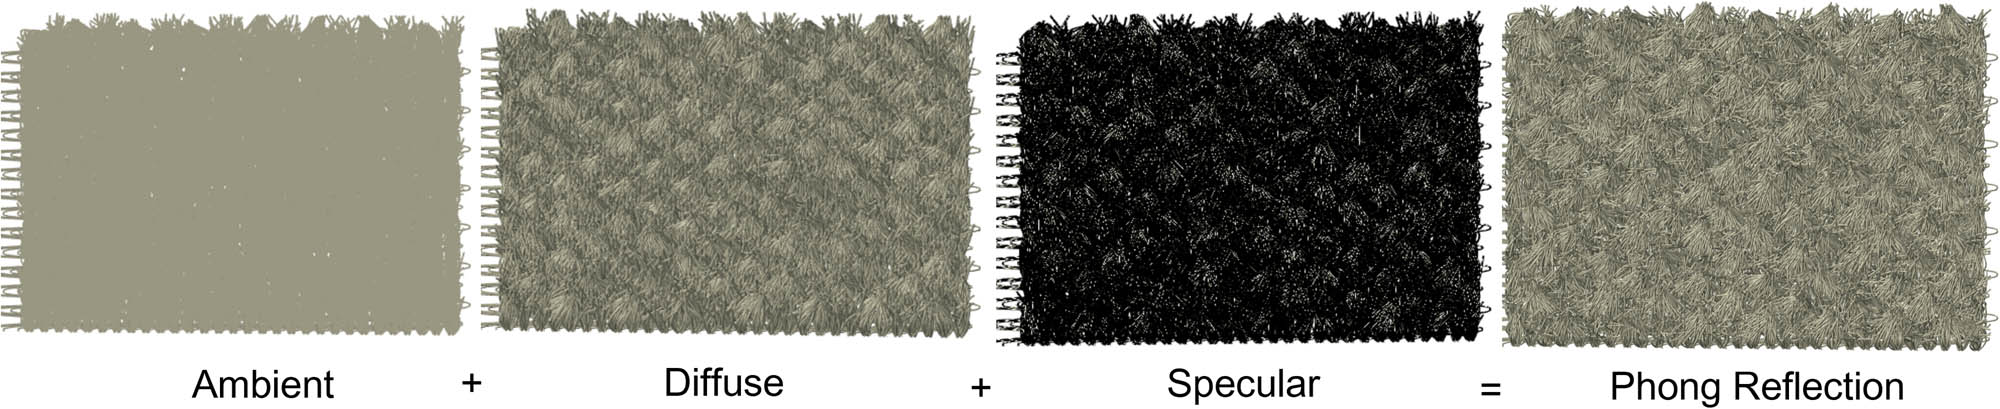
Performance of material under different lighting conditions and the superposition of light effects.
To further explain the application of the Phong lighting model in pile fabric simulation, a diagram in Figure 9 is presented, showing the decomposition of lighting angles and providing a detailed analysis of the relationships between the vectors. In the figure, vector L is used to represent the direction of reflected light toward the light source, vector N denotes the normal direction of the surface, and vector R indicates the direction of reflected light relative to L . The angle δ is used to represent the angle of incidence, i.e., the angle between the incident light L and the normal N , while the angle θ is used to represent the angle between the reflected light R and the normal N . This decomposition of lighting angles further clarifies how each angle influences light intensity and direction, thereby determining the brightness and shadow effects in the final simulation image. The final total lighting intensity I z is calculated by the following formula:
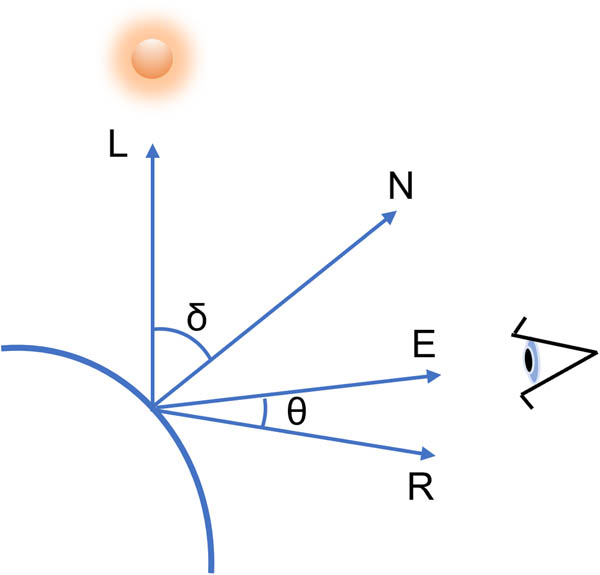
Illustration of lighting angle decomposition.
where k a , k d , and k s are defined as the ambient light reflection coefficient, diffuse reflection coefficient, and specular reflection coefficient, respectively. i a , i d (g), and i s (g) are represented as the ambient light intensity, diffuse light intensity, and specular light intensity, respectively. n indicates the number of light sources, and λ represents the material’s specular exponent. According to the lighting calculation formula in equation 8, the Phong lighting model comprehensively considers these angle-related factors, with the visual effects of real lighting on fabric surfaces simulated through the superposition of ambient light, diffuse light, and specular reflection.
To verify the effect of the Phong lighting model in pile fabric simulation, the simulation results under different lighting conditions are displayed in Figure 8. It has been shown through experiments that more delicate and realistic effects are produced when simulating the highlight and shadow areas of pile fabrics using the Phong lighting model.
On this basis, multiple directional light sources were introduced to further optimize the uniformity and realism of the lighting. The lighting coordinates of these directional lights were precisely set at different angles to ensure that the fabric surface could be evenly illuminated from multiple directions, thereby reducing the phenomenon of overly concentrated shadows. In this study, when directional light sources were utilized, the randomness of pile fiber orientation was considered, and light sources primarily illuminating from the front of the fabric were employed, including the directions (−1,1,1), (1,1,1), (−1,−1,1), (1,−1,1), and (0,0,1). These directional lights ensured that the pile fibers at various angles on the fabric’s front surface were evenly illuminated, creating natural shadow effects. By combining these directional lights, the model was able to more accurately reproduce the fabric’s appearance under natural lighting. The final experimental results showed that the simulation images produced using the Phong lighting model and multiple directional lights more closely resembled the gloss and texture details of real pile fabrics, demonstrating the superiority of this method in simulating complex fabric structures.
5.2 Blurring process
In the process of 3D simulation, blurring techniques are employed to better replicate the visual effect and realism of clustered pile fabrics. Blurring is used to smooth the pixels of the rendered image, effectively reducing sharp edges and noise, thereby enhancing the soft texture of the fabric. During front-end rendering, post-processing effects provided by Three.js are utilized, specifically implementing horizontal and vertical blurring steps. This approach allows for the maintenance of model details while making the appearance more closely resemble real pile fabrics.
To achieve the aforementioned blurring effect, the 3D scene is rendered to an intermediate texture object, effectively saving the initial render result onto a texture. Subsequently, horizontal and vertical blur shaders are applied to process the texture on a per-pixel basis. This texture-based blurring method allows for flexible adjustment of blur intensity to accommodate different display needs and visual effects. As shown in Figure 10, the 3D simulation image after blurring significantly enhances the visual realism and softness of the pile fabric compared to the unprocessed image, demonstrating the effectiveness and practicality of this method.
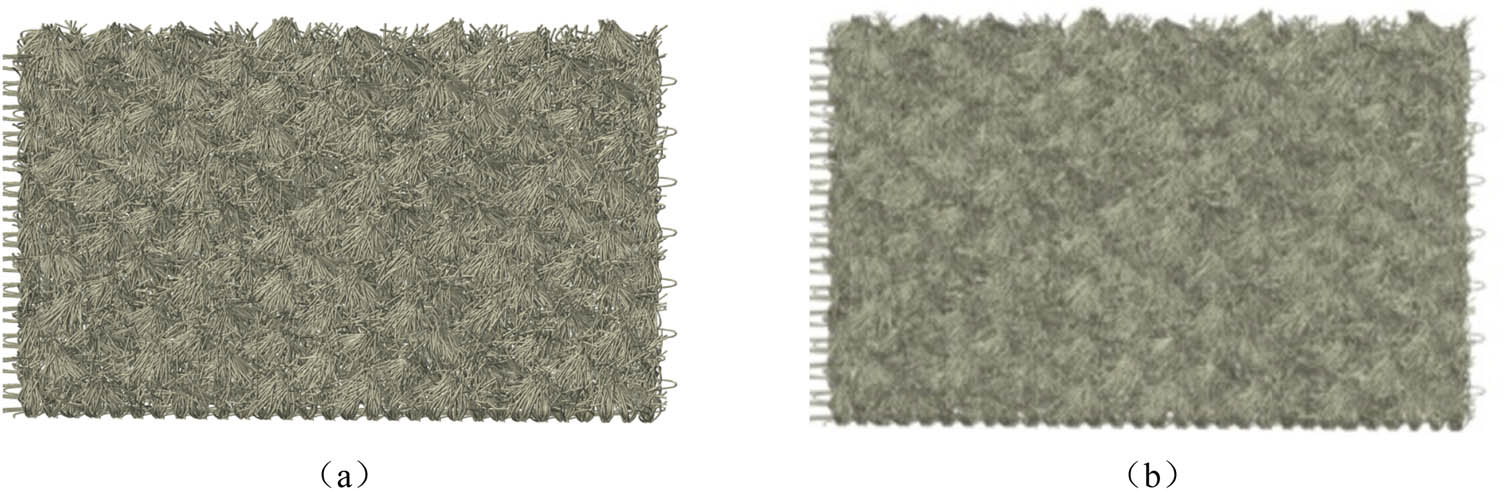
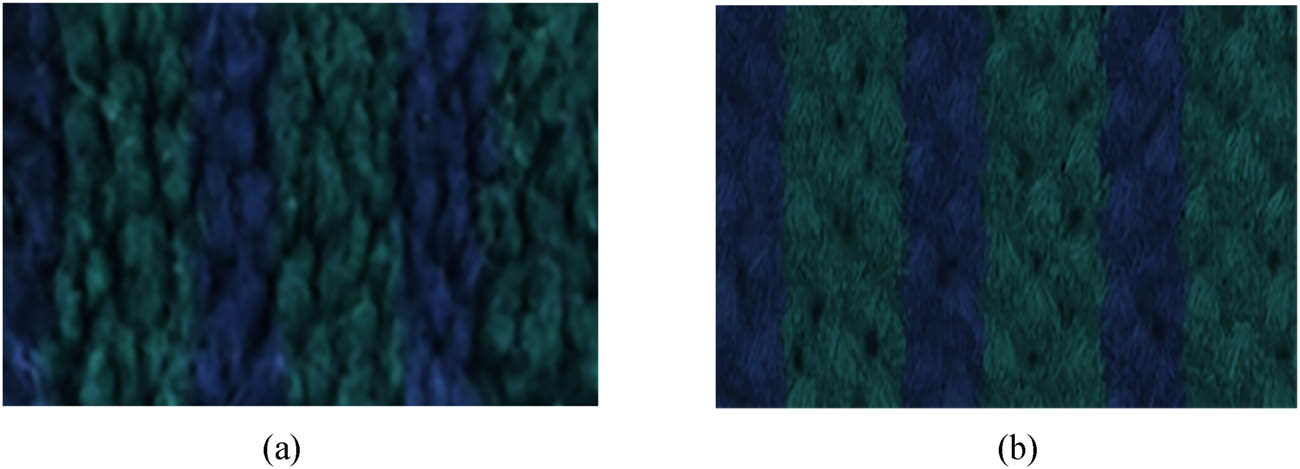
Comparison of blurring process for clustered pile fabric: (a) before blurring and (b) after blurring.
5.3 Experimental results
In the simulation implementation presented in this study, the geometric model of the pile fabric was constructed based on the aggregation-state information identified by the DFS algorithm. The specific implementation process is illustrated in Figure 11, which outlines the detailed steps and logical relationships involved in the simulation.
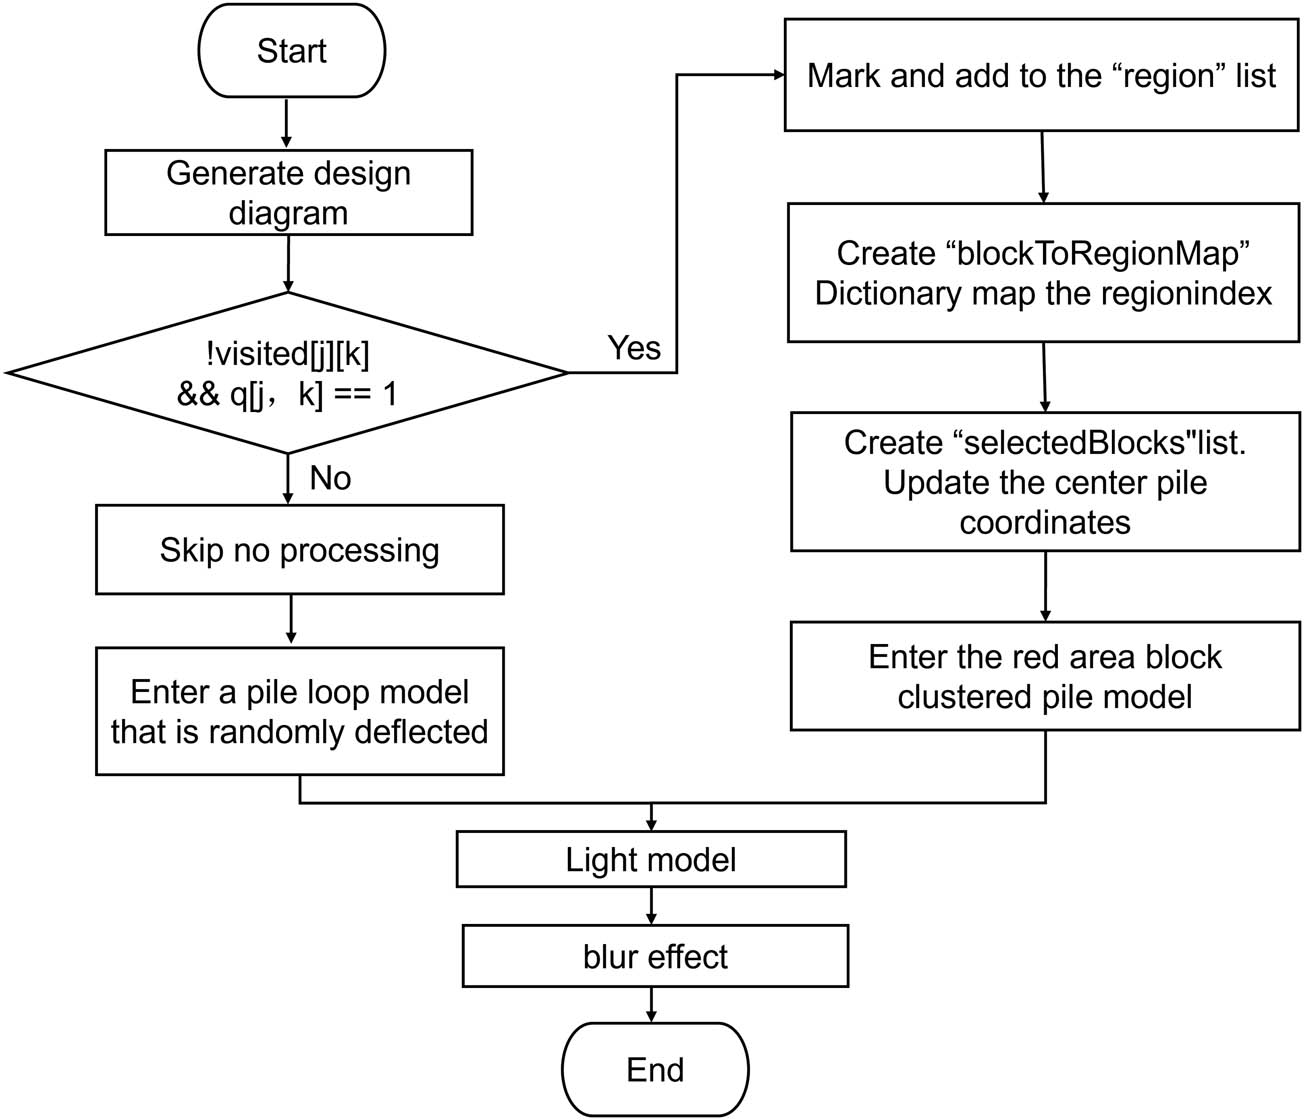
Flowchart of the 3D simulation implementation for clustered pile fabrics.
To validate the effectiveness of the proposed method, the generated 3D simulation was compared with the actual pile fabric. The experimental results indicate that the proposed method not only visually replicates the true appearance of the pile fabric but also achieves a high level of precision and detailed representation. In this study, the pile height of the solid colored clustered pile fabric was recorded as 3 mm, while the pile height of the jacquard clustered pile fabric was recorded as 5 mm. According to the geometric principles of clustered pile structures discussed in Section 3.2, an increase in height results in corresponding changes in the aggregation angle, leading to variations in the appearance height of the clustered pile. This effect can be observed in Figures 12(b) and 13(b). Furthermore, a comparison with the actual fabric images, as shown in Figures 12 and 13, clearly demonstrates the high degree of similarity in height between the two. This result confirms the practicality and reliability of the proposed method, highlighting its promising application potential.
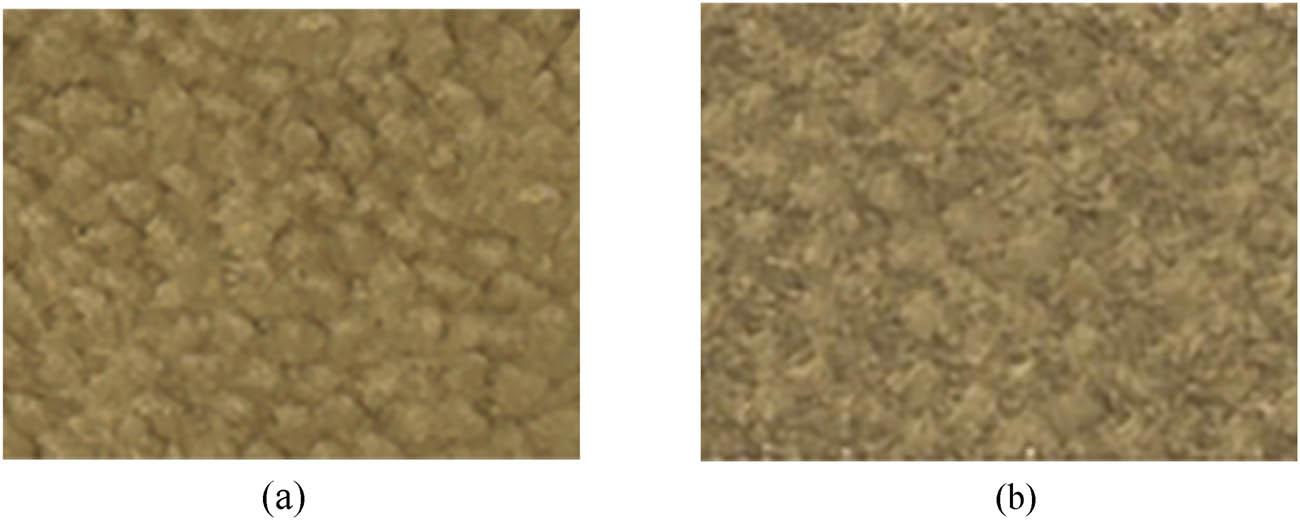
Simulation of solid color clustered pile fabrics: (a) physical picture and (b) fabric simulation.
Simulation of jacquard clustered pile fabrics: (a) physical picture and (b) fabric simulation.
6 Conclusion
A 3D simulation method for clustered pile fabrics based on the DFS algorithm is proposed in this study. First, a mathematical model for the threading, backing yarn, and pile design of the fabric is established. By constructing a pile design diagram, the DFS algorithm is utilized to identify and classify different clustered regions within the design. Experimental results indicate that this method effectively traverses all regional nodes of the fabric and accurately identifies regions with varying degrees of clustering, providing a reliable data foundation for subsequent geometric modeling.
In this study, a model of a single pile loop was established, where the number of pile fibers within the model can be adjusted according to actual requirements. The pile fibers can be randomly deflected along the Y-axis and Z-axis, resulting in a disordered state. Subsequently, geometric transformation algorithms combined with rotational transformations and trigonometric solutions are employed to cluster the pile fibers from multiple pile loop models together, forming a tufted aggregation state. Finally, the pile model aligns according to the identified jacquard grid information, reflecting the corresponding orientation. This method simplifies the modeling process of complex fabric structures.
By incorporating the Phong lighting model, the interactions of ambient light, diffuse light, and specular reflection are accurately simulated, successfully reproducing the lighting characteristics of pile fabrics and enhancing the visual depth and texture of the simulation images. Additionally, blur processing is introduced during rendering to simulate the smooth transitions and fine surface details between pile fibers. By combining the lighting model with blur processing, the 3D simulation results generated in this study closely resemble real pile fabrics, exhibiting a high degree of realism and natural visual effects.
Through the application of the DFS algorithm and geometric modeling techniques, an efficient and reliable solution for the 3D simulation of tufted pile fabrics is provided in this study, demonstrating high practicality and reliability. Future research can further optimize the algorithms, improving simulation speed and accuracy and expanding the application of this method to other types of fabric simulations.
Acknowledgement
The authors acknowledged the financial support provided by the Natural Science Foundation of Jiangsu Province (BK20231056) and “the Fundamental Research Funds for the Central Universities” (JUSRP122003).
-
Funding information: The research was financially supported by Natural Science Foundation of Jiangsu Province (BK20231056) and “the Fundamental Research Funds for the Central Universities” (JUSRP122003).
-
Author contributions: Songsong Guan proposes a design and 3D simulation method for clustered pile fabrics. A pile pattern is constructed, and a depth-first search algorithm is used to identify the pattern. The Phong lighting model is introduced, and the simulation results are subjected to blurring, resulting in a softer and more natural appearance for the pile fabric. These contributions achieve the 3D simulation of clustered pile fabrics. Gaoming Jiang verified the simulated sample fabrics and carried out the program design of the relevant mathematical models.Bingxian Li conducted comparative analysis of the simulation effects and tested the feasibility of the design method.
-
Conflict of interest: The authors state no conflict of interest.
-
Ethical approval: The conducted research is not related to either human or animal use.
-
Data availability statement: The datasets generated during and/or analyzed during the current study are available from the corresponding author on reasonable request.
References
[1] Wang, W. (2023). Modeling and 3D simulation of spacer fabric. Wuhan Textile University, Wuhan, China.Suche in Google Scholar
[2] Zhang, L. Z. (2010). Three-dimensional computer simulation of warp-knitted fabrics. Jiangnan University, Wuxi, China.Suche in Google Scholar
[3] Zhang, L. Z., Jiang, G. M., Gao, W. D. (2009). 3D simulation of two-bar warp-knitted structures. Journal of Donghua University, 2009, 26(04), 423–8.Suche in Google Scholar
[4] Zhang, L. Z., Jiang, G. M., Gao, W. D. (2009). 3D simulation and dynamic realization of warp-knitted structure. Journal of Textile Research, 2009, 30(02), 125–9.Suche in Google Scholar
[5] Xu, Q., Zhang, C. Q. ( 2019). Realistic simulation of solid solor long-pile plush fabrics based on image processing. Light Textile Industry and Technology,48(03), 61–4.Suche in Google Scholar
[6] Yang, X. D., Xu, Z., Yang, J., Wang, T. (2000). The cluster hair model. Graphical Models. 62(2),85–103.10.1006/gmod.1999.0518Suche in Google Scholar
[7] Fuhrer, M., Jensen, H. W., Prusinkiewicz, P. (2004). Modeling hairy plants. Pacific Conference on Computer Graphics and Applications, pp. 217–26.10.1109/PCCGA.2004.1348352Suche in Google Scholar
[8] Yang, G., Cao, W. Q., Huang, X. Y. (2008). A fur modeling system based on multi-layer textured slices. Journal of Image and Graphic, 13(5), 984–90.10.11834/jig.20080522Suche in Google Scholar
[9] Zhang, A. J. (2018). Study on the computer-aided design and simulation of warp knitted plush fabric. Jiangnan University, Wuxi, China.Suche in Google Scholar
[10] Zhang, A. J., Li, X. X., Jiang, G. M., Dong, Z. J., Cong, H. L. (2018). 3-D simulation of double-bar plush fabrics with Jacquard patterns. Autex Research Journal, 18(3), 243–50.10.1515/aut-2017-0029Suche in Google Scholar
[11] Zhang, A. J., Jiang, G. M., Li, X. X., Cong, H. L. (2018). Simulation of simulation of warp knitted plush fabric based on fractal noise and geometry shader. Journal of Textile Research, 39(02), 171–6.Suche in Google Scholar
[12] Zhang, A. J., Li, X. X., Ma, P. B., Xiong, Y., Jiang, G. M. (2016). 3D simulation model of warp-knitted patterned velvet fabric. International Journal of Clothing Science and Technology, 28(6), 794–804.10.1108/IJCST-01-2016-0006Suche in Google Scholar
[13] Li, N. Q. (2020). Research on real-time rendering method of animal fur based on mobile platform. Xihua University, Chengdu.Suche in Google Scholar
[14] Lee, J., Kim, D. K., Kim, H. S., Henzel, C., Kim, J. I., Lim, M. G. (2010). Real–time fur simulation and rendering. Computer Animation and Virtual Worlds, 21(3–4), 311–20.10.1002/cav.361Suche in Google Scholar
[15] Mo, Y. L. (2022). Research on hair physics simulation based on deep learning. Shanghai Jiao Tong University, Shanghai, China.Suche in Google Scholar
[16] Jiang, J. W. (2020). A real-time hair simulation method with heptadiagonal decomposition on mass spring system. Shanghai Jiao Tong University, Shanghai, China.10.1016/j.gmod.2020.101077Suche in Google Scholar
[17] Zheng, Y. J., Jin, Z. R., Li, M. R., Huang, H. B., Ma, C. Y., Cui, S. G., et al. (2023). Transfer synthetic to real using strand and depth maps for single-view 3D hair modeling. Proceedings of the IEEE/CVF Conference on Computer Vision and Pattern Recognition, pp. 12726–35.10.1109/CVPR52729.2023.01224Suche in Google Scholar
[18] Qiao, Z., Li, T. X., Hui, L., Liu, R. J. (2023). A deep learning–based framework for fast generation of photorealistic hair animations. IET Image Processing. 17(2), 375–87.10.1049/ipr2.12638Suche in Google Scholar
[19] Han Y. M., Miao, X. H., Yu, G. Q., Qin, B. (2014). Production equipment and process characteristics of double needle bed warp knitted velvet fabrics. Knitting Industry, 12, 12–4.Suche in Google Scholar
[20] Han, Y. M., Miao X. H., Huang, Z. Q. (2015). Production process of warp knitted double-sided Flannel. Knitting Industry, 06, 26–8.Suche in Google Scholar
[21] Huang, X. H. (2012). Process design of warp-knitted super soft double-sided short pile products. Knitting Industry, 06, 14–8.Suche in Google Scholar
[22] Yang, M. L., Jiang, G. M., Wang, T., Li, B. X. (2023). Design and three-dimensional simulation of warp knitted spacer fabrics for shoes. Journal of Textile Research, 44(08), 96–102.Suche in Google Scholar
[23] Xiong, Y., Miao, X. H., Zhang, A. J., Jiang, G. M. (2016). Computer simulation for warp-knitted brushed fabric with patterned piles. Textile Research Journal, 86(15),1659–67.10.1177/0040517515595033Suche in Google Scholar
[24] Phong, B. T. (1975). Illumination for computer generated pictures. Communication of the ACM,18(06), 311–7.10.1145/360825.360839Suche in Google Scholar
© 2024 the author(s), published by De Gruyter
This work is licensed under the Creative Commons Attribution 4.0 International License.
Artikel in diesem Heft
- Characterization of viscoelastic properties of yarn materials: Dynamic mechanical analysis in the transversal direction
- Analysis of omni-channel implementations that are preferred by consumers in clothing sector
- Structural modeling and analysis of three-dimensional cross-linked braided preforms
- An experimental study of mechanical properties and comfortability of knitted imitation woven shirt fabrics
- Technology integration to promote circular economy transformation of the garment industry: a systematic literature review
- Research on T-shirt-style design based on Kansei image using back-propagation neural networks
- Research on She nationality clothing recognition based on color feature fusion with PSO-SVM
- Accuracy prediction of wearable flexible smart gloves
- Preparation and performance of stainless steel fiber/Lyocell fiber-blended weft-knitted fabric
- Development of an emotional response model for hospital gown design using structural equation modeling
- Preparation and properties of stainless steel filament/pure cotton woven fabric
- Facemask comfort enhancement with graphene oxide from recovered carbon waste tyres
- Use of enzymatic processes in the tanning of leather materials
- Optical-related properties and characterization of some textile fibers using near-infrared spectroscopy
- Network modeling of aesthetic effect for Chinese Yue Opera costume simulation images
- Predicting consumers’ garment fit satisfactions by using machine learning
- Non-destructive identification of wool and cashmere fibers based on improved LDA using NIR spectroscopy
- Study on the relationship between structure and moisturizing performance of seamless knitted fabrics of protein fibers for autumn and winter
- Antibacterial and yellowing performances of sports underwear fabric with polyamide/silver ion polyurethane filaments
- Numerical and experimental analysis of ballistic performance in hybrid soft armours composed of para-aramid triaxial and biaxial woven fabrics
- Phonetic smart clothing design based on gender awareness education for preschoolers
- Determination of anthropometric measurements and their application in the development of clothing sizing systems for women in the regions of the Republic of Croatia
- Research on optimal design of pleated cheongsam based on Kano–HOQ–Pugh model
- Numerical investigation of weaving machine heald shaft new design using composite material to improve its performance
- Corrigendum to “Use of enzymatic processes in the tanning of leather materials”
- Shaping of thermal protective properties of basalt fabric-based composites by direct surface modification using magnetron sputtering technique
- Numerical modeling of the heat flow component of the composite developed on the basis of basalt fabric
- Weft insertion guideway design based on high-temperature superconducting levitation
- Ultrasonic-assisted alkali hydrolysis of polyethylene terephthalate fabric and its effect on the microstructure and dyeing properties of fibers
- Comparative study on physical properties of bio-based PA56 fibers and wearability of their fabrics
- Investigation of the bias tape roll change time efficiency in garment factories
- Analysis of foot 3D scans of boys from Polish population
- Optimization of garment sewing operation standard minute value prediction using an IPSO-BP neural network
- Influence of repeated switching of current through contacts made of electroconductive fabrics on their resistance
- Numerical calculation of air permeability of warp-knitted jacquard spacer shoe-upper materials based on CFD
- Compact Spinning with Different Fibre Types: An Experimental Investigation on Yarn Properties in the Condensing Zone with 3D-Printed Guiding Device
- Modeling of virtual clothing and its contact with the human body
- Advances in personalized modelling and virtual display of ethnic clothing for intelligent customization
- Investigation of weave influence on flame retardancy of jute fabrics
- Balloonless spinning spindle head shape optimisation
- Research on 3D simulation design and dynamic virtual display of clothing flexible body
- Turkish textile and clothing SMEs: Importance of organizational learning, digitalization, and internationalization
- Corrigendum To: “Washing characterization of compression socks”
- Study on the promotion multiple of blood flow velocity on human epidermal microcirculation of volcanic rock polymer fiber seamless knitted fabric
- Bending properties and numerical analysis of nonorthogonal woven composites
- Bringing the queen mother of the west to life: Digital reconstruction and analysis of Taoist Celestial Beings Worshiping mural’s apparel
- Modeling process for full forming sports underwear
- Retraction of: Ionic crosslinking of cotton
- An observational study of female body shape characteristics in multiracial Malaysia
- Study on theoretical model and actual deformation of weft-knitted transfer loop based on particle constraint
- Design and 3D simulation of weft-knitted jacquard plush fabrics
- An overview of technological challenges in implementing the digital product passport in the textile and clothing industry
- Understanding and addressing the water footprint in the textile sector: A review
- Determinants of location changes in the clothing industry in Poland
- Influence of cam profile errors in a modulator on the dynamic response of the heald frame
- Quantitative analysis of wool and cashmere fiber mixtures using NIR spectroscopy
- 3D simulation of double-needle bar warp-knitted clustered pile fabrics on DFS
- Finite element analysis of heat transfer behavior in glass fiber/metal composite materials under constant heat load
- Price estimation and visual evaluation of actual white fabrics used for dress shirts and their photographic images
- Effect of gluing garment materials with adhesive inserts on their multidirectional drape and bending rigidity
- Optimization analysis of carrier-track collision in braiding process
- Numerical and experimental analysis of the ballistic performance of soft bulletproof vests for women
- The antimicrobial potential of plant-based natural dyes for textile dyeing: A systematic review using prisma
- Influence of sewing parameters on the skin–fabric friction
- Validation by experimental study the relationship between fabric tensile strength and weave structures
- Optimization of fabric’s tensile strength and bagging deformation using surface response and finite element in stenter machine
- Analysis of lean manufacturing waste in the process flow of ready-to-wear garment production in Nigeria
- An optimization study on the sol–gel process to obtain multifunctional denim fabrics
- Drape test of fully formed knitted flared skirts based on 3D-printed human body posture
- Supplier selection models using fuzzy hybrid methods in the clothing textile industry