
Non-destructive identification of wool and cashmere fibers based on improved LDA using NIR spectroscopy
-
Xin Chen
 ,
Qingle Lan
,
Qingle Lan

Abstract
With the advancement of near-infrared (NIR) spectroscopy and chemometrics technology, non-destructive qualitative testing has been widely applied in many fields. Both wool and cashmere are keratin protein fibers with many similarities in tissue structure, making it very difficult to distinguish between them. In order to achieve rapid and non-destructive identification of wool and cashmere, an improved linear discriminant analysis (ILDA) algorithm combined with NIR spectroscopy technology is proposed. The proposed method can also be used for the classification of extremely similar fibers and substances, with better classification performance. First, the spectral data of wool and cashmere are collected using an NIR spectrometer so as to reduce the influence of noise in the spectra; data preprocessing methods are used to correct the collected fiber spectra. Then, principal component analysis (PCA), linear discriminant analysis (LDA), and ILDA are used to extract the characteristic variables from the spectral data. Finally, the extracted characteristic variables are input into the machine learning algorithm K-nearest neighbor (K-NN) classifier. In the experimental stage, three dimensionality reduction methods (PCA, LDA, and ILDA) are evaluated using the K-NN classification model. The fiber classification accuracy can reach 97% when using the ILDA method for dimensionality reduction. The results show that the proposed method is effective for the qualitative detection of different types of wool and cashmere fibers.
1 Introduction
Cashmere, also known as goat cashmere, is an extremely expensive animal fiber with excellent qualities such as softness, lightness, elasticity, and delicate touch [1]. Its production accounts for only 0.2% of the world’s animal fibers, which contributes to its high price. It is commonly referred to as the “fiber queen.” Wool fibers have similar properties to cashmere in terms of color, appearance, burning smell, and chemical composition, making it very difficult to distinguish between them [2]. Some unscrupulous merchants try to mix wool with cashmere and sell it at high prices and even use wool as a substitute for cashmere. In order to safeguard the consumer’s rights, how to accurately and efficiently identify wool and cashmere fibers is an urgent and hot issue that needs to be addressed [3]. Currently, the main methods for identifying wool and cashmere fibers include microscopic examination [4], DNA testing [5], liquid chromatography/mass spectrometry (LC/MS) [6], solution method, and dyeing method [7]. Although these methods can achieve comparatively high precision, the sample preprocessing is very cumbersome, often requiring the addition of some chemical reagents, which may destroy the structure of fibers. At the same time, time-consuming sample preparation, exorbitant detection expense, and professional skills are hurdles to overcome. In recent years, with the development of artificial intelligence (AI), some scholars have obtained microstructural images of fibers by scanning electron microscopy and exploiting computer image processing technology [8] or computer vision technology [9]. Based on the appearance morphology indicators of fibers such as fiber diameter and scale density, they conduct statistical analyses of the measured data, establish corresponding statistical models, and use pattern recognition to automatically identify cashmere and wool fibers. These methods have faster detection speed but require a large sample size, and the pixel of sample images is high. Additionally, it is challenging to handle fibers with a missing scale. Therefore, there is an urgent need to develop a simple, fast, and non-destructive detection method to minimize damage to qualified textile fiber components.
Near-infrared (NIR) spectroscopy detection technology is a simple, fast, low-cost, and non-destructive analysis technique that can qualitatively and quantitatively analyze the absorption characteristics of electromagnetic waves based on the composition of a certain material [10]. Due to the advantages of NIR spectra analysis technology, it has been applied in many fields of the industrial chain, such as food [11], chemistry [12], forage [13], and medicine [14]. NIR technology has also achieved certain results in the identification of fiber types and analysis of component contents. Zhou et al. developed a reliable method based on NIR spectroscopy to estimate the content of wool–cashmere blended fibers. They identified six characteristic wavelength bands and used two multiple linear regression equations for chemical stoichiometric analysis, establishing a model to predict the content of cashmere in mixed samples, achieving good results [15]. Riba et al. used attenuated total reflectance Fourier transform infrared technology combined with principal component analysis (PCA), canonical variable analysis (CVA), and K-nearest neighbors (K-NN) mathematical methods to effectively identify and classify seven pure component fibers, providing a technical reference for fiber classification [16]. In 2019, Zhou et al. prepared seven common fibers and captured the subtle differences in chemical composition and morphological features using NIR spectroscopy, thereby displaying characteristic spectral curves for each fiber. PCA was used to select six specific spectral bands of interest for wool and cashmere fibers, and the absorbance intensities were input into the linear discriminant analysis (LDA) classifier. Wool and cashmere were grouped and distributed in two different regions, achieving an identification rate of over 99% [17]. Anceschi et al. applied NIR spectroscopy to differentiate between virgin and recycled cashmere fibers. By combining PCA with soft independent modeling of class analogy (SIMCA), fibers were classified into two different categories, allowing for the identification of recycled and virgin cashmere. Calibration curves were developed to quantify the amount of recycled cashmere mixed with virgin fibers. The quantitative calibration results showed a standard error of prediction of 5.8% w/w [18].
In summary, with the development of NIR technology, significant progress has been made in the application of NIR technology to textile fibers testing, but there are still serious open challenges. On the one hand, there is currently no complete dataset for wool and cashmere detection based on NIR, and the existing research has limitations to generalize due to reliability, detection cost, and accuracy. On the other hand, most researchers use common chemometric methods (such as PCA) for modeling and selecting main components. After PCA processing, six to ten main components are generally selected for modeling, which increases the complexity of the model. If a small number of main components are selected, the probability of overlap is increased, leading to an increase in error rate, and the model faces the difficulty of balancing between complexity and accuracy. LDA can be used for dimension reduction and classification tasks in data preprocessing, but because the LDA algorithm reduces the dimension of K categories to at most K-1 dimensions, it is often used as a classifier in practical applications. In contrast, the improved linear discriminant analysis (ILDA) dimension reduction method in this article is more applicable due to the change in the traditional usage as a classifier. Therefore, the main contributions and innovations of this article are reflected in the following aspects:
Self-built wool and cashmere dataset: The categories of wool and cashmere used in the current research are not diverse enough. Therefore, this study collects samples from different regions and breeds at home and abroad and obtains spectral data of samples by scanning NIR spectrometers to build the dataset.
Spectral preprocessing: The combination of the S-G + SNV preprocessing method is used to effectively improve the smoothness of the spectrum, reduce noise in the spectrum, and reduce the adverse effects of factors and environmental conditions other than the analyte of interest, thereby improving the robustness of the subsequent analysis model and the accuracy of the prediction results.
ILDA model: The principle is based on the LDA model to maximize the inter-class mean and minimize the intra-class variance for different categories. Here, to obtain two-dimensional features, the NIR spectra of seven common fabrics are selected, which are the most similar and different from the wool and cashmere spectra, as a reference, thus obtaining two-dimensional features for wool and cashmere.
2 Methods
The experimental design is shown in Figure 1. The preprocessing methods include no treatment, SavitzkyGolay smoothing (S-G), standard normal variate (SNV), and S-G + SNV combination. The modeling method is the K-NN. The K value in the K-NN model has a significant impact on the accuracy of the classification results. However, there is no regularity in the selection of K values in K-NN. In order to find the optimal parameters and achieve the best accuracy, experiments are conducted to search for the optimal value within the range from 1 to 40.
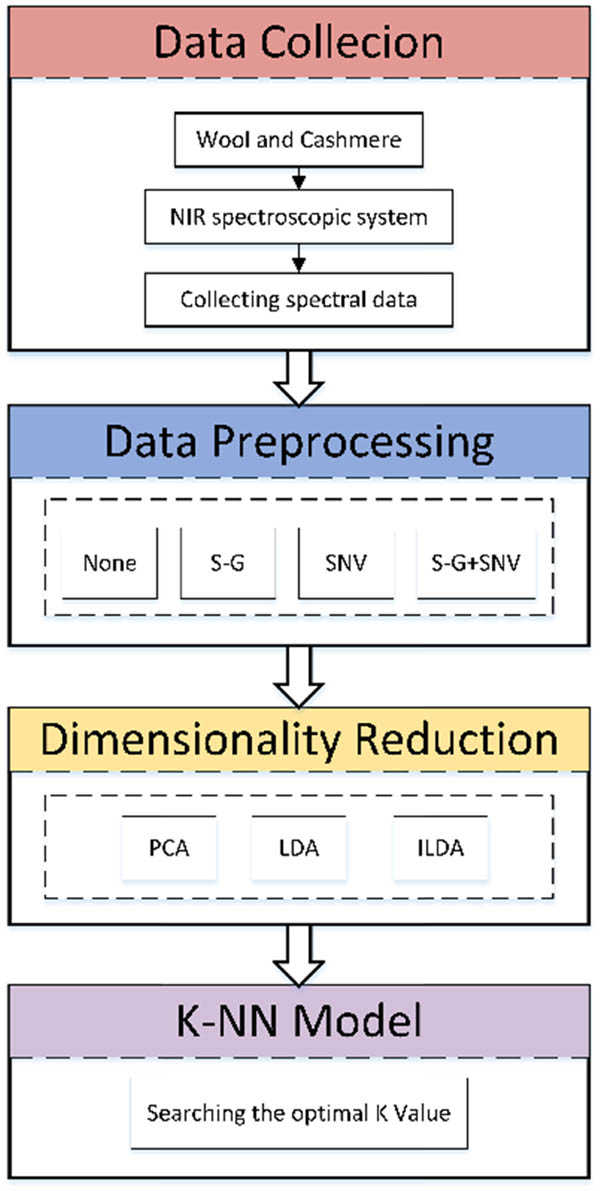
Flowchart of experimental design.
2.1 Sample source and instrumentation
In the collection of samples, samples of different varieties of wool and cashmere fibers from different regions domestically and internationally are collected, such as domestic Xinjiang fine wool, Shaanxi native fine wool, Ordos Albas white cashmere goat, Tibetan black goat cashmere, and foreign varieties such as Australian Merino wool, Mongolian purple cashmere, and Afghan purple cashmere, totaling 330 samples. Among them, different fineness are also selected for the same variety, such as 18.5, 19.5, and 20.5 nm on Shaanxi native fine wool. Different age fibers are also selected for the same variety, such as silk wool and silk lamb wool.
The spectral device used in this study is the RZNIR7900 NIR spectrometer (Shanghai Ranzi Industrial Co., Ltd.); the experimental equipment is shown in Figure 2. The sample measurement is performed by diffuse reflectance from above, and the spectral data are collected in the wavelength range from 1,000 to 2,500 nm with a resolution of 1 nm. Data analysis is carried out using the built-in spectral analysis software CloudNIR in the NIR spectrometer.
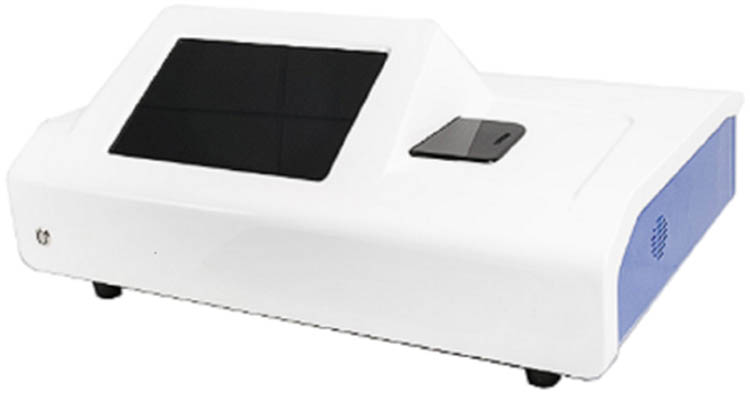
RZNIR7900 NIR spectrometer.
2.2 Spectral preprocessing and selection
For the analysis of NIR spectral data, the preprocessing step is vital to the performance evaluation. Spectral data preprocessing has two main objectives: first, to reduce the adverse effects of elements and environmental conditions other than the analyte of interest, which can improve the robustness of subsequent analysis models and the accuracy of prediction results; second, to compress the data and improve modeling speed [19]. Accordingly, to disperse the influence of scattering on the spectrum, spectral preprocessing methods such as S-G, SNV, and their combination are used. S-G is a moving window weighted averaging algorithm based on the least squares method, which can effectively improve the smoothness of the spectrum and reduce noise in the spectrum [20]. SNV and multiplicative scatter correction (MSC) are used to correct spectral errors caused by particle scattering in the samples. In ideal conditions, MSC is mainly used to eliminate the influence of linear scattering, and SNV is generally considered to have a stronger correction ability than MSC [21]. So, the SNV method is chosen here. Due to the complexity of cashmere and wool samples, the above single spectral preprocessing methods may not provide ideal prediction results. As a result, the combination of S-G and SNV, i.e., S-G combined with SNV followed (referred to as S-G + SNV), is used for spectral preprocessing.
To select the optimal preprocessing algorithm, a K-NN model is established using the original spectrum and the preprocessed spectral data, and the discriminant accuracy of the model is used to determine the optimal preprocessing algorithm.
2.3 Feature dimensionality reduction
NIR spectroscopy data usually have a high number of dimensions. When modeling with full spectra, the intensive computational load reduces the efficiency of the model. Additionally, the overlap of absorption peaks in the spectra generates redundant information that affects the performance of the model. Hence, before modeling the spectroscopy data, feature extraction methods are often used to reduce the dimensionality of the spectra. Feature extraction constructs a new feature matrix based on the relationships between features in the original spectral matrix [22]. The new variables can maximize the retention of the data characteristics of the original variables without any loss of information [23]. In this study, PCA, LDA, and ILDA algorithms are all used to reduce the dimensionality of NIR spectral data.
2.3.1 ILDA
LDA, also known as Fisher linear discriminant, is a technique based on linear discriminant functions that maximize the between-group variance and minimize the within-group variance [24]. It can be used for dimensionality reduction and classification tasks in data preprocessing. However, the LDA algorithm reduces the dimensions to at most K-1 for K categories, and reducing binary samples to one-dimensional features may result in high overlap in the data. Thus, it is commonly used in practical applications for classification tasks [17]. In order to address the issue of acquiring two-dimensional characteristics, other similar NIR spectra fabrics are introduced as references, allowing the algorithm to reduce the dimensionality to two. With respect to the selection of other fabrics, seven common fabrics are chosen, including acetate, polyamide, acrylic, polyester, viscose, cotton, and mulberry silk. Among them, the two classes with the most similar and largest spectral differences are selected to observe whether there are significant differences in the NIR spectra of other fabrics in terms of dimensionality reduction. Three categories are used as input to reduce the dimensions to two. Perfect binary dimensionality reduction is achieved by outputting only the dimensions of wool and cashmere categories for the reduced-dimensional features. PCA is the most widely used unsupervised dimensionality reduction method, while LDA is the most widely used supervised dimensionality reduction method. Comparing ILDA with these two methods can better demonstrate the dimensionality reduction effect of ILDA. In comparison to PCA and LDA, ILDA has specific advantages. Unlike PCA, which selects the direction of sample point projection with the largest variance, ILDA selects the projection direction with the best classification performance. Compared to LDA, it can reduce to a greater number of dimensions and provide better classification results. The basic principles of the ILDA algorithm are as follows, and the algorithm flow chart is shown in Figure 3, input dataset D:
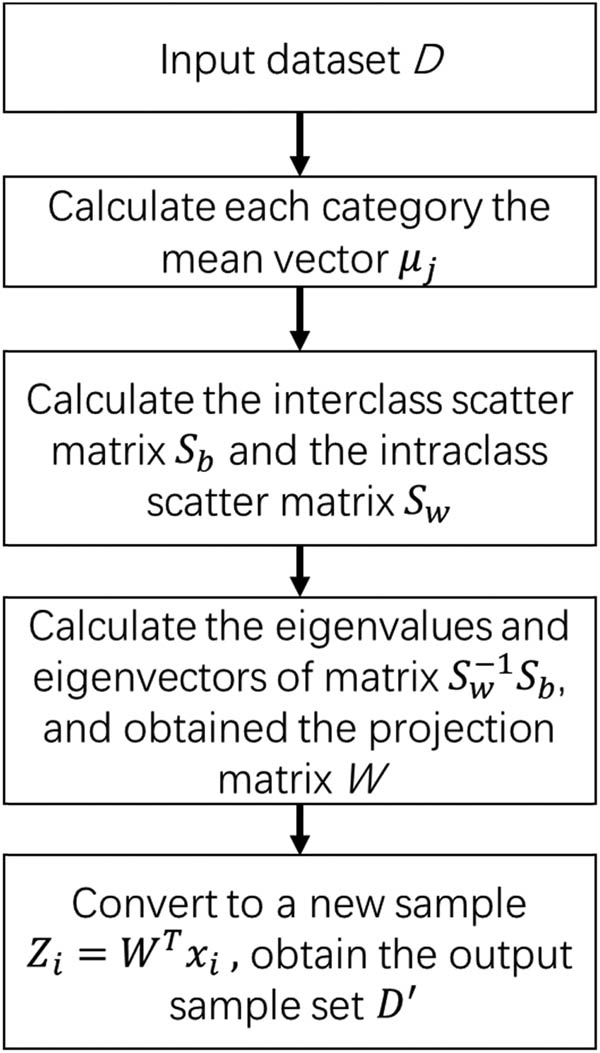
Flow chart of ILDA algorithm.
Any sample
This yields the interclass scatter matrix
where
Calculate the largest d eigenvalues of the matrix
Get the dataset after output dimensionality reduction like shown in equation (6)
2.4 Classification
In this study, a widely used qualitative identification model is employed, specifically, the K-NN model based on preprocessed spectra, to identify cashmere and wool samples. K-NN is a method that classifies objects based on the closest training samples in the feature space [25]. This method consists of two parts: first, determining the K nearest neighbors, and second, using these neighbors to determine the class type. The training data space D, which includes n samples, is described by the equation (7)
Suppose each sample
The entire dataset consists of C different classes. To determine the class of
2.5 Sample division and model evaluation criteria
Reasonable division of the sample set helps improve the accuracy of the model. KennardStone (K-S) is a widely used sample allocation method in qualitative analysis. The purpose of K-S is to evenly distribute the samples by sequentially selecting samples with the maximum Euclidean distance between each other [27]. In the analysis process using the K-S algorithm, the data are randomly divided into a calibration set and a validation set in a ratio of 3:2. Specifically, 108 spectral data are used as the calibration set for model analysis and model establishment, 72 spectral data are used as a validation set to verify the model, which was not involved in its establishment.
The confusion matrix method is used to comprehensively evaluate the performance of the established classification discriminant model. Each column represents the predicted values, and each row represents the true values. Sensitivity, specificity, and accuracy are used as three indicators to evaluate the model performance [28]. The sensitivity is defined as the true positive rate, measuring the classifier’s ability to identify positive instances, while specificity is the true negative rate, measuring the classifier’s ability to identify negative instances. The model accuracy is its ability to differentiate between true positive and true negative among all samples, with a maximum value of 1 and a minimum value of 0, a higher value indicates a better model. The calculation formulas for these three indicators are shown in equations (10)–(12)
where TP is the number of positive cases correctly predicted by the model from the sample data; TN is the number of negative cases correctly predicted from the sample data; FP is the number of positive cases incorrectly predicted from the sample data; and FN is the number of negative cases incorrectly predicted from the sample data.
3 Results and discussion
3.1 Data set preparation
Among all the collected 330 samples, 180 samples (100 wool, 80 cashmere) are randomly selected; the sample picture is shown in Figure 4(a). Before the experiment, the RZNIR7900 NIR spectrometer is warmed up for 30 min to ensure its smooth detection performance, and the self-test is carried out, which includes an energy test, X-axis frequency correction, and Y-axis repeatability test. After the self-test is completed, the wool or cashmere samples are placed on a sample rack, and NIR spectral graphs are collected using a reflection mode. Different areas are selected on each sample for merging. The merged wool or cashmere samples are then placed in a large sample pool for spectral data collection after the spectral scanning is stabilized. The scanning is performed 32 times, with five measurements on the front and five on the back of each sample. The average value of these ten measurements is taken. To avoid a low signal-to-noise ratio, the first 200 nm and the last 200 nm are removed from the spectral data, and the wavelength range of 1,200–2,300 nm is used for calculations; the spectral data are shown in Figure 4(b). All the algorithms are executed using PyCharm2020, Python 3.8 under the Windows 10 system.
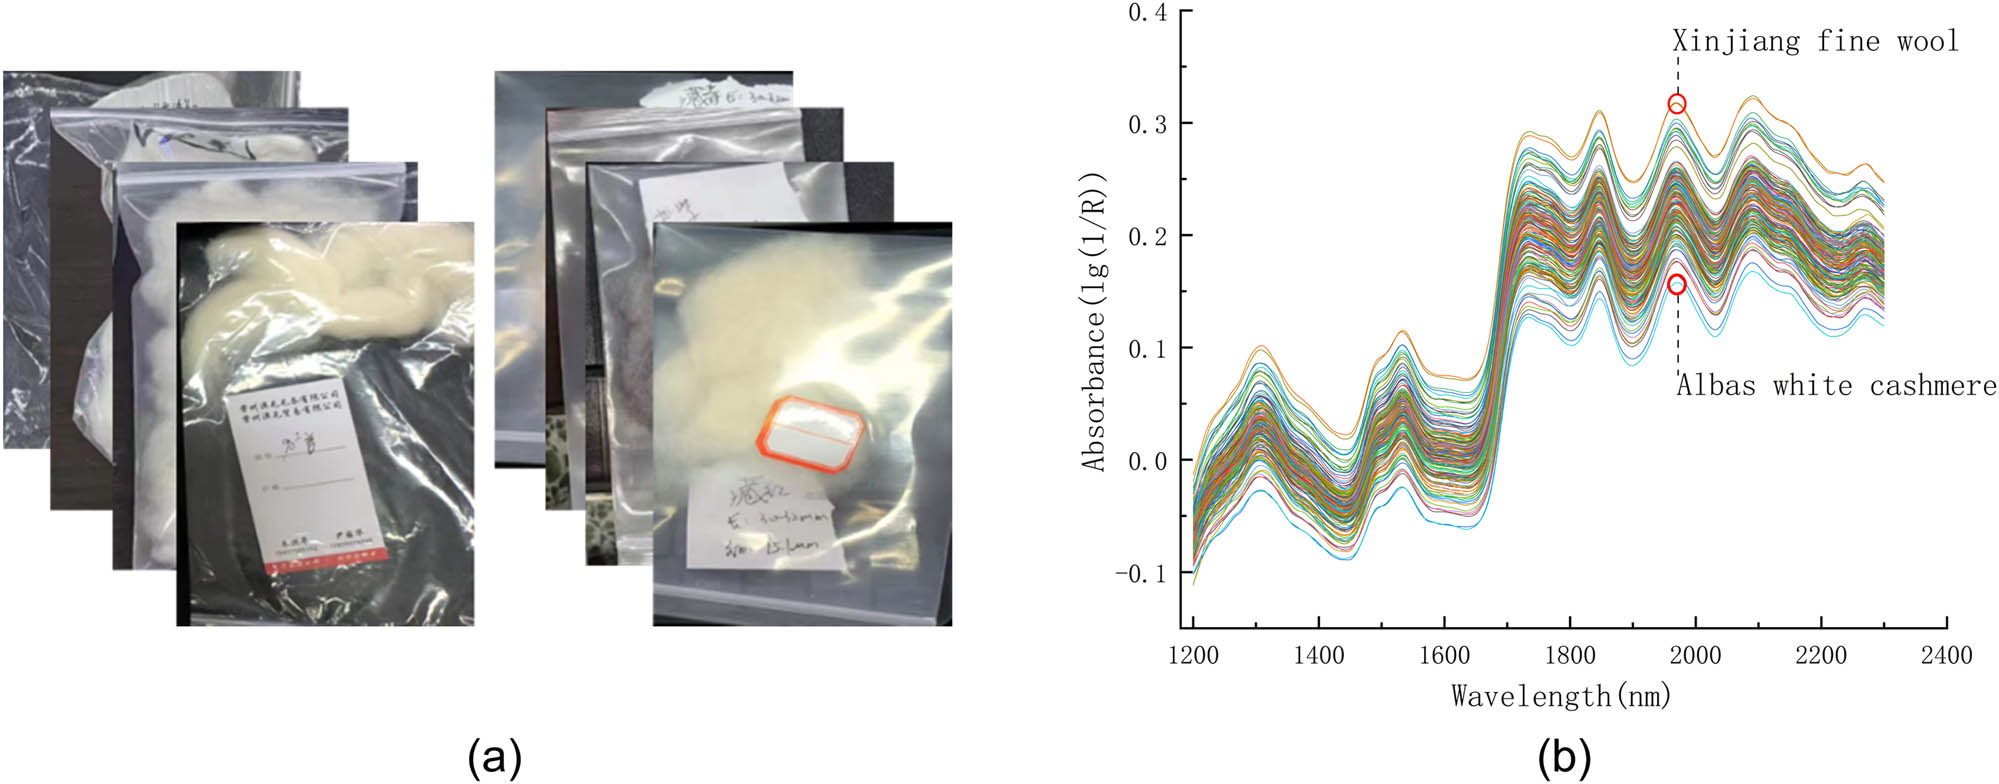
Cashmere wool sample and spectral data: (a) partial cashmere and wool samples and (b) NIR spectrum data.
3.2 Spectral characteristics and spectral preprocessing
The main components of cashmere and wool fibers are proteins and lipids, which exhibit absorption in the NIR spectral range. As can be seen from Figure 4(b), the overall shape of NIR spectra of all wool and cashmere samples is very similar, and the spectral bands are both wide and heavily overlapping. Because their chemical structures are also very similar. Therefore, it is difficult to differentiate between cashmere and wool based solely on visual inspection of the raw NIR spectra. Despite this, there are still some differences in the NIR spectra of wool and cashmere. The absorbance of wool’s NIR spectrum overall is higher than that of cashmere, indicating that NIR spectra have a certain potential to distinguish between the two.
Due to the complexity of the spectrum, preprocessing can reduce noise and other effects. To enhance the apparent resolution of the spectra, three different methods, including SG, SNV, and S-G + SNV, are employed for data preprocessing. In S-G, the width of the smoothing window has a certain impact on the smoothing effect. A window width that is too small to achieve effective smoothing, while a window width that is too large increases computational complexity. Taking into account the influence on model performance, a polynomial fitting order of 3 and a smoothing window width of 5 are selected for S-G. The different pretreatment effects of spectral data are shown in Figure 5. As can be seen in Figure 5(a), S-G reduces noise in the spectral line, making it smoother and enlarging the value of absorbance to enhance the difference between the data, thus improving the signal-to-noise ratio. In Figure 5(b), after SNV pretreatment, it can be seen that the spectral lines are more compact, diffuse reflection is eliminated, and the absorbance of the signal changes slightly less than that of SG pretreatment. Figure 5(c) shows the preprocessing diagram of SG-SNV. The shape of the spectral line is closer, but the difference is enlarged, which not only eliminates the diffuse reflection and significantly reduces the baseline deviation but also enlarges the value of the absorbance and increases the difference of the data, thereby the resolution of the signal is significantly improved.
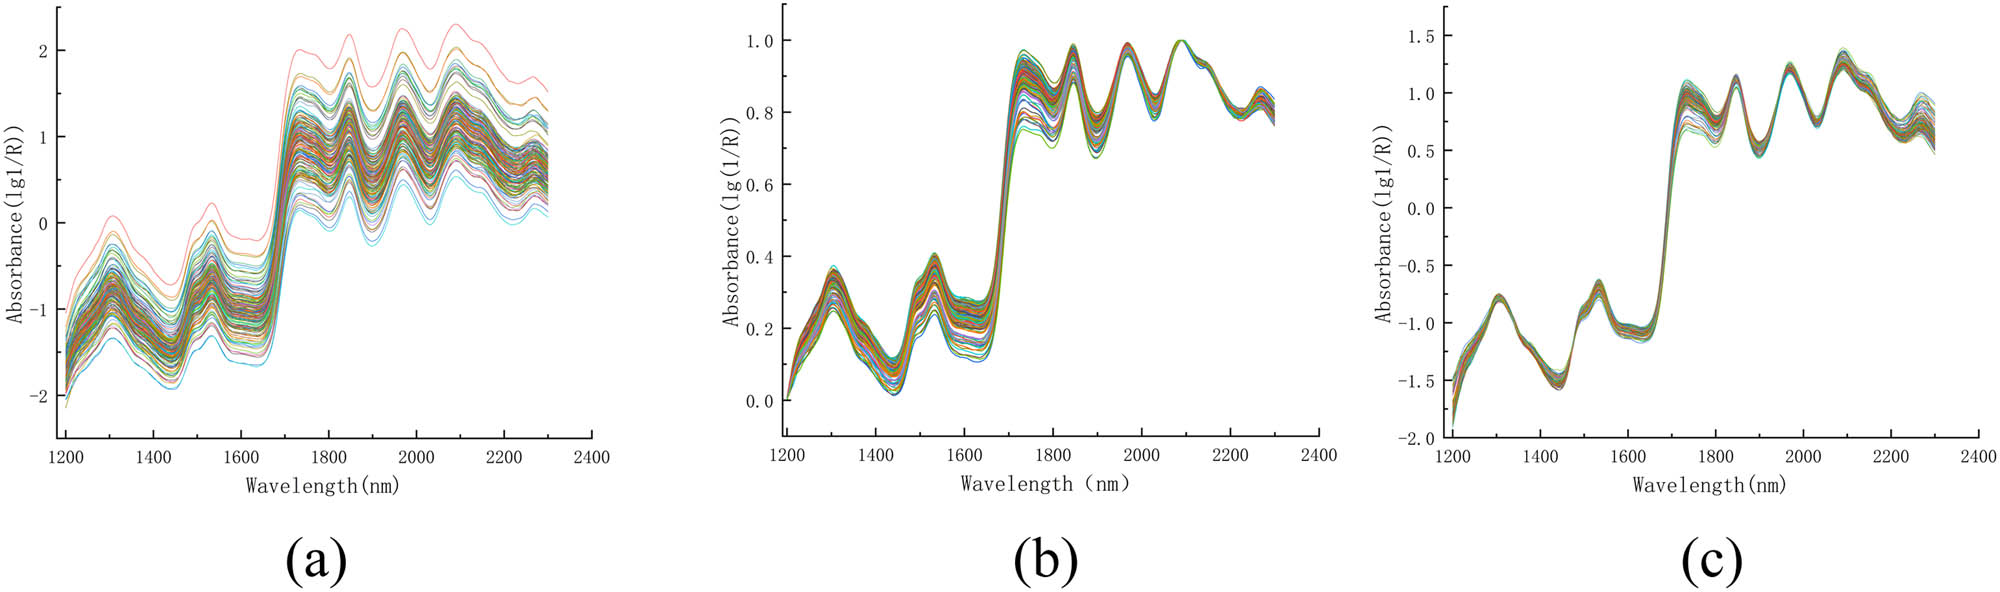
The spectra of 180 samples preprocessed using the different spectral preprocessing techniques. (a) S-G, (b) SNV, and (c) S-G + SNV.
So as to select the optimal preprocessing algorithm, a K-NN model is built using the original spectra and preprocessed spectra data. The number of nearest neighbors, K, in K-NN, is varied from 1 to 40 to find the best model parameters. The final results showed that K is 15 without any preprocessing, 6 after S-G preprocessing, 3 after SNV preprocessing, and 1 after S-G + SNV preprocessing. The results are shown in Table 1. For wool and cashmere samples, the sensitivity, specificity, and accuracy values obtained from the original spectral prediction model range from 0.9 to 0.91. It is worth noting that the model performs the worst after SNV preprocessing, with a sensitivity of only 0.82 and an overall accuracy of 0.88. However, the specificity is relatively high at 0.92, indicating a slightly higher recall for wool after SNV processing. The model preprocessed with S-G performs slightly better than the unprocessed model, indicating a positive effect of S-G preprocessing on the classification of wool and cashmere spectra. Using S-G + SNV preprocessing followed by K-NN input yields the best results, with a sensitivity of 0.94, a specificity of 0.92, and an accuracy value of 0.93. This preprocessing method demonstrates good recall rates for both wool and cashmere, indicating its effectiveness in handling complex spectra. Therefore, S-G + SNV is the best preprocessing method.
Confusion matrix results and metrics for the prediction results of the K-NN model
| Pre-processing | Sensitivity | Specificity | Accuracy |
|---|---|---|---|
| Raw | 0.91 | 0.89 | 0.90 |
| S-G | 0.91 | 0.89 | 0.90 |
| SNV | 0.82 | 0.92 | 0.88 |
| S-G + SNV | 0.94 | 0.92 | 0.93 |
3.3 Feature variable selection
To reduce redundant wavelengths and computational load and enhance discrimination accuracy, feature variables for distinguishing between wool and cashmere are extracted. After establishing the K-NN model mentioned above, S-G + SNV is selected as the optimal preprocessing method. The original spectral data are then subjected to optimal preprocessing, followed by data dimensionality reduction using PCA, LDA, and ILDA methods, making the characteristic wavelength vectors in the 1,200–2,300 nm range significantly reduced to one- or two-dimensional characteristic variables.
In the original LDA algorithm, the number of dimensions for k categories is reduced to K−1 dimensions at most. The improved LDA algorithm is introduced to the NIR spectral data of other fabrics for comparison, allowing the algorithm to obtain two feature dimensions. In comparison to involving other fabrics, seven common fabrics are introduced: acetate, nylon, acrylic, polyester, viscose, cotton, and silk. This is to investigate whether the addition of fibers from different categories has a significant impact on the dimensionality reduction of cashmere and wool using ILDA. The spectral comparison is shown in Figure 6, which reveals that the spectral characteristics of wool and cashmere are relatively similar to cotton while significantly different from acrylic. Therefore, cotton with relatively small differences and acrylic with relatively large differences are selected.
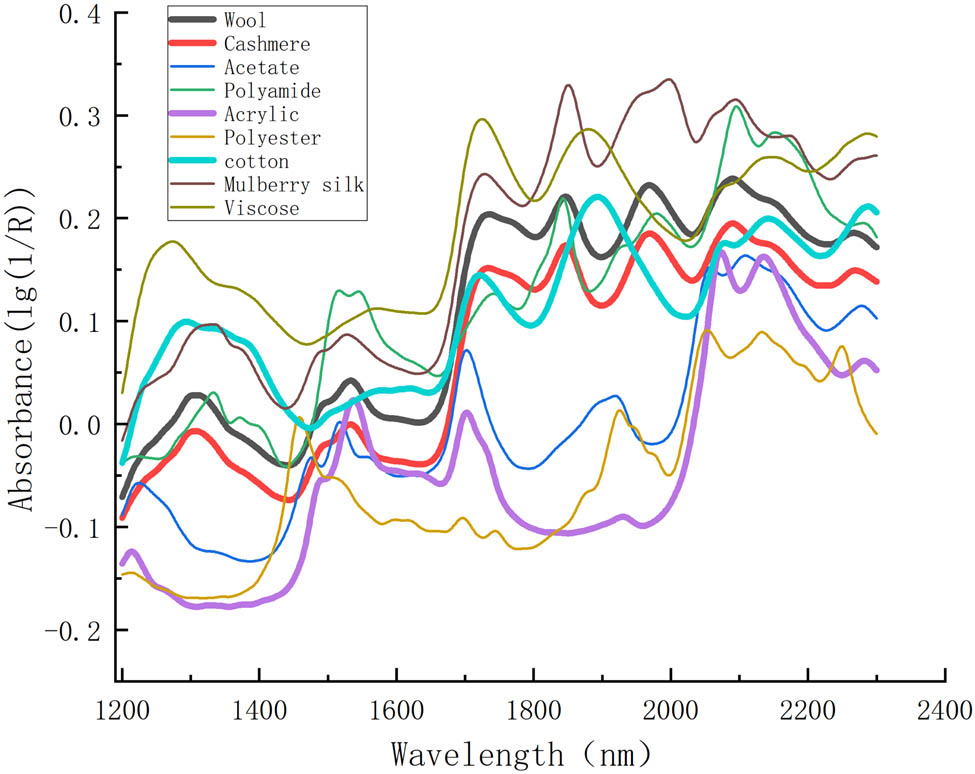
Spectral difference comparison.
Figure 7 shows the dimensionality reduction results of different algorithms on the spectral data of wool and cashmere samples. After S-G + SNV-PCA processing, the two-dimensional feature variables have a large overlap, but the distance between centroids is also large. When applying S-G + SNV-LDA to the wool and cashmere datasets, only one-dimensional feature variables can be obtained. It can be seen that the features are closely arranged in a straight line with a lot of overlap. The data processed by S-G + SNV-ILDA (cotton) show a basic separation of features, but there is still some compactness at the intersection. The features obtained through S-G + SNV-ILDA (acrylic) processing also achieve basic separation, and the compactness of features at the intersection of the two categories is slightly better than ILDA (cotton).
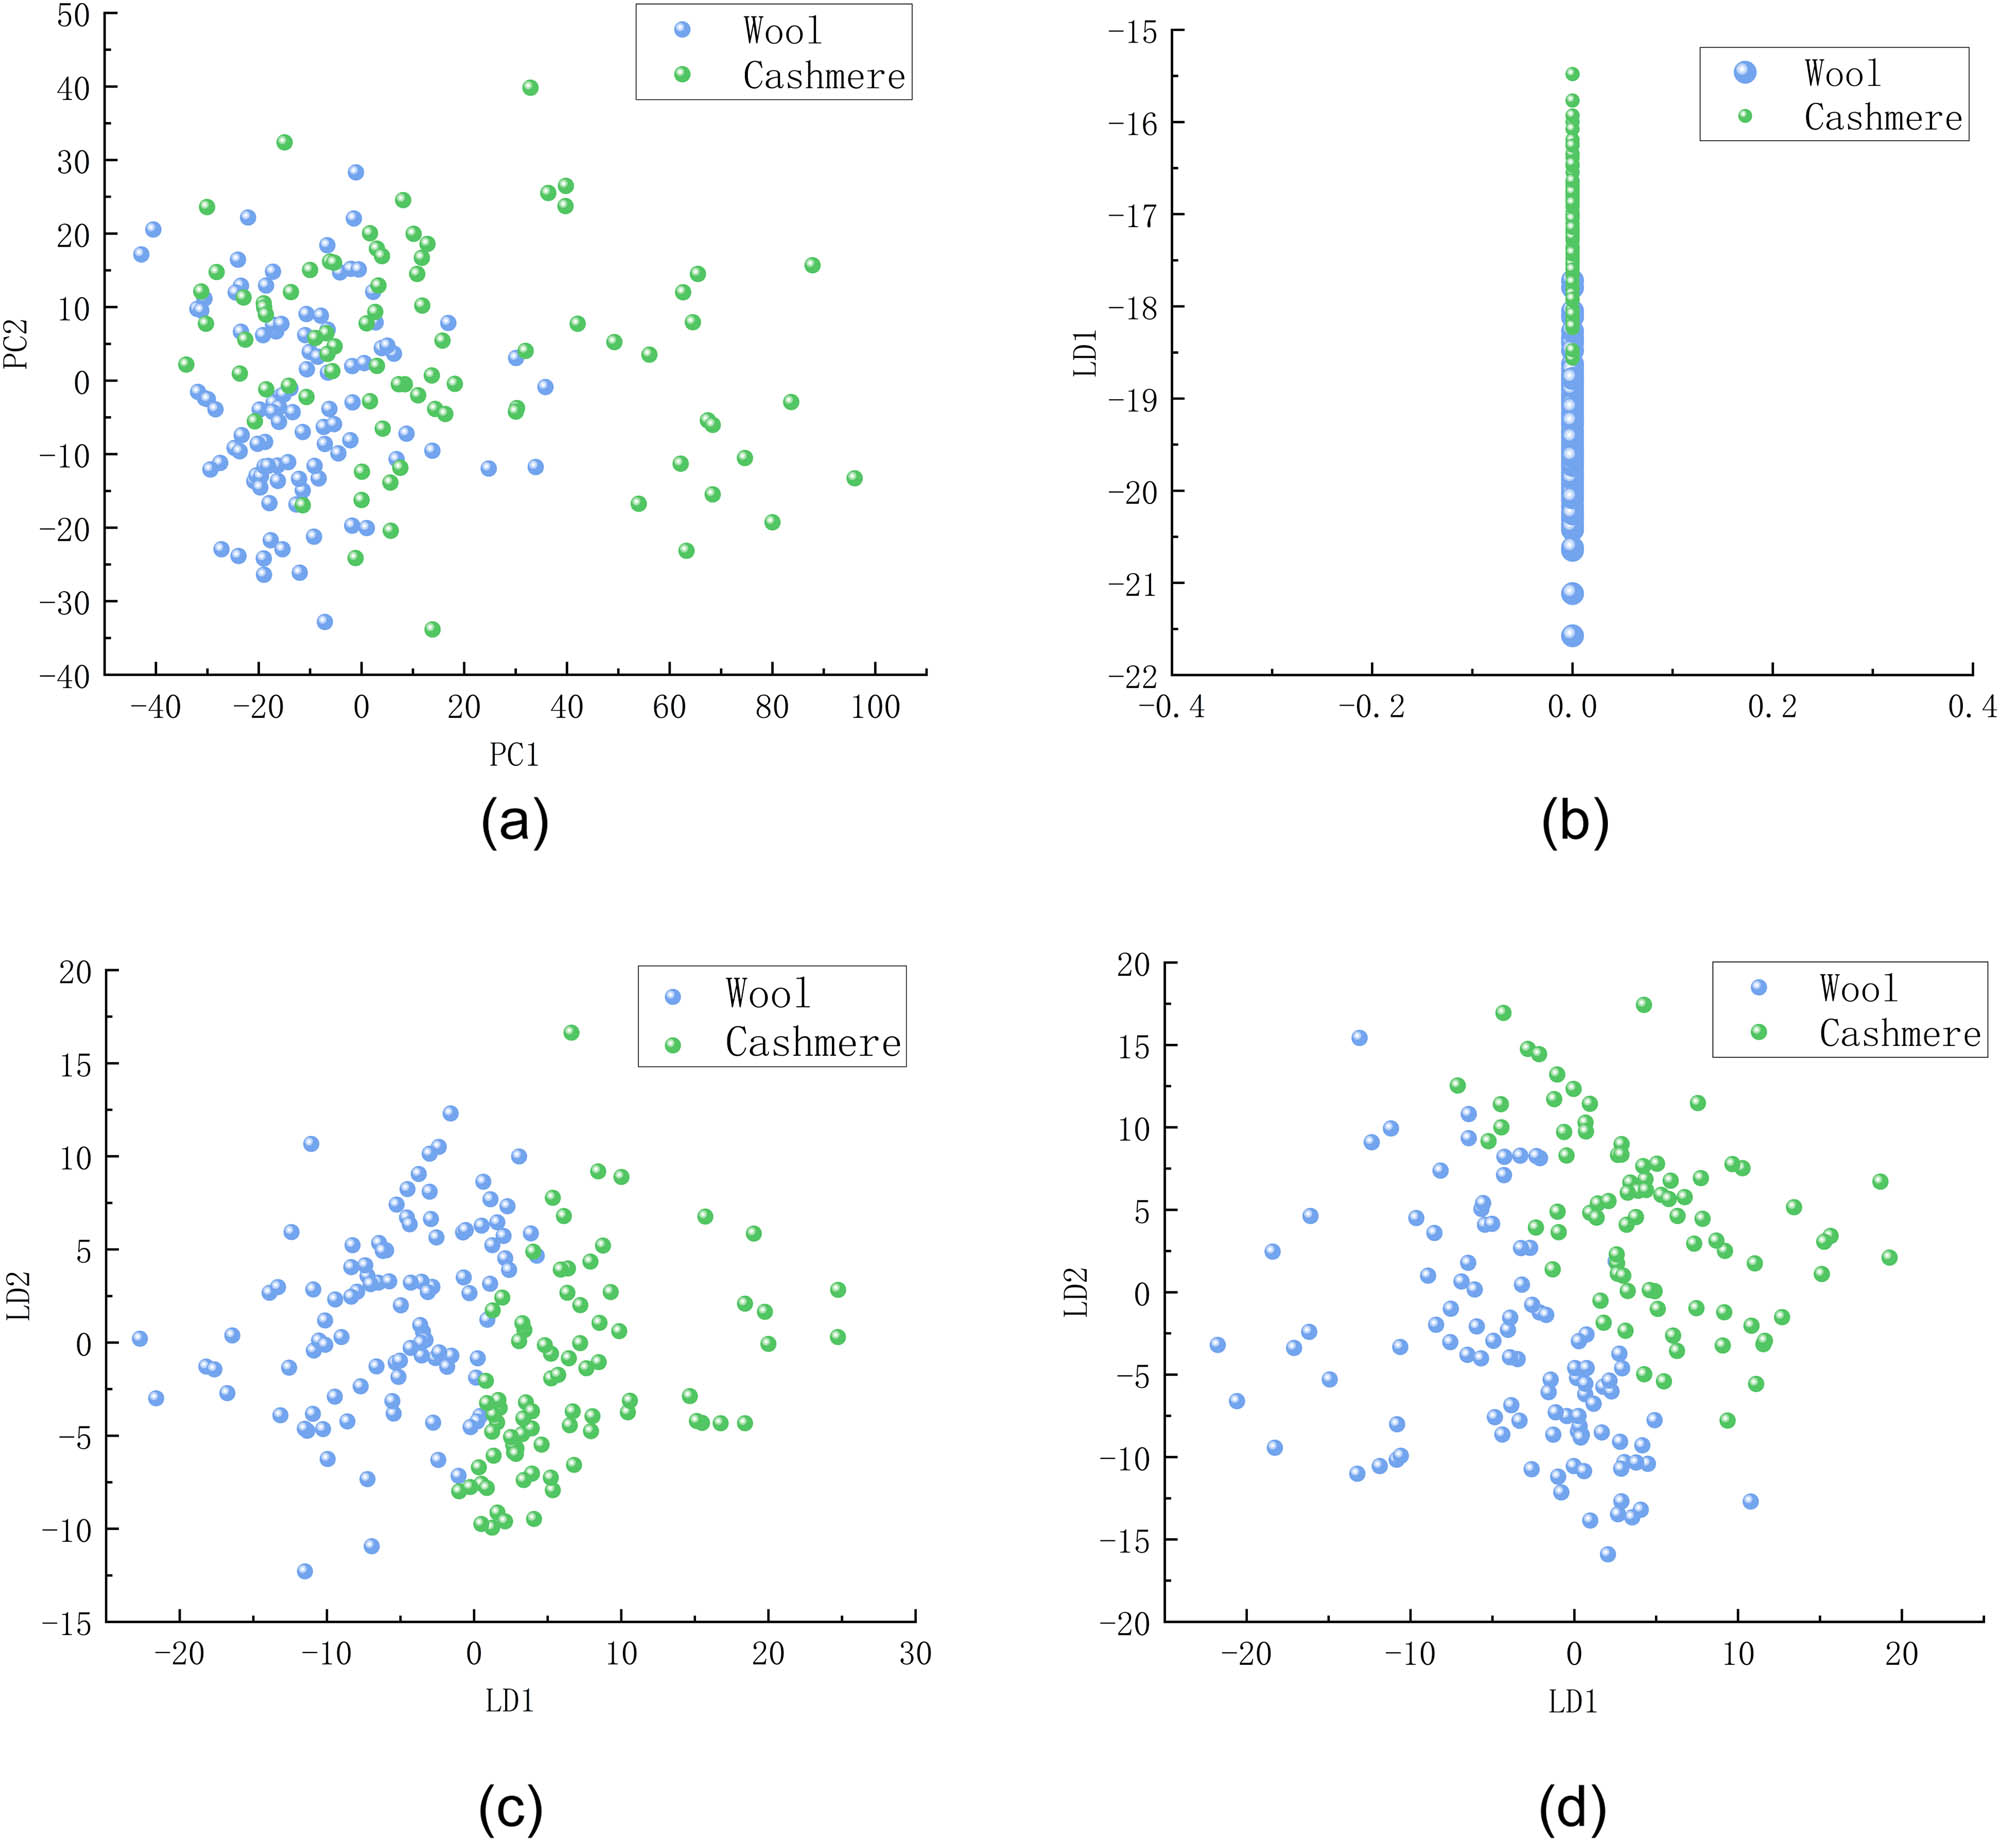
Results of different algorithms for downscaling the spectra of wool cashmere samples. (a) S-G + SNV-PCA, (b) S-G + SNV-LDA, (c) S-G + SNV-ILDA (cotton), and (d) S-G + SNV-ILDA (acrylic).
3.4 Comparisons of K-NN modeling with different dimensionality reduction methods
Table 2 is a confusion matrix, accuracy, sensitivity, and specificity corresponding to the K-NN model obtained using the S-G + SNV preprocessing method and different dimensionality reduction methods on the wool and cashmere test set. The dimensionality reduction methods include PCA, LDA, and ILDA, and each model runs 20 times.
Confusion matrix results and metrics for the prediction results of the K-NN models with S-G + SNV combined with different dimensionality reduction methods
| Dimensionality reduction | Sensitivity | Specificity | Accuracy |
|---|---|---|---|
| PCA | 0.71 | 0.84 | 0.78 |
| LDA | 0.88 | 0.87 | 0.88 |
| ILDA (cotton) | 1.00 | 0.92 | 0.96 |
| ILDA (acrylic) | 0.97 | 0.97 | 0.97 |
From Table 2, it can be seen that for the PCA dimensionality reduction method, the sensitivity, specificity, and accuracy of the spectral data after S-G + SNV preprocessing are the lowest. The performance is significantly lower than the sensitivity, specificity, and accuracy in Table 1 without PCA dimensionality reduction. The reason for this is that although the data reduce most of the feature dimensions in the PCA transformation, making the classification model more lightweight, it also loses some important information, leading to a decrease in accuracy. The LDA method for sensitivity, specificity, and accuracy of wool and cashmere datasets has increased by 0.17, 0.03, and 0.1, respectively, compared to the PCA-processed data, showing an overall improvement. The differences in sensitivity, specificity, and accuracy of ILDA (cotton) and ILDA (acrylic acid) are small, with both being basically equal. However, the performance is significantly better than that of PCA and LDA processing. For the ILDA (cotton) dimensionality reduction method, the sensitivity can reach 1, the specificity is 0.92, and the accuracy is 0.96, indicating that this method has excellent recall for cashmere and slightly less for wool. For the ILDA (acrylic) dimensionality reduction method, the sensitivity and specificity are both 0.97, and the accuracy is also 0.97, indicating that this method has a good recall for both wool and cashmere. However, the accuracy is 1% higher than that of ILDA (cotton), indicating a significant spectral difference between wool and cashmere, resulting in a slight improvement in accuracy. The results show that the ILDA algorithm can achieve the prediction of wool and cashmere classification.
By introducing NIR spectra of similar fabrics as references, the LDA algorithm can achieve dimensionality reduction to obtain two-dimensional features, solving the problem of high overlap and low classification prediction accuracy when reducing two class samples to one-dimensional features. These findings indicate that ILDA is a highly effective method in a series of applications involving NIR spectra.
4 Conclusions
Fiber detection is the foundation of quality control and the steady development of textile products. The method based on NIR can not only non-destructively detect samples but also improve identification accuracy. This article introduces the NIR spectra of other similar fabrics as references, so that the LDA algorithm for wool and cashmere classification can be reduced to two feature dimensions. This method effectively solves the problem of low accuracy caused by the small number of spectral feature dimensions and data overlap. By testing the self-collected NIR spectral dataset, combining four spectral preprocessing methods and three dimensionality reduction methods, the best model SG + SNV-ILDA-K-NN with high prediction accuracy and good stability is obtained. Compared with PCA and LDA dimensionality reduction methods, ILDA can achieve better prediction results. For the use of ILDA (cotton) dimensionality reduction method, the accuracy can reach 96%, while using ILDA (acrylic) dimensionality reduction method, the accuracy is only 1% higher than that of ILDA (cotton), indicating that the accuracy is slightly improved for introducing spectra with large differences from wool and cashmere spectra. The results show that the ILDA algorithm can achieve a better prediction of wool and cashmere classification. Therefore, the ILDA algorithm is feasible for NIR spectral non-destructive detection, with broad application prospects, and can also provide a new idea for dimensionality reduction in other fields. In the future, improvements can still be made to the LDA algorithm itself, reducing K categories to K dimensions without increasing the number of categories, making the model more lightweight; in addition, in terms of the dataset, the number and variety of samples should be continuously increased to make the classification model have stronger generalization ability.
-
Funding information: This work was supported by the Chinese Postdoctoral Science Foundation under Grant No. 2020M683562, the Natural Science Foundation of Shaanxi Province of China under Grant No. 2022JM-331, the Key Research and Development Program of Shaanxi Provincial Science and Technology under Grant No. 2024-YBXM-052, the Scientific Research Project of Shaanxi Provincial Education Department under Grant No. 23JC031 and the Science and Technology Program of Xi’an, China under Grant No. 23GXFW0027.
-
Conflict of interest: The authors declared no potential conflicts of interest with respect to the research, authorship, and publication of this article.
References
[1] Jin, M., Lu, J., Fei, X., Lu, Z., Quan, K., Liu, Y., et al. (2020). Genetic signatures of selection for cashmere traits in Chinese goats. Animals, 10(10), 1905.10.3390/ani10101905Search in Google Scholar PubMed PubMed Central
[2] Wang, J., Sui, J., Mao, C., Li, X., Chen, X., Liang, C., et al. (2021). Identification of key pathways and genes related to the development of hair follicle cycle in cashmere goats. Genes, 12(2), 180.10.3390/genes12020180Search in Google Scholar PubMed PubMed Central
[3] Zhang, X., Wu, X., Yang, H., Zheng, H., Zhou, Y. (2023). Identification of cashmere and wool by DNA barcode. Journal of Natural Fibers, 20(1), 2175100.10.1080/15440478.2023.2175100Search in Google Scholar
[4] Atav, R., Ergünay, U., Gürkan Unal, P. (2023). Determining the effect of pigmentation on some physical and mechanical properties of yak and cashmere down fibers. Journal of Natural Fibers, 20(1), 2149939.10.1080/15440478.2022.2149939Search in Google Scholar
[5] Sun, M. R., Fei, J., Cai, J. S., Zhao, J. (2016). Application of dna analysis in quantifying cashmere and wool binary blend. Key Engineering Materials, 671, 378–384.10.4028/www.scientific.net/KEM.671.378Search in Google Scholar
[6] Ataku, H., Nishijima, K., Mori, A., Fujita, N., Sasaki, K. (2015). Differential identification and quantification of cashmere, sheep and yak fibers in textiles using liquid chromatography/mass spectrometry. Sen’i Gakkaishi, 71(3), 141–150.10.2115/fiber.71.141Search in Google Scholar
[7] Yan, Y., Sun, R., Wei, L., Dong, J. (2022). Research progress of identification technology between wool and cashmere. Wool Textile Journal, 50(12), 102–110.Search in Google Scholar
[8] Zhu, Y., Zhao, L., Chen, X., Li, Y., & Wang, J. (2023). Animal fiber recognition based on feature fusion of the maximum inter-class variance. AUTEX Research Journal, 23(4), 560–566. 10.2478/aut-2022-0031.Search in Google Scholar
[9] Luo, J., Lu, K., Chen, Y., Zhang, B. (2021). Automatic identification of cashmere and wool fibers based on microscopic visual features and residual network model. Micron, 143, 103023.10.1016/j.micron.2021.103023Search in Google Scholar PubMed
[10] Ke-yan, Y., Rong, W., Xiang-xiang, W., Li-ping, X., Li, Y. (2022). Identification and restoration of pseudo-hydrolyzed animal protein of lacteus camelus based on ipls model of near-infrared measurement spectrum of 6 mm detection plate. Spectroscopy and Spectral Analysis, 42(10), 3143–3147.Search in Google Scholar
[11] Gao, H., Wang, G., Wang, Z. (2021). Fast determination of mineral elements in wheat flour by near-infrared spectroscopy. Wei Sheng yan jiu = Journal of Hygiene Research, 50(3), 495–500.Search in Google Scholar
[12] Zhao, H., Sun, Y., Guo, Y., Cai, W., Shao, X. (2020). Near infrared spectroscopy for low-temperature water structure analysis. Chemical Journal of Chinese Universities-Chinese, 41(9), 1968–1974.Search in Google Scholar
[13] Bourne, N., Blyth, D., Simon, C. (2021). Rapid prediction of chemical composition and degree of starch cook of multi-species aquafeeds by near infrared spectroscopy. Journal of Near Infrared Spectroscopy, 29(4), 216–225.10.1177/0967033521999116Search in Google Scholar
[14] Said, M. M., Gibbons, S., Moffat, A., Zloh, M. (2019). Use of near infrared spectroscopy and spectral databases to assess the quality of pharmaceutical products and aid characterization of unknown components. Journal of Near Infrared Spectroscopy, 27(5), 379–390.10.1177/0967033519866009Search in Google Scholar
[15] Zhou, J., Wang, R., Wu, X., Xu, B. (2017). Fiber-content measurement of wool–cashmere blends using near-infrared spectroscopy. Applied Spectroscopy, 71(10), 2367–2376.10.1177/0003702817713480Search in Google Scholar PubMed
[16] Riba, J.-R., Cantero, R., Canals, T., Puig, R. (2020). Circular economy of post-consumer textile waste: Classification through infrared spectroscopy. Journal of Cleaner Production, 272, 123011.10.1016/j.jclepro.2020.123011Search in Google Scholar
[17] Zhou, J., Yu, L., Ding, Q., Wang, R. (2019). Textile fiber identification using near-infrared spectroscopy and pattern recognition. Autex Research Journal, 19(2), 201–209.10.1515/aut-2018-0055Search in Google Scholar
[18] Anceschi, A., Zoccola, M., Mossotti, R., Bhavsar, P., Dalla Fontana, G., Patrucco, A. (2022). Identification and quantitative determination of virgin and recycled cashmere: A near-infrared spectroscopy study. ACS Sustainable Chemistry & Engineering, 10(2), 738–745.10.1021/acssuschemeng.1c05289Search in Google Scholar
[19] Lee, L. C., Liong, C.-Y., Jemain, A. A. (2017). A contemporary review on data preprocessing (dp) practice strategy in ATR-FTIR spectrum. Chemometrics and Intelligent Laboratory Systems, 163, 64–75.10.1016/j.chemolab.2017.02.008Search in Google Scholar
[20] Zhu, Z., Zhu, X., Kong, F., Guo, W. (2018). A rapid method on identifying disqualified raw goat’s milk based on total bacterial count by using dielectric spectra. Journal of Food Engineering, 239, 40–51.10.1016/j.jfoodeng.2018.06.020Search in Google Scholar
[21] Wang, L., Li-Min, S. (2021). Influence of baseline on target factor analysis results of fourier transform infrared spectroscopy. Chinese Journal of Analytical Chemistry, 49(3), 474–481.Search in Google Scholar
[22] Berrueta, L. A., Alonso-Salces, R. M., H´eberger, K. (2007). Supervised pattern recognition in food analysis. Journal of Chromatography A, 1158(1–2), 196–214.10.1016/j.chroma.2007.05.024Search in Google Scholar PubMed
[23] Li, M., Zhang, X., Jiang, Q. (2018). Qualitative identification of pesticide residues in pakchoi based on near infrared spectroscopy. In: IOP Conference Series: Materials Science and Engineering (Vol. 466, p. 012064).10.1088/1757-899X/466/1/012064Search in Google Scholar
[24] Drivelos, S. A., Georgiou, C. A. (2012). Multi-element and multi-isotope-ratio analysis to determine the geographical origin of foods in the european union. TrAC Trends in Analytical Chemistry, 40, 38–51.10.1016/j.trac.2012.08.003Search in Google Scholar
[25] Zhang, J., Liu, W., Hou, Y., Qiu, C., Yang, S., Li, C., Nie, L. (2018). Sparse representation classification of tobacco leaves using near-infrared spectroscopy and a deep learning algorithm. Analytical Letters, 51(7), 1029–1038.10.1080/00032719.2017.1365882Search in Google Scholar
[26] Makkonen, J., Marsh, L., Vihonen, J., Järvi, A., Armitage, D., Visa, A., Peyton, A. (2014). Knn classification of metallic targets using the magnetic polarizability tensor. Measurement Science and Technology, 25(5), 055105.10.1088/0957-0233/25/5/055105Search in Google Scholar
[27] Galvao, R. K. H., Araujo, M. C. U., José, G. E., Pontes, M. J. C., Silva, E. C., Saldanha, T. C. B. (2005). A method for calibration and validation subset partitioning. Talanta, 67(4), 736–740.10.1016/j.talanta.2005.03.025Search in Google Scholar PubMed
[28] Oliveri, P. (2017). Class-modelling in food analytical chemistry: development, sampling, optimisation and validation issues – a tutorial. Analytica Chimica Acta, 982, 9–19.10.1016/j.aca.2017.05.013Search in Google Scholar PubMed
© 2024 by the authors, published by De Gruyter
This work is licensed under the Creative Commons Attribution 4.0 International License.
Articles in the same Issue
- Characterization of viscoelastic properties of yarn materials: Dynamic mechanical analysis in the transversal direction
- Analysis of omni-channel implementations that are preferred by consumers in clothing sector
- Structural modeling and analysis of three-dimensional cross-linked braided preforms
- An experimental study of mechanical properties and comfortability of knitted imitation woven shirt fabrics
- Technology integration to promote circular economy transformation of the garment industry: a systematic literature review
- Research on T-shirt-style design based on Kansei image using back-propagation neural networks
- Research on She nationality clothing recognition based on color feature fusion with PSO-SVM
- Accuracy prediction of wearable flexible smart gloves
- Preparation and performance of stainless steel fiber/Lyocell fiber-blended weft-knitted fabric
- Development of an emotional response model for hospital gown design using structural equation modeling
- Preparation and properties of stainless steel filament/pure cotton woven fabric
- Facemask comfort enhancement with graphene oxide from recovered carbon waste tyres
- Use of enzymatic processes in the tanning of leather materials
- Optical-related properties and characterization of some textile fibers using near-infrared spectroscopy
- Network modeling of aesthetic effect for Chinese Yue Opera costume simulation images
- Predicting consumers’ garment fit satisfactions by using machine learning
- Non-destructive identification of wool and cashmere fibers based on improved LDA using NIR spectroscopy
- Study on the relationship between structure and moisturizing performance of seamless knitted fabrics of protein fibers for autumn and winter
- Antibacterial and yellowing performances of sports underwear fabric with polyamide/silver ion polyurethane filaments
- Numerical and experimental analysis of ballistic performance in hybrid soft armours composed of para-aramid triaxial and biaxial woven fabrics
- Phonetic smart clothing design based on gender awareness education for preschoolers
- Determination of anthropometric measurements and their application in the development of clothing sizing systems for women in the regions of the Republic of Croatia
- Research on optimal design of pleated cheongsam based on Kano–HOQ–Pugh model
- Numerical investigation of weaving machine heald shaft new design using composite material to improve its performance
- Corrigendum to “Use of enzymatic processes in the tanning of leather materials”
- Shaping of thermal protective properties of basalt fabric-based composites by direct surface modification using magnetron sputtering technique
- Numerical modeling of the heat flow component of the composite developed on the basis of basalt fabric
- Weft insertion guideway design based on high-temperature superconducting levitation
- Ultrasonic-assisted alkali hydrolysis of polyethylene terephthalate fabric and its effect on the microstructure and dyeing properties of fibers
- Comparative study on physical properties of bio-based PA56 fibers and wearability of their fabrics
- Investigation of the bias tape roll change time efficiency in garment factories
- Analysis of foot 3D scans of boys from Polish population
- Optimization of garment sewing operation standard minute value prediction using an IPSO-BP neural network
- Influence of repeated switching of current through contacts made of electroconductive fabrics on their resistance
- Numerical calculation of air permeability of warp-knitted jacquard spacer shoe-upper materials based on CFD
- Compact Spinning with Different Fibre Types: An Experimental Investigation on Yarn Properties in the Condensing Zone with 3D-Printed Guiding Device
- Modeling of virtual clothing and its contact with the human body
- Advances in personalized modelling and virtual display of ethnic clothing for intelligent customization
- Investigation of weave influence on flame retardancy of jute fabrics
- Balloonless spinning spindle head shape optimisation
- Research on 3D simulation design and dynamic virtual display of clothing flexible body
- Turkish textile and clothing SMEs: Importance of organizational learning, digitalization, and internationalization
- Corrigendum To: “Washing characterization of compression socks”
- Study on the promotion multiple of blood flow velocity on human epidermal microcirculation of volcanic rock polymer fiber seamless knitted fabric
- Bending properties and numerical analysis of nonorthogonal woven composites
- Bringing the queen mother of the west to life: Digital reconstruction and analysis of Taoist Celestial Beings Worshiping mural’s apparel
- Modeling process for full forming sports underwear
- Retraction of: Ionic crosslinking of cotton
- An observational study of female body shape characteristics in multiracial Malaysia
- Study on theoretical model and actual deformation of weft-knitted transfer loop based on particle constraint
- Design and 3D simulation of weft-knitted jacquard plush fabrics
- An overview of technological challenges in implementing the digital product passport in the textile and clothing industry
- Understanding and addressing the water footprint in the textile sector: A review
- Determinants of location changes in the clothing industry in Poland
- Influence of cam profile errors in a modulator on the dynamic response of the heald frame
- Quantitative analysis of wool and cashmere fiber mixtures using NIR spectroscopy
- 3D simulation of double-needle bar warp-knitted clustered pile fabrics on DFS
- Finite element analysis of heat transfer behavior in glass fiber/metal composite materials under constant heat load
- Price estimation and visual evaluation of actual white fabrics used for dress shirts and their photographic images
- Effect of gluing garment materials with adhesive inserts on their multidirectional drape and bending rigidity
- Optimization analysis of carrier-track collision in braiding process
- Numerical and experimental analysis of the ballistic performance of soft bulletproof vests for women
- The antimicrobial potential of plant-based natural dyes for textile dyeing: A systematic review using prisma
- Influence of sewing parameters on the skin–fabric friction
- Validation by experimental study the relationship between fabric tensile strength and weave structures
- Optimization of fabric’s tensile strength and bagging deformation using surface response and finite element in stenter machine
- Analysis of lean manufacturing waste in the process flow of ready-to-wear garment production in Nigeria
- An optimization study on the sol–gel process to obtain multifunctional denim fabrics
- Drape test of fully formed knitted flared skirts based on 3D-printed human body posture
- Supplier selection models using fuzzy hybrid methods in the clothing textile industry