Predicting consumers’ garment fit satisfactions by using machine learning
-
Evrim Buyukaslan Oosterom
 ,
Fatma Baytar
,
Fatma Baytar

Abstract
The objectives of this study were to apply alternative machine learning (ML) algorithms to predict consumers’ garment fit satisfactions (real fit satisfaction [RFS]) and compare the efficiencies of these algorithms to predict RFS. Skirts made from different fabrics were used as test garments. Mechanical properties of the skirts’ fabrics were assigned as predictor variables to estimate RFS. Study participants’ virtual body models were created by using 3D body scanner and used for virtual fitting. Each participant physically tried on the skirts and evaluated the fit. Participants also viewed the skirt simulations on their avatars and evaluated the virtual fit, which represented participants’ virtual fit satisfactions (VFS). Random Forest (RF), support vector machine (SVM), and conditional tree (CT) algorithms were used to learn from the data to predict participants’ RFSs. The mean correlations between the predicted and observed RFS values in the validation sets were 0.74 (RF), 0.70 (SVM-linear kernel), 0.72 (SVM-radial kernel), and 0.55 (CT). According to the variable importance analysis, VFS had the highest importance among 35 predictor variables. ML is used mostly for sales forecasting and manufacturing purposes in the fashion industry. However, garment fit, which restrains consumers from shopping online, did not get enough attention in ML studies. Besides, the ML algorithms used in fashion and apparel studies are often genetic algorithms and neural networks; therefore, there is a need to test other algorithm types. In this study, we offered alternative ML algorithms (i.e., RF, SVM, and CT) to predict consumers’ garment fit satisfactions.
1 Introduction
The high return rates of purchased clothing products are the main drive of this research. According to a consumer report [1], 23% of all clothing purchases in the United States are being returned due to poor fit. Particularly, high product return rates in online shopping are becoming increasingly alarming because of their negative environmental and economic impacts [2]. Apparel companies try to minimize their return rates by adopting recent technologies, such as virtual try-on and augmented reality (AR), to give customers more information about the products and enhance their shopping experiences [3,4]. Coronavirus disease (COVID-19) pandemic encouraged some fashion companies to adopt virtual try-on and AR technologies due to their advantages to minimize physical contact but still allow users to try-on clothes [5].
Another outstanding revolution in the fashion industry is the use of artificial intelligence (AI). The adoption of AI in the fashion industry has accelerated over the last few years and had a significant impact on reducing product returns [6]. For instance, in 2017, one of the biggest fast-fashion retailers started to use an online size recommendation tool that uses AI technology. In the case of this fast-fashion retailer, when customers want to purchase clothes from their online store, they are instructed to enter their body measurements so that a smart built-in function can suggest a proper garment size to the customers.
In the current study, we suggested a prediction model to decrease customers’ fit-related product returns. While doing so, we utilized the aforementioned two technologies: virtual try-on technology and AI to predict customers’ garment fit satisfactions. In the following parts, we reviewed the use of AI in garment fit-related studies. Later, we explained the virtual fit notion and presented its importance for predicting real fit satisfaction (RFS) by giving examples from the existing literature. In Section 2, we reported our approach to address the research objective, which was to predict customers’ garment fit satisfactions by using alternative machine learning (ML) algorithms. The comparison and validities of the proposed predictive models were given under Section 3. Section 4 included the discussion of the contributions and remarks on the study’s limitations.
1.1 Theoretical framework
1.1.1 Use of AI in garment fit studies
The use of AI in the fashion industry is examined under four major sections: design, manufacturing, retailing, and supply chain management, whereas garment evaluation can be considered as a subsection of the design [7]. However, there is a lack of AI studies in the field of fashion design, including fit and comfort, and AI can significantly contribute to the development of prediction tools that can learn from customers’ needs, preferences, and satisfactions [8].
Hui et al.’s study [9], which used a neural network (NN) algorithm to predict the tactile properties of fabrics using fabric mechanical properties, is an earlier example of AI in fashion design. Another study focused on predicting the garment appearance quality of jackets by using regression trees and K-nearest neighbor algorithms [10]. NN, linear regression, support vector machine (SVM), genetic algorithm, and fuzzy logic are the most common AI methods used in fashion studies [8]. For instance, Hu et al.’s study [11] used a hybrid NN system to predict the wearer’s fit evaluation by using body size and garment size as input parameters. In that study, the researchers measured the fit evaluation of a subject after trying on 450 different pants. Some critical measurements of the pants (e.g., length, front crotch) were used as input in the NN system together with the subject’s body measurements, whereas the subject’s fit evaluation was used as an output variable [11].
Utilizing AI and virtual try-on technologies together to predict consumers’ garment fit satisfaction is very promising [12,13]. For example, Chen and colleagues developed a three-phase sensory evaluation study in which they selected 19 fabric samples and created simulations of the fabrics to obtain experts’ evaluations for the accuracy of the simulations. Later, by using a learning-based experimental design, they tried to find the optimum values of fabric properties that could lower the discrepancy between the real fabric and its simulation [14]. In the following phase of the study, researchers created simulations of a women’s blouse in different sizes on a virtual body model and some experts evaluated the virtual fit. The gap between the body model and the cloth and experts’ fit evaluations were used to learn from the data. Finally, researchers predicted the possible fit evaluations for different body measurements by using a non-linear least-squares algorithm [13]. In Liu et al.’s study [12], which used naïve Bayes and SVM algorithms, nine female participants tried on eight different pants and evaluated the garment fit. Later, simulations of these pants were created, and the digital clothing pressures on various body parts were measured. The recorded pressures were used as predictor variables, whereas participants’ fit evaluations were assigned as output variables. Results indicated that the naïve Bayes model gave better prediction accuracies than SVM (93.1 and 84.7%, respectively).
As the cited studies show, using virtual try-on and AI technology together gives promising results in solving garment fit-related problems. Hence, in the present study, we adopted a similar approach by using AI and virtual try-on together to predict consumers’ fit satisfaction prior to the purchase to minimize post-purchase garment fit dissatisfaction. Random Forest (RF) [15], SVM with linear and radial kernels [16], and conditional tree (CT) algorithms were used to predict consumers’ RFS. There are numerous ML algorithms that can be used to solve a classification or a regression problem. For the present study, we selected the most popular, well-known algorithms [17] and based our selection decision on the ability to handle linear and nonlinear effects. SVM is an instant-based learning that the whole data set is used for training and similarities among the instances in the training data and the test data drive the predictions in the test data. Based on the way the similarity is calculated, an SVM model can incorporate nonlinear relationships between the explanatory and response variables. CT attempts to solve classification or regression problems by successively partitioning the training data into subsets based on specific features. The partitioning process is repeated until the final subsets, i.e., the leaves, are small enough to be labeled. Since the partitioning is applied to the data in a hierarchical fashion, the graphical representation of the problem looks like a branching tree, which corresponds to its name. Prediction for a test data instance is produced by applying the learned branching to this instance and assigning the learned labels in the tree based on the leaf that the instance falls into. CT has the advantage of easily incorporating linear and nonlinear effects into the predictions, and they are easy to explain. However, in complex problems, a single decision tree can become unstable and give poor results. In such cases, the RF algorithm would be a good choice. RF is an ensemble method that combines predictions from multiple decision trees. The idea behind ensemble learning is to combine weak learners to build a more robust model, a strong learner that has a better generalization performance. Essentially, RF is a group of decision trees and has the ability to choose the most probable option by using the power of an ensemble of decision trees. RF algorithm selects random data samples from the dataset and builds a CT model on each sample. The final predictions of the RF are calculated by averaging the predictions of each individual tree.
To our knowledge, the present study is one of the few studies to use alternative algorithms such as RF and CT for prediction in the field of fashion design, whereas the majority of the studies use NNs even though SVM and RF algorithms are advantageous over NN in terms of overfitting as they are less likely to fall into the local optimum solutions [18]. On the other hand, RF is an ensemble learning model that uses bagging techniques to construct many decision trees and creates a randomness that often yields a better prediction model [19].
1.1.2 Virtual fit: definition, evaluation, and its importance for predicting real garment fit
Garment fit is the relationship between the wearer’s body and the garment, and its evaluation is a process that includes physical, functional, and aesthetic evaluations [20]. One of the biggest obstacles of virtual try-on is that some of these aspects of garment fit cannot be evaluated in a virtual environment. For instance, consumers cannot touch or feel the garment or assess the comfort or performance; therefore, functional fit evaluation is impossible during virtual try-on [21]. However, physical evaluation (e.g., length and tightness) is possible to a certain extent [22].
Academic studies approach the evaluation of virtual garment fit in two ways: virtual garment fit evaluation can be done either objectively by calculating the strain/ease allowances on the virtual garment [23,24] or subjectively by visually assessing the virtual fit on a rating scale [12]. For example, Sayem [23,24] found a correlation between the ease/length change of a shirt (i.e., dimensional fit of the shirt) and its reflection in the garment simulation software on three different parameters (i.e., tension, stretch, and collision pressure). Most of the objective virtual fit evaluation studies were conducted to: (1) compare real fit to virtual fit [25], (2) customize garment patterns [26,27], and (3) investigate the impact of fabric’s mechanical properties on virtual fit [28,29]. Subjective evaluation of virtual garment fit may not be as accurate as objective evaluations; garment fit and aesthetic concepts depend on people’s preferences; thus, people should evaluate them [30]. Garment fit satisfaction reaches its maximum when the garment fits the wearer’s body as the wearer expected. Consumers’ garment fit satisfaction depends on some internal and external factors. Society, the fashion industry, and the ideal beauty image of the era determine the external factors, and consumers have no impact on these external factors. However, internal factors (i.e., wearer’s body satisfaction and physical dimensions of the body and the garment) are closely related to the interaction between the wearer and the garment [31].
Existing garment fit studies often evaluate the virtual fit based on fashion/textile experts’ judgments instead of the consumer perspective. Only a few studies assess virtual fit from a consumer perspective [32]. However, for online shopping, consumers are the subject of the fit evaluation. Therefore, there is a need to explore the consumers’ point of view while evaluating garment fit. The present study addresses this need and is the second part of a two-step study. The first part explored the factors that affect consumers’ virtual fit satisfaction (VFS) [33]. The RFSs of consumers were not incorporated into the first part of the study; only the correlation between consumers’ VFSs and factors such as consumers’ virtual body satisfaction, acceptance of the virtual try-on technology, and virtual fabric properties was analyzed [33]. In the second part, through using a variety of ML algorithms, we predicted participants’ RFSs by using their VFSs, as well as their body measurement, body satisfaction, and fabric properties.
2 Experimental
2.1 Participants
In this study, female participants aged between 18 and 35 years were recruited due to this group’s high online purchasing rates [34] since the customers who shop online often were the target group. After the Institutional Review Board approval (Cornell University, Protocol ID: 1712007670), flyers were placed around the university campus for recruitment as the university students’ ages are often within the target range (18–35 years) of the study, and they often purchase clothes online. Participants with 25–28 inch waist girth and 35–38 inch hip girth were sought due to the garment size used in this study.
2.2 Test garments
A full circular skirt design with a zipper at the side was selected as the garment design to maximize the drape features of the fabrics [35]. The drape is closely related to the aesthetic fit of the garment, which is also significant for virtual try-on [36]. The waist circumference of the sample skirts was 29 inches, and the skirt length was 18 inches. Since fabric properties were selected as input variables to estimate RFS of the participants, alternative fabrics with different mechanical properties were used, and other design elements such as shape and color (black) were kept fixed for all the test skirts. Woven fabrics were selected as knitted fabrics are often suitable for snug garments. Therefore, various woven fabrics of different compositions (i.e., wool, cotton, cotton/polyester, cotton/polyester/elastane), constructions (i.e., twill and plain weave), and all in color black were provided from fabric suppliers. Eventually, seven skirts were prepared by a professional seamstress. The weight of these seven fabrics varied between 111 and 385 g/m2, and thickness varied between 0.1 and 1.27 mm (Table 1).
Measured fabric properties and determined groups
| Group | Fabric code | Composition | Construct. | Weight (g/m2) | Thickness (mm) | Elongation (%) (under 500 gf) | Shear rigidity (N/m) | Bending rigidity (µNm) | Surface roughness(µm) | Surface friction (no unit) | |||
|---|---|---|---|---|---|---|---|---|---|---|---|---|---|
| Warp | Weft | Warp | Weft | Face | Face | Back | |||||||
| 1 | Fabric1 | 100% Cotton | Plain | 111 | 0.10 | 3.33 | 9.41 | 43.20 | 1.07 | 0.58 | 10.06 | 0.71 | 0.62 |
| Fabric2 | 100% Wool | Plain | 143 | 0.20 | 13.22 | 13.14 | 18.10 | 0.89 | 0.94 | 11.76 | 0.63 | 0.70 | |
| 2 | Fabric3 | 98/2% Co/EA | Twill | 224 | 0.31 | 3.00 | 13.43 | 206.49 | 7.60 | 2.68 | 12.38 | 0.87 | 0.93 |
| Fabric4 | 68/28/4% Co/PES/EA | Twill | 258 | 0.44 | 3.14 | 19.00 | 122.67 | 7.32 | 3.98 | 17.09 | 0.65 | 0.91 | |
| 3 | Fabric5 | 96/4% Co/EA | Twill | 337 | 0.64 | 1.62 | 24.01 | 231.26 | 23.13 | 6.80 | 10.38 | 0.90 | 1.03 |
| Fabric6 | 96/4% Co/EA | Twill | 385 | 0.62 | 2.54 | 26.02 | 142.20 | 15.71 | 7.59 | 13.73 | 0.69 | 0.91 | |
| 4 | Fabric7 | 100% Wool | Plain | 344 | 1.27 | 2.83 | 4.35 | 121.91 | 8.40 | 2.92 | 21.46 | 0.92 | 1.00 |
Co: cotton; EA: elastane; PES: polyester.
2.3 Fabric measurements
The following mechanical properties of fabrics were used to develop the prediction model in this study: weight (W), thickness (T), shear rigidity (G), bending rigidity (B), and extension (E) in warp and weft directions, friction coefficient (F) at the face and back of the fabric, and surface roughness (R) at the face of the fabric. Kawabata and SiroFAST systems are often used to measure the mechanical properties of fabrics. However, due to the limitations in accessing these systems, traditional testing equipment was used in the present study. We conducted initial tests to determine whether there were any significant differences among garment simulations generated by using the outputs from traditional, KES-FB, and SiroFAST equipment, and it was concluded that traditional test equipment would be adequate to create garment simulations [37]. The methods and equipment used for fabric measurements were as follows: James–Heal Titan tensile tester measured fabric extensions and shear rigidities. The load cell of the tensile tester was 120 N, the pulling speed was 50 mm/s, and the distance between clamps was 10 cm. The warp and weft extension of fabrics at 100 gf/cm was measured by recording the fabric strain under 500 gf stress [38]. To calculate shear rigidity, SiroFAST-3 testing method was used [39]. Fabrics’ bias extensions at 5 gf/cm (E5) were measured by recording the strain values of fabrics under 25 gf stress. Measured extensions were used to calculate the shear rigidities (G) of the fabrics using the following equation: G = 123/E5 [40]. Bending rigidities of fabrics were measured by a Shirley stiffness tester [41], and BS3356: 1990 standards were followed for bending tests. Finally, kinetic frictions of the back of the fabrics were measured with an MXD-02 friction tester by Labthink Company based on ASTM D1894 [33]. More detailed information about the methods to measure the fabric properties can be found in the PhD thesis of the first author [42]. After measuring fabric properties, seven skirts were categorized into four groups. Grouping was necessary for two reasons: (1) evaluating all seven skirts by each participant was going to take almost half a day, which could be potentially an exhausting and distracting experience, and (2) some of the fabric properties did not differ significantly; therefore, those skirt simulations appeared to be similar to each other. Grouping the fabrics helped make sure that each participant tried on skirts from different groups and, therefore, was able to identify fit differences more easily. To group the skirts, measured fabric properties were analyzed by hierarchical clustering analysis in R software by using the Ward criterion with a pre-defined cluster number four.
2.4 Virtual and real garment try-on
Participants were individually invited to the research laboratory to take part in the fit experiments. Each participant was scanned in underwear using a Vitus XXL 3D full-body scanner. Scan surfaces were reconstructed in ScanWorks by using the standard posture option and saved as STL (binary) files. Later, these files were smoothed, scaled, and saved in OBJ format in GeoMagic Wrap software. Finally, 3D body models were imported into Optitex PDS v.15 software to be used for garment simulation. After 3D body scanning, participants answered some additional questions (i.e., demographics, fit preferences, attitudes toward the skirt style, and online shopping) in Qualtrics. When creating the skirt simulations, fabric textures were scanned by a flatbed scanner and exported to use in PDS. Afterward, virtual fabric properties were entered into the fabric editor window in the garment simulation software. As described by Power [43], a unit conversion was performed before inserting these measurements into the PDS software, and these unit-converted fabric properties were named as virtual fabric properties [33]. The unit conversion was achieved by using the Fabric Converter tool that was developed by Optitex as a solution to give flexibility to companies that have traditional fabric testing equipment. The Fabric Converter tool was reported to be used reliably in earlier research studies [29,37,43] and was discontinued to be used several years ago after the company had improved their fabric testing equipment, i.e., Mark-10. Literature indicated that Mark-10 uses the same fabric measuring principles that were used in our study [44]. A more detailed explanation and figures about unit conversion and 3D fabric properties entered into the software can be found in earlier publications related to this work [33,42]. Although there was a limitation in converting units precisely via the Fabric Converter [33], our previous studies revealed that the virtual skirt drape properties were close to the real skirt drape properties [42]. Later, the scanned fabric images were opened in PDS to give texture to the virtual fabrics. However, the fabric textures were not clearly distinguishable due to their dark colors. For this reason, to better display the virtual fabrics, a 90% gray color from the palette was selected to be used for all simulations. The texture images of all the test fabrics were kept the same (default) in the software since the main concern during the virtual try-on was the fit.
Participants viewed the virtual skirts on a computer screen and evaluated the fit on a 7-point Likert-type scale (1: extremely dissatisfied, 7: extremely satisfied) at four different fit locations (i.e., waist, hips, abdomen, hem) in three different views (front, back, and side) in a survey created in Qualtrics. After the virtual fit evaluations, participants tried on the actual skirts and evaluated their fit, this time by looking in a mirror. This procedure was repeated for the four different skirts that each participant was assigned to (Figure 1).
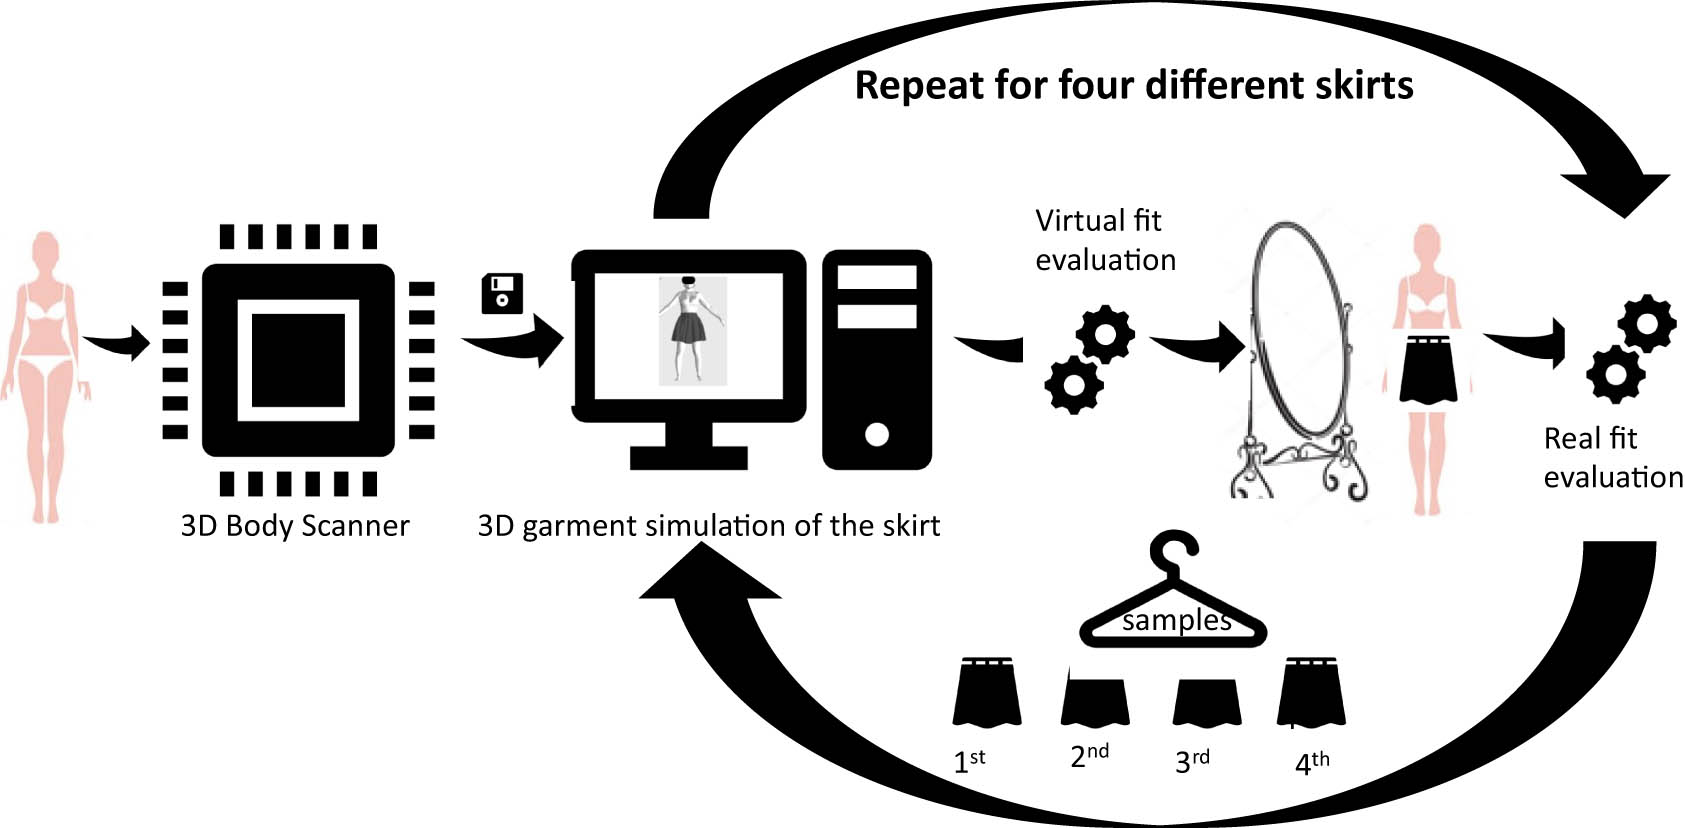
Protocol for virtual and real garment try-on.
2.5 Participants’ body measurements and body satisfactions
Eight body measurements (i.e., overall height, weight, body mass index [BMI], waist girth, hips girth, thigh girth, waist height, and knee height) that would impact the fit evaluation of skirts were extracted from the 3D body scans. Participants’ body satisfactions for 21 items were measured on a 7-point Likert-type scale [45] named as Body Satisfaction Scale. Only 15 of the items (i.e., height, weight, ankle, feet, knees, appearance, posture, waist, legs, torso, body build, buttocks, hips, abdomen, and thighs satisfaction) were used due to their relevance to predicting fit satisfaction of a skirt.
Internal factors (i.e., wearer’s body measurements and body satisfactions) were used as variables to predict RFS of participants. Other predictor variables used in this study were fabric properties. To minimize the lack of touch and feel sensations in virtual garments, the mechanical properties of the fabrics were used to correspond to the tactile properties of the test fabrics by following the methods described in the study by Frydrych et al. [38]. In addition to these factors, participants’ VFS was used as the primary input to predict RFS (Figure 2).
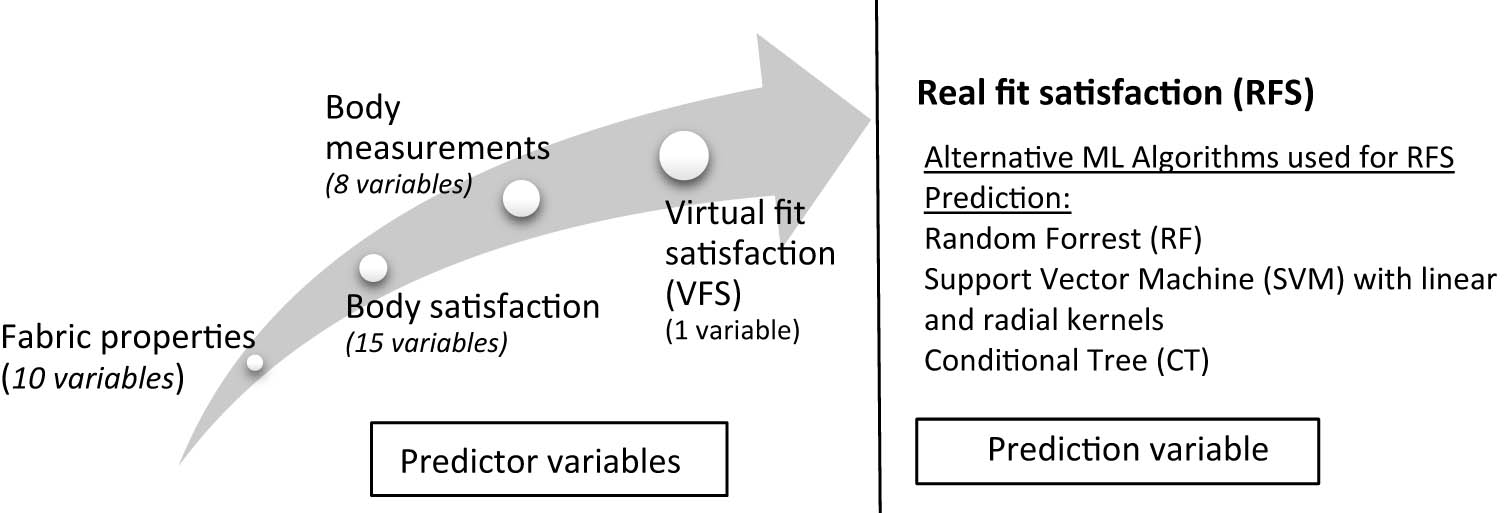
Variables that were used in this study to construct the ML algorithms.
2.6 ML algorithms and their implications in R language
In line with the previous studies, we tested various ML algorithms to find the most fitting algorithm for predicting garment fit. To implement different ML algorithms, a caret package was used in R. First, the data were randomly split among observations: 75% was to be used for training and 25% was to be used for assessing the efficacy of the model [46]. The resampling method used was cross-validation. Correlation scores for predicted RFS and measured RFS values were calculated for each algorithm, and a comparison of the algorithms’ performances was made according to the calculated correlations. Alternative correlation matrices were developed to understand the contribution of the VFS variable to the prediction models. In these alternative matrices, correlations between measured RFSs and calculated RFSs were reported by only using the VFS variable as the predictor variable.
3 Results
3.1 Demographics and preferences of participants
Forty-five female participants took part in the experiments. The calculated mean of the participants’ age was 24 (standard deviation (SD) = 4.75). Seventy-three percent of the participants took no textiles or fashion-related classes; therefore, they represented a typical apparel consumer. All participants were online shoppers. More than half of the participants (54%) stated that they occasionally or sometimes purchase skirts online. To understand participants’ general fit satisfaction with ready-to-wear skirts available in the market and their personal skirt-style preferences, we added two additional questions to the survey: one of them about the fit of the ready-to-wear skirts in the market, and the other one about the style preferences of the participants. Sixty-five percent of the participants were satisfied with the fit of ready-to-wear skirts (regardless of the style), and the rest of the participants were either neutral or dissatisfied. On the other hand, liking/disliking a style would impact the fit evaluation of the participants. Therefore, we tested if participants liked/disliked circular skirts as a style. Meanwhile, other skirt styles (A-line, pencil, and straight skirt) were also tested. The results showed that there was no significant difference between the likeness scores for different skirt styles, so using a circular skirt as the test sample was confirmed with pre-tests. The results of the participants’ likeness scores for the circular skirt style showed that only two participants disliked the circular skirt style to different extents, while three of the participants neither liked nor disliked the style. Most of the participants (n = 40) liked the circular skirt style to different extents. The likeness scores of the other skirts were not given in this study due to limited space.
3.1.1 Measurements and body satisfaction analysis of participants
Participants’ weight varied between 105 and 154 pounds (M = 130.7; SD= 12.7); height varied between 60 and 70 inches (M = 65, SD = 2.5); BMI varied between 18.6 and 24.9 (M = 22, SD = 2); waist girth varied between 24.5 and 30.1 inches (M = 28; SD = 1.6); and hip girth ranged between 34 and 44 inches (M = 38.2, SD = 2). Especially, the hip measurements of some of the participants were higher than the required measurements. As it was a full-circular skirt and had some design ease at hips, participants with slightly larger hips and waist were allowed to participate in the experiment if they could easily don on and off the skirt and zip it up.
To examine the body satisfaction level of the sample group, the mean values for each item were calculated (n = 45). Participants were most satisfied with their height (M = 5.5, SD = 1.2), followed by the ankle (M = 5.3, SD = 1.5), feet (M = 5.2, SD = 1.3), and knees (M = 5.1, SD = 1.2). On the other hand, the participants were least satisfied with their thighs (M = 4.27, SD = 1.6), followed by abdomen (M = 4.29, SD = 1.3), hips (M = 4.33, SD = 1.3), and weight (M = 4.33, SD = 1.5). Participants’ body satisfactions for other body parts (knees, appearance, posture, waist, legs, torso, body build, and buttocks) varied between M = 5.10 and M = 4.60. These results showed that participants were more satisfied with the lower body parts (such as ankle and feet) and least satisfied with the mid-body sections. These results are parallel with an earlier study [31].
3.2 Analysis of fabric properties and their classification
Table 1 shows the measured fabric properties and the grouping of the fabrics. Bending rigidities varied considerably in warp direction (0.89–23.13 µNm); also, their shear rigidities showed differences (18.10–231.26 N/m). As confirmed by these values, the drape of the fabrics was significantly different, leading to a different aesthetic fit evaluation by the participants, as reported in the following paragraphs.
3.3 Analysis of RFS and VFS
For practical reasons, test skirts were named according to their fabric codes (e.g., Skirt 1 was made from Fabric 1). Each participant tried on one of the skirts in each group (e.g., Participant 1 tried on only Skirt 1 or Skirt 2 in Group 1). Figure 3 illustrates how one of the skirts (Skirt 6) looked actually and virtually on a participant. The number of virtual and real try-ons for each skirt was distributed almost equally among the participants. To be more explicit, Skirts 1 through 7 were tried on by 22, 23, 22, 24, 21, and 45 participants, respectively.
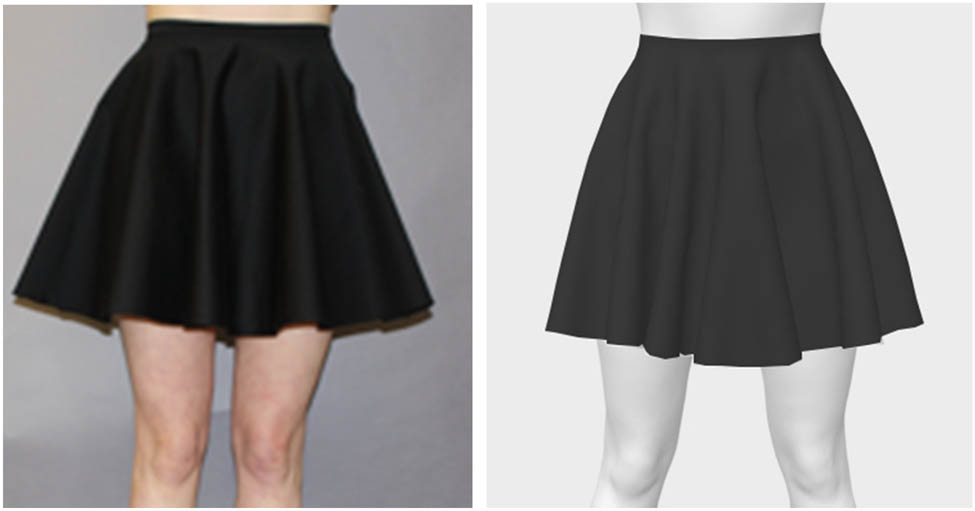
Drape images of Skirt 6 on a participant for real try-on and virtual try-on.
Participants’ RFS and VFS per skirt were calculated. To better understand which skirts had the highest fit satisfaction rate, participants’ average fit satisfaction was calculated (Table 2). According to RFS results, participants were the most satisfied with the fit of Skirt 1, Skirt 2, and Skirt 4, and the least satisfied with Skirt 6. This might be due to the bending rigidities of the fabrics that were highly correlated with fabric draping. Fabrics with higher bending rigidities were more rigid and did not form eye-pleasing folds.
Average RFS and VFS of the participants
| Group | Skirt code | RFS | VFS | ||
|---|---|---|---|---|---|
| Mean | SD | Mean | SD | ||
| 1 | Skirt 1 | 5.33 | 1.12 | 4.44 | 1.11 |
| Skirt 2 | 5.26 | 1.15 | 4.82 | 1.02 | |
| 2 | Skirt 3 | 4.58 | 1.25 | 4.75 | 1.22 |
| Skirt 4 | 5.14 | 1.17 | 4.83 | 1.17 | |
| 3 | Skirt 5 | 4.78 | 1.51 | 4.74 | 1.17 |
| Skirt 6 | 3.94 | 1.16 | 4.63 | 0.90 | |
| 4 | Skirt 7 | 5.06 | 1.18 | 4.67 | 1.08 |
To investigate if participants’ overall RFSs were significantly different among the skirts, a one-way analysis of variance (ANOVA) test was conducted. There was a significant difference between overall RFSs of different skirts (F(6,173) = 3.52, p < 0.01). A Hochberg post hoc analysis was carried out to evaluate which skirt or skirts were different in terms of overall RFSs. Participants’ average RFSs for Skirt 6 were statistically different than Skirts 1, 2, 4, and 7. On the other hand, virtual fit evaluations of the skirts did not vary considerably (F(6,173) = 0.333, p = 0.92). These results showed that the skirts made from different fabrics were evaluated differently in terms of fit when worn by the participants rather than seeing their simulations. The participants could not see the fit differences on the computer screen.
3.4 Comparison of ML algorithms to predict RFS
Table 3 shows the calculated correlation coefficients between the measured RFS and predicted RFS for different ML algorithms. According to these results, the prediction efficacy of the RF algorithm was considerably better (r = 0.74) than the CT algorithm (r = 0.55), and slightly better than the SVM algorithms with radial (r = 0.72) and linear kernels (r = 0.70). On the other hand, using only VFS as the predictor variable and excluding all other variables (i.e., body satisfaction, body measurements, and fabric properties) developed a significant drop in the prediction power of the models. Only the CT algorithm did not show any significant change.
Correlation coefficient between measured RFS and predicted RFS for different ML algorithms
| ML algorithm | Correlation coefficient (r): all predictor variables (body measurements, body satisfactions, fabric properties, VFS) were used | Correlation coefficient (r): only VFS was used as the predictor variable |
|---|---|---|
| CT | 0.55 (0.02) | 0.55 (0.02) |
| RF | 0.74 (0.02) | 0.51 (0.02) |
| SVM (linear) | 0.70 (0.02) | 0.62 (0.02) |
| SVM (radial) | 0.72 (0.02) | 0.53 (0.01) |
Note: Standard errors (SEs) are given in parentheses.
3.5 Variable importance to predict RFS
Once we have decided that the RF models were consistently more accurate than the alternative models based on the cross-validation results, we have calculated the variable importance scores of the explanatory variables extracted from an RF model that used all the data for training. Figure 4 illustrates the importance of different variables to predict the RFS of the participants. Among 35 different variables, VFS had the highest importance followed by relevant body measurements for the selected skirt style (i.e., belly circumference, waist girth). The body satisfaction of the participants for their thighs and legs weighed important among other body parts. Among ten different fabric properties, elongation in the weft direction (E_weft) had the highest importance in predicting RFS, and it was followed by bending rigidity in the weft direction (B_weft).

Variable importance to predict participants’ RFSs.
4 Discussion
In this study, three different ML algorithms (CT, RF, and SVM) were used to predict participants’ RFSs, and among these algorithms, RF gave the best prediction accuracy (r = 0.74) according to the calculated correlation coefficient between the measured and calculated RFSs. On the other hand, the performance of CT was considerably lower (r = 0.55) than that of the other ML algorithms. The reason for this conclusion might be due to the complex and interactive relationships between the explanatory variables and the response variable, and RF can adapt to explain these more complex relationships. In addition, some variables such as belly circumference and waist girth are deemed important in explaining the response by the RF model, while correlated variables such as abdomen and waist satisfaction are deemed much less important. This is probably due to the strong relationships between the former variable and the latter.
In Liu et al.’s study [12], which focused on predicting participants’ fit satisfactions, garment fit was considered to be a classification problem (0: unfit and 1: fit). However, our study approached garment fit as a regression problem due to the continuous nature of the fit satisfaction variable and achieved substantial prediction accuracies. Our findings showed that the participants had different fit satisfaction levels; therefore, limiting the consumers’ fit satisfaction levels to two classes (fit vs unfit) might be too restrictive. Besides, RF and SVM algorithms seemed to work well to predict consumers’ fit satisfactions in a regression problem. Although the methodology offered in our study successfully predicted participants’ fit satisfactions for a certain skirt type, the variables used for prediction should be changed for other clothes styles (i.e., jeans, shirts). The style used in this study was an over-knee circular skirt. Therefore, we predicted for this particular skirt style that lower body measurements and satisfaction with the lower body parts would impact fit satisfaction. However, for a shirt sample or any other skirt style with a different silhouette, one should expect that the relevant body measurements and body satisfactions to be used for the prediction model would differ.
Another outcome of the study is to prove that when the virtual fit component was excluded, the prediction accuracies dropped significantly (Table 3). Among the other variables used in this study, VFS had the highest importance score (Figure 4). Academic studies in the virtual fit area usually discuss whether 3D garment simulations are accurate or not. However, in this study, we showed that despite the accuracy concerns, 3D simulations are very useful to assist consumers with their decisions about garment fit. Our findings indicate that if consumers are satisfied with the virtual fit, it is very likely that they will be satisfied when they actually try on the garment.
5 Conclusion
Even though various attempts exist to use virtual try-on for online shopping, it is still not widely accepted by companies and consumers. One of the major obstacles to using virtual try-on for online shopping has been the difficulty to achieve a realistic body model of the consumers. However, with the integration of depth sensor cameras in mobile phones, body scanning is becoming easier [47]. Another critical obstacle to overcome has been to create digital garments and fabric libraries. As fashion brands shift their product development strategies and become more 3D design-centered, they have started building these libraries faster [48]. This would make it possible to prepare and display garments’ digital simulations in the online stores way before the garments are placed on the store shelves. Moreover, when digital fashion and ML applications combine to interpret fashion consumers’ behavior accurately, consumer satisfaction and companies’ profits would inevitably increase.
In the current study, we presented an example of how digital garment simulations and ML applications could be used together successfully to reduce garment fit-related problems after purchasing garments online. Most importantly, we found that a subjective component, i.e., VFS, is a significant factor in predicting how consumers would perceive the fit of real garments. The methods explained in the study may be helpful for fashion companies to improve the realism of their digital samples, rather than making them picture perfect for advertisements, to reduce their return rates, and to increase customer satisfaction when virtual try-on becomes an integral part of online shopping.
-
Conflict of interest: Authors state no conflict of interest.
-
Data availability statement: The datasets generated during and/or analysed during the current study are available from the corresponding author on reasonable request.
References
[1] Cilley, J. How to use 3d body imaging to innovate in the apparel or footwear industry. Body x Labs. https://3dprint.com/wp-content/uploads/2016/06/Webinar-2016-Retail-Survey-Report-3DPrint.com-v2.pdf. (2016, accessed February 21, 2024).Search in Google Scholar
[2] Bertram, R. F., Chi, T. (2017). A study of companies’ business responses to fashion e-commerce’s environmental impact. International Journal of Fashion Design, Technology and Education, 11, 254–264.10.1080/17543266.2017.1406541Search in Google Scholar
[3] Lee, H. H., Kim, J., Fiore, A. M. (2010). Affective and cognitive online shopping experience. Clothing and Textiles Research Journal, 28, 140–154.10.1177/0887302X09341586Search in Google Scholar
[4] Baytar, F., Chung, T., Shin, E. (2020). Evaluating garments in augmented reality when shopping online. Journal of Fashion Marketing and Management: An International Journal, 24, 667–683.10.1108/JFMM-05-2018-0077Search in Google Scholar
[5] Bhattarai, A. (2020). Virtual try-ons are replacing fitting rooms during the pandemic. Washington Post. https://www.washingtonpost.com/business/2020/07/09/virtual-try-ons-are-replacing-fitting-rooms-during-pandemic/.Search in Google Scholar
[6] Thomassey, S., Zeng, X. (2018). Introduction: Artificial intelligence for fashion industry in the big data era. In: Erratum to: Artificial Intelligence for Fashion Industry in the Big Data Era (pp. 1–6). Springer, Singapore.10.1007/978-981-13-0080-6_1Search in Google Scholar
[7] Guo, Z., Wong, W., Leung, S., Li, M. (2011). Applications of artificial intelligence in the apparel industry: a review. Textile Research Journal, 81, 1871–1892.10.1177/0040517511411968Search in Google Scholar
[8] Giri, C., Jain, S., Zeng, X., Bruniaux, P. (2019). A detailed review of artificial intelligence applied in the fashion and apparel industry. IEEE Access, 7, 95376–95396.10.1109/ACCESS.2019.2928979Search in Google Scholar
[9] Hui, C. L., Lau, T. W., Ng, S. F., Chan, K. C. C. (2004). Neural network prediction of human psychological perceptions of fabric hand. Textile Research Journal, 74, 375–383.10.1177/004051750407400501Search in Google Scholar
[10] Pavlinic, D. Z., Gersak, J. (2009). Predicting garment appearance quality. The Open Textile Journal, 2, 29–38.10.2174/1876520300902010029Search in Google Scholar
[11] Hu, Z.-H., Ding, Y.-S., Yu, X.-K., Zhang, W. B., Yan, Q. (2009). A hybrid neural network and immune algorithm approach for fit garment design. Textile Research Journal, 79, 1319–1330.10.1177/0040517508100726Search in Google Scholar
[12] Liu, K., Zeng, X., Bruniaux, P., Wang, J., Kamalha, E., Tao, X. (2017). Fit evaluation of virtual garment try-on by learning from digital pressure data. Knowledge-Based Systems, 133, 174–182.10.1016/j.knosys.2017.07.007Search in Google Scholar
[13] Tao, X., Chen, X., Zeng, X., Koehl, L. (2018). A customized garment collaborative design process by using virtual reality and sensory evaluation on garment fit. Computers & Industrial Engineering, 115, 683–695.10.1016/j.cie.2017.10.023Search in Google Scholar
[14] Chen, X, Tao, X, Zeng, X, Koehl, L., Boulenguez-Phippen, J. (2015). Control and optimization of human perception on virtual garment products by learning from experimental data. Knowledge-Based Systems, 87, 92–101.10.1016/j.knosys.2015.05.031Search in Google Scholar
[15] Breiman, L. (2001). Random Forests. Machine Learning, 45, 5–32. 10.1023/A:1010933404324.Search in Google Scholar
[16] Cortes, C., Vapnik, V. (1995). Support-vector networks. Machine Learning. 20, 273–297. 10.1007/BF00994018.Search in Google Scholar
[17] State of Data Science and Machine Learning. (2020). State of Data Science and Machine Learning 2020 | Kaggle. https://www.kaggle.com/kaggle-survey-2020.Search in Google Scholar
[18] Kumar, M., Thenmozhi, M. (2006). Forecasting stock index movement: A comparison of support vector machines and random forest. Indian Institute of Capital Markets 9th Capital Markets Conference Paper. 10.2139/ssrn.876544.Search in Google Scholar
[19] Liaw, A., Wiener, M. (2002). Classification and regression by random forest. R News, 2. https://cran.r-project.org/doc/Rnews/Rnews_2002-3.pdf.Search in Google Scholar
[20] Frost, K. (1988). Consumer’s perception of fit and comfort of pants. St. Paul: University of Minnesota, Minneapolis.Search in Google Scholar
[21] Kim, M. J. (2008). Consumers perceptions of apparel products in internet shopping. (PhD thesis). Oregon State University, Corvallis.Search in Google Scholar
[22] Gill, S. (2015). A review of research and innovation in garment sizing, prototyping and fitting. Textile Progress, 47, 1–85.10.1080/00405167.2015.1023512Search in Google Scholar
[23] Sayem, A. S. M. (2016). Objective analysis of the drape behaviour of virtual shirt, part 1: avatar morphing and virtual stitching. International Journal of Fashion Design, Technology and Education, 10, 158–169.10.1080/17543266.2016.1223354Search in Google Scholar
[24] Sayem, A. S. M. (2016). Objective analysis of the drape behaviour of virtual shirt, part 2: technical parameters and findings. International Journal of Fashion Design, Technology and Education, 10, 180–189.10.1080/17543266.2016.1223810Search in Google Scholar
[25] Lin, Y. L., Wang, M. J. J. (2015). The development of a clothing fit evaluation system under virtual environment. Multimedia Tools and Applications, 75, 7575–7587.10.1007/s11042-015-2681-7Search in Google Scholar
[26] Apeagyei, P. R., Otieno, R. (2007). Usability of pattern customising technology in the achievement and testing of fit for mass customisation. Journal of Fashion Marketing and Management: An International Journal, 11, 349–365.10.1108/13612020710763100Search in Google Scholar
[27] Jin, H. (2016). The development and evaluation of the tennis shirt pattern for a wheelchair tennis player in a CAD program. (PhD thesis). Oregon State University, Corvallis.Search in Google Scholar
[28] Ancutiene, K., Sinkeviciute, D. (2011). The influence of textile materials mechanical properties upon virtual garment fit. Materials Science, 17, 160–167.10.5755/j01.ms.17.2.486Search in Google Scholar
[29] Lim, H., Istook, C. L. (2011). Drape simulation of three-dimensional virtual garment enabling fabric properties. Fibers and Polymers, 12, 1077–1082.10.1007/s12221-011-1077-1Search in Google Scholar
[30] Brand, R. H. (1964). Measurement of fabric aesthetics. Textile Research Journal, 34, 791–804.10.1177/004051756403400909Search in Google Scholar
[31] LaBat, K. L, DeLong, M. R. (1990). Body cathexis and satisfaction with fit of apparel. Clothing and Textiles Research Journal, 8, 43–48.10.1177/0887302X9000800206Search in Google Scholar
[32] Kim, D. E., LaBat, K. (2012). An exploratory study of users’ evaluations of the accuracy and fidelity of a three-dimensional garment simulation. Textile Research Journal, 83, 171–184.10.1177/0040517512458339Search in Google Scholar
[33] Buyukaslan, E., Baytar, F., Kalaoglu, F. (2020). Exploring the factors influencing consumers’ virtual garment fit satisfactions. Research Journal of Textile and Apparel, 24, 375–388.Search in Google Scholar
[34] Leading product categories bought online among internet users in the United States as of November 2017, by age group. Statista; 2018 Jan. https://www.statista.com/statistics/693629/usa-online-shopping-product-categories-by-age/.Search in Google Scholar
[35] Pandurangan, P., Eischen, J., Kenkare, N., Lamar, T. A. (2008). Enhancing accuracy of drape simulation. Part II: Optimized drape simulation using industry-specific software. Journal of the Textile Institute, 99, 219–226.10.1080/00405000701489198Search in Google Scholar
[36] Shin, E. (2013). Exploring consumers’ fit perceptions and satisfaction with apparel fit in general. (Master’s thesis). Iowa State University, Ames.Search in Google Scholar
[37] Buyukaslan, E., Baytar, F., Kalaoglu, F. (2018). Creating garment simulations: Effectiveness of traditional textile testing equipment versus KES and FAST Systems. International Textile and Apparel Association Annual Conference Proceedings. https://www.iastatedigitalpress.com/itaa/article/id/1484/.Search in Google Scholar
[38] Frydrych, I., Dziworska, G., Cieślińska, A. (2000). Mechanical fabric properties influencing the drape and handle. International Journal of Clothing Science and Technology, 12, 171–183.10.1108/09556220010345350Search in Google Scholar
[39] Giorgio Minazio, P. (1995). FAST – Fabric assurance by simple testing. International Journal of Clothing Science and Technology, 7, 43–48.10.1108/09556229510087146Search in Google Scholar
[40] Wang, X., Liu, X., Hurren, C. (2008). Physical and mechanical testing of textiles. In: Fabric Testing (pp. 90–123). Woodhead Publishing, Cambridge.10.1533/9781845695064.90Search in Google Scholar
[41] Peirce, F. T. (1930). The handle of cloth as a measurable quantity. Journal of the Textile Institute Transactions, 21, 377–416.10.1080/19447023008661529Search in Google Scholar
[42] Buyukaslan, E. (2019). Exploring consumers’ virtual garment fit satisfactions to Predict their actual satisfactions. (PhD thesis). Istanbul Technical University, Istanbul.10.1108/RJTA-03-2020-0029Search in Google Scholar
[43] Power, J. (2013). Fabric objective measurements for commercial 3D virtual garment simulation. International Journal of Clothing Science and Technology, 25, 423–439.10.1108/IJCST-12-2012-0080Search in Google Scholar
[44] Kuijpers, S., LuibleBär, C., Hugh Gong, R. (2020). The measurement of fabric properties for virtual simulation: A critical review. USA: The Institute of Electrical and Electronics Engineers. https://standards.ieee.org/wp-content/uploads/import/governance/iccom/3DBP-Measurement_Fabric_Properties-Virtual_Simulation.pdf (accessed February 21, 2024).Search in Google Scholar
[45] Shin, E., Baytar, F. (2013). Apparel fit and size concerns and intentions to use virtual try-on. Clothing and Textiles Research Journal, 32, 20–33.10.1177/0887302X13515072Search in Google Scholar
[46] Kuhn, M. (2008). Building predictive models in R using the caret package. Journal of Statistical Software. 28(5), 1–26. 10.18637/jss.v028.i05.Search in Google Scholar
[47] The Best 3D Scanning Apps for Smartphones in 2023. (2022). Aniwaa. https://www.aniwaa.com/buyers-guide/3d-scanners/best-3d-scanning-apps-smartphones/.Search in Google Scholar
[48] Borneman, J. (2019). Tommy hilfiger commits To 3D design to realize ambitious digitalization journey | textile world. tommy hilfiger commits To 3D design to realize ambitious digitalization journey | textile world. https://www.textileworld.com/textile-world/knitting-apparel/2019/11/tommy-hilfiger-commits-to-3d-design-to-realize-ambitious-digitalization-journey/.Search in Google Scholar
© 2024 by the authors, published by De Gruyter
This work is licensed under the Creative Commons Attribution 4.0 International License.
Articles in the same Issue
- Characterization of viscoelastic properties of yarn materials: Dynamic mechanical analysis in the transversal direction
- Analysis of omni-channel implementations that are preferred by consumers in clothing sector
- Structural modeling and analysis of three-dimensional cross-linked braided preforms
- An experimental study of mechanical properties and comfortability of knitted imitation woven shirt fabrics
- Technology integration to promote circular economy transformation of the garment industry: a systematic literature review
- Research on T-shirt-style design based on Kansei image using back-propagation neural networks
- Research on She nationality clothing recognition based on color feature fusion with PSO-SVM
- Accuracy prediction of wearable flexible smart gloves
- Preparation and performance of stainless steel fiber/Lyocell fiber-blended weft-knitted fabric
- Development of an emotional response model for hospital gown design using structural equation modeling
- Preparation and properties of stainless steel filament/pure cotton woven fabric
- Facemask comfort enhancement with graphene oxide from recovered carbon waste tyres
- Use of enzymatic processes in the tanning of leather materials
- Optical-related properties and characterization of some textile fibers using near-infrared spectroscopy
- Network modeling of aesthetic effect for Chinese Yue Opera costume simulation images
- Predicting consumers’ garment fit satisfactions by using machine learning
- Non-destructive identification of wool and cashmere fibers based on improved LDA using NIR spectroscopy
- Study on the relationship between structure and moisturizing performance of seamless knitted fabrics of protein fibers for autumn and winter
- Antibacterial and yellowing performances of sports underwear fabric with polyamide/silver ion polyurethane filaments
- Numerical and experimental analysis of ballistic performance in hybrid soft armours composed of para-aramid triaxial and biaxial woven fabrics
- Phonetic smart clothing design based on gender awareness education for preschoolers
- Determination of anthropometric measurements and their application in the development of clothing sizing systems for women in the regions of the Republic of Croatia
- Research on optimal design of pleated cheongsam based on Kano–HOQ–Pugh model
- Numerical investigation of weaving machine heald shaft new design using composite material to improve its performance
- Corrigendum to “Use of enzymatic processes in the tanning of leather materials”
- Shaping of thermal protective properties of basalt fabric-based composites by direct surface modification using magnetron sputtering technique
- Numerical modeling of the heat flow component of the composite developed on the basis of basalt fabric
- Weft insertion guideway design based on high-temperature superconducting levitation
- Ultrasonic-assisted alkali hydrolysis of polyethylene terephthalate fabric and its effect on the microstructure and dyeing properties of fibers
- Comparative study on physical properties of bio-based PA56 fibers and wearability of their fabrics
- Investigation of the bias tape roll change time efficiency in garment factories
- Analysis of foot 3D scans of boys from Polish population
- Optimization of garment sewing operation standard minute value prediction using an IPSO-BP neural network
- Influence of repeated switching of current through contacts made of electroconductive fabrics on their resistance
- Numerical calculation of air permeability of warp-knitted jacquard spacer shoe-upper materials based on CFD
- Compact Spinning with Different Fibre Types: An Experimental Investigation on Yarn Properties in the Condensing Zone with 3D-Printed Guiding Device
- Modeling of virtual clothing and its contact with the human body
- Advances in personalized modelling and virtual display of ethnic clothing for intelligent customization
- Investigation of weave influence on flame retardancy of jute fabrics
- Balloonless spinning spindle head shape optimisation
- Research on 3D simulation design and dynamic virtual display of clothing flexible body
- Turkish textile and clothing SMEs: Importance of organizational learning, digitalization, and internationalization
- Corrigendum To: “Washing characterization of compression socks”
- Study on the promotion multiple of blood flow velocity on human epidermal microcirculation of volcanic rock polymer fiber seamless knitted fabric
- Bending properties and numerical analysis of nonorthogonal woven composites
- Bringing the queen mother of the west to life: Digital reconstruction and analysis of Taoist Celestial Beings Worshiping mural’s apparel
- Modeling process for full forming sports underwear
- Retraction of: Ionic crosslinking of cotton
- An observational study of female body shape characteristics in multiracial Malaysia
- Study on theoretical model and actual deformation of weft-knitted transfer loop based on particle constraint
- Design and 3D simulation of weft-knitted jacquard plush fabrics
- An overview of technological challenges in implementing the digital product passport in the textile and clothing industry
- Understanding and addressing the water footprint in the textile sector: A review
- Determinants of location changes in the clothing industry in Poland
- Influence of cam profile errors in a modulator on the dynamic response of the heald frame
- Quantitative analysis of wool and cashmere fiber mixtures using NIR spectroscopy
- 3D simulation of double-needle bar warp-knitted clustered pile fabrics on DFS
- Finite element analysis of heat transfer behavior in glass fiber/metal composite materials under constant heat load
- Price estimation and visual evaluation of actual white fabrics used for dress shirts and their photographic images
- Effect of gluing garment materials with adhesive inserts on their multidirectional drape and bending rigidity
- Optimization analysis of carrier-track collision in braiding process
- Numerical and experimental analysis of the ballistic performance of soft bulletproof vests for women
- The antimicrobial potential of plant-based natural dyes for textile dyeing: A systematic review using prisma
- Influence of sewing parameters on the skin–fabric friction
- Validation by experimental study the relationship between fabric tensile strength and weave structures
- Optimization of fabric’s tensile strength and bagging deformation using surface response and finite element in stenter machine
- Analysis of lean manufacturing waste in the process flow of ready-to-wear garment production in Nigeria
- An optimization study on the sol–gel process to obtain multifunctional denim fabrics
- Drape test of fully formed knitted flared skirts based on 3D-printed human body posture
- Supplier selection models using fuzzy hybrid methods in the clothing textile industry