Quantitative analysis of wool and cashmere fiber mixtures using NIR spectroscopy
-
Jinni Chen
 ,
Yunhong Li
,
Yunhong Li

Abstract
The quantitative determination of wool and cashmere mixed fiber is an indispensable quality control link in the textile industry, crucial for improving international trade status, ensuring product quality, and safeguarding consumer rights. Therefore, the goal of this study is to develop a reliable method for estimating fiber contents in wool–cashmere blends based on near-infrared (NIR) spectroscopy. A total of 210 mixed samples of 21 different proportions of cashmere and wool are prepared in the experiment, and data are collected in the NIR spectral band of 1,000–2,500 nm. Convolution Savitzky–Golay (S–G) combined with the second-order derivative is then used for spectral preprocessing. The variable iterative space shrinkage approach (VISSA) optimizes the characteristic wavelengths, and 339 wavelength points are selected. The prediction model of the least squares support vector machine (LSSVM) is established by particle swarm optimization (PSO), fast positioning, and analysis of key information related to the target in complex spectral data. Finally, the training set and the prediction set are divided according to the ratio of 8 : 2. Experiments show that in terms of modeling and prediction, the PSO-LSSVM model based on the wavelength selected by VISSA has a prediction determination coefficient R-squared of 0.9821, a prediction root mean square error of 1.1263, and an mean absolute error of 0.6527. The hybrid modeling method of VISSA, PSO, and LSSVM based on NIR spectroscopy (VISSA–PSO–LSSVM) can provide a more accurate and stable method for the non-destructive detection of cashmere and wool blended fiber content.
1 Introduction
Wool and cashmere are both natural protein fibers, which are very similar in chemical composition and tissue structure [1]. However, due to its excellent gloss, uniform fineness, good elasticity, and rarity, cashmere fiber has a higher value in textiles and is used to make high-end and luxury textiles. Due to limited production and supply difficulties, the economic value of cashmere far exceeds that of wool. In textile production, cashmere is often intentionally mixed with wool to reduce production costs. Therefore, how to test the blending ratio quickly, accurately, non-destructively, and green environmental protection has become a challenging task in the field of fiber testing [2].
The existing traditional methods mainly rely on microscopy, scanning electron microscopy, staining, quantitative analysis of stretching fluid, etc. [3]. In recent years, near-infrared (NIR) spectroscopy has utilized the characteristics of the interaction between the NIR light band and the material. By measuring the spectral information of the sample in this band, the non-destructive analysis of the composition, structure, and properties of the sample is realized [4]. Its advantages make it widely used in many fields such as chemistry [5], biology [6], food [7], and textile [8]. However, due to the high dimension, band overlap, and non-linearity of NIR spectral data [9], the established model may produce a large error in the process of data prediction [10]. In order to overcome these problems, the researchers preprocessed the spectrum and selected features before establishing the analysis model [11,12]. At the same time, the relationship between the spectral characteristics and the properties of the measured target was established by combining the chemometrics method to realize the quantitative analysis and the qualitative of the sample [13]. Deng et al. proposed a new VISSA based on model population analysis, which generates sub-models across variable subspaces by weighted binary matrix sampling (WBMS) and shows better prediction ability in NIR data correction [14]. Nawar et al. conducted the performance analysis of least squares regression, support vector regression, and multivariate adaptive regression splines on 102 soil samples to determine the best method for evaluating the effect of salt on soil organic matter and clay content [15]; Wu and Yong proposed a method combining principal component analysis (PCA) and support vector machines (SVM), which can identify and distinguish various cashmere varieties [16]. Anceschi et al. used NIR spectroscopy combined with chemometrics methods to analyze and discriminate the quantitative characteristics of raw cashmere fibers, regenerated cashmere fibers, and their mixtures [17]. Quispe et al. compared the accuracy of deep neural networks and SVM in machine learning for camel and goat fiber spectral classification [18].
According to the above literature, in the application of NIR technology, the recognition of wool and cashmere has made important breakthroughs. However, it still faces severe challenges. The existing advanced methods mainly use PCA to reduce the dimension of data and extract a small number of principal component variables to explain most of the original variables. In terms of model selection, SVM is used to find the optimal hyperplane in the feature space to reduce the error of predicting or fitting continuous variables. Although PCA and SVM have shown potential in data dimensionality reduction and nonlinear data processing, they have their own limitations: PCA, as an unsupervised method, only analyzes the overall variable data, and each sample contributes equally to the model, ignoring the differences between samples; the parameter sensitivity of SVM requires tedious parameter optimization, which poses a challenge to the accuracy of quantitative analysis in the face of spectral similarity and overlap of cashmere and wool fibers.
In order to overcome these limitations, the VISSA is introduced. Compared with PCA, VISSA effectively reduces the complexity of the feature space by sorting features to identify the features that contribute most to data variability, especially in capturing nonlinear relationships. The least squares SVM model is combined with particle swarm optimization algorithm, the model parameters can be adaptively optimized, and the generalization ability and prediction accuracy of the model can be significantly improved. The main contributions and innovations of this article are summarized as follows:
Self-built cashmere and wool mixed fiber spectral data set: Due to the lack of corresponding wool and cashmere mixed fiber spectral data sets, in this study, a data set was constructed based on the standard sample preparation method of NIR spectroscopy. The NIR spectrometer was used to scan the sample to obtain spectral data to meet the needs of mixed fiber detection and provide reliable data support for research.
Feature band selection: VISSA is used to extract the feature bands, which can effectively capture the complex linear and nonlinear correlations in the spectral data. By calculating the correlation coefficient between the band and the cashmere fiber, the band characteristics with high correlation with the cashmere component content are retained, thus greatly reducing the dimension of the data.
PSO-LSSVM model: The PSO algorithm is introduced to effectively search the optimal parameter combination of LSSVM. It has strong adaptability and generalization ability to deal with small sample high-dimensional data and nonlinear problems and provides a basis for improving the accuracy of quantitative analysis model.
2 Experimental
2.1 Sample preparation
In the experiment, the standard sample preparation KBr tableting method for NIR spectroscopy analysis of textile materials is used for sample preparation [19]. The KBr tableting method has multiple advantages, such as improving sample uniformity, enhancing absorption intensity, reducing scattering intensity, and eliminating hydrogen bonding in infrared spectrum preparation; it can provide a strong guarantee for the accuracy and reliability of NIR spectroscopy analysis. Therefore, the KBr tableting method is used for sample preparation in the experiment. The specific steps are as follows:
The collected wool and cashmere fibers were weighed according to the mass fraction. The mass fraction of cashmere was from 0 to 100%, with an interval of 5%. Each sample weighed 0.1 g and was accurate to 0.001 g.
Different proportions of mixed wool and cashmere fibers were cut into small pieces and then ground into small powder with agate mortar (the particle size was less than 1.5 mm after crushing treatment).
Then, according to the ratio of sample: KBr = 1 : 20, 2 g KBr reagent was taken from each sample and uniformly mixed with it.
The mixed sample powder was placed at the pressure film to obtain the potassium bromide tablet and finally placed on the NIR spectrometer for data measurement. The overall flow chart of the experiment is shown in Figure 1.
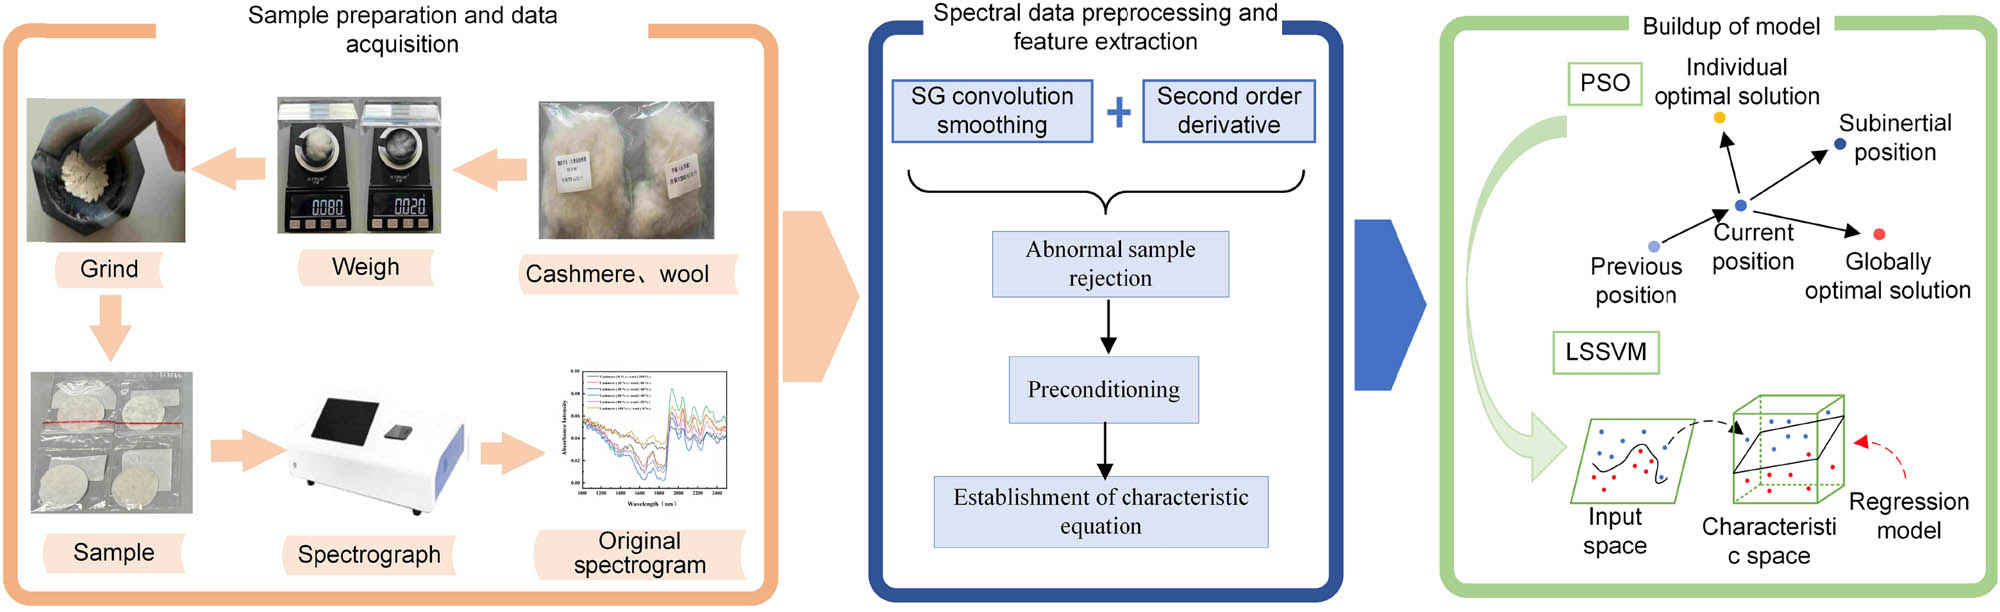
The overall flow chart of the experiment.
2.2 Acquisition of spectral data sets
NIR spectral band data are collected using the RZNIR 7900 NIR spectrometer. The experimental environment temperature ranges from 10 to 30°C, and the infrared spectrometer is preheated for 30 min to ensure the stability and accuracy of the collected NIR spectral data. NIR spectral band data of samples are collected in diffuse reflection mode. The wavelength range is set from 1,000 to 2,500 nm with a sampling interval of 1 nm. Each sample is measured ten times, and the average values of positive and negative data sets are computed. After the measurement is completed, the average NIR spectral band data are exported and saved as a csv file. The original NIR spectra of some mixed samples with different proportions and wool-cashmere fiber spectra are shown in Figure 2.
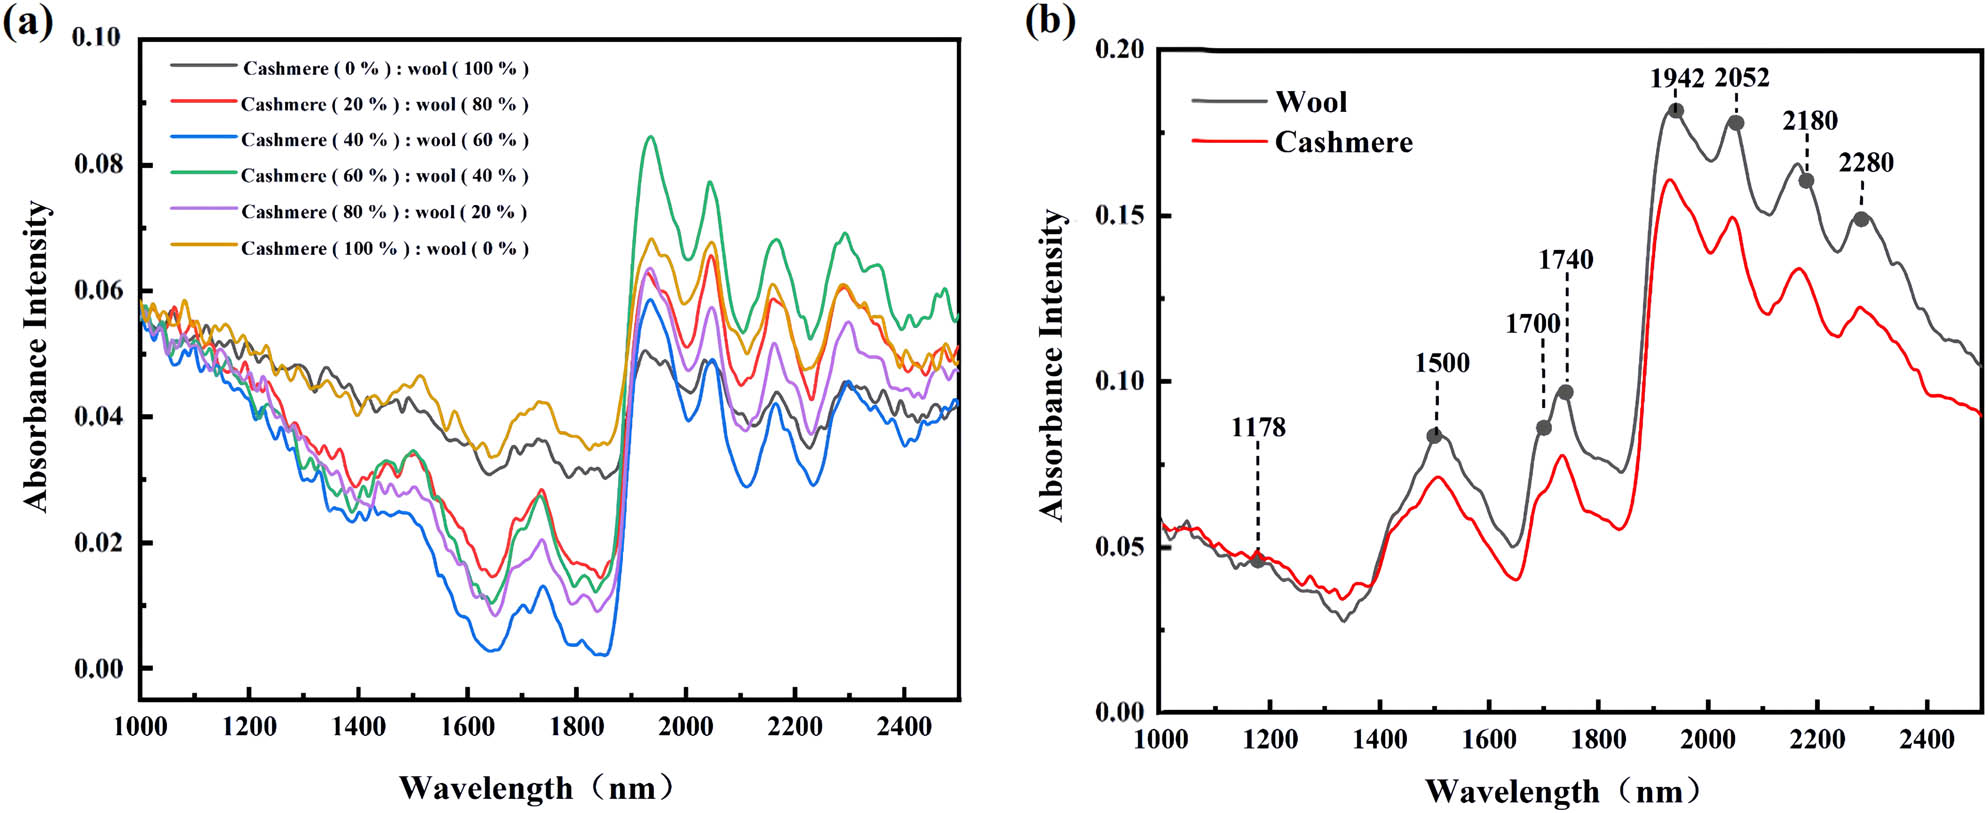
(a) The original NIR spectra of some mixed samples with different proportions and (b) wool-cashmere fiber spectrum.
All the algorithms are executed using MATLAB R2023a under the Windows 10 system.
2.3 Model evaluation index
The evaluation indexes used in this model are R-squared, mean absolute error (MAE), and root mean square error (RMSE) [20]. Among them,
2.4 Method
In this study, the convolution S–G filter is used to smooth the original spectral data, which effectively suppresses the noise and enhances the spectral characteristics through the second derivative. Subsequently, the VISSA algorithm is used to optimize the characteristic wavelength, and the efficiency and accuracy of the characteristic wavelength selection are improved by iteratively reducing the search space. Finally, the PSO algorithm is used to optimize the LSSVM model, and the rapid positioning and analysis of the key information related to the target are realized. The overall design flow chart of the algorithm is shown in Figure 3.
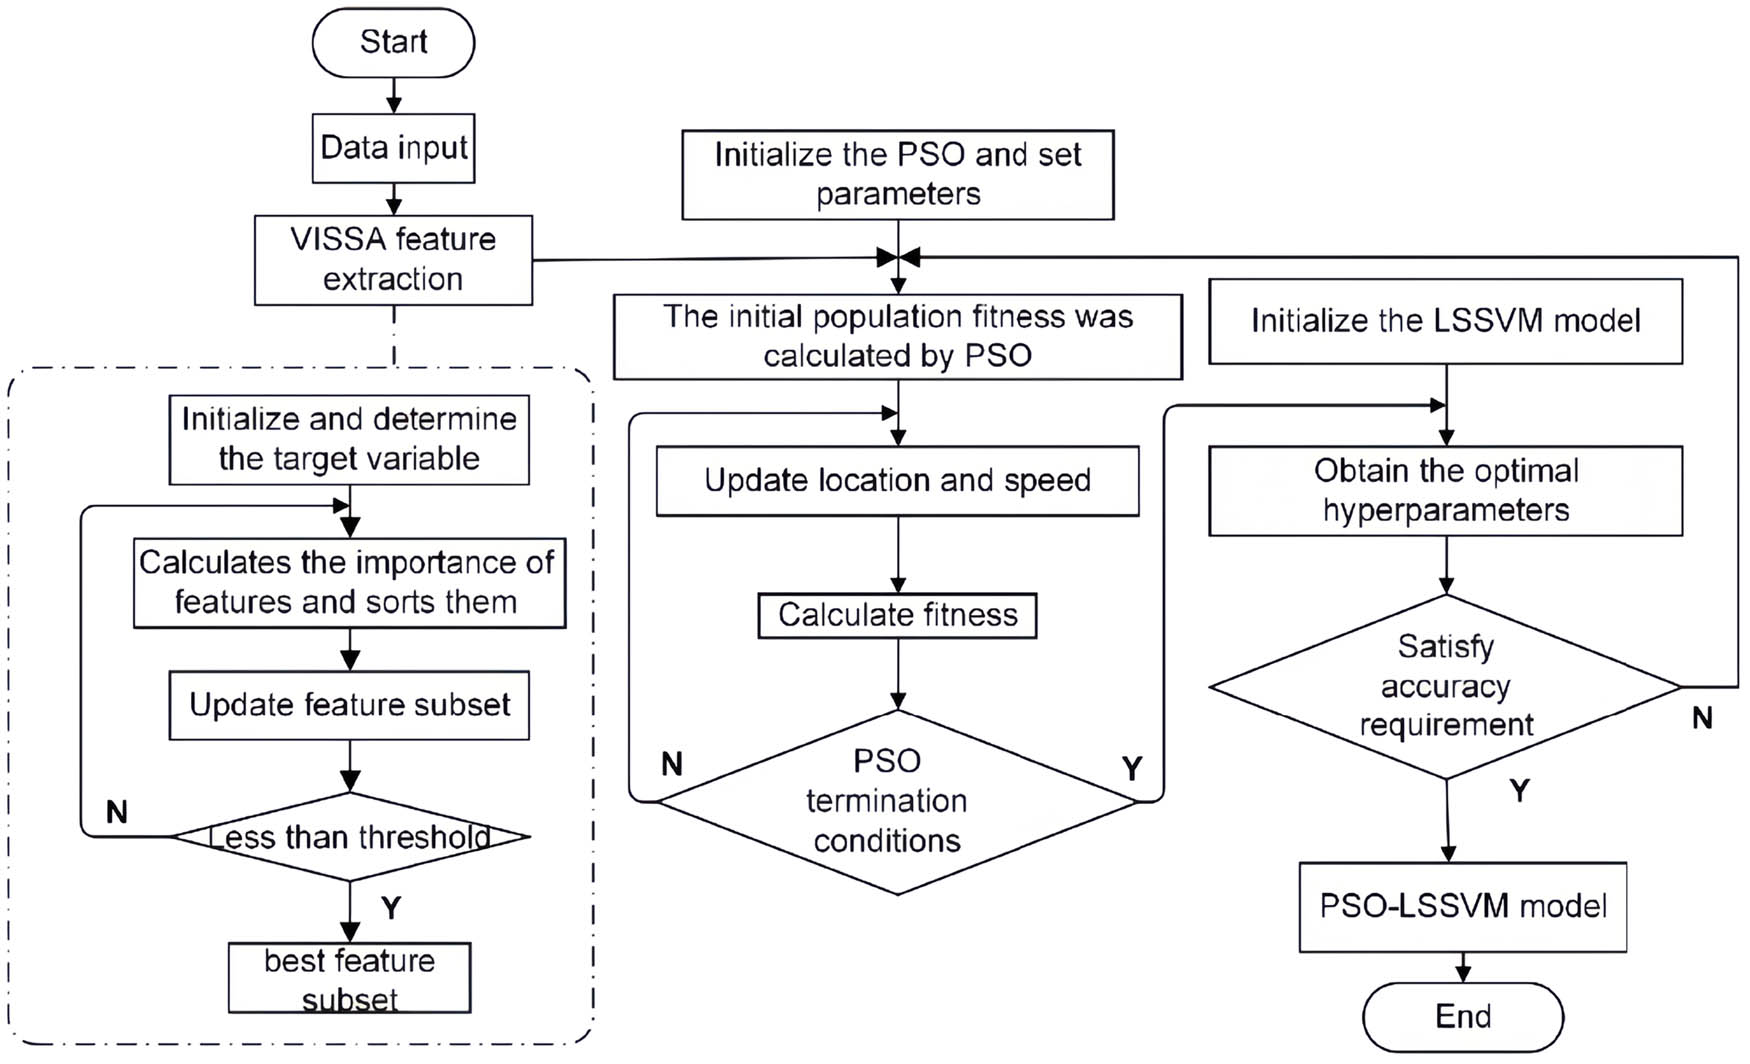
Flow chart of the PSO-LSSVM model.
In terms of feature selection, the core of VISSA is to construct a sub-model by WBMS, then extract the sub-model with the smallest prediction error, count the frequency of each variable, and assign variable weights to achieve variable space shrinkage. Among them, WBMS mainly allocates the number of variables in the sub-data set according to the current weight of the variable, ensuring that the variables with larger weights have a higher probability of being selected, so that each variable has a different sampling frequency. The weight formula of the variable is
In the formula, f i is the frequency of the variable in the best sub-model, m best is the most the number of good models, and w i is the proportion of sub-models containing variables.
2.4.1 LSSVM prediction model
As an extension of SVM, LSSVM simplifies the solution of quadratic programming problem and reduces the computational complexity of the model and the selection of hyperplane parameters [21]. The inequality constraint of SVM is replaced by the linear least squares criterion of the loss function, which makes the optimization problem of LSSVM become a linear programming problem. Its robustness, generalization ability, and convergence speed are significantly improved, and it is more suitable for processing high latitude, nonlinear small sample data.
When using LSSVM for pattern recognition, based on the principle of structural risk minimization, the least square method is used to establish the objective function of LSSVM. The expression is
In the formula,
In order to better solve the optimization problem, the Lagrange multiplier is introduced into the above equation, and it can be obtained that
In the formula,
By eliminating
In the above formula,
In view of the good stability of the radial basis function, it is adopted as the kernel function of the LSSVM model, namely:
which
The expression of the LSSVM prediction model is
2.4.2 The hyper-parameter selection of LSSVM optimized by PSO
PSO is a stochastic optimization algorithm, which is used to simulate the behavior of individuals in the population to find the optimal solution in the solution space and share information with other individuals in the group to find the global optimal solution [22]. In the PSO algorithm, each individual is represented as a particle, and each particle has its own position, speed, and corresponding fitness value by comparing with the adjacent particles and moving in the solution space to find the global optimal solution. The update process of the PSO algorithm can be described by the following formula:
In the formula,
Under the framework of PSO, the hyper-parameter selection of the LSSVM model is determined by two main components: the coding strategy of hyper-parameters and the formulation of the fitness function.
Hyperparameter coding involves transforming the hyperparameter set into the position representation of particles in the search space. For the LSSVM model, the key hyperparameters include kernel parameters and regularization factors. The particle swarm optimization algorithm uses particles to simulate the potential solutions in the search process, so each particle corresponds to a specific combination of hyperparameters [23]. In this article, we represent m hyperparameters as m-dimensional vectors, such as
PSO optimizes the initial parameter setting of LSSVM
| Parameter variable | Parameter value | Parameter variable | Parameter value |
|---|---|---|---|
| Learning factor
|
0.5 | Particle rate [
|
[−0.25, 0.25] |
| Learning factor
|
0.5 | Particle value [
|
[0.001, 200] |
| Population size | 20 | Inertia factor [
|
[0.4, 0.6] |
| Evolution times | 200 |
The fitness function is used to evaluate the pros and cons of particles in PSO. We define it as the generalization performance measure of the model; the calculation formula is as follows:
where the formulation of MRE can be seen in equation (14)
where
3 Results and analysis
3.1 Spectral data preprocessing
From the original spectrum, it can be seen that the overall trend of the sample lines with different mixing ratios is basically similar, but there are differences in the absorption intensity at certain wavelengths (Figure 4). The establishment of the model requires reducing the fluctuation of spectral data and increasing the difference between classes. Therefore, it is necessary to preprocess the collected data, the standard normal variate (SNV) and S–G, one or more combinations of second-order derivatives are used for preprocessing, and then the PSO-LSSVM model is established for each processed full-band spectrum [24]. The results of Table 2 show that the determination coefficient R-squared of the model obtained by SG (window size is 9, polynomial fitting order is 7) and the second derivative combined with PSO-LSSVM is 0.8875 on the test set, and the model effect is more stable and accurate.
Effects of different pretreatments on the PSO-LSSVM model
| Pretreatment method | R-squared |
|---|---|
| S–G | 0.8565 |
| SNV | 0.8616 |
| SNV + S–G | 0.8636 |
| SNV + second derivative | 0.8824 |
| S–G + second derivative | 0.8875 |
| Original data | 0.8527 |
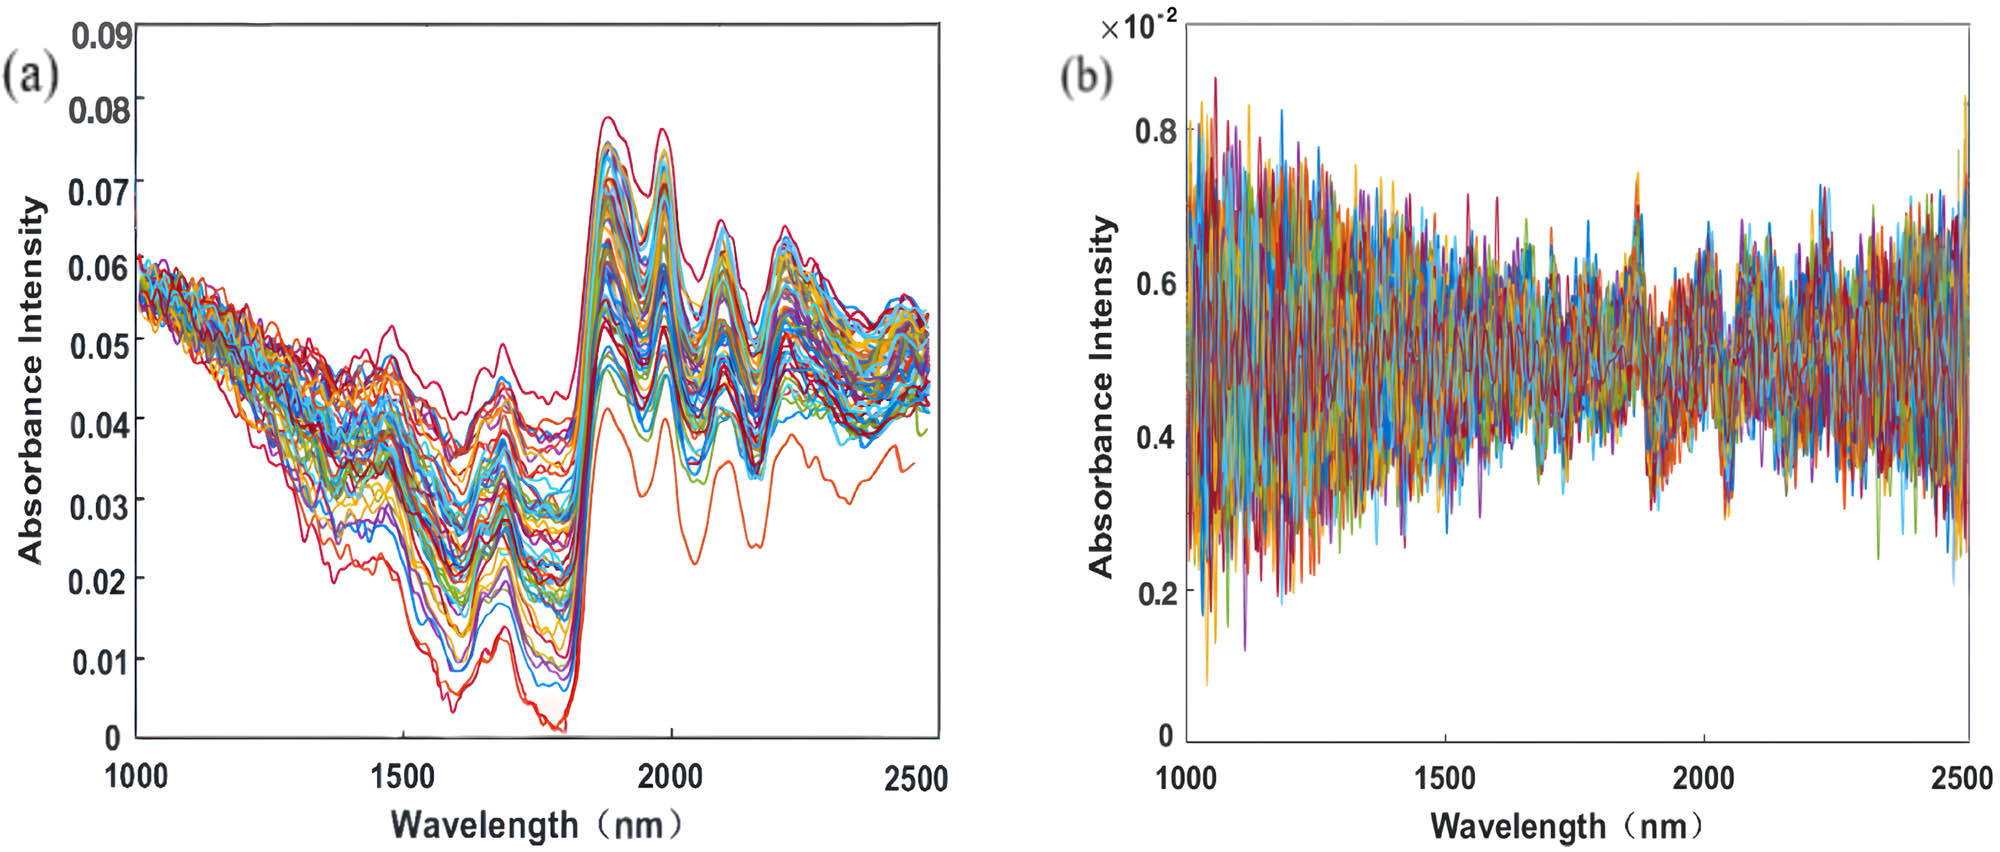
The original NIR spectra of 210 samples: (a) after treatment with S–G and (b) after treatment with S–G + D2.
3.2 Characteristic wavelength extraction
In the analysis of spectral data, based on the spectral data preprocessed by SG and second derivative combination, different algorithms were used to set parameters, and dimension reduction experiments were carried out. Specifically, the competitive adaptive reweighted sampling (CARS) algorithm used in this experiment carried out 50 Monte Carlo samplings, and the number of latent variable factors was set to 5 [25]; the optimal number of characteristic variables for successive projection algorithm (SPA) characteristic wavelength analysis was set to 2–18 [26]. The WBMS of the VISSA algorithm is set to 100 samples. All experiments used a fivefold cross-validation, the number of iterations was 10, and the median of the respective experimental results was used as the criterion.
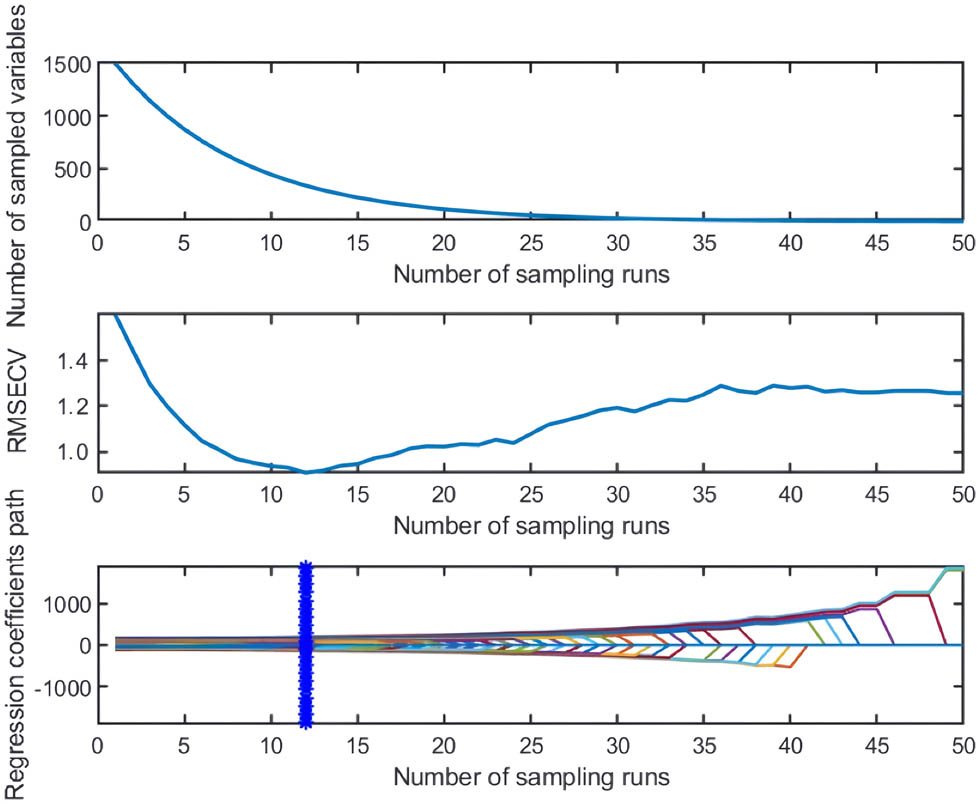
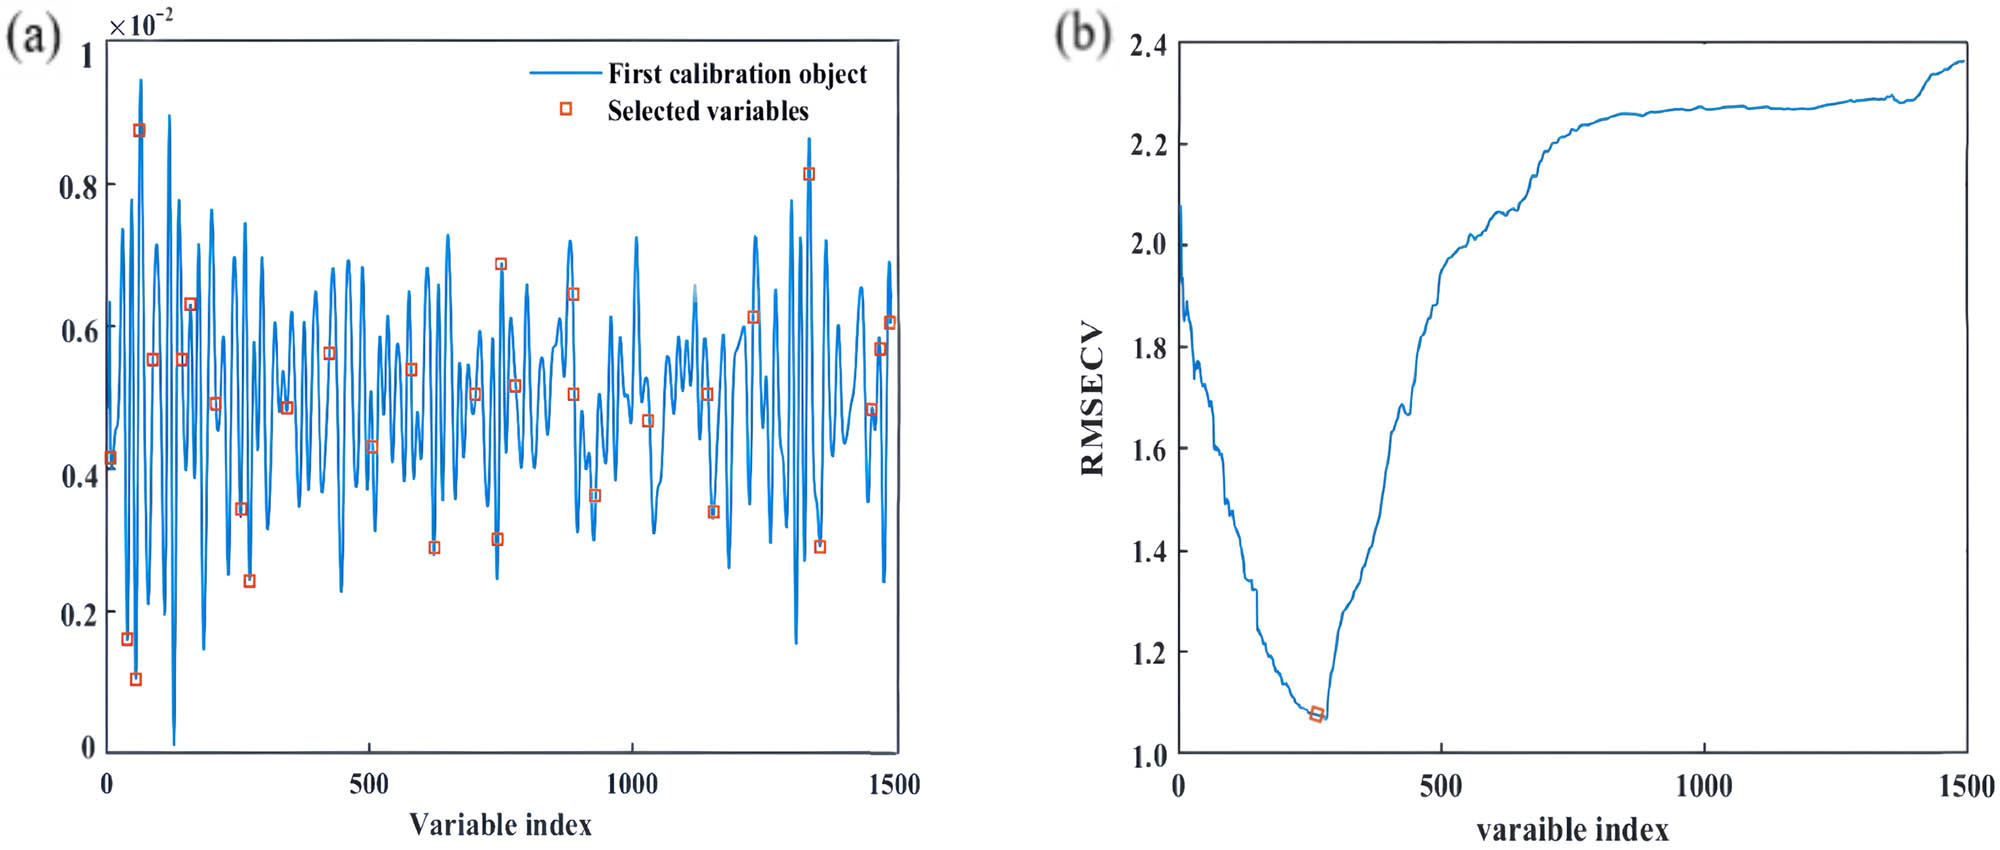
By observing Figures 5–7, we found that the CARS algorithm obtained the minimum root mean square error of cross validation (RMSECV) of 0.0793 after 12 Monte Carlo samplings and screened 282 wavelength points. The characteristic variables selected in the SPA algorithm tended to be stable after 17. Therefore, 17 wavelength points were finally selected, and the minimum RMSECV of the model was 0.2639. The VISSA algorithm selected 339 wavelength points, and the minimum RMSECV of the model was 0.0685 (Table 4). It should be noted that the sampling methods and the determination methods of the optimal variable characteristics used by these three algorithms are different, and they are based on the sub-model of random sampling, so there is no direct correlation between the algorithms [27].
CARS selects characteristic variables.
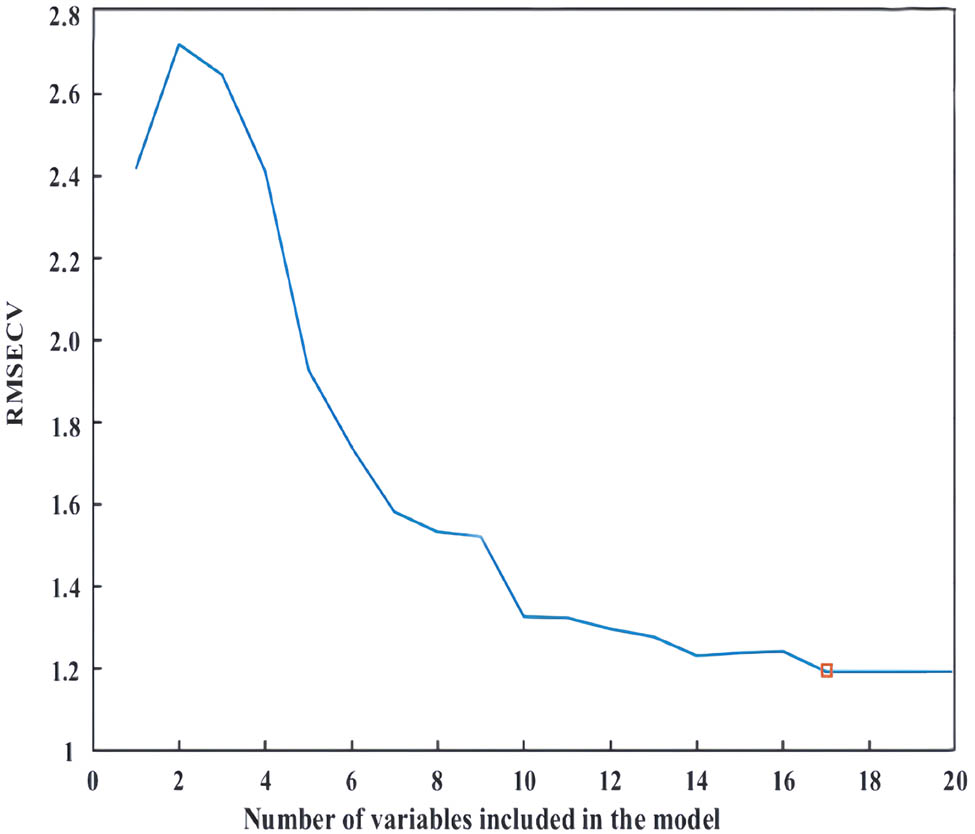
The change of RMSECV in SPA.
VIASSA feature extraction: (a) screening the distribution of characteristic variables on the spectral curve and (b) RMSECV changes with the number of characteristic variables.
The spectral absorption intensity of wool and cashmere is very similar, but the absorption intensity of wool is usually higher than that of cashmere. Therefore, we can distinguish these two fibers by selecting wavelengths with significant spectral differences and use them to evaluate their mixing ratio in the mixture. When selecting characteristic wavelengths, we found that there was a high correlation between the wavelengths corresponding to C–H, N–H, and C═O chemical bonds and cashmere content. However, by analyzing the visualization results of wavelength selection in Figure 8 and the corresponding chemical bonds in Table 3, it can be found that the number of wavelengths selected by CARS and SPA methods is small, and some key information variables may be missed. In contrast, the characteristic wavelengths selected by the VISSA algorithm not only cover the wavelength of the C–H bond at 1700 nm but also include other non-main absorption peaks. This shows that the VISSA algorithm can capture and contain more relevant information variables more comprehensively, thereby improving the stability and accuracy of the model.
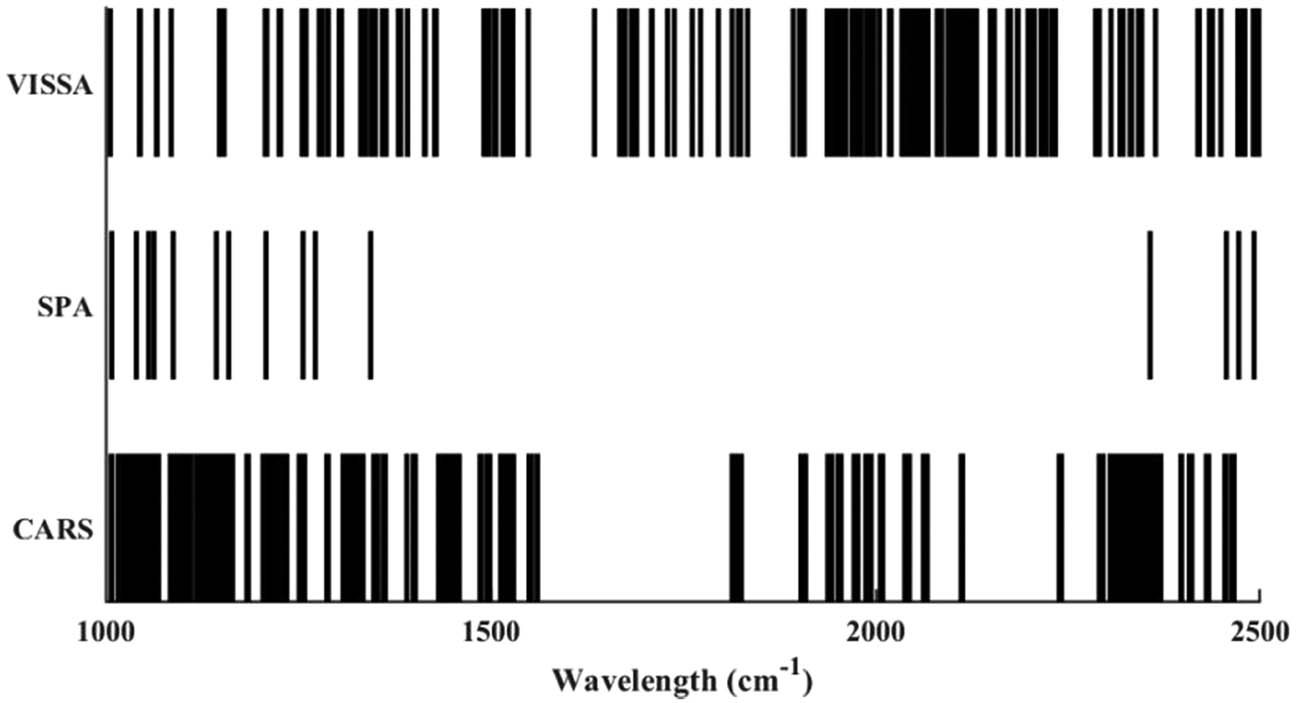
Comparison of wavelength selection of different algorithms.
Wavelengths and corresponding chemical bonds of wool and cashmere
| Absorption compartment | Main absorption peaks of wool and cashmere | Functional group |
|---|---|---|
| Single bond region | 1,178, 1,500, 1,700, 1,942, 2,052, 2,180, 2,280 nm | C–H, N–H, S–H |
| Stretching vibration | ||
| CH2 bending vibration | ||
| Double bond region | 1,500, 1,942, 2,052 nm | C═O stretching vibration |
Modeling results of different characteristic wavelength selection methods
| Pretreatment | Feature extraction | Model | R-square | RMSE | MAE |
|---|---|---|---|---|---|
| SG_d2 | CARS | PSO-LSSVM | 0.9284 | 1.0793 | 0.5490 |
| SPA | 0.9591 | 1.2639 | 0.6595 | ||
| VISSA | 0.9821 | 1.1263 | 0.6527 |
3.3 Establishment and comparison of models
The spectral data optimized by the VISSA feature is used as input to ensure the consistency of the spectral data before being put into the model. The prediction model of wool and cashmere blended fiber content was constructed by BP, KNN, LSSVM, and PSO-LSSVM. The modeling results are shown in Table 5. It can be seen that the R-square of the PSO-LSSVM model prediction set is 0.9821, RMSE is 1.1263, and MAE is 0.6527. It is better than BP, KNN, and LSSVM models. The BP model uses the gradient descent algorithm to adjust the weight and deviation in the network, but it is easy to fall into the local optimal solution. The KNN model relies on the characteristics of the surrounding K neighbors to predict and is sensitive to outliers; the LSSVM model fits the data by optimizing the distance between the smoothing curve and the data points, but it needs to carefully select the kernel function and adjust the parameters; according to the sub-model established by PSO-LSSVM, the VISSA characteristic wavelength input by modeling is selected. Therefore, the total variation of the dependent variable is explained by the independent variable (characteristic wavelength) through the regression relationship, that is, the coefficient of determination and the RMSE are optimal. The model is more stable and accurate.
Prediction results of cashmere fiber content based on different modeling methods
| Modeling method | Prediction set | ||
|---|---|---|---|
| R-square | RMSE | MAE | |
| BP | 0.8963 | 1.8236 | 0.8429 |
| KNN | 0.9224 | 2.3763 | 1.2571 |
| LSSVM | 0.9582 | 1.6452 | 0.7385 |
| VISSA-PSO-LSSVM | 0.9821 | 1.1263 | 0.6527 |
Figure 9 shows the comparison of the model effects of different modeling methods, in which the straight line represents the fitting curve with a slope of 1. The closer the data points are to the fitting curve, the smaller the prediction deviation is. It can be seen that the predicted value of the cashmere content in the mixed fiber by the model constructed by the PSO-LSSVM method is basically evenly distributed near the fitting curve, and the effect is obviously better than that of BP, KNN, and LSSVM models, indicating that the model constructed by the PSO-LSSVM method has better performance.
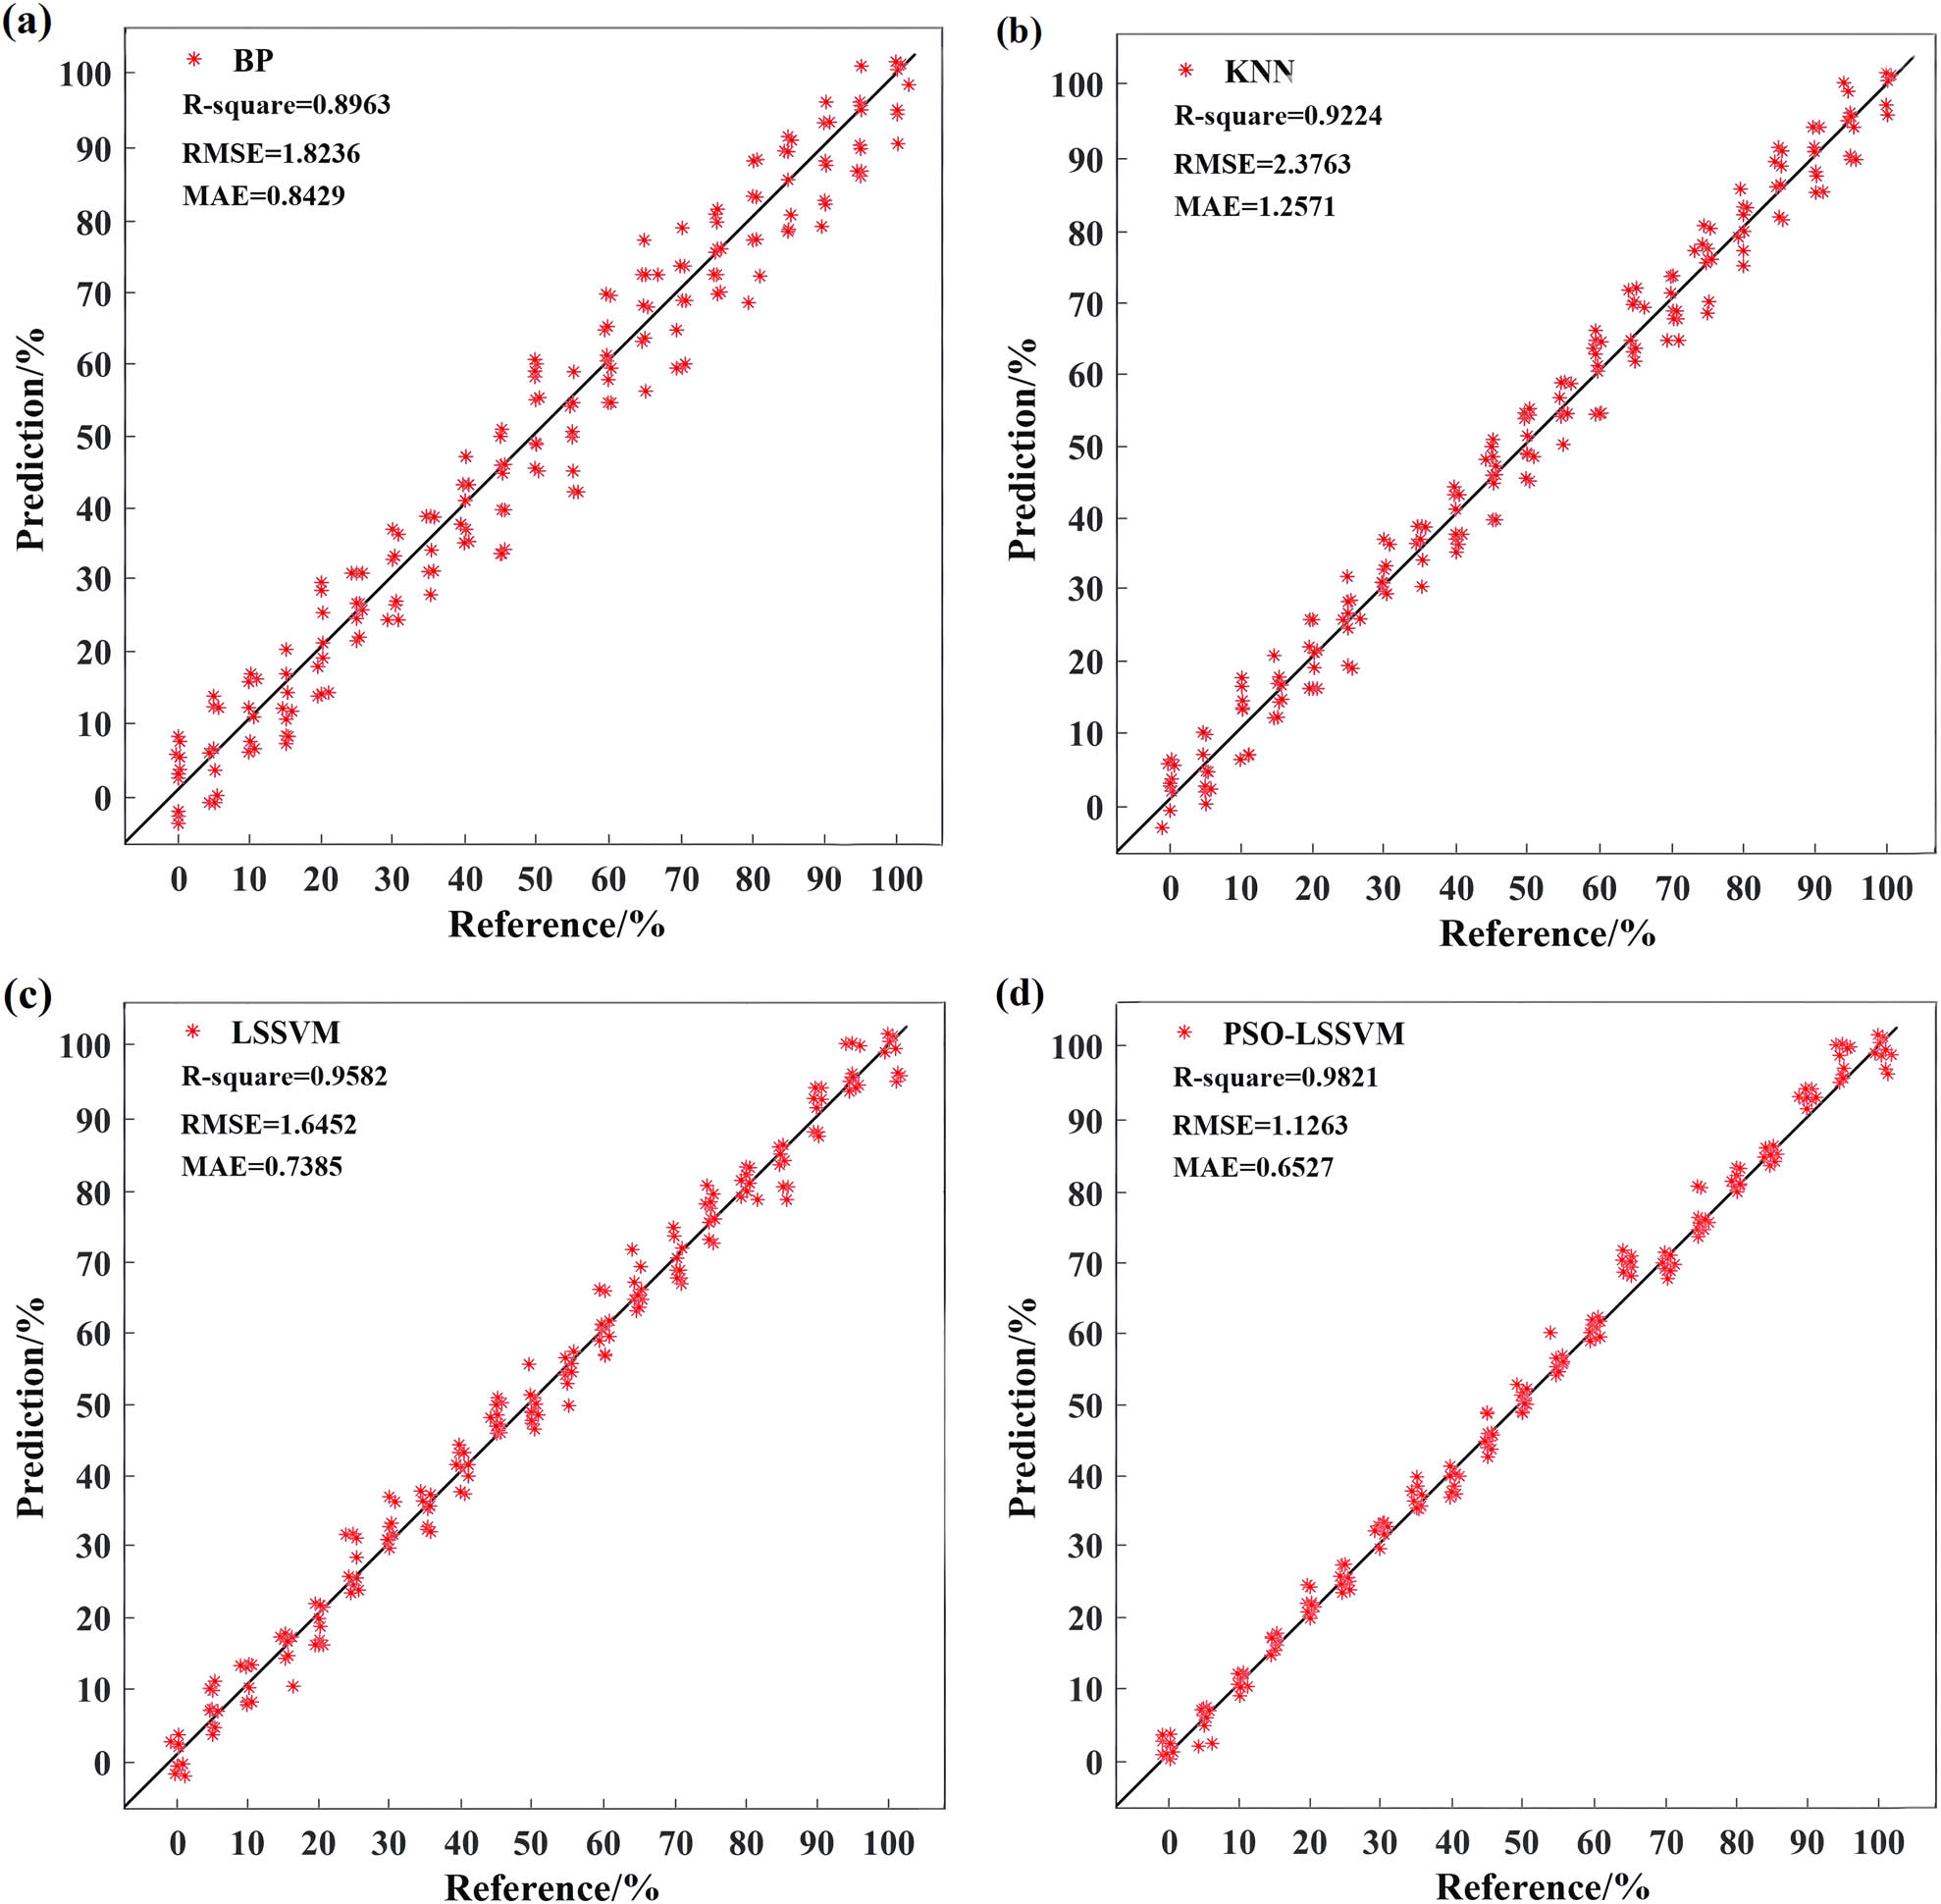
Comparison of model effects of different modeling methods: (a) BP, (b) KNN, (c) LSSVM, and (d) PSO-LSSVM.
4 Conclusions
In this study, a prediction model for cashmere content in a mixed sample set of wool and cashmere was constructed using the combination of VISSA and PSO-LSSVM. The effectiveness of this model was compared with models constructed using BP, KNN, and LSSVM methods. The analysis of model evaluation parameters shows that S–G combined with the second derivative is used to process the original spectral data, and the characteristic bands extracted by VISSA are used to make the constructed PSO-LSSVM model perform better in prediction accuracy. However, its quantitative analysis model based on NIRS is only based on wool and cashmere samples. Therefore, its applicability to the prediction of cashmere content in other types of wool and cashmere mixed samples remains to be further explored. Future research will focus on collecting a wider range of fiber samples, preparing more fine sample ratios, enhancing the practical value of the model in related fields, and establishing a more comprehensive, accurate, and universally applicable quantitative analysis tool for mixed fibers, providing reliable support for quality control in the textile industry and related fields.
-
Funding information: This work is supported by the National Natural Science Foundation of China (62203344), Shaanxi Science and Technology Plan Day (2022GY-053), Key Project of Natural Science Basic Research in Shaanxi Province (2022JZ-35), Key Research Project of Shaanxi Provincial Department of Education Industrial Textiles Collaborative Innovation Center (20JY026), Shaanxi Provincial Department of Education Research Project (23JC031), Xi‘an Science and Technology Project (23DCYJSGG0008-2023), and Yulin City Science and Technology Plan Project (CXY-2020-052) funding.
-
Author contributions: Yule Men: Methodology, Writing, Editing. Jinni Chen: Conceptualization, Review. Yunhong Li, Yaolin Zhu, Xin Chen: Funding acquisition. Gufeng Tian: Software. Gang Zhang: Investigation.
-
Conflict of interest: The authors declare no conflicts of interest.
-
Ethical approval: The conducted research is not related to either human or animals use.
-
Data availability statement: The datasets generated during and/or analysed during the current study are available from the corresponding author on reasonable request.
References
[1] Zhang C, Qin Q, Liu Z, Xu X, Lan M, Xie Y, et al. Identification of the key proteins associated with different hair types in sheep and goats. Front Genet. 2022;13:993192.10.3389/fgene.2022.993192Search in Google Scholar PubMed PubMed Central
[2] Zhou J, Yu L, Ding Q, Wang R. Textile fiber identification using near-infrared spectroscopy and pattern recognition. Autex Res J. 2019;19(2):201–9.10.1515/aut-2018-0055Search in Google Scholar
[3] Yan N, Wang L, Sun R. Research progress of identification technology between wool and cashmere. Wool Text J. 2022;50(12):102–10.Search in Google Scholar
[4] Yang S, Zhao Z, Yan H, Siesler H. Fast detection of cotton content in silk/cotton textiles by handheld near-infrared spectroscopy: a performance comparison of four different instruments. Text Res J. 2022;92(13–14):2239–46.10.1177/00405175221082324Search in Google Scholar
[5] Nielsen V, Nawrocki P, Srensen T. Electronic structure of neodymium(III) and europium(III) resolved in solution using high-resolution optical spectroscopy and population analysis. J Phys Chem A. 2023;127(16):3577–90.10.1021/acs.jpca.3c00233Search in Google Scholar PubMed
[6] Li J, Deng B, Diana M, Jiang H. Quantitative analysis of aflatoxin B1 of peanut by optimized support vector machine models based on near-infrared spectral features. Spectrochim Acta Part A, Mol Biomol Spectrosc. 2023;303:123208.10.1016/j.saa.2023.123208Search in Google Scholar PubMed
[7] Peng D, Xu R, Zhou Q, Yue J, Su M, Zheng S, et al. Discrimination of milk freshness based on synchronous two-dimensional visible/near-infrared correlation spectroscopy coupled with chemometrics. Molecules (Basel, Switz). 2023;28(15):5728.10.3390/molecules28155728Search in Google Scholar PubMed PubMed Central
[8] Almetwally A, Elfowaty M. Optical-related properties and characterization of some textile fibers using near-infrared spectroscopy. AUTEX Res J. 2024;24(1):20230014.10.1515/aut-2023-0014Search in Google Scholar
[9] Zhou J, Wang R, Wu X, Xu B. Fiber-content measurement of wool–cashmere blends using near-infrared spectroscopy. Appl Spectrosc. 2017;71(10):2367–76.Search in Google Scholar
[10] Sun C. Image classification of cashmere and wool fiber based on LC-KSVD. J Phys: Conf Ser. 2021;1948(1):6.10.1088/1742-6596/1948/1/012010Search in Google Scholar
[11] Ma X, Chen Z, Liu J. Wavelength selection method for near-infrared spectroscopy based on max-relevance min-redundancy. Spectrochimica Acta Part A: Molecular and Biomolecular Spectroscopy. 2024;310:123933.10.1016/j.saa.2024.123933Search in Google Scholar PubMed
[12] Zoccola M, Bhavsar P, Anceschi A, Alessia P. Analytical methods for the identification and quantitative determination of wool and fine animal fibers: a review. Fibers. 2023;11(8):67.10.3390/fib11080067Search in Google Scholar
[13] Li M, Zhang X, Jiang Q. Qualitative identification of pesticide residues in pakchoi based on near infrared spectroscopy. In: IOP Conference Series: Materials Science and Engineering. vol. 466, IOP Publishing; 2018. p. 012064.10.1088/1757-899X/466/1/012064Search in Google Scholar
[14] Deng B, Yun Y, Liang Y, Yi L. A novel variable selection approach that iteratively optimizes variable space using weighted binary matrix sampling. Analyst. 2014;139(19):4836–45.10.1039/C4AN00730ASearch in Google Scholar
[15] Nawar, S, Buddenbaum H, Hill J. Estimating the soil clay content and organic matter by means of different calibration methods of vis-NIR diffuse reflectance spectroscopy. Soil Tillage Res. 2016;155:510–22.10.1016/j.still.2015.07.021Search in Google Scholar
[16] Wu G, Yong H. Identification of varieties of cashmere by Vis/NIR spectroscopy technology based on PCA-SVM. 2008 7th World Congress on Intelligent Control and Automation. vol. 18(5), p. 1548–52.10.1109/WCICA.2008.4594459Search in Google Scholar
[17] Anceschi A, Zoccola M, Mossotti R. Identification and quantitative determination of virgin and recycled cashmere: a near-infrared spectroscopy study. ACS Sustain Chem Eng. 2022;10(2):738–45.10.1021/acssuschemeng.1c05289Search in Google Scholar
[18] Quispe M, Trigo J, Serrano-Arriezu L. Classification of South American Camelid and goat fiber samples based on fourier transform infrared spectroscopy and machine learning. J Text Inst. 2024;124(9):1–10.10.1080/00405000.2024.2324209Search in Google Scholar
[19] Qin D, Peng W, Jiang Y. Sample preparation and test of infrared spectrum analysis of new textile materials. J Tianjin Univ Technol. 2010;29(05):19–21+25.Search in Google Scholar
[20] Li G, Deng S. Quantitative analysis of near-infrared spectroscopy using the BEST-1DConvNet model. Processes. 2024;12(2):272.10.3390/pr12020272Search in Google Scholar
[21] Hu X, Lei Y, Tian J, Ma X, Wang J, Huang H, et al. Rapid detection of total and ammonium nitrogen in pit mud by hyperspectral imaging combined with PSO-LSSVM. Infrared Phys Technol. 2024;139:105298.10.1016/j.infrared.2024.105298Search in Google Scholar
[22] Kong B, Cai J, Tuo S, Wen L, Jiang H, He L, et al. Rapid construction of an optimal model for near-infrared spectroscopy (NIRS) by particle swarm optimization (PSO). Anal Lett. 2022;55(11):1685–700.10.1080/00032719.2021.2021534Search in Google Scholar
[23] Tang K, Meng C. Particle swarm optimization algorithm using velocity pausing and adaptive strategy. Symmetry. 2024;16(6):661.10.3390/sym16060661Search in Google Scholar
[24] Zhang J, Mouazen AM. Fractional-order Savitzky–Golay filter for pre-treatment of on-line vis–NIR spectra to predict phosphorus in soil. Infrared Phys Technol. 2023;131:104720.10.1016/j.infrared.2023.104720Search in Google Scholar
[25] Zhang H, Liu Z, Zhang J. Identification of edible gelatin origins by data fusion of NIRS, fluorescence spectroscopy, and LIBS. Food Anal Methods. 2020;14(3):1–12.10.1007/s12161-020-01893-2Search in Google Scholar
[26] Danilo F, García S, Valeria S. Exploiting the successive projections algorithm to improve the quantification of chemical constituents and discrimination of botanical origin of Argentinean bee-pollen. J Food Compos Anal. 2024;126:105925.10.1016/j.jfca.2023.105925Search in Google Scholar
[27] Zhou, J, Wang, R, Wu, X. Fiber-content measurement of wool–cashmere blends using near-infrared spectroscopy. Appl Spectrosc. 2017;71(10):2367–76.10.1177/0003702817713480Search in Google Scholar PubMed
© 2024 the author(s), published by De Gruyter
This work is licensed under the Creative Commons Attribution 4.0 International License.
Articles in the same Issue
- Characterization of viscoelastic properties of yarn materials: Dynamic mechanical analysis in the transversal direction
- Analysis of omni-channel implementations that are preferred by consumers in clothing sector
- Structural modeling and analysis of three-dimensional cross-linked braided preforms
- An experimental study of mechanical properties and comfortability of knitted imitation woven shirt fabrics
- Technology integration to promote circular economy transformation of the garment industry: a systematic literature review
- Research on T-shirt-style design based on Kansei image using back-propagation neural networks
- Research on She nationality clothing recognition based on color feature fusion with PSO-SVM
- Accuracy prediction of wearable flexible smart gloves
- Preparation and performance of stainless steel fiber/Lyocell fiber-blended weft-knitted fabric
- Development of an emotional response model for hospital gown design using structural equation modeling
- Preparation and properties of stainless steel filament/pure cotton woven fabric
- Facemask comfort enhancement with graphene oxide from recovered carbon waste tyres
- Use of enzymatic processes in the tanning of leather materials
- Optical-related properties and characterization of some textile fibers using near-infrared spectroscopy
- Network modeling of aesthetic effect for Chinese Yue Opera costume simulation images
- Predicting consumers’ garment fit satisfactions by using machine learning
- Non-destructive identification of wool and cashmere fibers based on improved LDA using NIR spectroscopy
- Study on the relationship between structure and moisturizing performance of seamless knitted fabrics of protein fibers for autumn and winter
- Antibacterial and yellowing performances of sports underwear fabric with polyamide/silver ion polyurethane filaments
- Numerical and experimental analysis of ballistic performance in hybrid soft armours composed of para-aramid triaxial and biaxial woven fabrics
- Phonetic smart clothing design based on gender awareness education for preschoolers
- Determination of anthropometric measurements and their application in the development of clothing sizing systems for women in the regions of the Republic of Croatia
- Research on optimal design of pleated cheongsam based on Kano–HOQ–Pugh model
- Numerical investigation of weaving machine heald shaft new design using composite material to improve its performance
- Corrigendum to “Use of enzymatic processes in the tanning of leather materials”
- Shaping of thermal protective properties of basalt fabric-based composites by direct surface modification using magnetron sputtering technique
- Numerical modeling of the heat flow component of the composite developed on the basis of basalt fabric
- Weft insertion guideway design based on high-temperature superconducting levitation
- Ultrasonic-assisted alkali hydrolysis of polyethylene terephthalate fabric and its effect on the microstructure and dyeing properties of fibers
- Comparative study on physical properties of bio-based PA56 fibers and wearability of their fabrics
- Investigation of the bias tape roll change time efficiency in garment factories
- Analysis of foot 3D scans of boys from Polish population
- Optimization of garment sewing operation standard minute value prediction using an IPSO-BP neural network
- Influence of repeated switching of current through contacts made of electroconductive fabrics on their resistance
- Numerical calculation of air permeability of warp-knitted jacquard spacer shoe-upper materials based on CFD
- Compact Spinning with Different Fibre Types: An Experimental Investigation on Yarn Properties in the Condensing Zone with 3D-Printed Guiding Device
- Modeling of virtual clothing and its contact with the human body
- Advances in personalized modelling and virtual display of ethnic clothing for intelligent customization
- Investigation of weave influence on flame retardancy of jute fabrics
- Balloonless spinning spindle head shape optimisation
- Research on 3D simulation design and dynamic virtual display of clothing flexible body
- Turkish textile and clothing SMEs: Importance of organizational learning, digitalization, and internationalization
- Corrigendum To: “Washing characterization of compression socks”
- Study on the promotion multiple of blood flow velocity on human epidermal microcirculation of volcanic rock polymer fiber seamless knitted fabric
- Bending properties and numerical analysis of nonorthogonal woven composites
- Bringing the queen mother of the west to life: Digital reconstruction and analysis of Taoist Celestial Beings Worshiping mural’s apparel
- Modeling process for full forming sports underwear
- Retraction of: Ionic crosslinking of cotton
- An observational study of female body shape characteristics in multiracial Malaysia
- Study on theoretical model and actual deformation of weft-knitted transfer loop based on particle constraint
- Design and 3D simulation of weft-knitted jacquard plush fabrics
- An overview of technological challenges in implementing the digital product passport in the textile and clothing industry
- Understanding and addressing the water footprint in the textile sector: A review
- Determinants of location changes in the clothing industry in Poland
- Influence of cam profile errors in a modulator on the dynamic response of the heald frame
- Quantitative analysis of wool and cashmere fiber mixtures using NIR spectroscopy
- 3D simulation of double-needle bar warp-knitted clustered pile fabrics on DFS
- Finite element analysis of heat transfer behavior in glass fiber/metal composite materials under constant heat load
- Price estimation and visual evaluation of actual white fabrics used for dress shirts and their photographic images
- Effect of gluing garment materials with adhesive inserts on their multidirectional drape and bending rigidity
- Optimization analysis of carrier-track collision in braiding process
- Numerical and experimental analysis of the ballistic performance of soft bulletproof vests for women
- The antimicrobial potential of plant-based natural dyes for textile dyeing: A systematic review using prisma
- Influence of sewing parameters on the skin–fabric friction
- Validation by experimental study the relationship between fabric tensile strength and weave structures
- Optimization of fabric’s tensile strength and bagging deformation using surface response and finite element in stenter machine
- Analysis of lean manufacturing waste in the process flow of ready-to-wear garment production in Nigeria
- An optimization study on the sol–gel process to obtain multifunctional denim fabrics
- Drape test of fully formed knitted flared skirts based on 3D-printed human body posture
- Supplier selection models using fuzzy hybrid methods in the clothing textile industry