Supplier selection models using fuzzy hybrid methods in the clothing textile industry
-
Mourad Lahdhiri
 ,
Mohamed Jmali
,
Mohamed Jmali

Abstract
Application of models for supplier assessment and selection in the clothing industry remains relatively underexplored. To fill this gap, this research study introduces the following fuzzy hybrid models for evaluating and selecting suppliers for clothing manufacturing firms: fuzzy set theory, Analytic Hierarchy Process method–fuzzy-Technique for Order of Preference by Similarity to Ideal Solution (AHP–fuzzy-TOPSIS), AHP–fuzzy-Weighted Sum Model (WSM), and AHP–fuzzy-Weighted Product Mean (WPM). Criteria weights were established utilizing these models, which were applied to identify the optimal supplier. A practical study was conducted within a clothing firm to evaluate the effectiveness of these fuzzy hybrid models. The main results reveal that the AHP–fuzzy-TOPSIS model outperforms the AHP–fuzzy-WSM and AHP–fuzzy-WPM models in selecting the optimal alternative. Indeed, this approach has the potential to be adapted to different industrial sectors, considering the specific criteria and conditions that govern their supplying processes.
1 Introduction
Selecting supplier processes is an essential issue in the supply chain, affecting a company’s competitiveness and performance. In the literature, a multitude of studies have addressed this topic across numerous fields, with particular emphasis on the clothing industry [1,2,3]. One of them focused on utilizing the Analytic Hierarchy Process (AHP) to select suppliers in the apparel industry. In this article, flexibility, cost, and delivery were used as criteria. As a result, the used model would be much easier and more efficient for buyers [4]. Amindoust and Saghafinia applied the fuzzy inference method in the textile industry. The study involved three decision-makers in evaluating five potential suppliers. Consequently, the utilized method was able to rank suppliers according to their performance assessments and assign critical criteria in the ranking process [5]. Burney and Ali used the AHP-fuzzy method to select Pakistan’s textile industry suppliers. The selection criteria were identified by the purchasing manager of a textile manufacturing enterprise. As criteria, they have used quality, price, services, cost, delivery time, and payment terms [6]. Some researchers used the DEcision-MAking Trial and Evaluation Laboratory (DEMATEL) approach and the Analytical Network Process (ANP) method as alternative evaluation methods in the textile field. The DEMATEL approach was employed to evaluate the interrelationships between criteria, and the ANP technique was employed to calculate the weighting of criteria [7,8]. Some researchers combined the AHP method with different methods such as electro-sorting, preventive objective programming (PGP), and the method of order of preference in the textile field. Weighting of criteria was established by using the AHP technique, and various techniques were employed to classify alternatives [9,10,11,12,13]. Lahdhiri et al. applied both fuzzy logic and AHP methods to determine the optimal subcontractor in the clothing industry. Their research concluded that the AHP approach outperforms the fuzzy logic technique in subcontractor selection [14]. Moreover, numerous scientific studies have addressed this problem in the manufacturing field. We highlight a selection of them to present the extensive range of applications in this part. Kull and Talluri used the AHP method and the goal programming (GP) model to choose the optimal supplier in the automotive field. The AHP approach was employed to establish criteria assessment, and suppliers were selected using the GP model [11]. Some researchers applied the ANP approach in Taiwanese TV and electronic companies to choose the best supplier [15,16]. ArabsheYbani et al. used the fuzzy-Multi-Objective Optimization by Ratio Analysis (MOORA) method to identify the optimal supplier within the household appliance sector. In their study, suppliers’ risks were assessed using failure mode and effect analysis, and the fuzzy-MOORA method was used to choose the optimal supplier. In conclusion, the proposed method chose the optimal supplier and can be implemented across various industries, including the manufacturing, electrical, chemical, and automotive industries [17]. Some researchers used the fuzzy-ANP approach in the electronics sector in India to choose the optimal supplier [18]. Masoud et al. applied the Balanced ScoreCard (BSC)–fuzzy-AHP technique to select optimal alternatives within the automobile sector. Their study proposed the BSC method for suppliers’ performance measurement, and the fuzzy-AHP approach was employed for supplier assessment. Consequently, the method proposed in this research can be integrated with other Multiple Criteria Decision-Making (MCDM) tools [19]. Following an extensive review of the literature, numerous applications of MCDM methods for assessment and selection of suppliers have been identified; however, research studies in the garment and textile field remain relatively scarce. Hence, in this article, the AHP–fuzzy-Technique for Order of Preference by Similarity to Ideal Solution (TOPSIS), AHP–fuzzy-Weighted Sum Model (WSM), and AHP–fuzzy-Weighted Product Method (WPM) models were established to classify and select suitable suppliers within a clothing supply chain. This study endeavored to evaluate selected suppliers by employing the AHP–fuzzy-TOPSIS, AHP–fuzzy-WSM, and AHP–fuzzy-WPM models, considering several criteria: price, quality, compliance of quantity, and compliance of delay. Moreover, this study aimed to utilize the AHP technique to compute the weightings of the criteria. Further, supplier rankings were established by employing hybrid MCDM methods (AHP–fuzzy-TOPSIS, AHP–fuzzy-WSM, and AHP–fuzzy-WPM).
Indeed, the use of hybrid MCDM models for supplier assessment and selection in the clothing industry was justified based on several factors:
Complexity of decision-making.
Handling subjectivity and uncertainty.
Robustness and flexibility.
Improved decision quality.
2 Modeling methods
2.1 Research methodology
The objective of our research was to introduce hybrid MCDM models, integrating the AHP method, fuzzy set theory, TOPSIS method, WSM, and WPM. These techniques were employed to identify the most suitable supplier for the clothing industry, aiming to address the existing gap in the literature. This research comprised several stages, as summarized in Figure 1. In the first step, the proposed models were presented. In the second step, a case study of a company specializing in denim apparel was conducted. In this case study, the AHP technique was employed to establish the criteria weightings and the decision matrix. Hybrid MCDM models, including AHP–fuzzy-WSM, AHP–fuzzy-TOPSIS, and AHP–fuzzy-WPM, were applied to choose the optimal supplier. In the concluding phase, the hybrid methods underwent evaluation and comparison. The methodology applied in this work is depicted in Figure 1.
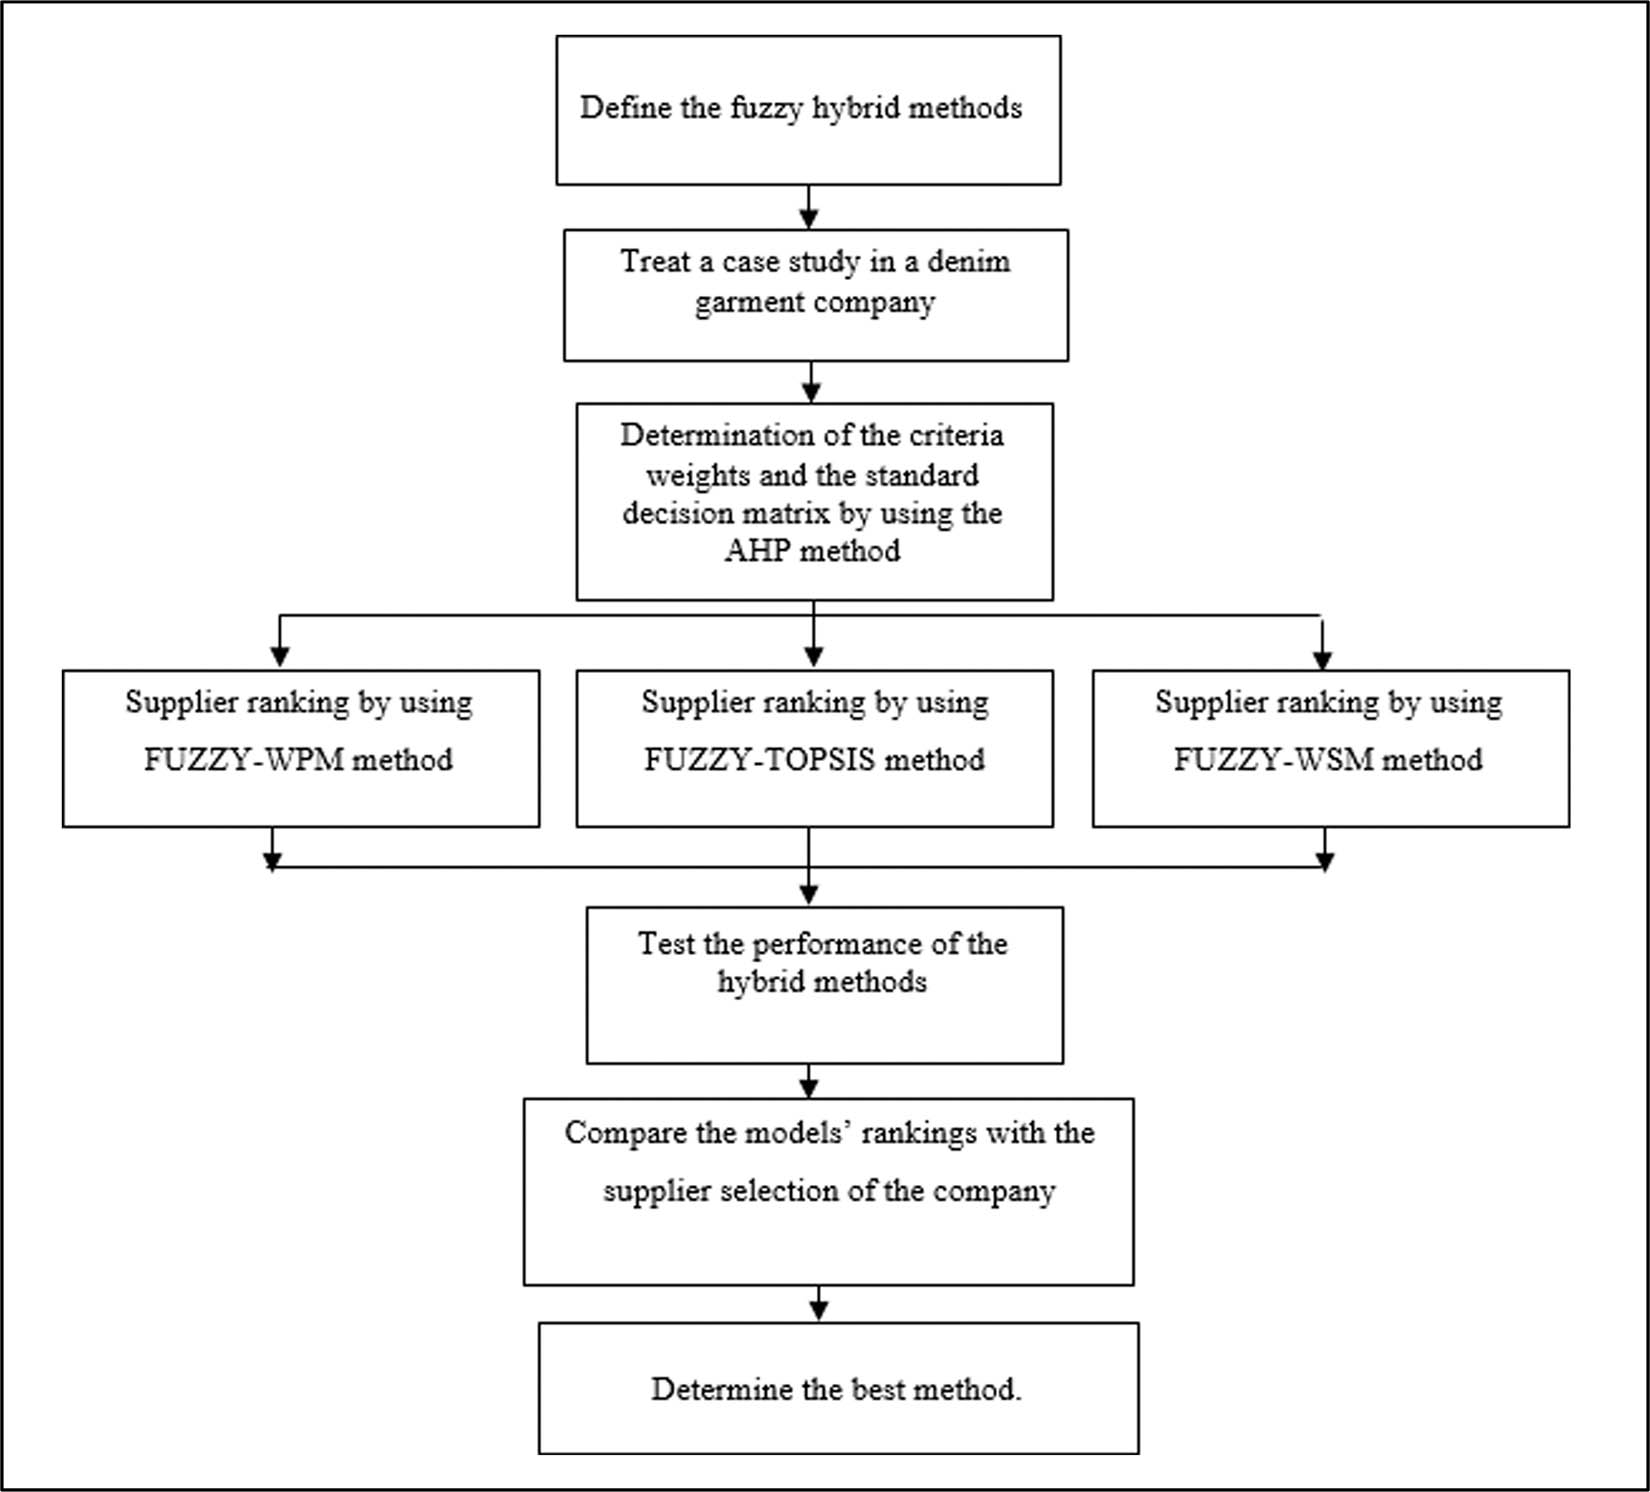
Our study’s methodology.
The approach used in this study is introduced in the following sections.
2.2 Fuzzy set
Definition 1
(Fuzzy set)
A fuzzy set “Ă” of a universal set X can be described by its membership function μÃ(x) as Ă = {(x, μÃ((x))/x ∈ X}, where x ∈ X refers to the elements belonging to the universal set and μÃ(x): X → [0,1]. In the pair (x, μĂ(x)), the first component x ∈ A, where A is the classical set, and the next element μÃ(x) ∈ [0,1] is called the membership function [20].
Definition 2
(Trapezoidal fuzzy numbers)
The trapezoidal fuzzy number A is specified by quadruples Ă = (a, b, c, d) such that a ≤ b ≤ c ≤ d and is defined by the membership function as expressed by equation (1) [21]:
Figure 2 presents the membership functions corresponding to the trapezoidal fuzzy numbers.
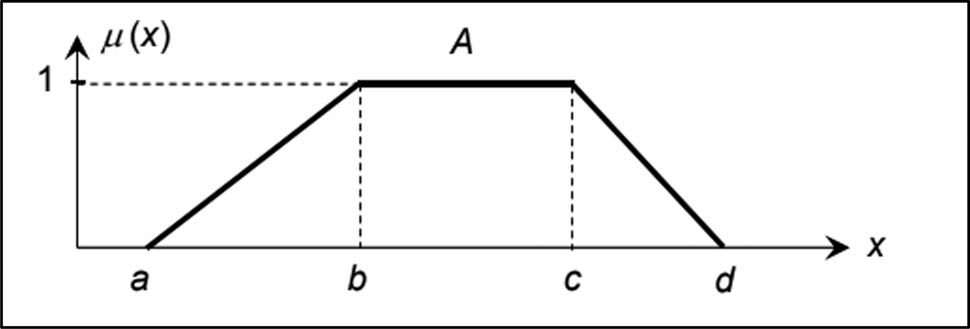
Membership functions of the trapezoidal fuzzy numbers.
Definition 3
(Operations on Trapezoidal fuzzy numbers)
Let X̃ = (a 1, b 1, c 1, d 1) and Ỹ = (a 2, b 2, c 2, d 2) denote two trapezoidal fuzzy numbers non-negative and α ∈ ℝ +. The arithmetic formulas are presented as follows:
2.3 AHP–fuzzy-TOPSIS
The AHP model is one of the widely used MCDM models, and it was created by Saaty. It offers a structured approach to solving complex decisions [22]. The AHP method begins with the identification of the problem at hand, along with defining the criteria and available alternatives. Subsequently, pairwise comparisons are conducted between the criteria and alternatives to evaluate their respective importance. Once these comparisons are made, the process moves towards determining the alternatives’ rank based on the established criteria. Hwang et al. introduced the fuzzy-TOPSIS model as an MCDM approach [23]. It was based on negative and positive ideal solutions. In the integrated AHP–fuzzy-TOPSIS method, AHP was employed to calculate the weightings of the criteria, while the fuzzy-TOPSIS model was employed to classify the alternatives. The following steps are involved in utilizing the AHP–fuzzy-TOPSIS method.
AHP–fuzzy-TOPSIS steps:
Step 1: Establish linguistic variables and terms
Linguistic variables are variables within a system that use words from natural language instead of numerical values to represent inputs or outputs.
Step 2: Construct the membership functions
Membership functions are employed to quantify linguistic terms within a system. Various types exist, including triangular, trapezoidal, piecewise linear, Gaussian, and singleton functions.
Step 3: Assignment rating to the alternatives to create a fuzzy decision matrix
We suggest establishing a decision group consisting of F members. Each member of this decision-making group will utilize linguistic terms to assess every alternative for each criterion. The decision-maker matrix is presented in Table 1.
Decision-maker matrix
| Criteria | ||||||
|---|---|---|---|---|---|---|
| Alternatives | C 1 | C 2 | C 3 | … | C n | |
| A 1 | Ts11 | Ts12 | Ts13 | … | Ts1n | |
| A 2 | Ts21 | Ts22 | Ts23 | … | Ts2n | |
| A 3 | Ts31 | Ts32 | Ts33 | … | Ts3n | |
| .. | … | … | … | … | … | |
| A n | Ts n1 | Ts n2 | Ts n3 | … | Ts nn | |
With Ts ij equal to fuzzy sets for each linguistic variable, it could be low, medium, or high.
Step 4: Transform the linguistic term into a fuzzy number
Every linguistic term is transformed into a fuzzy number x̃ ij = (a ij , b ij , c ij , d ij ).
Step 5: Aggregate the alternative fuzzy decision matrix
The aggregated fuzzy rating ỹ ij = (a ij , b ij , c ij , d ij ) of alternative A i under criterion C j is defined as follows:
Step 6: Normalize the fuzzy decision matrix
The fuzzy decision matrix is normalized using the following equations:
with i from 1 to m and j from 1 to n.
For benefit criteria:
with
For non-benefit criteria:
with
Step 7: Aggregate the alternative fuzzy decision matrix
An n × n pairwise comparison matrix is created to compare related criteria, as presented in Table 2. Criteria weights are determined by conducting pairwise comparisons using Saaty’s scale [24]. Table 3 illustrates Saaty’s scale.
Pairwise comparison matrix for criteria
| Criteria | C 1 | C 2 | C 3 | … | C n |
|---|---|---|---|---|---|
| C 1 | 1 | W 1/W 2 | W 1/W 3 | … | W 1/W n |
| C 2 | W 2/W 1 | 1 | W 2/W 3 | …. | W 2/W n |
| C 3 | W 3/W 1 | W 3/W 2 | 1 | …. | W 3/W n |
| .. | … | …. | … | 1 | … |
| C n | W n /W 1 | W n /W 2 | W n /W 3 | W n /W.. | 1 |
Saaty’s 1–9 scale
| Numerical scale | Verbal judgment of preference |
|---|---|
| 1 | Equal significance |
| 3 | Slight preference of one over another |
| 5 | Critical or significant importance |
| 7 | Clearly demonstrated importance |
| 9 | Utmost importance |
| 2, 4, 6, and 8 | Values that are intermediate between the two adjacent judgments |
The matrix is transformed into a normalized form, which is shown in Table 4.
Normalization matrix
| Criteria | C 1 | C 2 | C 3 | … | C n |
|---|---|---|---|---|---|
| C 1 | X 11 | X 12 | X 13 | … | X 1n |
| C 2 | X 11 | X 22 | X 23 | … | X 2n |
| C 3 | X 31 | X 32 | X 33 | … | X 3n |
| .. | … | … | … | … | … |
| C n | X n1 | X n2 | X n3 | … | X nn |
To determine a vector of weights, the average of the lines “W” of the normalized pairwise matrix is computed.
Step 8: Compute the weighting of the normalized matrix
Matrix multiplication between the weighted criteria matrix and the normalized aggregated fuzzy decision matrix for alternatives is conducted, as expressed in equation (13):
Step 9: Calculate the fuzzy positive and negative ideal solution (FPIS and FNIS) as expressed in equations (14) and (15).
with i from 1 to m and j from 1 to n;
with i from 1 to m and j from 1 to n.
Here, “X” corresponds to the set of values for benefit criteria and “Y” defines the set of values for non-benefit criteria.
Step 10: Compute the weighted normalized fuzzy decision matrix
Equations (16) and (19) present the determination of the distance for each alternative from
Step 11: Determine the proximity coefficient for each alternative
This coefficient is utilized to establish the sequence of rankings for all alternatives after calculating the
The ranking of all alternatives can be established by using this coefficient.
2.4 AHP–fuzzy-WPM
Fuzzy-WPM is a technique for MCDM [25]. We must select the best alternative between several options based on multiple criteria. An AHP–fuzzy-WPM method is an integrated approach that allows for calculating the criteria weights based on the AHP approach in the first step and then using the fuzzy-WPM approach to rank alternatives.
AHP–fuzzy-WPM steps:
Steps 1 through 7 of the AHP–fuzzy-WPM method share the same steps with those of the AHP–fuzzy-TOPSIS method.
Step 8: Determine the weighted normalized fuzzy decision matrix.
The weighted normalized fuzzy numbers of the alternatives are calculated using Equation (21):
with i from 1 to m and j from 1 to n.
Here, f̃ i represents the overall performance value of each alternative A i , while r̃ ij denotes a fuzzy trapezoidal number. These values are utilized to establish the final fuzzy rating matrix:
Step 9: Calculate the crisp value.
The crisp value is calculated according to equation (22):
where d(f∼ i ) denotes the defuzzified or crisp value of the overall fuzzy score of alternative A i .
2.5 AHP–fuzzy-WSM
Fuzzy-WSM is a technique for MCDM [25,26]. We must choose the best alternative among several options based on multiple criteria. The AHP–fuzzy-WSM method combines the AHP and fuzzy-WSM methods. The AHP method was employed to determine the weightings of the criteria, while the fuzzy-WSM method was employed to classify the alternatives.
AHP–fuzzy-WSM steps:
Steps 1 through 7 of the AHP–fuzzy-WSM method share the same steps as those of the AHP–fuzzy-TOPSIS method.
Step 8: Calculate the weighted normalized fuzzy decision matrix
The weighted normalized fuzzy numbers of the alternatives are calculated using equation (23):
with i from 1 to m and j from 1 to n,
where f̃ i represents the overall performance value of each alternative A i , while r̃ ij denotes a fuzzy trapezoidal number. These values are utilized to establish the final fuzzy rating matrix:
Step 9: Compute the crisp value, identical to AHP–fuzzy-WPM.
3 Practical application in a denim clothing manufacturing firm
3.1 Data set
This research was conducted in a denim manufacturing firm with a workforce of 450 employees. The company achieves a yearly production output of 800,000 products and works both as a principal for numerous subcontractors and as a producer of several products such as skirts, pants, and jackets. These products are manufactured for various international labels, requiring high-quality levels and fast delivery. This company procures numerous and various materials, including textile accessories, fabric, and other necessary items. When it comes to fabric purchases, the ordering customers specify their preferred suppliers to the company. Our focus was primarily on purchasing textile accessories, which constitute a crucial aspect due to their diversity and cost implications. Furthermore, while this company maintains a detailed database of these items, it lacks systematic supplier selection and evaluation methods. Historically, purchasing activities and operations have depended solely upon the expertise and experience of the procurement manager. In this practical application, to implement the proposed methods, we organized and compiled successful procurement actions, which formed the database for the current supplier selection analysis. Consequently, the sorted and filtered database comprised 20 distinct textile accessories, 46 suppliers, and 20 purchase orders.
3.2 Assessment and selection of suppliers using the proposed models
Within this section, the hybrid proposed models were used to identify the most suitable suppliers for procuring textile supplies and accessories from three suppliers (S1, S2, and S3). The overarching objective in this scenario revolves around procuring buttons with reference 002. In this example, two decision-makers were used. As criteria, price, quality, compliance of quantity, and compliance of delay were used.
AHP–fuzzy-TOPSIS model
Step 1: Establish linguistic variables and terms
In our case, criteria represent variables:
Price per piece
Quality
Compliance of quantity
Compliance of delay
Fuzzy set for each variable:
Three classes are chosen for each criterion:
Low
Medium
High
Step 2: Construct membership functions
The categories for each variable were established with the contribution of a purchasing expert, which are presented in Table 5 and illustrated in Figure 3.
Categorization of variables
| Categorization | |||
|---|---|---|---|
| Low | Medium | High | |
| Price/piece (euro) | 0–0.8 | 0.8–4 | 4–7 |
| Quality | 0–1.2 | 1.2–4 | 4–6 |
| Compliance of quantity (%) | 0–0.3 | 0.3–0.8 | 0.8–1 |
| Compliance of delay (%) | 0–0.3 | 0.3–0.8 | 0.8–1 |

Membership function for each criterion: price (a), quality (b), conformity of quantity (c) and conformity of delay (d).
Step 3: Assignment rating to the alternatives to create a fuzzy decision matrix, as presented in Table 6.
Decision makers’ evaluation
| Price | Quality | Compliance of quantity | Compliance of delay | |
|---|---|---|---|---|
| Decision maker 1 | S1 | L | M | H |
| S2 | L | M | H | |
| S3 | L | L | H | |
| Decision maker 2 | S1 | M | H | M |
| S2 | H | M | M | |
| S3 | L | L | M |
We propose establishing a decision group comprising two members. This group of decision-makers will employ linguistic terms to assess each alternative for every criterion. The decisions of each decision-maker are presented in Table 6.
Step 4: Transform the linguistic term into a fuzzy number, as presented in Table 7.
Fuzzy number of decision makers
| Suppliers | Price | Quality | Compliance of quantity | Compliance of delay | |||||||||||||
|---|---|---|---|---|---|---|---|---|---|---|---|---|---|---|---|---|---|
| Decision maker 1 | S1 | 0 | 0 | 0.6 | 1 | 1 | 2 | 3 | 5 | 0.7 | 0.9 | 0.9 | 0.9 | 0.7 | 0.9 | 0.9 | 0.9 |
| S2 | 0 | 0 | 0.6 | 1 | 1 | 2 | 3 | 5 | 0.7 | 0.9 | 0.9 | 0.9 | 0.7 | 0.9 | 0.9 | 0.9 | |
| S3 | 0 | 0 | 0.6 | 1 | 0 | 0 | 1 | 2 | 0.7 | 0.9 | 0.9 | 0.9 | 0.7 | 0.9 | 0.9 | 0.9 | |
| Decision maker 2 | S1 | 0.6 | 1 | 3 | 5 | 3 | 5 | 5 | 5 | 0.2 | 0.4 | 0.7 | 0.9 | 0.2 | 0.4 | 0.7 | 0.9 |
| S2 | 3 | 5 | 5 | 5 | 1 | 2 | 3 | 5 | 0.2 | 0.4 | 0.7 | 0.9 | 0 | 0 | 0.2 | 0.4 | |
| S3 | 0 | 0 | 0.6 | 1 | 0 | 0 | 1 | 2 | 0.2 | 0.4 | 0.7 | 0.9 | 0.7 | 0.9 | 0.9 | 0.9 | |
Step 5: Aggregate the alternative fuzzy decision matrix
All fuzzy decision matrices are combined into one matrix, as presented in Table 8.
Combined fuzzy decision matrix
| Suppliers | Price | Quality | Compliance of quantity | Compliance of delay | ||||||||||||
|---|---|---|---|---|---|---|---|---|---|---|---|---|---|---|---|---|
| S1 | 0 | 0.5 | 1.8 | 5 | 1 | 3.5 | 4 | 5 | 0.2 | 0.7 | 0.8 | 0.9 | 0.2 | 0.7 | 0.8 | 0.9 |
| S2 | 0 | 2.5 | 2.8 | 5 | 1 | 2 | 3 | 5 | 0.2 | 0.7 | 0.8 | 0.9 | 0 | 0.5 | 0.6 | 0.9 |
| S3 | 0 | 0 | 0.6 | 1 | 0 | 0 | 1 | 2 | 0.2 | 0.7 | 0.8 | 0.9 | 0.7 | 0.9 | 0.9 | 0.9 |
Step 6: Normalize the fuzzy decision matrix, as mentioned in Table 9.
Normalized fuzzy decision matrix
| Suppliers | Price | Quality | Compliance of quantity | Compliance of delay | ||||||||||||
|---|---|---|---|---|---|---|---|---|---|---|---|---|---|---|---|---|
| S1 | 0 | 0 | 0 | 0 | 0.2 | 0.7 | 0.8 | 1 | 0.2 | 0.7 | 0.9 | 1 | 0.2 | 0.7 | 0.9 | 1 |
| S2 | 0 | 0.4 | 0 | 0 | 0.2 | 0.4 | 0.6 | 1 | 0.2 | 0.7 | 0.9 | 1 | 0 | 0.5 | 0.6 | 1 |
| S3 | 0 | 1.7 | 0 | 0 | 0 | 0 | 0.2 | 0.4 | 0.2 | 0.7 | 0.9 | 1 | 0.8 | 1 | 1 | 1 |
Price was considered as a non-benefit criterion, and quality, compliance of quantity, and compliance of delay were considered as benefit criteria.
Step 7: Determine each criterion weight, as presented in Table 10.
Matrix normalization
| Criteria | Price/piece | Quality | Compliance of quantity | Compliance of delay | Average vector: W |
|---|---|---|---|---|---|
| Price/piece | 0.06 | 0.05 | 0.03 | 0.09 | 0.07 |
| Quality | 0.19 | 0.16 | 0.07 | 0.20 | 0.15 |
| Compliance of quantity | 0.31 | 0.32 | 0.15 | 0.12 | 0.22 |
| Compliance of delay | 0.44 | 0.47 | 0.75 | 0.60 | 0.56 |
Step 8: Compute the weighting of the normalized matrix, as presented in Table 11.
Weighted normalized fuzzy decision matrix
| Suppliers | Price | Quality | Compliance of quantity | Compliance of delay | ||||||||||||
|---|---|---|---|---|---|---|---|---|---|---|---|---|---|---|---|---|
| S1 | 0 | 0 | 0 | 0 | 0.03 | 0.11 | 0.12 | 0.15 | 0.05 | 0.16 | 0.20 | 0.22 | 0.1 | 0.4 | 0.5 | 0.6 |
| S2 | 0 | 0.02 | 0 | 0 | 0.03 | 0.06 | 0.09 | 0.15 | 0.05 | 0.16 | 0.20 | 0.22 | 0 | 0.3 | 0.3 | 0.6 |
| S3 | 0 | 0.10 | 0 | 0 | 0 | 0 | 0.03 | 0.06 | 0.05 | 0.16 | 0.20 | 0.22 | 0.4 | 0.6 | 0.6 | 0.6 |
Step 9: Compute the fuzzy positive ideal solution (FPIS) and the fuzzy negative ideal solution (FNIS), as presented in Table 12.
FPIS and FNIS
| Suppliers | Price | Quality | Compliance of quantity | Compliance of delay | ||||||||||||
|---|---|---|---|---|---|---|---|---|---|---|---|---|---|---|---|---|
| S1 | 0 | 0 | 0 | 0 | 0.03 | 0.11 | 0.12 | 0.15 | 0.05 | 0.16 | 0.20 | 0.22 | 0.1 | 0.4 | 0.5 | 0.6 |
| S2 | 0 | 0.02 | 0 | 0 | 0.03 | 0.06 | 0.09 | 0.15 | 0.05 | 0.16 | 0.20 | 0.22 | 0 | 0.3 | 0.3 | 0.6 |
| S3 | 0 | 0.10 | 0 | 0 | 0 | 0 | 0.03 | 0.06 | 0.05 | 0.16 | 0.20 | 0.22 | 0.4 | 0.6 | 0.6 | 0.6 |
| A* | 0 | 0 | 0 | 0 | 0.03 | 0.11 | 0.12 | 0.15 | 0.05 | 0.16 | 0.20 | 0.22 | 0.44 | 0.56 | 0.56 | 0.56 |
| A− | 0 | 0.1 | 0 | 0 | 0.00 | 0.00 | 0.03 | 0.06 | 0.05 | 0.16 | 0.20 | 0.22 | 0.00 | 0.28 | 0.34 | 0.56 |
Steps 10 and 11: Determine the distance from each alternative to the FPIS/NIS and calculate the closeness coefficient of each alternative, as presented in Table 13.
Closeness coefficient for each alternative
| Suppliers | d i * | xxx | Cci | Rank |
|---|---|---|---|---|
| S1 | 0.177 | 0.251 | 0.59 | 1 |
| S2 | 0.486 | 0.103 | 0.17 | 3 |
| S3 | 0.917 | 0.281 | 0.23 | 2 |
According to Table 13, supplier S1 is the best choice.
AHP–fuzzy-WPM model
The results obtained from steps 1 to 7 in the AHP–fuzzy-WPM method align closely with those obtained in the AHP–fuzzy-TOPSIS approach, as presented in the description of the AHP–fuzzy-WPM model.
Step 8: Compute the weighted normalized fuzzy decision matrix, as presented in Table 14.
Weighted normalized fuzzy decision matrix
| Suppliers | Price | Quality | Compliance of quantity | Compliance of delay | f̃ i | |||||||||||||||
|---|---|---|---|---|---|---|---|---|---|---|---|---|---|---|---|---|---|---|---|---|
| S1 | 0.00 | 0 | 0 | 0 | 0.79 | 0.95 | 0.97 | 1 | 0.72 | 0.93 | 0.97 | 1.00 | 0.43 | 0.83 | 0.94 | 1.00 | 0 | 0 | 0 | 0 |
| S2 | 0.00 | 0.94 | 0 | 0 | 0.79 | 0.87 | 0.93 | 1 | 0.72 | 0.93 | 0.97 | 1.00 | 0.00 | 0.68 | 0.76 | 1.00 | 0 | 1 | 0 | 0 |
| S3 | 0.00 | 1.03 | 0 | 0 | 0 | 0 | 0.79 | 0.87 | 0.72 | 0.93 | 0.97 | 1.00 | 0.87 | 1.00 | 1.00 | 1.00 | 0 | 0 | 0 | 0 |
Step 9: Compute a crisp value, as presented in Table 15.
Crisp value
| d(f̃ i ) | Rank | |
|---|---|---|
| S1 | 0 | 2 |
| S2 | 0.1 | 1 |
| S3 | 0 | 3 |
As observed from Table 15, supplier S2 is the best choice.
AHP–fuzzy-WSM model
The results from steps 1 to 7 in the AHP–fuzzy-WSM method align closely with those obtained in the AHP–fuzzy-TOPSIS approach, as presented in the description of the AHP–fuzzy-WSM model.
Step 8: Compute the weighted normalized fuzzy decision matrix, as presented in Table 16.
Weighted normalized fuzzy decision matrix
| Suppliers | Price | Quality | Compliance of quantity | Compliance of delay | F | |||||||||||||||
|---|---|---|---|---|---|---|---|---|---|---|---|---|---|---|---|---|---|---|---|---|
| S1 | 0 | 0.00 | 0 | 0 | 0.03 | 0.11 | 0.12 | 0.15 | 0.05 | 0.16 | 0.20 | 0.22 | 0.12 | 0.40 | 0.50 | 0.56 | 0.20 | 0.67 | 0.81 | 0.93 |
| S2 | 0 | 0.02 | 0 | 0 | 0.03 | 0.06 | 0.09 | 0.15 | 0.05 | 0.16 | 0.20 | 0.22 | 0.00 | 0.28 | 0.34 | 0.56 | 0.08 | 0.52 | 0.63 | 0.93 |
| S3 | 0 | 0.10 | 0 | 0 | 0.00 | 0.00 | 0.03 | 0.06 | 0.05 | 0.16 | 0.20 | 0.22 | 0.44 | 0.56 | 0.56 | 0.56 | 0.48 | 0.82 | 0.79 | 0.84 |
Step 9: Compute a crisp value, as presented in Table 17.
Crisp value
| d(f̃ i ) | Rank | |
|---|---|---|
| S1 | 0.65 | 2 |
| S2 | 0.54 | 3 |
| S3 | 0.73 | 1 |
Table 17 shows that supplier S3 is the best choice.
4 Results and discussion
4.1 Assessment tests
To assess the effectiveness of the AHP–fuzzy-TOPSIS, AHP–fuzzy-WSM, and AHP–fuzzy-WPM methods in the assessment and selection of optimal suppliers, a set of data comprising 20 orders was utilized. Subsequently, this dataset was validated in a real case. It is important to note that the purchase orders assigned to specific suppliers were chosen from those who had previously been successful in the supplier evaluation, selection, and procurement processes. These purchase requisitions were chosen based on criteria, including high quality, reasonable pricing, time delivery, and meeting the specified quantity. In this study, two decision-makers were used, and these two decision-makers have professional careers in textile purchasing. As criteria, we used price, quality, compliance of quantity, and compliance of delay. Table 18 illustrates the enterprise’s supplier rank in the supplier list identified by the AHP–fuzzy-TOPSIS, AHP–fuzzy-WSM, and AHP–fuzzy-WPM methods.
Evaluation test
| No. purchase order | Article | Selected supplier by the company | Supplier chosen by AHP–fuzzy-TOPSIS | Rank of the supplier | Supplier chosen by AHP–fuzzy-WSM | Rank of the supplier | Supplier chosen by AHP–fuzzy-WPM | Rank of the supplier |
|---|---|---|---|---|---|---|---|---|
| 1 | Ar1 | FX | FX | 1 | FZ | 2 | FY | 2 |
| 2 | Ar2 | AY | AY | 1 | AY | 1 | AY | 1 |
| 3 | Ar3 | FR | FR | 1 | FA | 2 | FA | 2 |
| 4 | Ar4 | XA | XA | 1 | XR | 2 | XS | 2 |
| 5 | Ar5 | ZD | ZA | 3 | ZD | 1 | ZC | 2 |
| 6 | Ar6 | Y1 | Y1 | 1 | Y2 | 2 | Y2 | 2 |
| 7 | Ar7 | A2 | A1 | 2 | A2 | 1 | A2 | 1 |
| 8 | Ar8 | BR | BR | 1 | BR | 1 | BR | 1 |
| 9 | Ar9 | FH | FH | 1 | FH | 1 | FH | 1 |
| 10 | Ar10 | XR | XR | 1 | XB | 3 | XB | 2 |
| 11 | Ar11 | XY | XY | 1 | XZ | 2 | XZ | 2 |
| 12 | Ar12 | CR | CF | 2 | CR | 1 | CR | 1 |
| 13 | Ar13 | G1 | G1 | 1 | G2 | 2 | G2 | 2 |
| 14 | Ar14 | FR | FR | 1 | FS | 2 | FS | 2 |
| 15 | Ar15 | BT | BG | 2 | BT | 1 | BT | 1 |
| 16 | Ar16 | FT | FT | 1 | FT | 2 | FT | 2 |
| 17 | Ar17 | GH | GT | 2 | GH | 1 | GH | 1 |
| 18 | Ar18 | VH | VZ | 2 | VH | 1 | VH | 1 |
| 19 | Ar19 | SML | SML | 1 | SML | 1 | SML | 1 |
| 20 | Ar20 | SF | SF | 1 | SF | 1 | SF | 1 |
4.2 Result analysis
Statistical analysis was performed between the two methods based on these results. We utilized the results of the top-ranked supplier from each method, and analysis of variance (ANOVA) was established to ascertain whether the differences between the means of the groups were statistically meaningful or not. The analysis of the results is illustrated in Tables 19 and 20.
Statistical analysis comparing each pair of methods
| Hybrid method | σ xy | σ x | σ y | R xy | Standard deviation |
|---|---|---|---|---|---|
| AHP–fuzzy-TOPSIS and AHP–fuzzy-WSM | 0.0068 | 0.11 | 0.10 | 0.6 | 0.09 |
| AHP–fuzzy-TOPSIS and AHP–fuzzy-WPM | 0.0117 | 0.11 | 0.15 | 0.71 | 0.07 |
| AHP–fuzzy-WSM and AHP–fuzzy-WPM | 0.0124 | 0.10 | 0.15 | 0.78 | 0.06 |
ANOVA for the three MCDM methods
| Source of variation | SS | Df | MS | F | p-value | F criteria |
|---|---|---|---|---|---|---|
| Between groups | 0.11186333 | 2 | 0.05593167 | 3.49983533 | 0.03684409 | 3.15884272 |
| Within groups | 0.91093 | 57 | 0.01598123 | |||
| Total | 1.02279333 | 59 |
Table 19 displays the correlation coefficients calculated to establish the dependence between the supplier rankings obtained from the AHP–fuzzy-TOPSIS, AHP–fuzzy-WSM, and AHP–fuzzy-WPM methods. Consequently, a significant correlation was observed among the different pairs of MCDM methods with correlation coefficient values (R xy ) exceeding 0,5.
According to the results presented in Table 20, the p-value is below 0.05. Hence, the null hypothesis is not accepted, meaning that not all population means are identical. In conclusion, we found statistically meaningful differences between the means of the groups. Another study was done to determine if the distribution of the value of the first rank for each model obeyed the normal distribution or not. The results are illustrated in Table 21 and Figure 4.
Normal distribution parameters
| Methods | μ: mean | σ: standard deviation | Percentage between μ – σ and μ + σ | Percentage between μ –2σ and μ + 2σ | Percentage between μ – 3σ and μ + 3σ |
|---|---|---|---|---|---|
| AHP-Fuzzy-TOPSIS | 0.619 | 0.11 | 67.9% | 95% | 99.7% |
| AHP-Fuzzy-WSM | 0.682 | 0.10 | 68% | 94.9% | 99.9% |
| AHP-Fuzzy-WPM | 0.5775 | 0.15 | 68% | 95% | 99.6% |

Distribution plot for the hybrid MCDM models: AHP–fuzzy-TOPSIS (a), AHP–fuzzy-WSM (b), and AHP–fuzzy-WPM (c).
Figure 4 and Table 21 show that 68% of values are in the interval [μ − σ, μ + σ], 95% are in the interval [μ − 2σ, μ + 2σ], and 99.7% are in the interval [μ − 3σ, μ + 3σ]. According to these results, we can conclude that the distribution of the value of the 1st rank for each method obeys the normal distribution. Besides, based on Table 18, we calculated the coincidence ratio of supplier scores between the methods used and the selections made by the purchasing manager for all successful purchase orders in the database. The coincidence ratio results are presented in Figure 5.
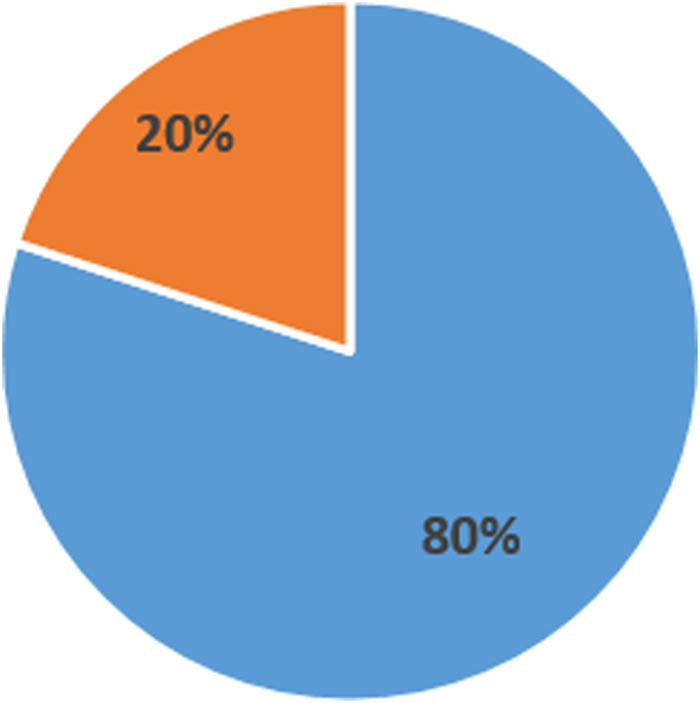
Figure 5 indicates that the AHP–fuzzy-TOPSIS model exhibits the highest proportion of coincidence in supplier scores with the decisions made by the purchasing manager compared with other models. This percentage is equal to 70%. In our case study, the results demonstrate that the AHP–fuzzy-TOPSIS method excels in choosing the best and optimal supplier.

Ratio of coincidence of supplier rankings between the AHP–fuzzy-TOPSIS (a), AHP–fuzzy-WSM (b), and AHP–fuzzy-WPM (c) models and the decision made by the supply chain manager.
4.3 Industrial applications
During this stage, we developed an application to facilitate swift and effective supplier evaluation and selection decisions. This application was based on the AHP–fuzzy-TOPSIS method. In this industrial application, Visual Basic .NET (2015 version) was employed as a development program. Microsoft Access (2016 version) as a database. Figure 6 shows the interface of our industrial application.

Interface for industrial application in supplier selection.
In the apparel industry, we deployed a digital decision support application utilizing the database discussed in Section 4.1. We then compared the outcomes derived from the application with the decisions made by the company, presenting the results in Figure 7.
Industrial application result.
As shown in Figure 7, the percentage of similarity in supplier scores between our software’s results and the decisions made by the supply chain manager was 80%. This result is deemed highly satisfactory. In future studies, the database will be further expanded to encompass all the company’s real cases to improve the performance of decision support applications.
5 Conclusions
In this research, three fuzzy hybrid methods were developed to select suppliers for a company specializing in the fabrication of denim. The methods used are crucial for making decisions or evaluating multiple options in situations where no option is ideal. In our article, three integrated approaches combining the AHP with the fuzzy-TOPSIS, fuzzy-WSM, and fuzzy-WPM models were employed. Subsequently, we used these methods within a clothing company. Consequently, we found that the AHP–fuzzy-TOPSIS method is better and more practical compared to the AHP–fuzzy-WSM and the AHP–fuzzy-WPM methods in assessment and choosing the best supplier. The coincidence ratio between the obtained solutions using the AHP–fuzzy-TOPSIS model with those corresponding to the firm’s preferred choice is equal to 70%. Based on this percentage, we can infer that the AHP–fuzzy-TOPSIS method is well-suited for forecasting, identifying, and selecting the optimal suppliers within the clothing company’s procurement process. Moreover, this approach can be used in other industrial sectors. Indeed, The AHP–fuzzy-TOPSIS method is thus more effective than the other models in managing subjectivity, uncertainty, and complexity. Providing a structured framework for decision-making, this model integrates qualitative and quantitative approaches with a solid ranking methodology, thus allowing decision-makers to make more effective and reliable decisions in complex decision environments. In future perspectives, other models can be implemented such as the ANP, the neural network, and heuristic methods. Then, we will integrate the most efficient models in this application to play the role of a good decision tool in the selection and assessment of suppliers and subcontractors.
-
Funding information: This research study was funded and supported by the Ministry of Higher Education and Scientific Research in the frame of the TUNISO-MOROCCAN cooperation program; the R&D project reference no. is 20/PRD-25.
-
Author contributions: All authors have taken full responsibility for the content of this manuscript, provided their consent for its submission to the journal, reviewed all findings, and approved the final version. Mourad Lahdhiri, Amel Babay, and Mohamed Jmali contributed to the development of the models, conducted experiments, and carried out analytical and statistical studies. Mustapha Hlyal supported the development of industrial applications, while Mustapha Ahlaqqach assisted in revising the manuscript, focusing on its scientific and analytical aspects. Mourad Lahdhiri prepared the manuscript with input and contributions from all co-authors.
-
Conflict of interest: The authors state no conflict of interest.
-
Data availability statement: The datasets generated during and/or analysed during the current study are available from the corresponding author on reasonable request.
References
[1] Yildiz, A., Yayla, A. (2015). Multicriteria decision-making methods for supplier selection: A literature review. South African Journal of Industrial Engineering, 26(2), 158–177.10.7166/26-2-1010Search in Google Scholar
[2] Schramm, V. B., Cabral, L. P. B., Schramm, F. (2020). Approaches for supporting sustainable supplier selection – A literature review. Journal of Cleaner Production, 273, 123089.10.1016/j.jclepro.2020.123089Search in Google Scholar
[3] Ho, W., Xu, X., Dey, P. K. (2010). Multi-criteria decision-making approaches for supplier evaluation and selection: A literature review. European Journal of Operational Research, 202(1), 16–24.10.1016/j.ejor.2009.05.009Search in Google Scholar
[4] Chan, F. T., Chan, H. K. (2010). An AHP model for the selection of suppliers in the fast-changing fashion market. The International Journal of Advanced Manufacturing Technology, 51(9), 1195–1207.10.1007/s00170-010-2683-6Search in Google Scholar
[5] Amindoust, A., Saghafinia, A. (2017). Textile supplier selection in sustainable supply chain using a modular fuzzy inference system model. The Journal of the Textile Institute, 108(7), 1250–1258.Search in Google Scholar
[6] Burney, S. A., Ali, S. M. (2019). Fuzzy multi-criteria-based decision support system for supplier selection in textile industry. IJCSNS, 19(1), 239.Search in Google Scholar
[7] Utama, D. M., Maharani, B., Amallynda, I. (2021). Integration dematel and ANP for the supplier selection in the textile industry: A case study. Jurnal Ilmiah Teknik Industri, 20(1), 119–130.10.23917/jiti.v20i1.13806Search in Google Scholar
[8] Yang, Y. P. O., Shieh, H. M., Leu, J. D., Tzeng, G. H. (2008). A novel hybrid MCDM model combined with DEMATEL and ANP with applications. International Journal of Operations Research, 5(3), 160–168.Search in Google Scholar
[9] Guarnieri, P., Trojan, F. (2019). Decision making on supplier selection based on social, ethical, and environmental criteria: A study in the textile industry. Resources, Conservation and Recycling, 141, 347–361.10.1016/j.resconrec.2018.10.023Search in Google Scholar
[10] Selçuk, P. (2006). An application of the integrated AHP‐PGP model in supplier selection. Measuring Business Excellence, 10(4), 34–49.10.1108/13683040610719263Search in Google Scholar
[11] Kull, T. J., Talluri, S. (2008). A supply risk reduction model using integrated multicriteria decision making. IEEE Transactions on Engineering Management, 55(3), 409–419.10.1109/TEM.2008.922627Search in Google Scholar
[12] Abraham M., Santiago, E., Ravindran, A. R. (2008). A three-phase multicriteria method to the supplier selection problem. International Journal of Industrial Engineering, 15(2), 195–210.Search in Google Scholar
[13] Sasi, J. C., Digalwar, A. K. (2015). Application of AHP and TOPSIS method for supplier selection between India & China in the textile industry. International Research Journal of Engineering and Technology, 2(4), 1730–1738.Search in Google Scholar
[14] Lahdhiri, M., Babay, A., Jmali, M. (2021). Development of subcontractor selection models using fuzzy and AHP methods in the apparel industry supply chain. Autex Research Journal, 21(4), 413–427.10.2478/aut-2020-0057Search in Google Scholar
[15] Liao, S. K., Chang, K. L., Tseng, T. W. (2010). Optimal selection of program suppliers for TV companies using an analytic network process (ANP) approach. Asia-Pacific Journal of Operational Research, 27(6), 753–767.10.1142/S0217595910002983Search in Google Scholar
[16] Gencer, C., Gürpinar, D. (2007). Analytic network process in supplier selection: A case study in an electronic firm. Applied Mathematical Modelling, 31(11), 2475–2486.10.1016/j.apm.2006.10.002Search in Google Scholar
[17] Arabsheybani, A., Paydar, M. M., Safaei, A. S. (2018). An integrated fuzzy MOORA method and FMEA technique for sustainable supplier selection considering quantity discounts and supplier’s risk. Journal of Cleaner Production, 190, 577–591.10.1016/j.jclepro.2018.04.167Search in Google Scholar
[18] Vinodh, S., Ramiya, R. A., Gautham, S. G. (2011). Application of fuzzy analytic network process for supplier selection in a manufacturing organization. Expert Systems with Applications, 38(1), 272–280.10.1016/j.eswa.2010.06.057Search in Google Scholar
[19] Masoud G. R., Helmi, S. A., Hashemzahi, P. (2016). Supplier selection in automobile industry: A mixed balanced scorecard–fuzzy AHP approach. Alexandria Engineering Journal, 55(1), 93–100.10.1016/j.aej.2016.01.005Search in Google Scholar
[20] Zadeh, L. A. (1965). Information and control. Fuzzy Sets, 8(3), 338–353.10.1016/S0019-9958(65)90241-XSearch in Google Scholar
[21] Irine, J., Porchelvi, R. S. (2019). An application of fuzzy topsis method using trapezoidal fuzzy numbers. Journal of Information and Computational Science, 9(10), 458–462.Search in Google Scholar
[22] Saaty, T. L., Peniwati, K. (2013). Group decision making: Drawing out and reconciling differences. RWS Publications, Pittsburgh.Search in Google Scholar
[23] Hwang, C. L., Lai, Y. J., Liu, T. Y. (1993). A new approach for multiple objective decision making. Computers & Operations Research, 20(8), 889–899.10.1016/0305-0548(93)90109-VSearch in Google Scholar
[24] Fishburn, P. C. (1967). Additive utilities with incomplete product sets: Application to priorities and assignments. Operations Research, 15(3), 537–542.10.1287/opre.15.3.537Search in Google Scholar
[25] Kabassi, K., Karydis, C., Botonis, A. (2020). Ahp, fuzzy saw, and fuzzy wpm for the evaluation of cultural websites. Multimodal Technologies and Interaction, 4(1), 5.10.3390/mti4010005Search in Google Scholar
[26] Mohd Safian, E. E., Nawawi, A. H. (2011). The evolution of analytical hierarchy process (AHP) as a decision making tool in property sectors. Munich Personal RePEc Archive, 39442.Search in Google Scholar
© 2024 the author(s), published by De Gruyter
This work is licensed under the Creative Commons Attribution 4.0 International License.
Articles in the same Issue
- Characterization of viscoelastic properties of yarn materials: Dynamic mechanical analysis in the transversal direction
- Analysis of omni-channel implementations that are preferred by consumers in clothing sector
- Structural modeling and analysis of three-dimensional cross-linked braided preforms
- An experimental study of mechanical properties and comfortability of knitted imitation woven shirt fabrics
- Technology integration to promote circular economy transformation of the garment industry: a systematic literature review
- Research on T-shirt-style design based on Kansei image using back-propagation neural networks
- Research on She nationality clothing recognition based on color feature fusion with PSO-SVM
- Accuracy prediction of wearable flexible smart gloves
- Preparation and performance of stainless steel fiber/Lyocell fiber-blended weft-knitted fabric
- Development of an emotional response model for hospital gown design using structural equation modeling
- Preparation and properties of stainless steel filament/pure cotton woven fabric
- Facemask comfort enhancement with graphene oxide from recovered carbon waste tyres
- Use of enzymatic processes in the tanning of leather materials
- Optical-related properties and characterization of some textile fibers using near-infrared spectroscopy
- Network modeling of aesthetic effect for Chinese Yue Opera costume simulation images
- Predicting consumers’ garment fit satisfactions by using machine learning
- Non-destructive identification of wool and cashmere fibers based on improved LDA using NIR spectroscopy
- Study on the relationship between structure and moisturizing performance of seamless knitted fabrics of protein fibers for autumn and winter
- Antibacterial and yellowing performances of sports underwear fabric with polyamide/silver ion polyurethane filaments
- Numerical and experimental analysis of ballistic performance in hybrid soft armours composed of para-aramid triaxial and biaxial woven fabrics
- Phonetic smart clothing design based on gender awareness education for preschoolers
- Determination of anthropometric measurements and their application in the development of clothing sizing systems for women in the regions of the Republic of Croatia
- Research on optimal design of pleated cheongsam based on Kano–HOQ–Pugh model
- Numerical investigation of weaving machine heald shaft new design using composite material to improve its performance
- Corrigendum to “Use of enzymatic processes in the tanning of leather materials”
- Shaping of thermal protective properties of basalt fabric-based composites by direct surface modification using magnetron sputtering technique
- Numerical modeling of the heat flow component of the composite developed on the basis of basalt fabric
- Weft insertion guideway design based on high-temperature superconducting levitation
- Ultrasonic-assisted alkali hydrolysis of polyethylene terephthalate fabric and its effect on the microstructure and dyeing properties of fibers
- Comparative study on physical properties of bio-based PA56 fibers and wearability of their fabrics
- Investigation of the bias tape roll change time efficiency in garment factories
- Analysis of foot 3D scans of boys from Polish population
- Optimization of garment sewing operation standard minute value prediction using an IPSO-BP neural network
- Influence of repeated switching of current through contacts made of electroconductive fabrics on their resistance
- Numerical calculation of air permeability of warp-knitted jacquard spacer shoe-upper materials based on CFD
- Compact Spinning with Different Fibre Types: An Experimental Investigation on Yarn Properties in the Condensing Zone with 3D-Printed Guiding Device
- Modeling of virtual clothing and its contact with the human body
- Advances in personalized modelling and virtual display of ethnic clothing for intelligent customization
- Investigation of weave influence on flame retardancy of jute fabrics
- Balloonless spinning spindle head shape optimisation
- Research on 3D simulation design and dynamic virtual display of clothing flexible body
- Turkish textile and clothing SMEs: Importance of organizational learning, digitalization, and internationalization
- Corrigendum To: “Washing characterization of compression socks”
- Study on the promotion multiple of blood flow velocity on human epidermal microcirculation of volcanic rock polymer fiber seamless knitted fabric
- Bending properties and numerical analysis of nonorthogonal woven composites
- Bringing the queen mother of the west to life: Digital reconstruction and analysis of Taoist Celestial Beings Worshiping mural’s apparel
- Modeling process for full forming sports underwear
- Retraction of: Ionic crosslinking of cotton
- An observational study of female body shape characteristics in multiracial Malaysia
- Study on theoretical model and actual deformation of weft-knitted transfer loop based on particle constraint
- Design and 3D simulation of weft-knitted jacquard plush fabrics
- An overview of technological challenges in implementing the digital product passport in the textile and clothing industry
- Understanding and addressing the water footprint in the textile sector: A review
- Determinants of location changes in the clothing industry in Poland
- Influence of cam profile errors in a modulator on the dynamic response of the heald frame
- Quantitative analysis of wool and cashmere fiber mixtures using NIR spectroscopy
- 3D simulation of double-needle bar warp-knitted clustered pile fabrics on DFS
- Finite element analysis of heat transfer behavior in glass fiber/metal composite materials under constant heat load
- Price estimation and visual evaluation of actual white fabrics used for dress shirts and their photographic images
- Effect of gluing garment materials with adhesive inserts on their multidirectional drape and bending rigidity
- Optimization analysis of carrier-track collision in braiding process
- Numerical and experimental analysis of the ballistic performance of soft bulletproof vests for women
- The antimicrobial potential of plant-based natural dyes for textile dyeing: A systematic review using prisma
- Influence of sewing parameters on the skin–fabric friction
- Validation by experimental study the relationship between fabric tensile strength and weave structures
- Optimization of fabric’s tensile strength and bagging deformation using surface response and finite element in stenter machine
- Analysis of lean manufacturing waste in the process flow of ready-to-wear garment production in Nigeria
- An optimization study on the sol–gel process to obtain multifunctional denim fabrics
- Drape test of fully formed knitted flared skirts based on 3D-printed human body posture
- Supplier selection models using fuzzy hybrid methods in the clothing textile industry