Optimization of garment sewing operation standard minute value prediction using an IPSO-BP neural network
-
Haina Shen
 and
Xiaofen Ji
and
Xiaofen Ji

Abstract
Standard minute value serves as a pivotal metric guiding the arrangement and balancing of production cycles in clothing production lines, and plays a crucial role in cost pricing and production order arrangement for clothing products. Given the complexity of the garment sewing process, ten influencing factors including fabric weight, fabric thickness, fabric density, stitching length, stitching shapes, cut pieces numbers, notch numbers, sewing technologies, sewing machine, and auxiliary accessories were identified. Upon this foundation, a standard sewing time prediction model, Improved particle swarm optimization - Back-propagation neural network (IPSO-BP), was proposed, focusing on non-quantitative factors. The IPSO-BP model was trained using actual sewing data from a women’s clothing production company. Compared to the unoptimized BP neural network, the IPSO-BP model demonstrated significant advantages in terms of convergence speed and prediction accuracy. Therefore, the IPSO-BP model proposed in this study holds promise for predicting standard sewing hours effectively.
1 Introduction
With the increase in diversified and personalized demand for products from different levels of consumer groups, the “multi-variety, small-batch” production paradigm has become the norm in the apparel industry. This approach involves manufacturing a wide range of products in small quantities within a given timeframe, marked by brief production cycles and swift transitions between orders [1,2]. The heightened variability in product types, manufacturing processes, and batch sizes leads to imprecise production planning, scheduling, and dispatching, as well as discrepancies between actual and planned production timelines, thereby diminishing the manufacturer’s capacity for rapid response [3]. The fundamental issue stems from existing work hour determination strategies, which fail to timely and accurately capture the true work hour requirements for products in a multi-variety, small-batch production setting. Consequently, researching methods to efficiently and precisely predict the standard minute value for new products within such a manufacturing context is of paramount importance.
In conventional methods for establishing standard minute value, data are collected through measurement techniques to create standard minute value database for production purposes [4]. The measurement approach typically employs the stopwatch method and the predetermined motion time system. The stopwatch method involves directly observing operating times through repeated measurements using a stopwatch [5]. Conversely, the predetermined motion time system relies on predetermined values for various fundamental movements. It establishes a standard based on predetermined values for various fundamental movements, which are then used to calculate the theoretical standard minute value for a process by breaking it down into basic actions [6]. However, in the actual production process, these theoretical standard minute values can be influenced by real-world manufacturing factors such as employee skills, working environment, and production batch sizes, and more. Consequently, various methodologies have been developed to formulate standard minute value from different perspectives. He et al. introduced the use of MODAPTS analysis, which incorporates considerations of employee physiology, fatigue, and management float rate to construct theoretical working hours [7]. This approach supplements the traditional stopwatch method with a nuanced understanding of human factors. Similarly, Liu expanded upon this by integrating additional factors such as the working level coefficient, which encompasses proficiency, effort, working conditions, and consistency [8]. Moreover, considerations like workshop working margins are factored in to determine the final standard minute value. In summary, these methodologies represent sophisticated approaches for standardizing minute value, harmonizing theoretical principles with practical considerations to achieve a more precise calculation of standard minute value.
In response to the garment manufacturing industry’s shift towards smaller batch sizes and increased individualized orders, there is a growing emphasis on pre-production operation analysis. Scholars suggest grouping working processes based on standard minute value to expedite and streamline the calculation process. For instance, Wu and Mu employs group technology and similarity principles to encode processes, creating a typical process library. Benchmark working times are then determined using the principle of maximum proximity in actual production settings [9]. Similarly, Zheng et al. argues that clothing parts with similar shapes typically share similar processes. Hence, forming a parts component time library based on components like collars, sleeves, and fronts facilitates rapid determination of standard minute value for garments [10]. While these methods alleviate the complexity of process analysis and enhance formulation efficiency, the rapid evolution of clothing types, technology, and equipment conditions poses challenges. The standard minute value database may deviate significantly over time, necessitating regular revisions to typical process or component databases – a labor-intensive task.
Therefore, scholars have devised various schemes to predict the rated working hours of new products. Ye and Yan employs the standard data method and learning curve to formulate the rated working hours. This approach organizes working units based on processing hours data from previous orders, bypassing the time and energy-intensive nature of direct measurement. By deriving the learning coefficient from the learning curve of similar operations, Ye adjusts the standard minute value for new processes [11]. Similarly, Wang et al. takes a comprehensive approach, considering factors such as component characteristics, production configuration, operating standards, employee proficiency, working environment, and order batch size [12]. By establishing a process similarity coefficient through expert scoring, unknown processes are compared with benchmark processes. This enables the rapid formulation of work hour quotas based on the process similarity coefficient.
In the realm of predicting garment standard minute value, scholars have explored various approaches, including direct time research, action analysis, statistical analysis, mathematical modeling, and others. Direct time studies and action analyses boast high accuracy but entail heavy workloads and limited adaptability, making them best suited for large-scale centralized production of stable products. Statistical analysis, based on historical processing data, offers simplicity, convenience, and swift quota generation, but often suffers from lower prediction accuracy. Mathematical modeling methods establish regression models between working hour quotas and influencing factors, yielding high prediction accuracy and user convenience. However, the expert scoring method used to determine the weight distribution of influencing factors tends to be overly subjective. Consequently, scholars have proposed the use of neural network algorithms to mitigate the impact of subjective factors. For instance, Yang et al. identifies factors influencing working hours based on product structure complexity, trains samples using BP neural networks, and derives product working hours [13]. Wang et al. introduces a method for determining working hour quotas based on error influence coefficients, utilizing neural network methods to obtain error correction coefficients for accurate working hour calculations [14]. Yang et al. integrates genetic algorithms and case-based reasoning technology to address fixed hours in injection mold processing [15]. Therefore, these studies present a promising avenue for introducing neural network algorithms into garment standard minute value prediction. Drawing inspiration from other industries, this study analyzes the primary characteristics of components, processes, and operational procedures to identify the influencing factors of rated working hours. It endeavors to establish a neural network-based working hour calculation model to swiftly predict product working hours.
2 Research methodology
2.1 Back-propagation (BP) neural network
The BP neural network, consisting of input, hidden, and output layers, stands as one of the most extensively employed neural network models [16]. Its fundamental operation revolves around minimizing error functions. By moving in the negative gradient direction, the network adjusts weights and thresholds using the fastest descent method of nonlinear programming, propelled by external input samples [17]. This correction process continually diminishes error, thereby driving the network output closer to the anticipated output.
Kolmogorov’s theoretical proof establishes that a three-layer network, equipped with an adequate number of hidden nodes, can attain arbitrary mapping capabilities along with self-learning, self-organization, and adaptability [18]. This theorem underscores the three-layer network’s ability to precisely approximate any nonlinear mapping relationship. Consequently, a single hidden layer BP network emerges as capable of addressing the majority of practical problems encountered in our domain. Hence, the network proposed in this study also adheres to a single hidden layer model, comprising one input layer, one intermediary hidden layer, and one output layer, as illustrated in Figure 1.
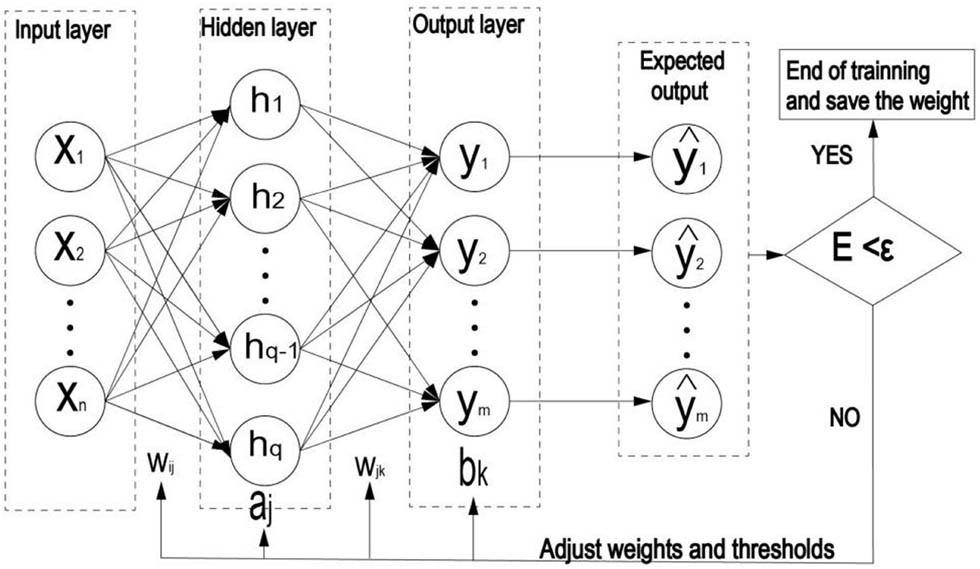
The flowchart of single hidden layer BP neural network.
The input layer serves as the entry point for information, receiving input data x 1, x 2,···, x n. The hidden layer processes this information, while the output layer yields the desired results y 1, y 2,···, y m . The weights w ij and w jk denote the connection strengths from the input layer to the hidden layer and from the hidden layer to the output layer, respectively. The parameters a j and b k represent the thresholds for the hidden layer and output layer, respectively, serving as indicators of the neurons’ sensitivity to input signals. When the weighted sum of input signals exceeds these thresholds, the neuron is activated, leading to an output; otherwise, the neuron remains inactive, and the output remains zero [19]. In the Figure 1, the BP neural network symbolizes the function mapping relationship from n independent variables to m dependent variables, with q hidden nodes.
The process of the single hidden layer BP neural network is primarily divided into two stages. The first stage is forward propagation of signals, which involves allowing information to enter the network from the input layer and obtaining the final output layer result through sequential calculations across each layer.
The formula for computing the hidden layer is as follows:
where H represents the output of the hidden layer, j denotes the number of nodes in the hidden layer, w ij is the connection weight between the input layer and the hidden layer, a j signifies the threshold of the hidden layer, and f denotes the activation function of the hidden layer, which can take various forms. In this study, the Sigmoid function is chosen, which yields superior performance when employed in a classifier [20].
The formula for computing the output layer is as follows:
where
Due to the initial weights (w ij , w jk ) and thresholds (a j , b k ) being random values, a significant error exists between the initially calculated result and the actual result. Therefore, parameter adjustment is necessary based on the error, aiming to achieve a better fit of the parameters until the error reaches its minimum value. Subsequently, the model proceeds to the second stage – BP.
In the second stage of the neural network, network parameters are adjusted by computing the error between the output layer and the expected value, aiming to minimize the error. The error is calculated as follows:
where E represents the loss value, y
k
denotes the expected value, and,
where φ denotes the learning rate. After updating the weights (w ij, w jk ) and thresholds (a j , b k ), the process returns to the first stage, and forward calculation is performed again until the network output error satisfies the accuracy requirements.
Nevertheless, the conventional BP neural network suffers from drawbacks such as low learning efficiency, slow convergence speed, and susceptibility to local minima [21,22]. This study introduces the particle swarm optimization algorithm (PSO) to expedite the optimization process of weights and thresholds, thereby facilitating the completion of network training tasks.
2.2 Improved particle swarm optimization (IPSO)
The PSO was initially proposed by American social psychologists and electrical engineers, drawing inspiration from the foraging behavior of birds [23]. PSO is an optimization algorithm rooted in the theory of swarm intelligence, which entails optimizing a group through collective cooperation among birds. The PSO algorithm has been successfully applied to optimization problems across various domains due to its straightforward concept, robustness, and global search capability.
When employing the standard particle swarm optimization algorithm to solve optimization problems, it organizes a particle swarm consisting of N particles within a D-dimensional space [24]. The continuous iterative process can be described as the pursuit of two extreme values by particles: one aims to find the optimal value specific to the particle itself, known as the local best value pbest; the other strives to discover the optimal value across the current particle population, referred to as the global best value gbest. By iteratively tracking these two “extreme values,” the particle consistently updates its velocity v and displacement x to best approximate the expected value (Figure 2).

Flowchart of PSO algorithm.
Upon finding these two optimal solutions, the particle updates its velocity and new position according to the following formula:
where c 1 and c 2 are the acceleration coefficients, where c 1 expresses how much confidence a particle has in itself, while c 2 expresses how much confidence a particle has in its neighbors [25]. And r 1 and r 2 are random numbers between [0,1].
To enhance the performance of the PSO algorithm, Shi and Eberhart introduced the inertia weight w as a mechanism to control the group’s search and exploration abilities [26], as depicted in formula (11). Dynamic w can achieve better exploration than a fixed value. Currently, Shi’s linearly decreasing inertia weight (LDW) is the most commonly used approach formula (12).
where w max and w min represent the maximum and minimum values of w, respectively. t represents the number of current iteration steps, and t max represents the maximum number of iteration steps [27].
However, in Shi’s LDW strategy, the algorithm is anticipated to swiftly converge towards the optimal advantage if identified early in operation. While, the linear decline of w may hinder the algorithm’s convergence speed [28]. Furthermore, as w decreases during the later stages of execution, the algorithm’s global search capability diminishes, leading to a reduction in diversity and an elevated risk of local optima convergence. Therefore, this study proposes the use of a nonlinear weighting method (IPSO) to address the shortcomings of the standard algorithm. This method can be described as:
In the early stages, when t is small, w approximates to W max to uphold the algorithm’s global search proficiency. As t increases, nonlinear reduction ensures the algorithm’s local search capability, allowing for adaptive adjustment between global and local search prowess.
3 Framework for standard sewing time prediction based on IPSO-BP method
3.1 Analysis of factors affecting standard sewing hours
Standard minute value serves as a fundamental metric within the garment industry, reflecting labor efficiency and facilitating processing cost analysis [29]. These hours represent the duration required to fulfill quality standards using standardized methods, ensuring reasonable labor intensity and speed under typical operational conditions. However, numerous factors in the actual production process contribute to variations in work duration for identical processes. These factors encompass fabric properties, working environments, equipment capabilities, product quality, and staff expertise, among others. Quantifying the precise impact of these factors on operations presents challenges in practical settings [30]. Garment manufacturing constitutes a complex process involving interactions among personnel, machinery, materials, methods, and the environment [31]. From the standpoint of implementing garment processing, the sewing process can be summarized as follows: operators in the garment sewing process primarily receive task-related information (such as cut piece details, equipment specifications, and process requirements) during their work. They subsequently utilize this information, in conjunction with their own knowledge and experience, to carry out specific sewing operations, as shown in Figure 3.
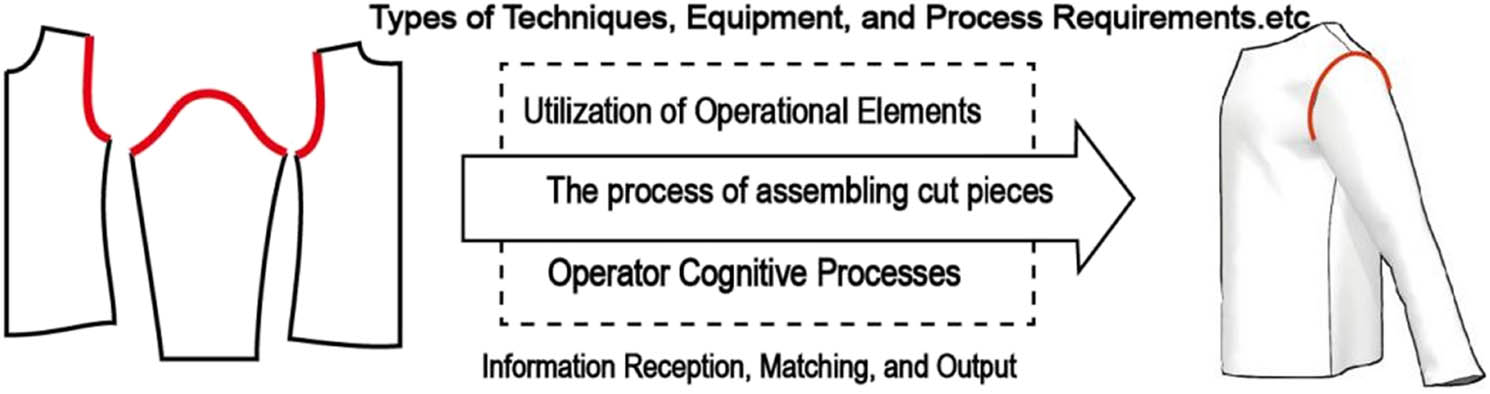
The process of assembling cut piece.
This analytical approach, rooted in the realm of garment processing, encompasses three crucial aspects: cut piece characteristics, operational elements, and operator cognitive factors during the cutting and stitching process. It fundamentally captures the influencing factors of processing time for this operation.
To efficiently assess the working hour quota for various products and establish a robust foundation for enterprise production planning in the context of multi-variety and small-batch manufacturing, it is imperative for enterprises to devise effective and versatile evaluation metrics to gauge and appraise the three aforementioned characteristics in garment processing. Complexity analysis, a method prevalent in task feature research within the industrial technology domain, has emerged as a pivotal tool [32]. Liu’s synthesis of recent research on task complexity underscores complexity as the summation of all factors influencing a task, and promotes a thorough evaluation across various dimensions [33]. Ham et al. advocated for a multi-level analysis of task characteristics, spanning functional, behavioral, and structural aspects [34]. Additionally, Kong and Ye examination of job execution and cognitive psychological processes through complexity indices offers insights into evaluating job elements and process characteristics [35]. In essence, complexity serves as a holistic evaluation metric that considers all facets of characteristic factors in task processes. For garment processing tasks, this metric fulfills the systematic requirements of evaluating rated working hour.
The complexity of garment sewing is influenced by various factors that collectively impact the time required to complete the task. First, different fabric characteristics, such as thickness, elasticity, and smoothness, play a significant role in determining sewing difficulty. For example, silk and knitted fabrics present greater challenges compared to cotton. Additionally, the garment’s structural design, including features like multiple cutting lines, princess lines, underarm darts, and armhole darts, require higher operating skills and contribute to increased sewing complexity. Moreover, lengthy stitching lines necessitate frequent pauses for cutting piece adjustments, leading to extended rated working hours. Special parts such as armholes and necklines often require additional notches for alignment, further lengthening pause times. Different sewing techniques, such as French seams, are more challenging than flat seams. Integration of advanced sewing machines and tools, like the blind hem foot, can simplify complex sewing tasks to some extent. Furthermore, an experienced operator with rapid learning abilities and high technical proficiency can reduce rated sewing time [36].
In general, the skill level of employees is typically factored into the arrangement of the assembly line to ensure optimal efficiency. This study primarily focuses on predicting the standard minute value required for garment sewing tasks, emphasizing objective factors such as the characteristics of the cut pieces and operational elements. Through an analysis of the sewing processes for cut pieces, the study conducts a feature analysis spanning cut piece attributes, technological operations, and equipment considerations. This analysis culminates in the establishment of an evaluation index system that encompasses cut piece processing performance complexity, cut piece structural relationship complexity, and job complexity, as depicted in Figure 4. Notably, cut piece performance complexity reflects the impact of fabric types and properties on sewing, while cut piece structural relationship complexity pertains to factors such as stitching line shapes and the arrangement of cut pieces. Job complexity accounts for the influence of sewing technologies and equipment types on the sewing process.
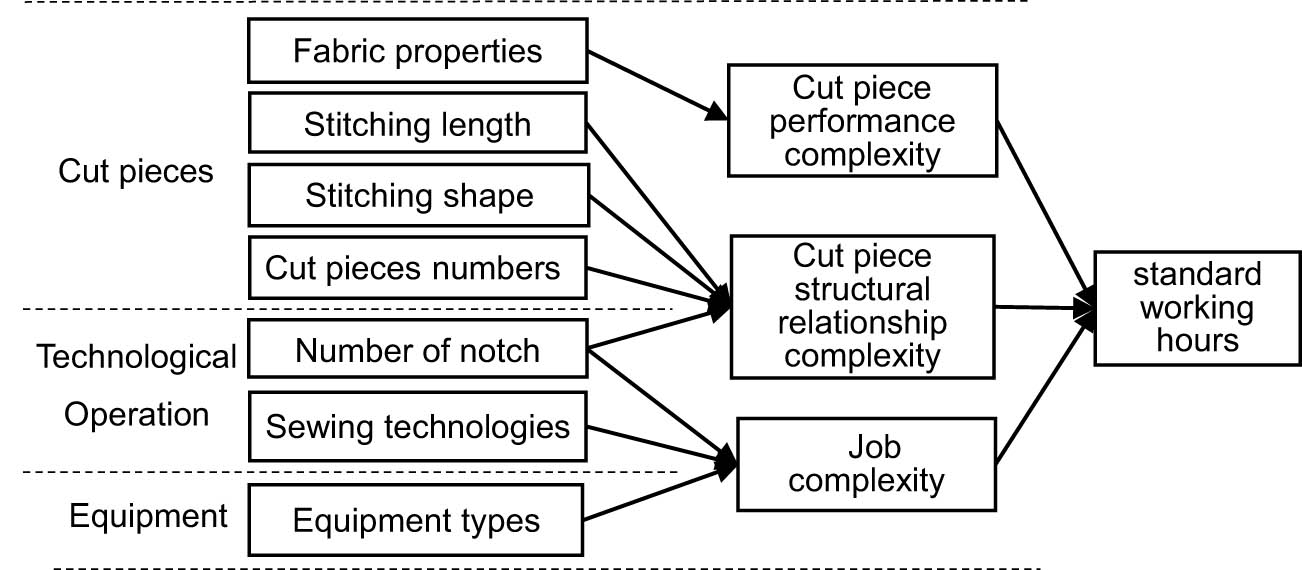
The factors of standard sewing hours.
3.2 Construction of IPSO-BP prediction model
In BP neural networks, weight updating is critical and plays a central role in the network’s learning process. Through refined adjustments of these weights using an IPSO method, the training accuracy and predictive capabilities of neural networks can be significantly enhanced. Consequently, in this study, the error function of the BP neural network is adopted as the fitness function for the IPSO algorithm to determine the optimal weights. The complete optimization process is delineated in the flowchart illustrated in Figure 5.
Determining neural network topology: A single hidden layer was adopted in the BP neural network topology for this study. The input variables consisted of factors influencing working hours, including fabric properties, stitching length, stitching shapes, number of cut pieces, number of notches, sewing technologies, and equipment type. The output variable was the standard minute value.
Initialization of IPSO parameters: Parameters for the IPSO were initialized, encompassing the particle dimension (D), swarm size (N), acceleration coefficients (c 1, c 2), maximum and minimum inertia weights (w max, w min), maximum velocity constraint (v max), maximum number of iterations (t max), and the initial weights for the neural network connections.
Fitness calculation and extreme search: The fitness value for each particle in the swarm was computed to identify both individual and global extremes.
Network training with optimized parameters: The BP neural network was trained using the optimized parameters obtained from the IPSO algorithm. The training process concluded once the network error fell below a specified threshold or the maximum iteration limit was met, at which point the trained network model was exported.

The framework of IPSO-BP prediction model.
4 Case studies
4.1 Data description and preparation
The raw data used in this study were sourced from ZS Company, a privately held family-owned women’s clothing company located in China. Founded in 1989, the company operates four fashion brands and has its own production workshop. Over the years, it has amassed a significant amount of sewing standard time data through its manufacturing operations. This study collected a portion of dress orders from 2023 and extracted sewing process, order information, material specifications, pattern information, process specification, and other relevant information from the process analysis table.
Among the primary factors influencing fabric sewing performance, composition, structure, density, weight, thickness, formability, extensibility, bending rigidity, and shear rigidity are crucial. This study focuses on commonly used fabric testing indicators in clothing enterprises: fabric thickness, weight, and density (the warp and weft density per inch). Fabric density is calculated by summing the number of warp and weft threads per inch of yarn. The evaluation index for stitching shapes is determined by the ratio of the curved part’s length to the total length of the pattern. Sewing technologies refer to the seam types specified in the ISO standard [37]. Equipment types are categorized into two segments: the first involves the types of sewing machines utilized, predominantly featuring computerized and conventional sewing machines in the ZS Company workshop. The second segment pertains to the utilization of auxiliary accessories, which serve to mitigate sewing difficulty.
Following data cleaning procedures to remove incomplete records, the finalized dataset consists of 231 sewing processes, each accompanied by the standard minute value and corresponding influencing factors, as outlined in Table 1.
Raw dataset of influencing factors and standard minute value of the sewing process
| No. | Fabric weight (g/m2) | Fabric thickness (mm) | Fabric density (T) | Stitching length (mm) | Stitching shapes (%) | Cut pieces numbers | Notch numbers | Sewing technologies | Sewing machine | Auxiliary accessories | Standard minute value (s) |
|---|---|---|---|---|---|---|---|---|---|---|---|
| 1 | 228 | 0.32 | 150 | 75 | 25 | 3 | 4 | 5.04 | Computerized | No | 89.4 |
| 2 | 228 | 0.32 | 150 | 70 | 23 | 3 | 4 | 5.04 | Computerized | Yes | 67.2 |
| 3 | 84 | 0.22 | 56 | 80 | 50 | 2 | 2 | 1.01 | Conventional | No | 95.4 |
| 4 | 185 | 0.34 | 142 | 20 | 13 | 2 | 4 | 6.03 | Computerized | Yes | 127.2 |
| 5 | 160 | 0.25 | 128 | 24 | 30 | 2 | 4 | 1.01 | Computerized | No | 34.2 |
| 6 | 52 | 0.32 | 48 | 75 | 0 | 1 | 2 | 1.01 | Computerized | No | 55.2 |
| 7 | 30 | 0.14 | 44 | 44 | 15 | 2 | 2 | 1.01 | Computerized | No | 69.0 |
| 8 | 35 | 0.22 | 56 | 76 | 25 | 1 | 4 | 3.05 | Conventional | Yes | 105.6 |
| 9 | 245 | 0.24 | 160 | 70 | 0 | 4 | 6 | 1.01 | Computerized | No | 115.2 |
| 10 | 185 | 0.34 | 142 | 81 | 10 | 1 | 2 | 5.01 | Computerized | No | 98.4 |
| ··· | ··· | ··· | ··· | ··· | ··· | ··· | ··· | ··· | ··· | ··· | ··· |
| 231 | 84 | 0.23 | 56 | 95 | 0 | 2 | 2 | 1.01 | Computerized | No | 109.8 |
To facilitate data processing, prevent neural output saturation resulting from excessive net input absolute values, and expedite the convergence of the training network, it is imperative to normalize all data. Different preprocessing methods are employed based on the nature of the data.
For quantitative data, the min-max method is applied for normalization, utilizing formula (14). This method is used for variables such as fabric thickness, fabric density, fabric weight, stitching length, cut number, and notch numbers.
(14)For binary categorical data, such as the utilization of auxiliary accessories and the type of sewing equipment, a binary assignment is applied. Here “1” and “0” are employed to denote the presence or absence of a particular feature. Specifically, the use of auxiliary accessories is represented by “1,” while their non-use is indicated by “0.” Similarly, the utilization of a computerized sewing machine is coded as “1,” whereas the use of a conventional sewing machine is coded as “0.” This binary coding system effectively transforms these categorical variables into a numerical format suitable for analysis by data processing and machine learning algorithms.
For multidimensional categorical variables, such as sewing technologies, frequency coding is employed for encoding. This method entails substituting the original category label with the frequency of occurrence of each category within the dataset. By doing so, each category is represented by a single numerical value, effectively circumventing the introduction of high dimensions or additional relationships.
4.2 Initialization of IPSO-BP model parameters
In the BP neural network section, the input layer consists of 10 neurons (n = 10), and the output layer consists of 1 neuron (m = 1). The number of hidden layers m is determined using a formula
In the IPSO section, the particle swarm size N is set to 20, and the particle swarm dimension D is calculated as (n + 1) × q + (q + 1) × m = 145. The acceleration coefficients c 1 and c 2 are set to 2.05, while the maximum and minimum inertia weights w max and w min are set to 0.9 and 0.4, respectively. The maximum velocity constraint v max is 1, and the maximum number of iterations t max is established at 3,000 [38].
The dataset of 231 samples is randomly split into a training set of 174 samples and a testing set of 57 samples, maintaining a ratio of approximately 3:1. The expected error (ε) is set to be less than 1 × 10⁻³. To further compare the results and confirm the efficacy of the IPSO-BP model, a BP network training is also conducted using MATLAB’s built-in toolbox. In this training setup, 75% of the data are allocated to the training set.
4.3 Result and discussion
Performance analysis
The IPSO-BP network was trained automatically until reaching the predefined accuracy threshold of 10−3, with training halted at the 3,000th iteration. During the simulation, the optimal mean square error validation result of 23.2653 was observed at the 1,064th iteration, as illustrated in Figure 6. Here the x-axis represents the number of training iterations, while the y-axis depicts the mean square error value.

The mean square error curve of IPSO-BP.
Subsequently, the trained IPSO-BP neural network’s regression analysis is presented in Figure 7. In this representation, the x-axis denotes the target output, and the y-axis illustrates the fitting function between the predicted output and the target output. The regression coefficient, R, signifies the degree of correlation between the predicted and target outputs. For this IPSO-BP network, R stands at 0.9818. A higher R value closer to 1 indicates a stronger relationship between the predicted and output data, while an R value closer to 0 suggests greater randomness between the predicted and output data.

Linear regression curve of IPSO-BP standard minute value prediction model.
Figure 8 displays the comparison between the actual and predicted values within the training set. The x-axis represents the sample size of the training set, while the y-axis denotes the standard time of the sewing process. Following this, regression predictions were conducted for the test data, consisting of randomly selected test samples. Figure 9 visualizes the comparison between the actual and predicted values for this test dataset.

Comparison of actual values and predicted values of the IPSO-BP training set.
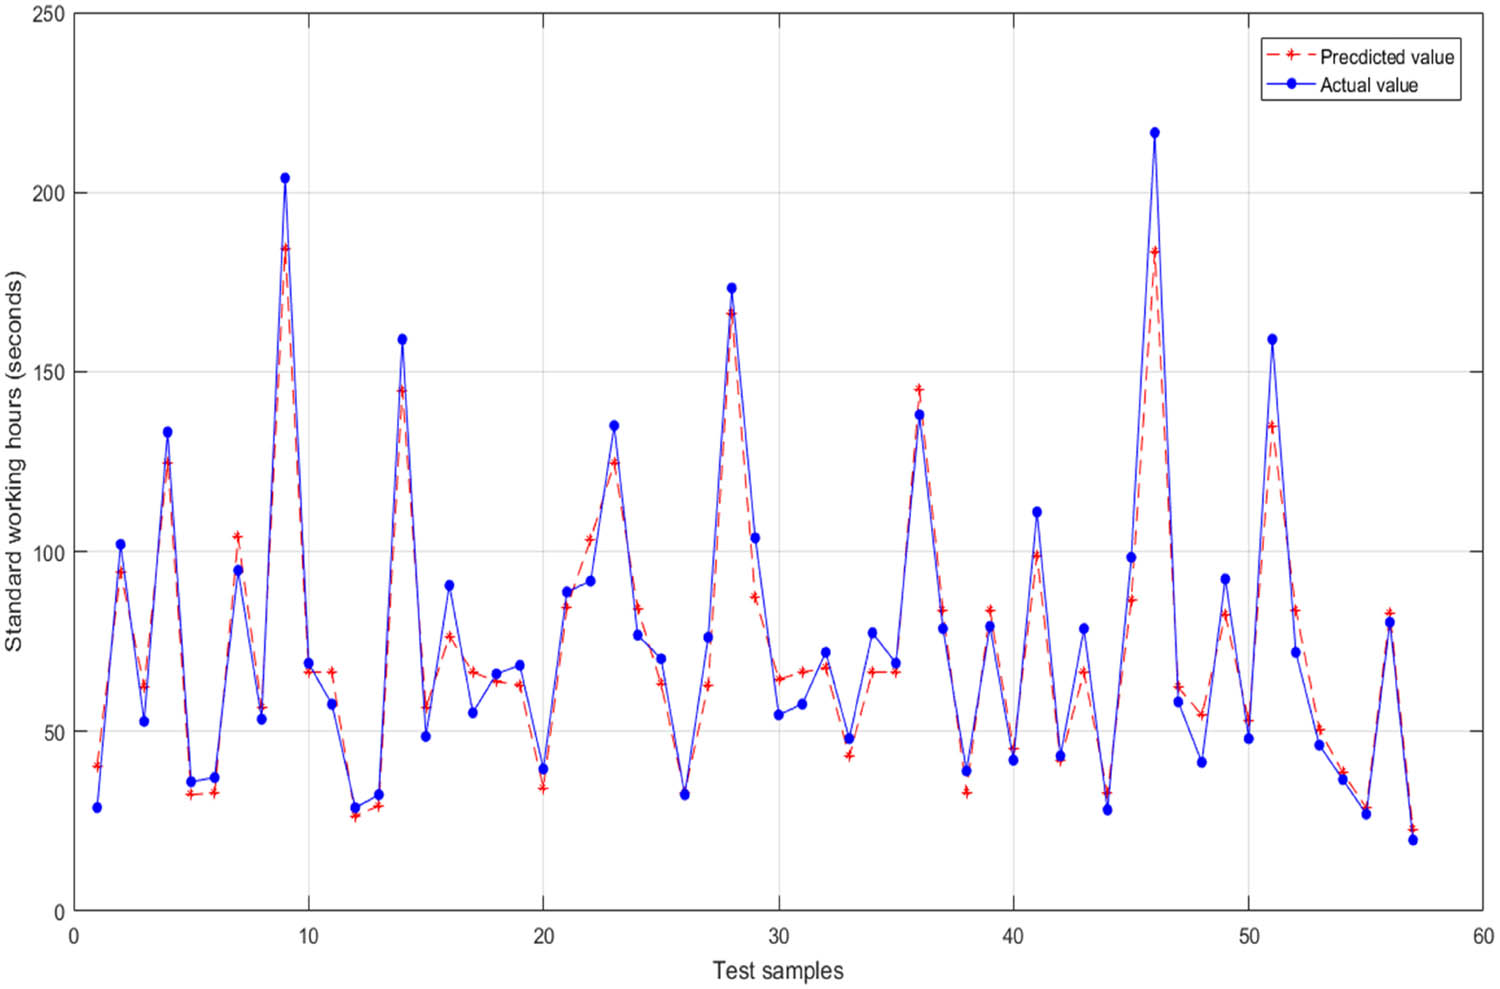
Comparison of actual values and predicted values of the IPSO-BP test set.
The prediction model based on the IPSO-BP optimization algorithm consistently demonstrates superior prediction performance, whether applied to training data experiments or testing data evaluations. This highlights the model’s robustness and efficacy across different datasets. Consequently, the IPSO-BP prediction model exhibits exceptional generalization capabilities, providing scientifically reliable predictions for the standard time of the sewing process.
Comparative analysis of BP and IPSO-BP neural network models for prediction
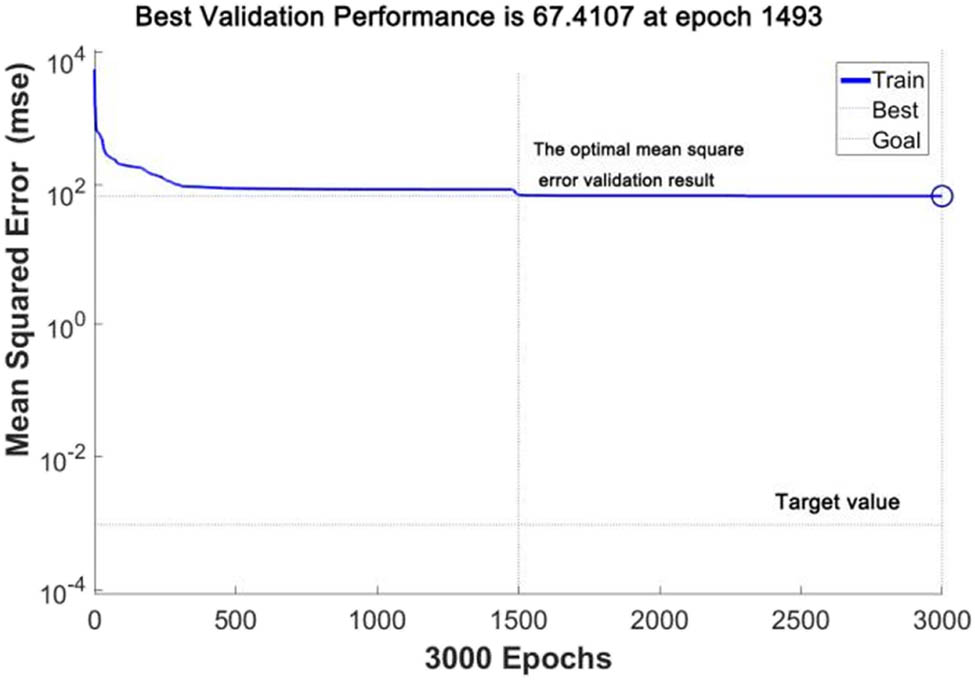
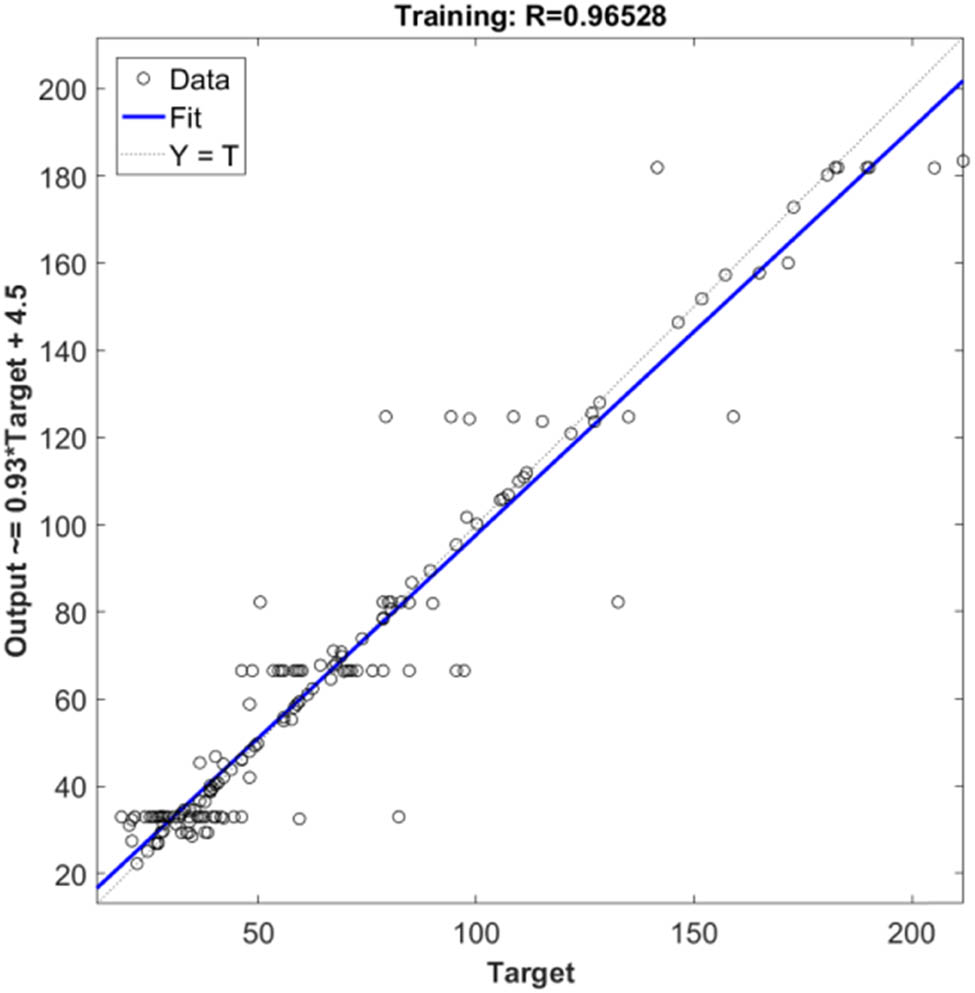
The training outcomes of the unoptimized BP neural network in the MATLAB toolbox are portrayed in Figure 10, where the optimal mean square error of 67.4107 was achieved at the 1,493rd iteration. The regression analysis of the trained BP neural network is depicted in Figure 11, revealing a correlation coefficient (R) of 0.96528. Table 2 presents a comparative analysis of the training performance between the IPSO-BP and BP neural network models. It is evident that IPSO, as an optimization algorithm adept at conducting global searches in solution spaces, can expedite the convergence of network weights toward global optima. This not only accelerates the convergence rate but also mitigates the risk of conventional BP neural networks getting trapped in local minima. Consequently, the IPSO-BP method demonstrates efficacy in training models for predicting standard sewing time.
The mean square error curve of IPSO-BP.
Linear regression curve of BP standard minute value prediction model.
Comparison of the training performance by the IPSO-BP and BP neural network
| Index | IPSO-BP | BP |
|---|---|---|
| MES | 23.2653 | 67.4107 |
| R | 0.9818 | 0.96528 |
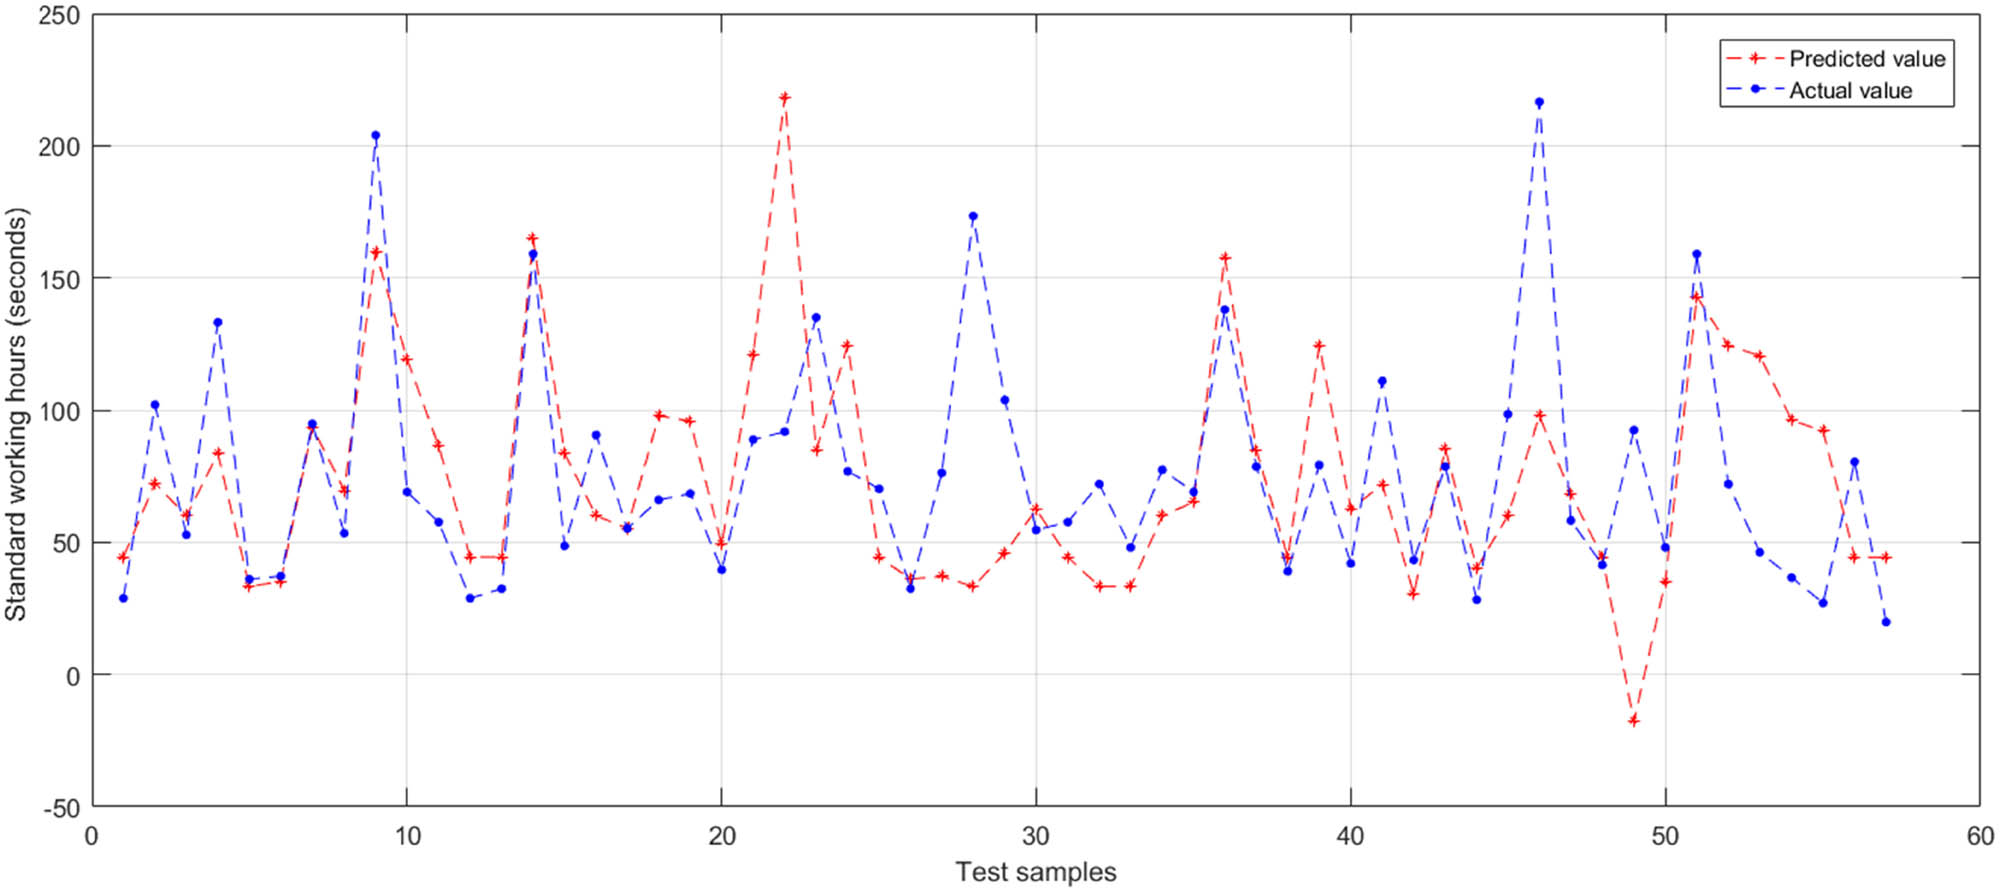
Figure 12 presents a comparative analysis between the actual and predicted values of the testing dataset for the BP neural network. In contrast to Figure 9, there is a greater fluctuation in the predicted data. Table 3 provides a comprehensive assessment of the testing dataset results for both neural network models, encompassing metrics such as maximum relative error, minimum relative error, average relative error, and sample variance. The sample variance serves as a critical indicator of data fluctuation, with diminished values indicative of heightened precision. From Table 3, it is discernible that the IPSO-BP model exhibits a substantially lower sample variance of 98.1663, in contrast to the BP neural network model’s variance of 2000.6402. This underscores the superior predictive accuracy of the IPSO-BP model in forecasting standard sewing time.
Comparisons of actual values and predicted values of the BP test set.
Error analysis of prediction results of BP neural network and PSO-BP neural network models
| Index | IPSO-BP | BP |
|---|---|---|
| Maximum relative error | 0.4057 | 2.4088 |
| Minimum relative error | 0.0165 | 0.0006 |
| Average relative error | 0.0038 | 0.1484 |
| Sample variance | 98.1663 | 2000.6402 |
5 Conclusion
This study conducts an in-depth exploration of the sewing process, focusing on three critical domains: cut piece technology, technological operations, and machinery. It identifies 10 independent variables to assess their influence on standard sewing time by examining cut piece performance complexity, cut piece structural relationship, and job complexity. These variables encompass fabric weight, fabric thickness, fabric density, stitching length, stitching shapes, cut pieces numbers, notch numbers, sewing technologies, sewing machine, and auxiliary accessories.
The sewing standard hours prediction model is an enhanced BP neural network training model structured as 10-12-1. This study leverages the global optimization capability of the PSO algorithm to refine the BP neural network model, mitigating the issue of local minima. Furthermore, the study employs the nonlinear weighting method, known as IPSO, to address the challenge of declining global search energy associated with the linear decrease in w in the PSO standard algorithm.
The model training and prediction experiment results conducted on the sewing hours data from ZS Company, totaling 231 sewing hours, along with its influencing factors, reveal the effectiveness of the IPSO-BP sewing hours prediction model proposed in this study. This model establishes a potential relationship between unmeasurable factors and standard minute value, enabling accurate prediction of standard sewing hours. Furthermore, in comparison to the non-optimized BP neural network prediction model, the IPSO-BP model demonstrates superior convergence speed and accuracy. Moreover, when contrasted with traditional methods such as manual reasoning and table lookup, the IPSO-BP algorithm proves more adept at capturing the nonlinear relationship between working hours and influencing factors. This enhancement is particularly beneficial in forecasting working hours in advance, especially under the multi-variety and small-batch production mode. Consequently, it facilitates tasks such as product pricing and production order arrangement.
With the digital transformation underway in the garment industry, apparel enterprises can leverage the accumulation of big data. By integrating the unique characteristics of their products and refining the proposed prediction model, they can achieve more accurate estimates of the standard minute value required for the sewing process. Moreover, the IPSO-BP sewing time prediction model, functioning as a multi-input single-output neural network training model, is not only suitable for calculating standard sewing hours but also holds relevance for addressing similar multi-input single-output calculation problems in other domains.
-
Funding information: No funding involved.
-
Author contributions: H.S. conceived the original idea, collected and analyzed data, and drafted the manuscript and X.J. conducted the processing.
-
Conflict of interest: Authors state no conflict of interest.
-
Data availability statement: The datasets generated during and/or analyzed during the current study are available from the corresponding author on reasonable request.
References
[1] Xiao, Q., Gao, M., Chen, L., Goh, M. (2023). Multi-variety and small-batch production quality forecasting by novel data-driven grey Weibull model. Engineering Applications of Artificial Intelligence, 125, 106725.10.1016/j.engappai.2023.106725Search in Google Scholar
[2] Liu, J., Lv, Y. (2023). A multi-object genetic algorithm for the assembly line balance optimization in garment flexible job shop scheduling. Intelligent Automation & Soft Computing, 37(2), 2421–2439.10.32604/iasc.2023.040262Search in Google Scholar
[3] Khatun, M. M. (2014). Effect of time and motion study on productivity in garment sector. International Journal of Scientific & Engineering Research, 5, 825–833.Search in Google Scholar
[4] Habibur, R., Prashanta Kumar, R., Rezaul, K., Prodip Kumar, B. (2014). Effective way to estimate the standard minute value (SMV) of a T-Shirt by work study. European Scientific Journal, 10(30), 196–203.Search in Google Scholar
[5] Jadhav, S. S., Sharma, G. S., Daberao, A. M., Gulhane, S. S. (2017). Improving productivity of garment industry with time study. International Journal on Textile Engineering and Processes, 3(Oct), 1–6.Search in Google Scholar
[6] Mondal, P., Jana, P. (2022). Application of predetermined motion and time system in sewing automat to enhance productivity and operator utilization. Research Journal of Textile and Apparel, ahead-of-print. 10.1108/RJTA-08-2022-0092.Search in Google Scholar
[7] He, H.Y., Li, Y. F. (2013). Calculation of theoretical standard time for clothing process based on MODAPTS method. Light Industry Science and Technology, 29(1), 85–86+88.Search in Google Scholar
[8] Liu, D. L. (2018). Research on standard working hours for garment sewing. Light and Textile Industry and Technology, 47(4), 44–46 + 50.Search in Google Scholar
[9] Wu, S. G., Mu, H. (2011). Man-hour calculation based on typical procedures in garment making. Journal of Textile Research, 32(6), 151–154.Search in Google Scholar
[10] Zheng, X. Y. (2014). Prediction method of garment standard working hours based on component working hours. Shandong Textile Science & Technology, 55(4), 21–24.Search in Google Scholar
[11] Ye, N., Yan, Y. X. (2012). Man-hour quota determination method for garment production of multi-variety in small batches. Journal of Textile Research, 33(6), 101–106.Search in Google Scholar
[12] Wang, L., Yang, Y. X., Chen, W. (2016). Prediction of garment standard time based on process similarity. Journal of Textile Research, 37(11), 114–119 + 125.Search in Google Scholar
[13] Yang, X. C., Chen, Y. L. (2016). Labor hour estimation based on the difficulty coefficient of parts processed. Journal of Northeastern University (Natural Science), 37(7), 998–1002.Search in Google Scholar
[14] Wang, H. C., Chen, Y. L., Zhang, S. L. (2015). Method for determining man-hour in mass customization based on error correction coefficient. Computer Engineering and Applications, 51(11), 228–232.Search in Google Scholar
[15] Yang, N., Wang, Y., Zhou, X. H. (2005). Application of case-based reasoning in injection molding for determining manufacturing time quota. Computer Integrated Manufacturing Systems, (2), 275–279.Search in Google Scholar
[16] Zhao, Y. (2015). Research and application on BP neural network algorithm. Presented at the International Industrial Informatics and Computer Engineering Conference (IIICEC 2015), March 2015. 10.2991/IIICEC-15.2015.321.Search in Google Scholar
[17] Lu, Y., Li, Y. P., Liang W. H., Song Q. D., Liu Y. Q., Qin, X. L.(2015) Vegetable price prediction based on PSO-BP neural network. 2015 8th International Conference on Intelligent Computation Technology and Automation (ICICTA) (pp. 1093–1096).10.1109/ICICTA.2015.274Search in Google Scholar
[18] Ismailov, V. E. (2023). A three layer neural network can represent any multivariate function. Journal of Mathematical Analysis and Applications, 523(1), 127096.10.1016/j.jmaa.2023.127096Search in Google Scholar
[19] Chen, L., Jagota, V., Kumar, A. (2023). Research on optimization of scientific research performance management based on BP neural network. International Journal of Systems Assurance Engineering and Management, 14, 489.10.1007/s13198-021-01263-zSearch in Google Scholar
[20] Chandrasekaran, M., Devarasiddappa, D. (2014). Artificial neural network modeling for surface roughness prediction in cylindrical grinding of Al-SiCp metal matrix composites and ANOVA analysis. Advances in Production Engineering & Management, 9(2), 59–70.10.14743/apem2014.2.176Search in Google Scholar
[21] Liu, B., Wang, R., Zhao, G., Guo, X., Wang, Y., Li, J., et al. (2020). Prediction of rock mass parameters in the TBM tunnel based on BP neural network integrated simulated annealing algorithm. Tunnelling and Underground Space Technology, 95, 103103.10.1016/j.tust.2019.103103Search in Google Scholar
[22] Xiao, Z., Mao, B., Zhang, T. (2018). Integrated predicting model for daily passenger volume of rail transit station based on neural network and Markov chain. 2018 IEEE 3rd International Conference on Cloud Computing and Big Data Analysis (ICCCBDA) (pp. 578–583).10.1109/ICCCBDA.2018.8386582Search in Google Scholar
[23] Duan, C., Hao, Q. (2014). Surface roughness prediction of end milling process based on IPSO-LSSVM. Journal of Advanced Mechanical Design, Systems, and Manufacturing, 8(3), 1–12.10.1299/jamdsm.2014jamdsm0024Search in Google Scholar
[24] Su, Z., Cai, Y. (2019). Multi-interceptor target allocation based on improved particle swarm optimization algorithm. In 2019 IEEE 9th Annual International Conference on CYBER Technology in Automation, Control, and Intelligent Systems (CYBER) (pp. 1602–1605).Search in Google Scholar
[25] Deng, G. F., Lin, W. T. (2010). Swarm intelligence for cardinality-constrained portfolio problems. Computational Collective Intelligence (ICCCI 2010) (p. 6423).10.1007/978-3-642-16696-9_44Search in Google Scholar
[26] Su, Z., Cai, Y. (2019). Multi-interceptor target allocation based on improved particle swarm optimization algorithm. In 2019 IEEE 9th Annual International Conference on CYBER Technology in Automation, Control, and Intelligent Systems (CYBER) (pp. 1602–1605).10.1109/CYBER46603.2019.9066723Search in Google Scholar
[27] Wen, C., Xiong, Q., Zhou, X., Li, J., Zhou, J. (2020). Application of improved particle swarm optimization algorithm in the location and capacity determination of distributed generation. In 2020 23rd International Conference on Electrical Machines and Systems (ICEMS) (pp. 483–488).10.23919/ICEMS50442.2020.9291190Search in Google Scholar
[28] Chauhan, P., Deep, K., Pant, M. (2013). Novel inertia weight strategies for particle swarm optimization. Memetic Computing, 5, 229–251.10.1007/s12293-013-0111-9Search in Google Scholar
[29] Abtew, M., Kumari, A., Babu, A., Hong, Y. (2020). Statistical analysis of standard allowed minute on sewing efficiency in apparel industry. Autex Research Journal, 20(4), 359–365.10.2478/aut-2019-0045Search in Google Scholar
[30] Bhardwaj, A. (2022). Lean supply chain management In: Nayak, R. (Ed.). Fashion and Textile Industry, Springer, Singapore.Search in Google Scholar
[31] Li, H., Kong, F., Kong, L., Chen, T. (2023). Evaluating sewing operation complexity and its influence on sewing operation quality. Heliyon, 9(3), 13867.10.1016/j.heliyon.2023.e13867Search in Google Scholar PubMed PubMed Central
[32] Vidal, G. H., Coronado-Hernández, J. R., & Minnaard, C. (2023). Measuring manufacturing system complexity: a literature review. Journal of Intelligent Manufacturing, 34, 2865–2888.10.1007/s10845-022-01974-5Search in Google Scholar
[33] Liu, P., Li, Z. Z. (2012). Task complexity: A review and conceptualization framework. International Journal of Industrial Ergonomics, 42(6), 553–568.10.1016/j.ergon.2012.09.001Search in Google Scholar
[34] Ham, D. H., Park, J., Jung, W. (2012). Model-based identification and use of task complexity factors of human integrated systems. Reliability Engineering & System Safety, 100, 33–47.10.1016/j.ress.2011.12.019Search in Google Scholar
[35] Kong, F. S., Ye, Z. G. (2017). Research on evaluation method framework model of production job operability. Chinese Journal of Mechanical Engineering, 53(4), 198–208.10.3901/JME.2017.04.198Search in Google Scholar
[36] Textile-tutorials. (2017). What is SMV in Apparel Industry and Garments SMV Chart. June 5, 2017. https://textiletutorials.com/smv-apparel-industry-garments-smv-chart/Search in Google Scholar
[37] ISO 4916:1991. (1991). Textiles; seam types; classification and terminology.Search in Google Scholar
[38] Li, J., Ren, H., Li, C. Y., Chen, H. (2022). A novel and efficient salp swarm algorithm for large-scale QoS-aware service composition selection. Computing, 104, 2031–2051.10.1007/s00607-022-01080-7Search in Google Scholar
© 2024 by the authors, published by De Gruyter
This work is licensed under the Creative Commons Attribution 4.0 International License.
Articles in the same Issue
- Characterization of viscoelastic properties of yarn materials: Dynamic mechanical analysis in the transversal direction
- Analysis of omni-channel implementations that are preferred by consumers in clothing sector
- Structural modeling and analysis of three-dimensional cross-linked braided preforms
- An experimental study of mechanical properties and comfortability of knitted imitation woven shirt fabrics
- Technology integration to promote circular economy transformation of the garment industry: a systematic literature review
- Research on T-shirt-style design based on Kansei image using back-propagation neural networks
- Research on She nationality clothing recognition based on color feature fusion with PSO-SVM
- Accuracy prediction of wearable flexible smart gloves
- Preparation and performance of stainless steel fiber/Lyocell fiber-blended weft-knitted fabric
- Development of an emotional response model for hospital gown design using structural equation modeling
- Preparation and properties of stainless steel filament/pure cotton woven fabric
- Facemask comfort enhancement with graphene oxide from recovered carbon waste tyres
- Use of enzymatic processes in the tanning of leather materials
- Optical-related properties and characterization of some textile fibers using near-infrared spectroscopy
- Network modeling of aesthetic effect for Chinese Yue Opera costume simulation images
- Predicting consumers’ garment fit satisfactions by using machine learning
- Non-destructive identification of wool and cashmere fibers based on improved LDA using NIR spectroscopy
- Study on the relationship between structure and moisturizing performance of seamless knitted fabrics of protein fibers for autumn and winter
- Antibacterial and yellowing performances of sports underwear fabric with polyamide/silver ion polyurethane filaments
- Numerical and experimental analysis of ballistic performance in hybrid soft armours composed of para-aramid triaxial and biaxial woven fabrics
- Phonetic smart clothing design based on gender awareness education for preschoolers
- Determination of anthropometric measurements and their application in the development of clothing sizing systems for women in the regions of the Republic of Croatia
- Research on optimal design of pleated cheongsam based on Kano–HOQ–Pugh model
- Numerical investigation of weaving machine heald shaft new design using composite material to improve its performance
- Corrigendum to “Use of enzymatic processes in the tanning of leather materials”
- Shaping of thermal protective properties of basalt fabric-based composites by direct surface modification using magnetron sputtering technique
- Numerical modeling of the heat flow component of the composite developed on the basis of basalt fabric
- Weft insertion guideway design based on high-temperature superconducting levitation
- Ultrasonic-assisted alkali hydrolysis of polyethylene terephthalate fabric and its effect on the microstructure and dyeing properties of fibers
- Comparative study on physical properties of bio-based PA56 fibers and wearability of their fabrics
- Investigation of the bias tape roll change time efficiency in garment factories
- Analysis of foot 3D scans of boys from Polish population
- Optimization of garment sewing operation standard minute value prediction using an IPSO-BP neural network
- Influence of repeated switching of current through contacts made of electroconductive fabrics on their resistance
- Numerical calculation of air permeability of warp-knitted jacquard spacer shoe-upper materials based on CFD
- Compact Spinning with Different Fibre Types: An Experimental Investigation on Yarn Properties in the Condensing Zone with 3D-Printed Guiding Device
- Modeling of virtual clothing and its contact with the human body
- Advances in personalized modelling and virtual display of ethnic clothing for intelligent customization
- Investigation of weave influence on flame retardancy of jute fabrics
- Balloonless spinning spindle head shape optimisation
- Research on 3D simulation design and dynamic virtual display of clothing flexible body
- Turkish textile and clothing SMEs: Importance of organizational learning, digitalization, and internationalization
- Corrigendum To: “Washing characterization of compression socks”
- Study on the promotion multiple of blood flow velocity on human epidermal microcirculation of volcanic rock polymer fiber seamless knitted fabric
- Bending properties and numerical analysis of nonorthogonal woven composites
- Bringing the queen mother of the west to life: Digital reconstruction and analysis of Taoist Celestial Beings Worshiping mural’s apparel
- Modeling process for full forming sports underwear
- Retraction of: Ionic crosslinking of cotton
- An observational study of female body shape characteristics in multiracial Malaysia
- Study on theoretical model and actual deformation of weft-knitted transfer loop based on particle constraint
- Design and 3D simulation of weft-knitted jacquard plush fabrics
- An overview of technological challenges in implementing the digital product passport in the textile and clothing industry
- Understanding and addressing the water footprint in the textile sector: A review
- Determinants of location changes in the clothing industry in Poland
- Influence of cam profile errors in a modulator on the dynamic response of the heald frame
- Quantitative analysis of wool and cashmere fiber mixtures using NIR spectroscopy
- 3D simulation of double-needle bar warp-knitted clustered pile fabrics on DFS
- Finite element analysis of heat transfer behavior in glass fiber/metal composite materials under constant heat load
- Price estimation and visual evaluation of actual white fabrics used for dress shirts and their photographic images
- Effect of gluing garment materials with adhesive inserts on their multidirectional drape and bending rigidity
- Optimization analysis of carrier-track collision in braiding process
- Numerical and experimental analysis of the ballistic performance of soft bulletproof vests for women
- The antimicrobial potential of plant-based natural dyes for textile dyeing: A systematic review using prisma
- Influence of sewing parameters on the skin–fabric friction
- Validation by experimental study the relationship between fabric tensile strength and weave structures
- Optimization of fabric’s tensile strength and bagging deformation using surface response and finite element in stenter machine
- Analysis of lean manufacturing waste in the process flow of ready-to-wear garment production in Nigeria
- An optimization study on the sol–gel process to obtain multifunctional denim fabrics
- Drape test of fully formed knitted flared skirts based on 3D-printed human body posture
- Supplier selection models using fuzzy hybrid methods in the clothing textile industry