Price estimation and visual evaluation of actual white fabrics used for dress shirts and their photographic images
-
Tomoya Maruyama
 and
Masayuki Takatera
and
Masayuki Takatera

Abstract
Consumers recognize the appearance and texture of fabric through viewing photographic images on E-commerce. However, the relationship between evaluations of the actual fabric and its image remains unclear. To understand the evaluation difference between actual fabric and its image, we investigated the relationship of visual evaluations including the price evaluation between actual white fabrics used for dress shirts and their photographic images concerning the online purchase of items presented by their photos. Participants evaluated the impressions of 24 white fabrics (actual fabrics and their images), comparing them with a standard white fabric. Participants also estimated the prices of shirts hypothetically made from different fabrics. We compared the difference between the results for actual fabrics and images. We also carried out a principal component analysis of those impressions and examined the relationship among principal component analysis results, weave structure, and fabric materials and price estimation. In a comparison of actual fabric and image evaluations, the impression of glossiness and brightness differed, with the actual fabrics being rated significantly higher in terms of glossiness and brightness. These differences are due to the difference in media (i.e., direct viewing versus screen display), although the visual environment of the lighting and displays may have had an effect. In principal component analysis, the first principal components were Delicateness and Glossiness for both actual fabrics and their images. The second principal components were Lightness and Coolness for the images of fabrics and Lightness, Coolness, and Softness for the actual fabrics. Fabrics evaluated highly in the first principal component had high price estimations. Thus, it is clear that Delicateness and Glossiness affected the price evaluation for both actual white fabrics and their images. Fabrics with a high value of Delicateness and Glossiness were a poplin made of at least 95% cotton. In contrast, fabrics containing linen and having a small repeating dobby pattern with roughness were evaluated as having low Delicateness and Glossiness and were assessed at a lower price. Additionally, even in the case of blended fabrics such as a cotton–polyester fabric, the expected price was high for diagonal patterns such as stripes and checks. These results will be helpful in the procurement of fabrics with which to make clothing and in the marketing of clothing for E-commerce.
1 Introduction
When evaluating a garment, the visual appearance and tactile hand of the fabric are the main criteria determining the consumer’s purchasing decision. These criteria mainly relate to the texture of the fabric, which is affected by the combination of yarns, weave structure, finishing, and materials. Many studies have investigated the tactile hand of textiles, considering the physical properties of the fabric. Since the 1930s, various methods of measuring the physical properties of fabrics have been proposed, and numerous types of fabric have been investigated in terms of measured properties [1–3]. Additionally, the relationship between the physical properties and sensory evaluation of the fabric hand has been investigated. Kawabata [2] investigated the relationship between the physical properties and hand of wool fabrics and suggested multiple regression equations for the prediction of the hand using the physical properties. Sakaguchi et al. [4] investigated the objective measurement of properties of knitted fabrics used for underwear. Kawamura et al. [5] investigated the characteristics of denim fabrics obtained from jeans using the relationship between the physical properties and hand of fabrics. Kim et al. [6] investigated the relationship between the hand and price evaluation of shirt fabrics.
Although the tactile hand is important in evaluating fabrics and garments, reports have shown that the visual effect is stronger than the tactile effect [7–9]. Thus, various studies have investigated the fabric factors that affect appearance. Lee and Sato [10] performed a psychological factor derivation from visual perception using fabrics to elucidate the mechanism of texture proximity. They reported that a voluminous and warm feeling, glossy feeling, and fine feeling were the three most important psychological factors. Kanai et al. [7] identified luster, dye color depth, and surface roughness sensations as the principal factors of fabric aesthetics. Additionally, Maru et al. [11] suggested an index based on the reflection intensity distribution with which to evaluate the principal factors of fabric aesthetics. Maru et al. [12] investigated the visual and tactile factors that affect the texture evaluation of a fabric, presenting a relationship between the physical and optical characteristics of a fabric and texture. Lai [13–15] investigated the relationship and established regression equations between fabric structures, color properties, and fabric texture. das Neves et al. [16] compared the perceptual patterns of fabrics. They showed no substantial differences between the visual and tactile responses. Xue et al. [17] showed that the tactile sensation of most fabrics could be well recognized visually. In addition, they predicted specific tactile characteristics from numerical scores of visual features using a fuzzy neural model. Maruyama et al. [18] investigated the relationship between the impression and price evaluation of actual white fabrics used for dress shirts. Although many studies have investigated the visual and aesthetic evaluations of fabrics, they were carried out using actual fabrics.
E-commerce has expanded in recent years, and many consumers recognize the appearance and texture of a fabric through viewing photographic images [19]. However, the relationship between evaluations of the actual fabric and its image remains unclear. Kodžoman et al. [20] investigated visual texture perception of various fabrics including preferences. Although they showed visual texture perception of various fabrics, consumers sometimes look for one clothing item with similar fabric types. Clothing appearance, among various garment items, is one of the most critical factors that affects the purchasing decisions and preferences of consumers [21]. In particular, the white fabrics of dress shirts are manufactured using different materials and woven patterns, and they have different textures and appearances [22]. However, recognizing differences in appearances and textures from images is not easy. It is thus necessary to clarify the relationship between the visual evaluation of actual white fabrics used for dress shirts and their images. Moreover, despite widely ranging research on the relationship between the fabric hand and texture evaluation, the relationship between the visual assessment of the texture and the price evaluation remains unclear. Chang and Wildt [23] investigated the relationship between price, product information, and purchase intention. They described that marketers should know consumers’ internal price standards. The relationship between price and clothing quality was investigated [24,25]. However, the effect of the fabric’s visual impression on the price is not apparent. Thus, it is necessary to clarify the characteristics of expensively estimated fabric, and vice versa, depending on how it is presented.
The present study investigated the relationship between the visual evaluation of actual white fabrics used for shirts and that of their photographic images, including the price evaluation by conducting a sensory test concerning the online purchase of items presented by their photos. The relationship among different visual assessments was studied, including the hypothetical estimation of the dress shirt price made of a specified fabric, as well as the structural properties and materials of the fabric. Clarification of the relationship between the price and a visual evaluation made by consumers will benefit the procurement of fabrics used to make clothing and the marketing of clothing for e-commerce.
2 Experiment
2.1 Material
We collected 90 fabrics used to make dress shirts during the period 2016–2018 and selected 25 fabrics having a white color. Table 1 gives the specifics of the samples. The materials were cotton, polyester, and linen, and the structures were poplin, dobby, oxford, and twill which are well used for dress shirts. Dyeing is all bleaching except for No. 13 (Post dyeing). Anti-wrinkle processing methods (pre-cure method, moist cure, liquid ammonia treatment, and post-cure) were applied to the fabrics. Functional processing methods (water absorption and quick drying, stain resistance, deodorant) were added to the fabric. Colorimetry was performed ten times randomly on each fabric with a spectrophotometer (KONICA MINOLTA, CM-2600d/2500d) set to a light source of D65 and an observation field of view 10° (Japanese Industrial Standards, JIS Z 8722 Condition C). The calculated average values of brightness and chromaticity of the samples are shown in Table 2. Whiteness (CIE) and Tint (CIE) were also calculated using equations (1) and (2) with the measured brightness and chromaticity of the samples [26].
Fabric samples
| No. | Material | Thread | Density | Weaving | Dyeing | Processing |
|---|---|---|---|---|---|---|
| Warp × Weft (tex) | Warp × Weft (thread/in) | |||||
| 13 | C100 | 14.8 × 14.8 | 126 × 86 | D | P | ML |
| 75 | 11.8 × 11.8 | 150 × 90 | T | W | R | |
| 60 | P | R | ||||
| 78 | 158 × 82 | ML | ||||
| 73 | 7.4 × 7.4 | 190 × 90 | L | |||
| 76 | 8.4 × 8.4 | R | ||||
| 77 | 9.8 × 9.8 | 180 × 110 | P | |||
| 62 | 14.8 × 14.8 | 130 × 80 | PLS | |||
| 55 | C95XL5 | 9.8 × 11.8 | 194 × 90 | P | PL | |
| 69 | C65P35 | 11.8 × 8.3 | 140 × 100 | D | PA | |
| 22 | 13.1 × 13.1 | 130 × 80 | P | |||
| 25 | 160 × 62 | O | P | |||
| 52 | P60C40 | 8.3 × 14.8 | 130 × 40 + 40 | D | PAZ | |
| 68 | 11.8 × 11.8 | 148 × 80 | P | PDS | ||
| 80 | 9.8 × 28.1 | 130 × 70 | R | |||
| 21 | C50P50 | 13.1 × 13.1 | 130 × 70 | D | PA | |
| 3 | 130 × 80 | P | ||||
| 30 | P | |||||
| 36 | 140 × 90 | PS | ||||
| 53 | 130 × 80 | PAS | ||||
| 38 | T | PH | ||||
| 61 | 11.8 × 13.1 | 144 × 70 | P | P | ||
| 57 | P100 | 19.7 × 19.7 | 98 × 80 | A | ||
| 71 | L100 | 28.1 × 28.1 | 60 × 48 | R | ||
| 79 | L |
・Material: C: Cotton; P: Polyester; L: Linen; XL: Dow XLA fiber (an elastic filament fiber).
・Weaving: P: Poplin; D: Dobby; O: Oxford; T: Twill.
・Dyeing: W: Bleaching; P: Post dyeing.
・Processing: P: Pre-cure method; M: Moist cure; L: Liquid ammonia treatment; R: Post-cure; A: Water absorption and quick drying; S: Stain resistance; D: Deodorant.
Fabric brightness and chromaticity
| No. | L* | a* | b* | Whiteness (CIE) | Tint (CIE) | |||
|---|---|---|---|---|---|---|---|---|
| Average | SD | Average | SD | Average | SD | |||
| 3 | 82.36 | 0.33 | 4.60 | 0.04 | −13.64 | 0.09 | 125.24 | −2.08 |
| 13 | 83.79 | 0.26 | 2.77 | 0.04 | −10.26 | 0.21 | 111.21 | −0.48 |
| 21 | 82.17 | 0.25 | 4.60 | 0.07 | −13.35 | 0.28 | 123.43 | −2.20 |
| 22 | 81.17 | 0.30 | 4.15 | 0.03 | −11.96 | 0.14 | 114.55 | −2.01 |
| 25 | 81.86 | 0.36 | 2.83 | 0.04 | −7.33 | 0.09 | 92.65 | −1.69 |
| 30 | 82.36 | 0.25 | 4.74 | 0.04 | −14.24 | 0.11 | 128.23 | −2.08 |
| 36 | 83.05 | 0.19 | 4.30 | 0.03 | −13.30 | 0.08 | 124.83 | −1.74 |
| 38 | 81.90 | 0.33 | 2.99 | 0.07 | −9.09 | 0.16 | 101.56 | −1.27 |
| 52 | 85.20 | 0.20 | 2.71 | 0.03 | −9.63 | 0.07 | 110.95 | −0.62 |
| 53 | 83.30 | 0.33 | 4.94 | 0.04 | −14.46 | 0.09 | 131.05 | −2.31 |
| 55 | 84.95 | 0.35 | 3.69 | 0.02 | −14.40 | 0.08 | 133.78 | −0.36 |
| 57 | 83.63 | 0.18 | 3.26 | 0.01 | −12.60 | 0.05 | 122.46 | −0.36 |
| 60 | 83.95 | 0.15 | 2.74 | 0.03 | −9.72 | 0.15 | 108.86 | −0.64 |
| 61 | 81.86 | 0.25 | 5.12 | 0.05 | −15.62 | 0.07 | 134.24 | −2.15 |
| 62 | 84.64 | 0.21 | 4.02 | 0.02 | −14.22 | 0.07 | 132.33 | −0.95 |
| 68 | 83.23 | 0.16 | 5.20 | 0.04 | −15.51 | 0.07 | 136.14 | −2.32 |
| 69 | 83.31 | 0.13 | 3.95 | 0.02 | −10.61 | 0.07 | 111.98 | −2.21 |
| 71 | 80.66 | 0.98 | 3.98 | 0.07 | −15.12 | 0.29 | 129.56 | −0.54 |
| 73 | 81.00 | 0.22 | 3.47 | 0.02 | −13.66 | 0.09 | 122.80 | −0.29 |
| 75 | 86.35 | 0.19 | 3.80 | 0.01 | −14.51 | 0.05 | 136.88 | −0.49 |
| 76 | 83.27 | 0.30 | 3.56 | 0.03 | −13.64 | 0.07 | 126.93 | −0.44 |
| 77 | 84.98 | 0.13 | 3.84 | 0.02 | −14.25 | 0.09 | 133.10 | −0.65 |
| 78 | 83.84 | 0.12 | 4.20 | 0.01 | −15.12 | 0.04 | 135.30 | −0.89 |
| 79 | 81.38 | 0.76 | 3.51 | 0.06 | −14.87 | 0.22 | 129.60 | 0.10 |
| 80 | 82.28 | 0.41 | 3.22 | 0.03 | −12.49 | 0.15 | 119.34 | −0.34 |
2.2 Methods
Sensory evaluations of the 25 actual fabrics and their photographic images were performed. One fabric (sample 60, plain) was used as the standard for comparison (having a value of zero on all evaluation scales). Sample 60 was a white plain fabric (cotton 100%, poplin, 11.8 × 11.8 tex) with the same structure and similar yarn count to the sample selected by the shirt fabric expert [6] as a common fabric among the 90 fabrics. The other 24 fabrics were evaluated by comparing with the standard in accordance with a semantic differential method on a five-point scale ranging from −2 to +2. Eleven evaluation items were selected and listed in Table 3 based on the results of previous experiments [11,13,27]. In the evaluation of the shirt price, the shirt price of the standard fabric was set to 3,000 yen (approximately 26 USD, 1 USD = 116.6 JPY). The participants were asked to evaluate the price of shirts hypothetically made with the evaluated fabric.
Evaluation items
| Evaluation item | ||||
|---|---|---|---|---|
| −2 | −1 | 0 | +1 | +2 |
| Very | Somewhat | Neither | Somewhat | Very |
| Hard–Soft | ||||
| Rough–Smooth | ||||
| Thin–Thick | ||||
| Light–Heavy | ||||
| Cool–Warm | ||||
| Matt–Glossy | ||||
| Dark–Bright | ||||
| Coarse–Delicate | ||||
| Not beautiful–Beautiful | ||||
| Casual–Formal | ||||
| Vulgar–Elegant | ||||
In the evaluation of actual fabrics, samples having dimensions of 20 cm × 20 cm were shown to the participants, as presented in Figure 1. The experiment was conducted in a light booth (Spectra Light QC, X-Rite. Inc., Michigan, United States) under a D65 standard light (illuminance of 1325 lx) within a dark room (JIS Z 8723/ISO 3668). The sample was placed on a black sloping stand so that the angle of incidence of the light source was 60° as shown in Figure 1(b) (modified 45°–60° of JIS L 0801 to see more clearly the unevenness of the fabric). The warp direction of the fabric was set perpendicular to the horizontal plane of the table [12].

Experimental environment with a light chamber (a) and angle of the light source relative to the sample surface (Modified JIS L 0801) (b).
Photographs of the fabrics were taken using a single-lens reflex camera (Nikon, D750, 24.31 million effective pixels, camera distance from the sample of 2 m, F value of 16, focal length of 85 mm, and shutter speed of 1/100 s). The images were displayed on laptop computers having screens of various sizes using a presentation program (PowerPoint, Microsoft Corporation), as shown in Figure 2.

Evaluation samples in the image evaluation (left: standard, right: sample 3).
The participants were 20 (12 men and eight women) university students for evaluations of the actual fabrics and 15 (eight men and seven women) university students for evaluations of their photographic images. Some evaluators evaluated both, and the photographs were first evaluated.
The average value of each evaluation item was calculated from the evaluation scores. T-tests were carried out to compare the evaluation results for actual fabrics and their images. We conducted an F-test to compare the variances of two results before the t-test. After confirming the variances, we performed a t-test for samples of equal variances and Welch’s unequal variances t-test for samples of unequal variances [28]. A principal component analysis was conducted using the average values to investigate the appearance characteristics of the white fabrics used for dress shirts, and then, the coefficients of correlation between the principal loads were calculated with evaluation of the prices to investigate the relationships.
3 Results and discussion
3.1 Comparison of evaluations between actual fabrics and their images
Figure 3 presents the average value of each evaluation item for actual fabrics and their images, whereas Figure 4 compares the average estimated price between actual fabrics and their images. Samples 71 and 79 (100% linen) have large negative scores for the Rough–Smooth, Thin–Thick, Light–Heavy, Cool–Warm, and Matte–Glossy items and negative scores for the Coarse–Delicate, Not beautiful–Beautiful, Formal–Casual, and Vulgar–Elegant items. Additionally, the average estimated price is low for these samples. The 100% linen fabrics give the impression of being the softest fabrics.


Comparison of average evaluations between actual fabrics and their images: (a) Hard–soft, (b) Rough–Smooth, (c) Thin–Thick, (d) Light–Heavy, (e) Cool–Warm, (f) Matte–Glossy, (g) Dark–Bright, (h) Coarse–Delicate, (i) Not beautiful–Beautiful, (j) Casual–Formal, and (k) Vulgar–Elegant.
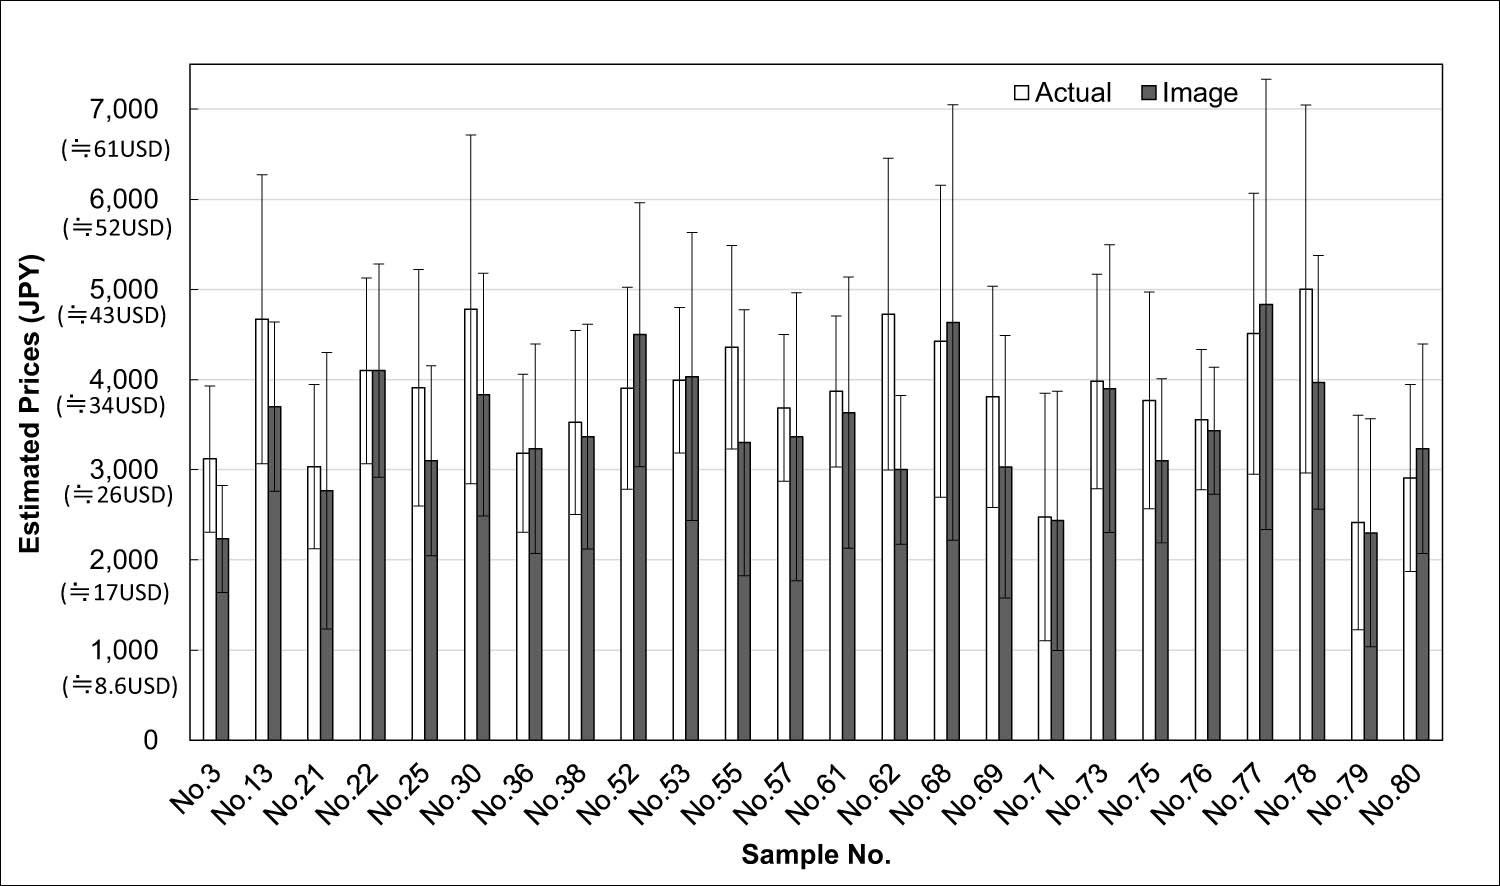
Comparison of average estimated prices of shirts made of the actual fabrics and their images.
In terms of the Coarse–Delicate item, sample 36 is evaluated as being the roughest in the evaluation of the actual fabric, and there are large differences between evaluations of the actual fabrics and their images. For the Matte–Glossy item, the average values of all actual fabric (except 36, 71, and 80) are higher than the ones for the image. The average values of the Dark–Bright item are higher for the actual fabric than for the image. Estimated shirt prices are mostly higher for the actual fabric than for the image.
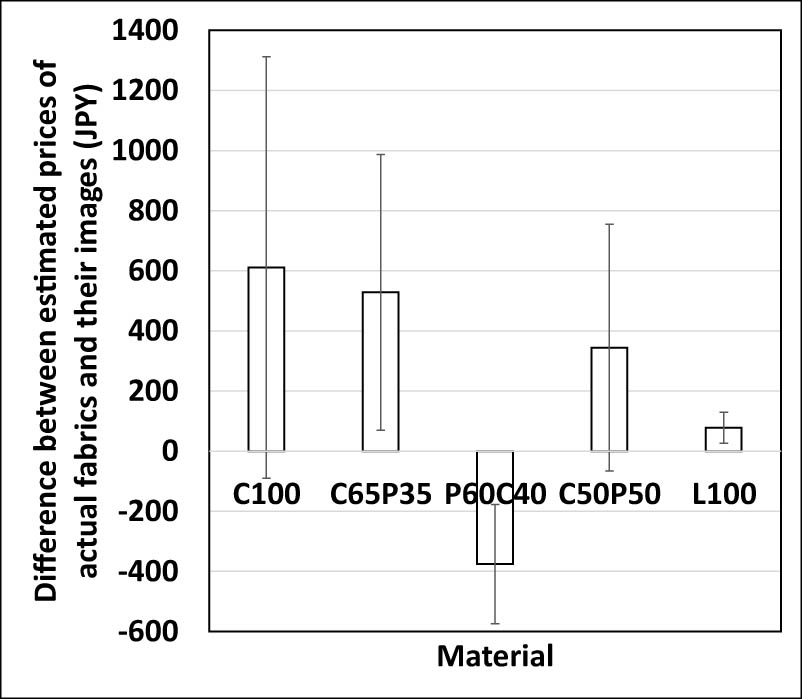
Figure 5 shows the effect of materials on the differences in evaluation average between actual fabrics and their images. When the difference is positive, it means the actual fabric is softer, smother, thicker, heavier, warmer, glossier, brighter, more delicate, more beautiful, more casual, and more elegant. The negative one means the opposites of the adjective pairs. Zero one means no differences. For materials, the differences of cotton 100% were relatively smaller than other materials except for Matte–Glossy. The differences between C65P35 and C50P50 showed similar results which were relatively higher than those of other materials. The difference of P60C40 was relatively small, but some items (rough–smooth, course–delicate, and formal–casual) showed minus values, meaning the image showed higher values than the actual ones. For linen 100%, hard–soft showed huge differences. The higher values of the fabric images than ones of the actual fabric will have a positive effect on e-commerce. However, when we consider e-commerce, the difference could cause consumers’ dissatisfaction. Thus, the differences need to be considered in e-commerce. Figure 6 shows the difference between estimated prices of actual fabric and their images depending on the materials. The price differences of C100 were the highest which means images estimated cheaply. The price differences of P60C40 was minus, which means the image’s estimated prices are higher than those of actual fabrics. Thus, evaluation items (rough–smooth, course–delicate, and formal–casual) could affect the price estimation.

The effect of materials on the difference of evaluation average between actual fabrics and their images.

Relationship between fabric material and the difference between estimated prices of actual fabrics and their images.
Figure 7 shows the effect of structure on the differences in evaluation average between actual fabrics and their images. Dobby showed relatively higher differences compared to other structures. Regardless of structures, matte–glossy and dark–bright showed larger differences. Thus, it was considered that it is difficult to show the glossiness and brightness of white fabric. Figure 8 shows the difference between estimated prices of actual fabric and their images depending on structure. Oxford showed larger price differences. However, it is only one sample, so it is difficult to discuss the relation. Except for the Oxford, there were no estimated price differences among the structures.
The effect of structures on the difference of evaluation average between actual fabrics and their images.

Relationship between fabric structure and the difference between estimated prices of actual fabrics and their images.
T-tests were conducted to compare the actual fabric and image evaluations. There are significant differences of a p-value less than 0.05 for the Matte–Glossy item and a p-value less than 0.01 for the Dark–Bright item. It means there are differences between actual fabric and image evaluations for Matte–Glossy and Dark–Bright. Actual fabrics are highly evaluated in terms of glossiness and brightness compared to their images. Correlation analysis of the Matte–Glossy and Dark–Bright items reveals positive correlations as shown in Figures 9 and 10. It means there were differences between the average evaluated values but the linear relationships were observed. Although the evaluations show strong positive correlations, the average impressions of glossiness and brightness differ between the actual fabric and image, in that the actual fabrics are rated higher in terms of glossiness and brightness. These differences are the result of the difference in media (i.e., direct viewing versus image display), although the visual environment of lighting and displays could also have had an effect.
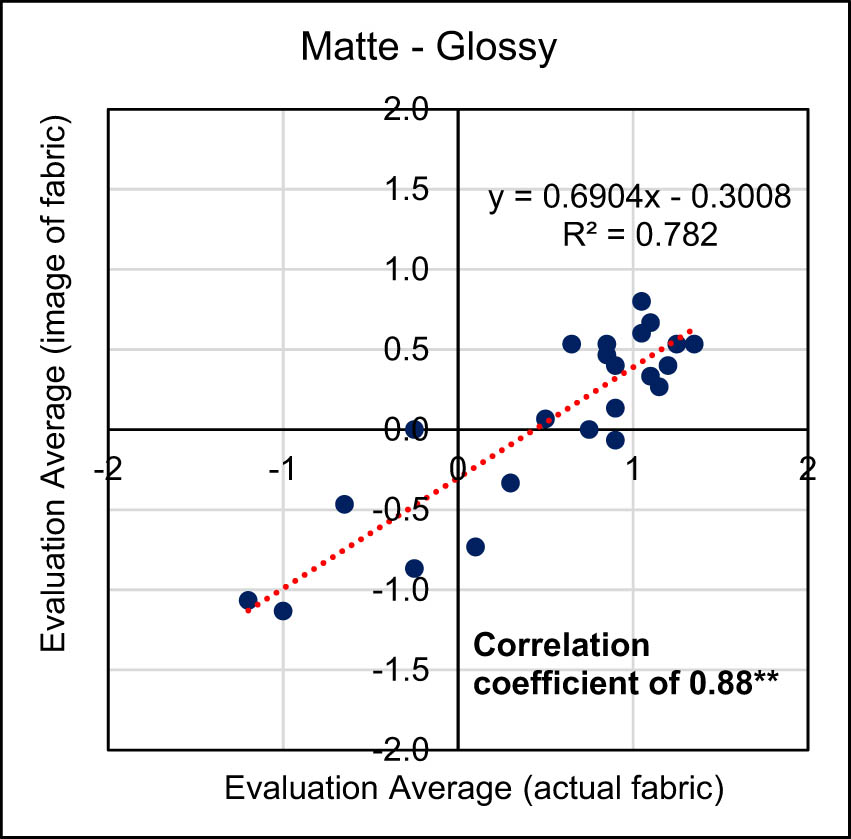
Correlation of the Matte–Glossy item for actual fabrics and their images (**p-value <0.01, test of no correlation).

Correlation of the Dark–Bright item for actual fabrics and their images (**p-value <0.01, test of no correlation).
Table 4 shows the correlation between “the difference between estimated prices of actual fabrics and their images” and “the difference between estimation average of actual fabrics and their images.” Rough–Smooth showed the highest strong correlation coefficient, 0.66 (p < 0.01). Matte–Glossy and Formal–Casual showed the second highest correlation coefficient, 0.59 (p < 0.01). Coarse–Delicate showed the fourth highest correlation coefficient, 0.54 (p < 0.01). Thus, when the difference in estimation values between the actual fabric and the image fabric for Rough–Smooth, Matte–Glossy, Formal–Casual, and Coarse–Delicate is small, the difference in estimated prices is also considered to be small.
Correlation between “the difference between estimated prices of actual fabrics and their images” and “the difference between evaluation average of actual fabrics and their images” (**p-value <0.01, *p-value <0.05)
| Evaluation item | Correlation coefficient |
|---|---|
| Hard–Soft | 0.03 |
| Rough–Smooth | 0.66** |
| Thin–Thick | 0.16 |
| Light–Heavy | 0.24 |
| Cool–Warm | 0.31 |
| Matte–Glossy | 0.59** |
| Dark–Bright | 0.36 |
| Coarse–Delicate | 0.54** |
| Not beautiful–Beautiful | 0.52** |
| Formal–Casual | 0.59** |
| Vulgar–Elegant | 0.48* |
Figure 11 shows the correlation between the average value of dark–bright for actual and measured brightness L* of actual fabric. The correlation coefficient was 0.6, indicating a strong positive correlation. Therefore, it was found that the brightness evaluation of the fabric was related to the value of brightness L*. However, it was not directly related to the price estimation. Figure 12 shows the relationship between estimated prices and Whiteness. There was no clear relationship. There was no clear relationship between the color features measured (such as a*, b*, and Whiteness) in this study and the estimated prices. Other physical properties or texture properties would be necessary to understand the characteristics of fabric texture related to the prices.

Correlation between L* and the average value of Dark-Bright for actual fabrics.

Correlation between Whiteness and the estimated prices for actual fabrics and their images.
3.2 Comparison of principal components between actual fabrics and their images
The calculated average values of each evaluation item were used in the principal component analysis. The 100% linen fabrics (samples 71 and 79) were excluded because they had the largest negative values for most sensory evaluation items, which caused difficulty in observing the differences among the other fabrics. Tables 5 and 6 show descriptive statistics of PCs for the actual fabrics and their images. Figures 13 and 14 show component loadings of the first and second principal components for the actual fabrics and their images. The first and second principal components had a cumulative contribution rate exceeding 88%. In the case of the images, the Coarse–Delicate, Not beautiful–Beautiful, Vulgar–Elegant, Matte–Glossy, Casual–Formal, Rough–Smooth, and Dark–Bright items were adopted as the first principal components, and the Cool–Warm, Light–Heavy, and Thin–Thick items were adopted as the second principal components. In the case of actual fabrics, the Vulgar–Elegant, Not beautiful–Beautiful, Coarse–Delicate, Matte–Glossy, Casual–Formal, Dark–Bright, and Rough–Smooth items were adopted as the first principal components, and the Hard–Soft, Cool–Warm, Light–Heavy, and Thin–Thick items were adopted as the second principal components. The first principal component was named Delicateness and Glossiness for both actual fabrics and their images because of the strong relationship between delicate, beautiful, elegant, glossy, formal, smooth, and brightness attributes. The second principal component was named Lightness and Coolness for the images of fabrics and Lightness, Coolness, and Softness for the actual fabrics. Hard–soft is the fourth in the second principal loading, and although the absolute value of loading is not small, it was not selected as a principal component. It is thought this was an evaluation based on appearance, and hard-softness was difficult to estimate. In the results with plain fabric with various materials by Lee and Sato [10], the Matte–Glossy was extracted as the third principal component. However, the Matte–Glossy was extracted as the first principal component in this study regardless of the images or actual fabrics. This is due to the fabric type for shirt items, which are different from their fabrics (including wool and silk) for various items.
Descriptive statistics of PCs for images of fabrics
| Principal component | Eigenvalue | Contribution rate (%) | Cumulative contribution rate (%) |
|---|---|---|---|
| 1 | 7.097 | 64.52 | 64.52 |
| 2 | 1.795 | 16.32 | 80.83 |
| 3 | 0.995 | 9.05 | 89.88 |
| 4 | 0.444 | 4.03 | 93.91 |
| 5 | 0.191 | 1.73 | 95.64 |
| 6 | 0.166 | 1.51 | 97.15 |
| 7 | 0.139 | 1.27 | 98.42 |
| 8 | 0.090 | 0.82 | 99.23 |
| 9 | 0.040 | 0.36 | 99.59 |
| 10 | 0.028 | 0.25 | 99.85 |
| 11 | 0.017 | 0.15 | 100.00 |
Descriptive statistics of PCs for actual fabrics
| Principal component | Eigenvalue | Contribution rate (%) | Cumulative contribution rate (%) |
|---|---|---|---|
| 1 | 7.167 | 65.16 | 65.16 |
| 2 | 2.518 | 22.89 | 88.04 |
| 3 | 0.456 | 4.14 | 92.19 |
| 4 | 0.297 | 2.70 | 94.88 |
| 5 | 0.172 | 1.56 | 96.44 |
| 6 | 0.142 | 1.29 | 97.73 |
| 7 | 0.094 | 0.85 | 98.59 |
| 8 | 0.067 | 0.61 | 99.20 |
| 9 | 0.045 | 0.40 | 99.60 |
| 10 | 0.026 | 0.23 | 99.83 |
| 11 | 0.018 | 0.17 | 100.00 |

Component loadings for images of fabrics: (a) first principal component and (b) second principal component.

Component loadings for actual fabrics: (a) first principal component and (b) second principal component.
3.3 Relationships between the fabric properties and principal component analysis results for actual fabrics and their images
Figure 15 shows plots of the first and second principal component scores for actual fabrics and their images. Fabrics were grouped by the estimated price of the shirt. The fabric with higher Delicateness and Glossiness was evaluated to be higher in the estimated price for both actual fabrics and their images. The fabrics with the lowest values of Delicateness and Glossiness were samples 3, 21, 36, 38, and 80 for both the actual fabrics and their images. Those materials are cotton 50%, polyester 50% (3, 21, 36, and 38), cotton 60%, and polyester 40% (80).

Sample plot of the first and second principal components grouped by estimated price: (a) Images of fabrics and (b) actual fabrics.
Figure 16 shows the grouping by material. Fabrics of 100% cotton were evaluated as having higher values of Delicateness and Glossiness. Figure 17 shows the grouping by weave. Poplin was evaluated as being high in Delicateness and Glossiness. A comparison of Figures 16 and 17 shows that poplin fabrics made from 100% cotton were evaluated as having high Delicateness and Glossiness; these fabrics were also evaluated as being expensive as shown in Figure 15.

Sample plot of the first and second principal components grouped by material: (a) Images of fabrics and (b) actual fabrics.

Sample plot of the first and second principal components grouped by weave structure: (a) Images of fabrics and (b) actual fabrics.
There was no clear relationship between the evaluation results of fabrics and processing methods. The processing was applied to the fabrics for adding functional effects such as anti-wrinkles or deodorant rather than color changes. Thus, it was considered that the visual evaluation was not affected by the processing.
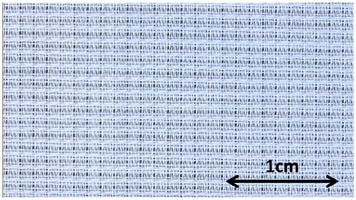
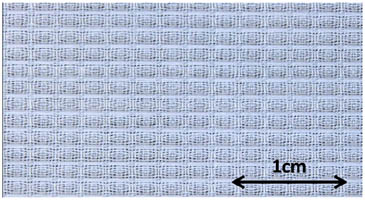
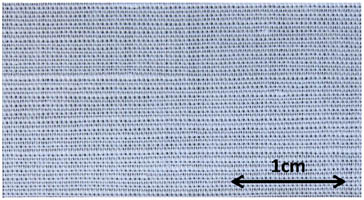
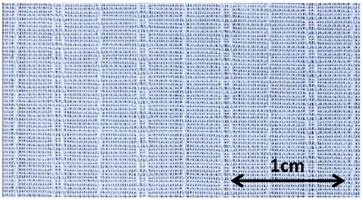
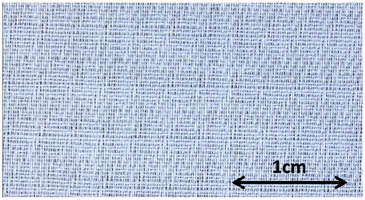
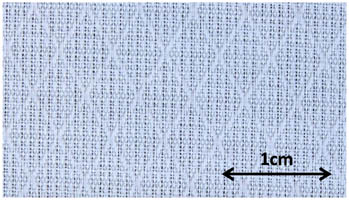
Figure 18 shows the correlation between the first principal component scores and the average expected price. Tables 7 and 8 give details of samples with higher and lower estimated prices. The coefficient of correlation between the value of Delicateness and Glossiness and the average evaluated price was 0.9, indicating a strong positive correlation seen in Figure 18, and most fabrics with a higher value of Delicateness and Glossiness were made from at least 95% cotton and had a poplin weave. In addition, fabrics with lower Delicateness and Glossiness values, namely samples 3, 21, and 36, were cotton–polyester blended fabrics with uneven surfaces; sample 80 was a fabric made of 60% cotton and 40% linen. Table 7 reveals that cotton–polyester blended fabrics and linen mixed fabrics were evaluated as having lower Delicateness and Glossiness values and low prices. These fabrics have uneven surfaces and rib patterns. However, cotton–polyester blended fabrics with diagonal patterns such as stripes and checks are valued more highly, as shown in Table 8. In other words, a cotton–polyester blended fabric may be valued more highly if the fabric has a diagonal pattern such as stripes and checks rather than an uneven surface or rib pattern.

Correlation between first principal component scores and the average expected price.
Samples with lower estimated prices
| Sample no. | 3 | 21 | 36 | 80 |
|---|---|---|---|---|
| Surface picture |
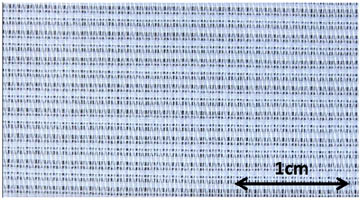 |
 |
 |
 |
| Material | C50P50 | C50P50 | C50P50 | C60L 40 |
| Weaving | Dobby | Dobby | Dobby | Dobby |
| First principal component score | −4 | −4.6 | −4.8 | −5.9 |
| Average estimated price | 3,120 JPY (26.8 USD) | 3,035 JPY (26.0 USD) | 3,185 JPY (27.3 USD) | 2,910 JPY (25.0 USD) |
Samples with higher estimated prices
| Sample no. | 22 | 30 | 52 | 53 |
|---|---|---|---|---|
| Surface picture |
 |
 |
 |
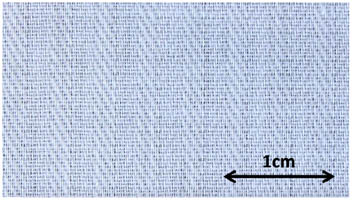 |
| Material | P65C35 | C50P50 | P60C40 | C50P50 |
| Weaving | Dobby | Dobby | Dobby | Dobby |
| First principal component score | 0.4 | 2.5 | −0.2 | 0.6 |
| Average estimated price | 4,100 JPY (35.2 USD) | 4,780 JPY (41.0 USD) | 3,905 JPY (33.5 USD) | 3,995 JPY (34.3 USD) |
4 Conclusion
We investigated the relationship between the price estimation and visual evaluation of white fabrics used in making dress shirts for the actual fabrics and their photographic images considering E-commerce. We also carried out a principal component analysis of those impressions to examine the relationship between the principal component analysis results, weave structures, and fabric materials and price estimation. It was found that the estimated prices of actual fabrics and their images did not necessarily match. The impression of glossiness and brightness differed between the actual fabric and image evaluations, with the actual fabrics being rated significantly higher in terms of glossiness and brightness. These differences are the result of the difference in media, although the visual environment of the lighting and displays may have also had an effect. However, the measured fabric brightness, chromaticity, and Whiteness did not affect the price estimation. Other physical properties would be necessary to predict the prices.
The principal components for evaluating actual fabric and their images were also clarified. The first principal component was labelled as Delicateness and Glossiness (Coarse–Delicate, Not beautiful–Beautiful, Vulgar–Elegant, Matte–Glossy, Casual–Formal, Rough–Smooth, and Dark–Bright for images of fabrics; Vulgar–Elegant, Not beautiful–Beautiful, Coarse–Delicate, Matte–Glossy, Casual–Formal, Dark–Bright, and Rough–Smooth for actual fabrics) for both actual fabrics and their images. The second principal component was labelled as Lightness and Coolness (Cool–Warm, Light–Heavy, and Thin–Thick) for the images of fabrics and Lightness, Coolness, and Softness (Hard–Soft, Cool–Warm, Light–Heavy, and Thin–Thick) for the actual fabrics. Fabrics evaluated highly in the first principal component were estimated as having a high price. It was thus clearly shown that Delicateness and Glossiness affected the price evaluation for both actual white fabrics and their images.
The relationship between price estimation and textile materials also became clear. Fabrics with a high value of Delicateness and Glossiness were poplin fabrics made of at least 95% cotton. In contrast, fabrics containing linen with an uneven texture or rib pattern were evaluated as having low Delicateness and Glossiness and were assessed at a lower price. Additionally, even for blended fabrics such as a cotton–polyester fabric, the expected price was high in the case of diagonal patterns, such as stripe and check patterns. It is necessary to consider those materials and patterns for efficient making and selecting clothing.
It is concluded from the results of the study that the reproducibility of brightness and glossiness is an essential factor of a high price estimation which is an important factor for making and selling clothing. The price evaluation may be higher for fabrics having a poplin weave and being at least 95% cotton, and even for cotton–polyester fabrics with diagonal patterns such as stripes and checks rather than a small repeating dobby pattern with roughness. Considering the essential factor, apparel companies can make clothing and textiles at more highly estimated prices. On the other hand, a textile with characteristics of a lowly estimated price needs to be added information to add the reasons for the high price. These results will be helpful in the procurement of fabrics with which to make clothing and in the marketing of clothing to Japanese consumers in their twenties (the demographic of the participants of this study).
From our results, the impression differences between actual fabric and their images and the relationship between those impressions and price estimation became clear. However, it also shows the difficulty of visual estimation, such as hard-softness from the images of plane shapes. It will be necessary for other studies related to images with three-dimensional shapes. Our research will be connected to developing a more effective fabric or clothing presentation method in e-commerce.
-
Funding information: The authors state no funding is involved.
-
Author contributions: MT and KK designed and conceived this study. TM and KK collected data. TM, KK and MT analyzed and interpreted the results and drafted the manuscript. All authors read and approved the final manuscript.
-
Conflict of interest: The authors state no conflict of interest.
-
Ethical approval: The conducted research is not related to either human or animal use.
-
Data availability statement: The datasets generated during and/or analyzed during the current study are available from the corresponding author on reasonable request.
References
[1] Peirce, F. T. (1930). The handle of cloth as a measurable quality. Journal of the Textile Institute, 21, 337–416.10.1080/19447023008661529Search in Google Scholar
[2] Kawabata, S. (1980). The standardization and analysis of hand evaluation, 2nd ed., Textile Machinery Society of Japan, Osaka.Search in Google Scholar
[3] Behery, H. (2005). Effect of mechanical and physical properties on fabric hand, Woodhead Publishing Limited, NW.10.1533/9781845690984Search in Google Scholar
[4] Sakaguchi, H., Kawabata, S., Niwa, M. (1986). A development in the objective measurement of the quality of knitted fabrics used for underwear, part 2. Equations for the quality measurement. Journal of the Textile Machinery Society of Japan, 39, 43–50.10.4188/transjtmsj.39.3_T43Search in Google Scholar
[5] Kawamura, A., Zhu, C., Peiffer, J., Kim, K., Li, Y., Takatera, M. (2016). Relationship between the physical properties and hand of jean fabric. Autex Research Journal, 16(3), 138–145.10.1515/aut-2015-0043Search in Google Scholar
[6] Kim, K., Wakao, R., Takatera, M., Kitazawa, Y. (2020). Relationship between hand of dress shirt fabrics and price evaluation by experts. Textile Bioengineering and Informatics Symposium 2020 (TBIS2020), Webinar, Manchester, UK.Search in Google Scholar
[7] Kanai, H., Morishima, M., Nasu, K., Nishimatsu, T., Shibata, K., Matsuoka, T. (2011). Identification of principal factors of fabric aesthetics by the evaluation from experts on textiles and from untrained consumers. Textile Research Journal, 81(12), 1216–1225.10.1177/0040517511399960Search in Google Scholar
[8] Jung, C., Naruse, N. (1995). Effects of difference in weave on the visual evaluation of white silk fabrics and black ones. Sen’i Gakkaishi, 51(7), 338–344.10.2115/fiber.51.7_338Search in Google Scholar
[9] Kanai, H., Kimura, H., Morishima, M., Shouji, U., Nishimatsu, T., Shibata, K., et al. (2012). Microscopic photometry and its parameterization for objective evaluation of aesthetics of woven fabrics. Textile Research Journal, 82(19), 1982–1995.10.1177/0040517512454200Search in Google Scholar
[10] Lee, W., Sato, M. (2001). Visual perception of texture of textiles. Color Research & Application: Endorsed by Inter-Society Color Council, The Colour Group (Great Britain), Canadian Society for Color, Color Science Association of Japan, Dutch Society for the Study of Color, The Swedish Colour Centre Foundation, Colour Society of Australia, Centre Français de la Couleur, 26(6), 469–477.10.1002/col.1067Search in Google Scholar
[11] Maru, H., Nagashima, Y., Kanai, H., Nishimatsu, T. (2017). Study on fabric character triggering fabric appearance/fabric hand. Journal of Textile Engineering, 63(5), 141–148.10.4188/jte.63.141Search in Google Scholar
[12] Maru, H., Shimizu, F., Kanai, H., Nishimatsu, T., Matsunaga, S. (2014). Relation between visual impression of slide fastener with different color technology method and its reflection properties. Journal of Fiber Bioengineering and Informatics, 7(2), 129–140.10.3993/jfbi06201401Search in Google Scholar
[13] Lai, S. S. (2001). Objective evaluation for the visual texture of men’s summer shirts fabric, Part I: Sensory test of texture. Journal of the Japan Research Association for Textile End-uses, 42(10), 649–656.Search in Google Scholar
[14] Lai, S. S. (2001). Objective evaluation for the visual texture of men’s summer shirts fabric, Part II: Applied regression method. Journal of the Japan Research Association for Textile End-uses, 42(12), 856–862.Search in Google Scholar
[15] Lai, S. S. (2002). Objective evaluation for the visual texture of men’s summer shirts fabric, Part III: Applied neural network. Journal of the Japan Research Association for Textile End-uses, 43(1), 43–49.Search in Google Scholar
[16] das Neves, É. P., Brigatto, A. C., Samaan, C. L., Rodrigues, S. T., Paschoarelli, L. C. (2020). Perception and fabrics: A preliminary investigation about the responses patterns by the stimulation of vision and touch. Revista Design & Technologia, 10(20), 95–105.10.23972/det2020iss20pp95-105Search in Google Scholar
[17] Xue, Z, Zeng, X, Koehl, L, Shen, L. (2016). Interpretation of fabric tactile perceptions through visual features for textile products. Journal of Sensory Studies, 31(2), 143–162.10.1111/joss.12201Search in Google Scholar
[18] Maruyama, T., Takatera, M., Kim, K., (2022). Relationship between visual evaluation and price evaluation of white shirt fabric. Textile Bioengineering and Informatics Symposium 2022 (TBIS2022), Webinar, Liberec, Czech Republic.Search in Google Scholar
[19] Wojciechowski, J., Lisowska, R., Skrzetuska, E. (2023). State of the art of presentation of clothing textiles in e-commerce with size matching issues. AUTEX Research Journal, 23(4), 532–542.10.2478/aut-2022-0030Search in Google Scholar
[20] Kodžoman, D., Hladnik, A., Čuden, A. P., Čok, V. (2023). Assessment and semantic categorization of fabric visual texture preferences. Autex Research Journal, 23(2), 279–291.10.2478/aut-2022-0006Search in Google Scholar
[21] Zhao, Y., Yin, L., Ikiz, Y., Sato, T., Yu, Q., Zhang, Z., et al. (2020). A study on customer’s preference toward summer-shirt fabric. Journal of Engineered Fibers and Fabrics, 15, 1–17.10.1177/1558925020902975Search in Google Scholar
[22] Fasllija, E., Olguntürk, N., Güvenç, D. (2020). Colour-texture mapping associations in terms of preference. Coloration Technology, 136(6), 468–475.10.1111/cote.12492Search in Google Scholar
[23] Chang, T. Z., Wildt, A. R. (1994). Price, product information, and purchase intention: An empirical study. Journal of the Academy of Marketing Science, 22(1), 16–27.10.1177/0092070394221002Search in Google Scholar
[24] Lee, D. (1996). The relationship between price and objective apparel quality: A comparison between the United States market and Korean market (Doctoral dissertation), Texas Tech University, Texas.Search in Google Scholar
[25] Kim, K., Takatera, M., Zhu, A., Otani, T. (2015). Comparison of Japanese and Chinese clothing evaluations by experts taking into account marketability. Autex Research Journal, 15(1), 67–76.10.2478/aut-2014-0047Search in Google Scholar
[26] Ganz, E., Pauli, H. K. A. (1995). Whiteness and tint formulas of the Commission Internationale de l’Eclairage: approximations in the L* a* b* color space. Applied Optics, 34(16), 2998–2999.10.1364/AO.34.002998Search in Google Scholar PubMed
[27] Park, H. J., Koyama, E., Furukawa, T., Takatera, M., Shimizu, Y., Kim, H. (2003). An impression evaluation model for apparel product retrieval based on image analysis. Kansei Engineering International, 3(1), 11–18.10.5057/kei.3.11Search in Google Scholar
[28] Welch, B. L. (1947). The generalization of ‘STUDENT’S’ problem when several different population varlances are involved. Biometrika, 34(1–2), 28–35.10.1093/biomet/34.1-2.28Search in Google Scholar PubMed
© 2024 the author(s), published by De Gruyter
This work is licensed under the Creative Commons Attribution 4.0 International License.
Articles in the same Issue
- Characterization of viscoelastic properties of yarn materials: Dynamic mechanical analysis in the transversal direction
- Analysis of omni-channel implementations that are preferred by consumers in clothing sector
- Structural modeling and analysis of three-dimensional cross-linked braided preforms
- An experimental study of mechanical properties and comfortability of knitted imitation woven shirt fabrics
- Technology integration to promote circular economy transformation of the garment industry: a systematic literature review
- Research on T-shirt-style design based on Kansei image using back-propagation neural networks
- Research on She nationality clothing recognition based on color feature fusion with PSO-SVM
- Accuracy prediction of wearable flexible smart gloves
- Preparation and performance of stainless steel fiber/Lyocell fiber-blended weft-knitted fabric
- Development of an emotional response model for hospital gown design using structural equation modeling
- Preparation and properties of stainless steel filament/pure cotton woven fabric
- Facemask comfort enhancement with graphene oxide from recovered carbon waste tyres
- Use of enzymatic processes in the tanning of leather materials
- Optical-related properties and characterization of some textile fibers using near-infrared spectroscopy
- Network modeling of aesthetic effect for Chinese Yue Opera costume simulation images
- Predicting consumers’ garment fit satisfactions by using machine learning
- Non-destructive identification of wool and cashmere fibers based on improved LDA using NIR spectroscopy
- Study on the relationship between structure and moisturizing performance of seamless knitted fabrics of protein fibers for autumn and winter
- Antibacterial and yellowing performances of sports underwear fabric with polyamide/silver ion polyurethane filaments
- Numerical and experimental analysis of ballistic performance in hybrid soft armours composed of para-aramid triaxial and biaxial woven fabrics
- Phonetic smart clothing design based on gender awareness education for preschoolers
- Determination of anthropometric measurements and their application in the development of clothing sizing systems for women in the regions of the Republic of Croatia
- Research on optimal design of pleated cheongsam based on Kano–HOQ–Pugh model
- Numerical investigation of weaving machine heald shaft new design using composite material to improve its performance
- Corrigendum to “Use of enzymatic processes in the tanning of leather materials”
- Shaping of thermal protective properties of basalt fabric-based composites by direct surface modification using magnetron sputtering technique
- Numerical modeling of the heat flow component of the composite developed on the basis of basalt fabric
- Weft insertion guideway design based on high-temperature superconducting levitation
- Ultrasonic-assisted alkali hydrolysis of polyethylene terephthalate fabric and its effect on the microstructure and dyeing properties of fibers
- Comparative study on physical properties of bio-based PA56 fibers and wearability of their fabrics
- Investigation of the bias tape roll change time efficiency in garment factories
- Analysis of foot 3D scans of boys from Polish population
- Optimization of garment sewing operation standard minute value prediction using an IPSO-BP neural network
- Influence of repeated switching of current through contacts made of electroconductive fabrics on their resistance
- Numerical calculation of air permeability of warp-knitted jacquard spacer shoe-upper materials based on CFD
- Compact Spinning with Different Fibre Types: An Experimental Investigation on Yarn Properties in the Condensing Zone with 3D-Printed Guiding Device
- Modeling of virtual clothing and its contact with the human body
- Advances in personalized modelling and virtual display of ethnic clothing for intelligent customization
- Investigation of weave influence on flame retardancy of jute fabrics
- Balloonless spinning spindle head shape optimisation
- Research on 3D simulation design and dynamic virtual display of clothing flexible body
- Turkish textile and clothing SMEs: Importance of organizational learning, digitalization, and internationalization
- Corrigendum To: “Washing characterization of compression socks”
- Study on the promotion multiple of blood flow velocity on human epidermal microcirculation of volcanic rock polymer fiber seamless knitted fabric
- Bending properties and numerical analysis of nonorthogonal woven composites
- Bringing the queen mother of the west to life: Digital reconstruction and analysis of Taoist Celestial Beings Worshiping mural’s apparel
- Modeling process for full forming sports underwear
- Retraction of: Ionic crosslinking of cotton
- An observational study of female body shape characteristics in multiracial Malaysia
- Study on theoretical model and actual deformation of weft-knitted transfer loop based on particle constraint
- Design and 3D simulation of weft-knitted jacquard plush fabrics
- An overview of technological challenges in implementing the digital product passport in the textile and clothing industry
- Understanding and addressing the water footprint in the textile sector: A review
- Determinants of location changes in the clothing industry in Poland
- Influence of cam profile errors in a modulator on the dynamic response of the heald frame
- Quantitative analysis of wool and cashmere fiber mixtures using NIR spectroscopy
- 3D simulation of double-needle bar warp-knitted clustered pile fabrics on DFS
- Finite element analysis of heat transfer behavior in glass fiber/metal composite materials under constant heat load
- Price estimation and visual evaluation of actual white fabrics used for dress shirts and their photographic images
- Effect of gluing garment materials with adhesive inserts on their multidirectional drape and bending rigidity
- Optimization analysis of carrier-track collision in braiding process
- Numerical and experimental analysis of the ballistic performance of soft bulletproof vests for women
- The antimicrobial potential of plant-based natural dyes for textile dyeing: A systematic review using prisma
- Influence of sewing parameters on the skin–fabric friction
- Validation by experimental study the relationship between fabric tensile strength and weave structures
- Optimization of fabric’s tensile strength and bagging deformation using surface response and finite element in stenter machine
- Analysis of lean manufacturing waste in the process flow of ready-to-wear garment production in Nigeria
- An optimization study on the sol–gel process to obtain multifunctional denim fabrics
- Drape test of fully formed knitted flared skirts based on 3D-printed human body posture
- Supplier selection models using fuzzy hybrid methods in the clothing textile industry