Optical-related properties and characterization of some textile fibers using near-infrared spectroscopy
-
Alsaid Ahmed Almetwally
 and
Heba M. Elfowaty
and
Heba M. Elfowaty

Abstract
When light falls on the fiber surface, it is absorbed, reflected, or refracted. These three phases of incident light determine, to a great extent, the behavior of lustre of major textile fibers. This article sheds light upon the behavior of some textile fibers, namely, polyethylene terephthalate, cotton, viscose, bamboo, tencel, and modal fibers, in terms of their reflectance percentages in the ultraviolet regions. Also, the direct and indirect band-gap energies of the used textile fibers were also investigated. The findings of this study revealed the significant differences among these used textile fibers in relation to their optical properties. Also, the chemical composition of the used textile fibers was easily identified using near-infrared spectroscopy. Finally, the findings of this study revealed that the used textile fibers are considered good insulators.
1 Introduction
Nowadays, textile fibers are determined, identified, and characterized using four main methods: visual inspection, solubility testing, flame testing, and microscopy [1,2]. Visual inspection is considered a subjective method. In contrast, solubility and flame testing methods are destructive. Thus, microscopic examination of textile fibers became the simplest, most efficient, and most reliable testing method in many industries including chemical, plastics, polymer, agriculture, pharmaceutical, and textile industries [3]. The application of near-infrared (NIR) technology in the textile industry includes the determination and identification of fiber type and blend content, fiber maturity, micronaire value, size pick-up, moisture content, heat-set temperature, etc. [4,5,6].
When diffuse NIR reflectance spectroscopy was combined with the soft independent modeling of class analogy (SIMCA) method, it was discovered to be an efficient, quick, multivariate, and non-destructive method for classifying various textile fibers. This promising technique does not require any sample pretreatment and settings on the manufacturing process, fiber origin, dye pattern, or dye content [3]. Jinfeng et al. [7] integrated the NIR spectra with pattern recognition approache that include principal component analysis (PCA), linear discrimination analysis (LDA), and SIMCA to characterize and identify polypropylene and polylactic acid, wool, and cashmere fibers.
Yongliang et al. [8] investigated the relationship between NIR spectra and micronaire values, which were measured using high volume instrument (HVI) from a total of 381 cotton samples that were harvested from crops in 2011 and 2012. Their results disclosed that the difference between micronaire values measured and predicated using HVI and NIR, respectively, was accepted to a great extent. Therefore, they stated that the development of an effective and robust NIR model can be used to rapidly assess the micronaire values of cotton fibers. It was also reported that linen content in linen/viscose blended yarn was measured conveniently using NIR spectroscopy [9]. Thomasson et al. [10] used an FTIR instrument to characterize cotton fiber quality, including its micronaire value. At fixed polarization, they discovered that the different wavelengths of the laser caused a slight variation in the scatted light among the cotton samples. By contrast, with a fixed wavelength and varying polarization, a notable variation was detected, assuring that the polarization can be used to differentiate among cotton fiber samples.
It should be noted that the characteristics of textile fibers, especially cotton and polyester, and their blends in the form of spun yarns or knitted fabrics were researched in various studies [11,12,13,14,15,16,17,18].
This article aims to identify and characterize some cellulose textile fibers such as viscose, bamboo, tencel, and modal fiber in comparison with Egyptian cotton and PET fibers using NIR analysis. Also, the direct and indirect band energies of these fibers were compared.
2 Experimental
2.1 Materials
Throughout this study, six different kinds of textile fibers were used. Of these, four types are regenerated cellulosic fibers, namely viscose, bamboo, tencel, and modal fibers. The rest are Egyptian cotton of type Giza 86 and polyethylene terephthalate (PET) textile fibers. The longitudinal and cross-sectional views of the textile fibers are shown in Figures 1 and 2, respectively. Also, the particulars of the Egyptian cotton fibers (Giza 86) are listed in Table 1, and the dimensions of the remaining used fibers are tabulated in Table 2.
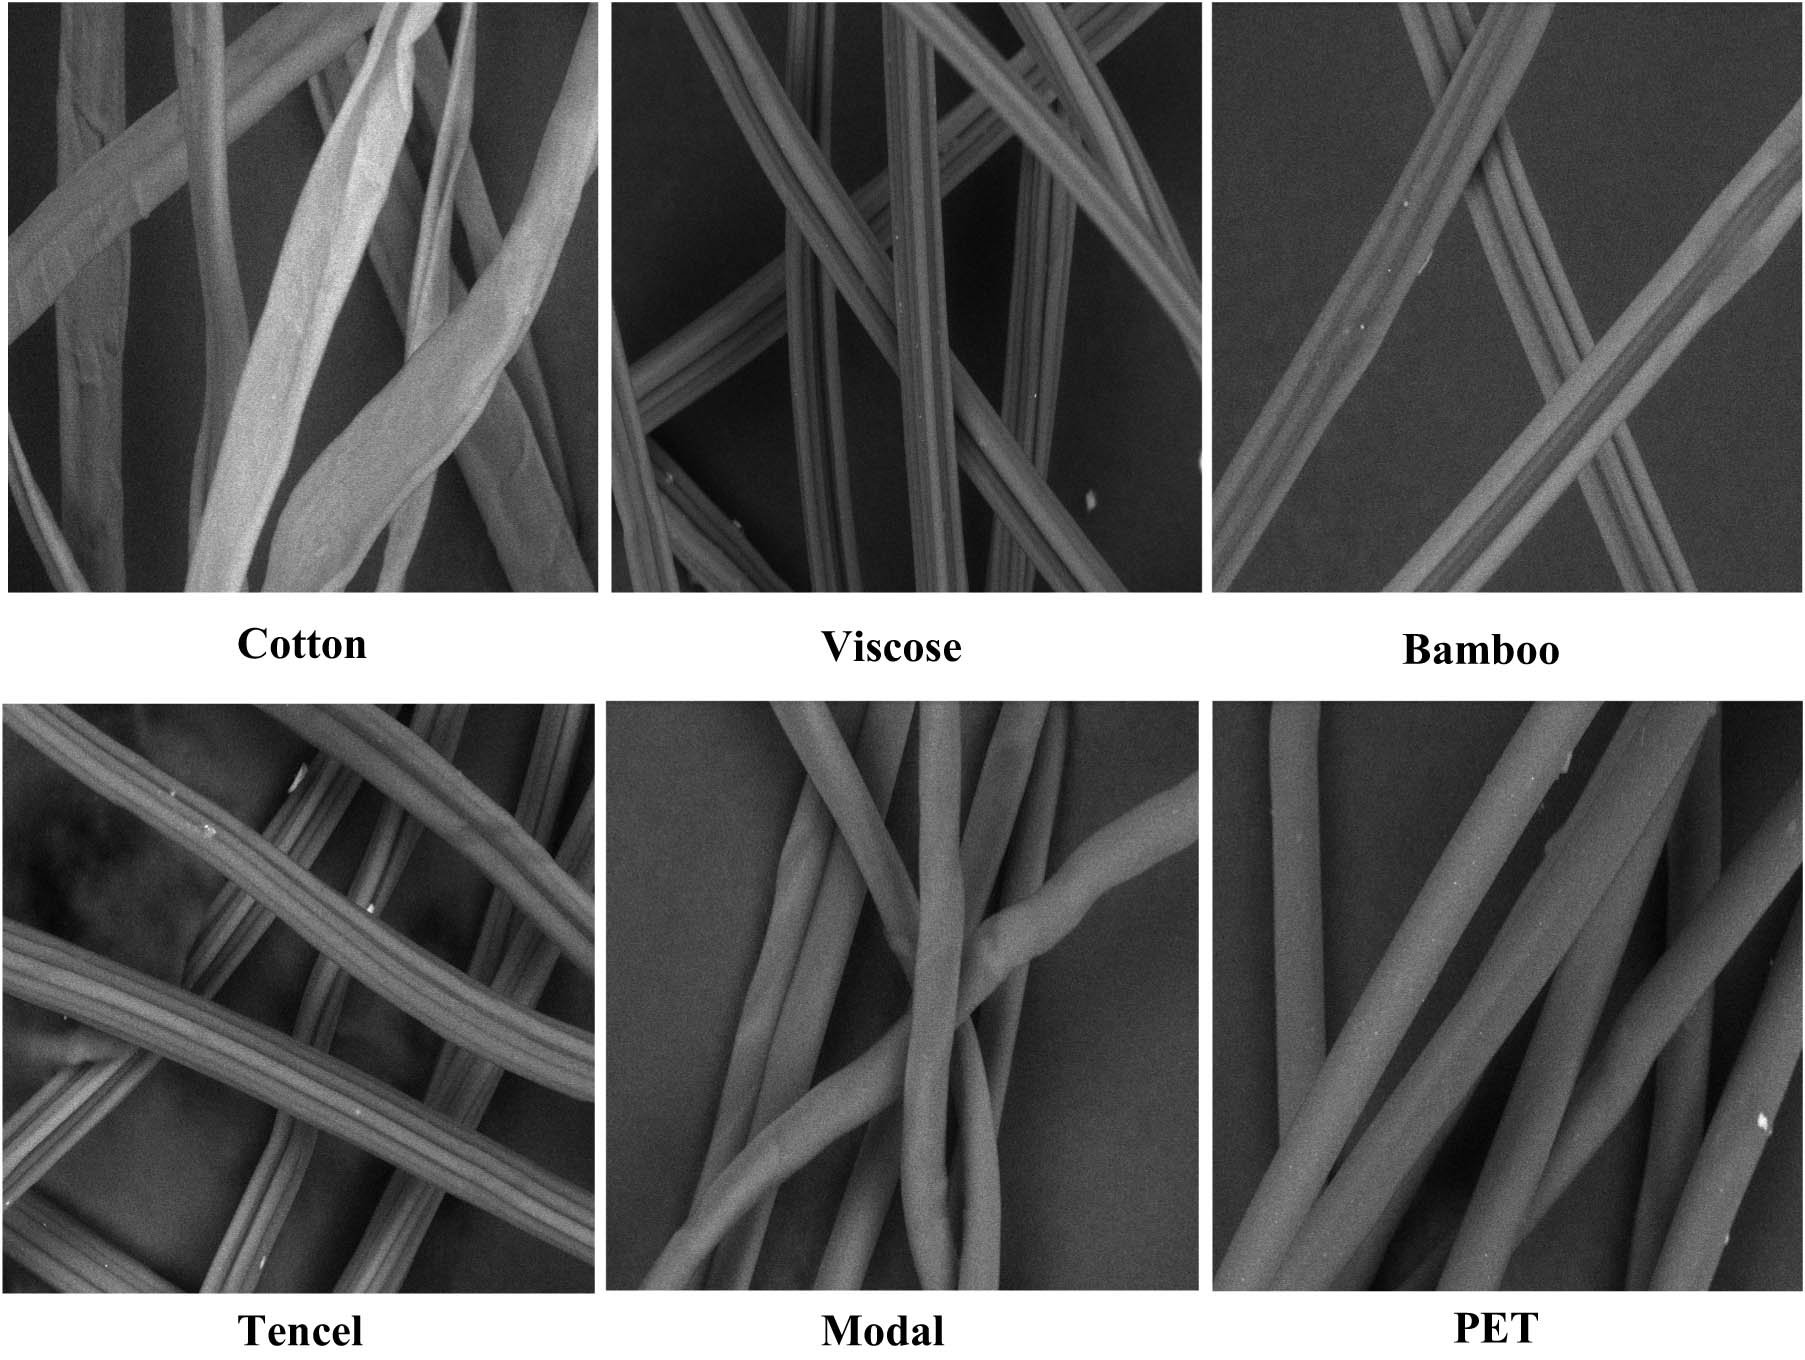
Longitudinal views of the used textile fibers.
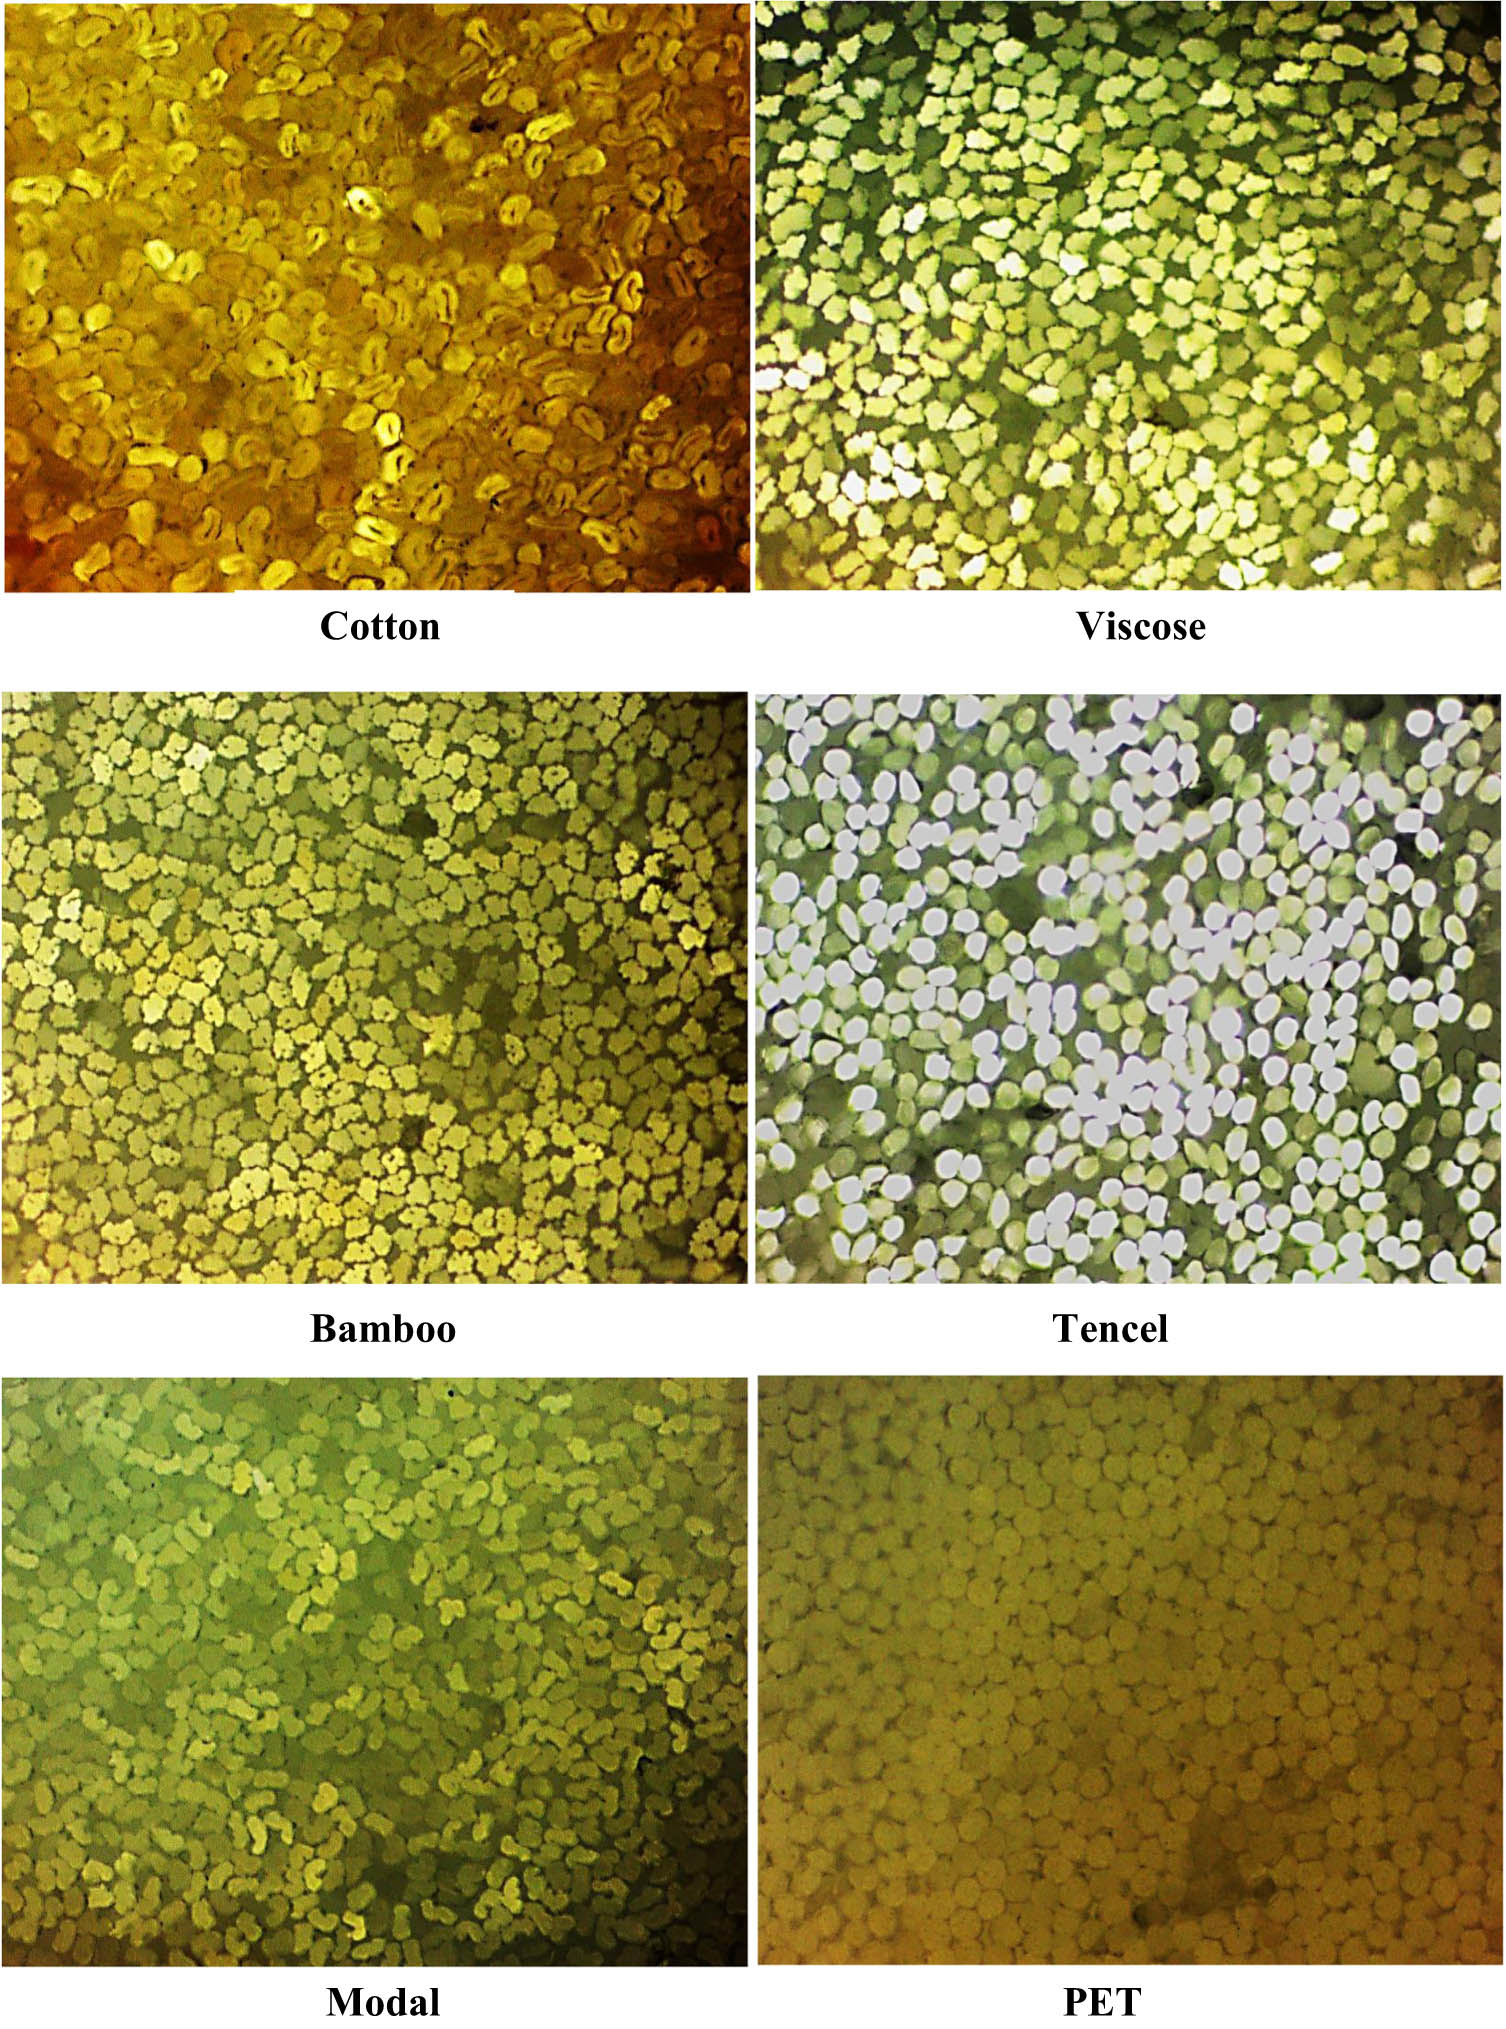
Cross-sectional views of the used textile fibers.
Particulars of the Egyptian cotton (Giza 86)
| Value | |
|---|---|
| Upper half mean length | 33.8 mm |
| Length uniformity | 87.1% |
| Short fiber content | 5.6% |
| Tenacity | 45.3 g/tex |
| Micronaire value | 4.31 (µg/in.) |
| Spinning consistency | 206 |
| Maturity ratio | 82% |
Dimensions of textile fibers used in this study
| Dimensions | Types of textile fibers | |||||
|---|---|---|---|---|---|---|
| Cotton | Polyester | Viscose | Bamboo | Tencel | Modal | |
| Diameter (µm) | 14.6 | 11.6 | 10.3 | 12.5 | 10.2 | 10.8 |
| Perimeter (μm) | 45.9 | 36.5 | 32.4 | 39.3 | 32.1 | 33.9 |
| Area (μm2) | 118.5 | 122.7 | 101 | 86.3 | 97.1 | 75.4 |
| Mean length (mm) | 33.8 | 38 | 38 | 38 | 39 | 38 |
| Linear density (denier/dtex) | 2.3/2.6 | 1.5/1.6 | 1.2/1.3 | 1.7/1.9 | 1.1/1.3 | 1.3/1.4 |
Since the fibers investigated in this study are mainly cellulose and PET fibers, it should be noted that cellulose fibers (cotton, viscose, bamboo, tencel, and modal) are essentially made up of cellulose and have C–C, C–H, and O–H groups. These cellulose fibers differ from each other in terms of the percentage content of alpha-cellulose, hemicellulose, pectin, lignin, ash, etc. PET fiber contains both ester bonds (CO–O) and C–H. The chemical compositions of cellulose fibers in terms of cellulose, hemicellulose, pectin, lignin, and PET fiber are illustrated in Figure 3.
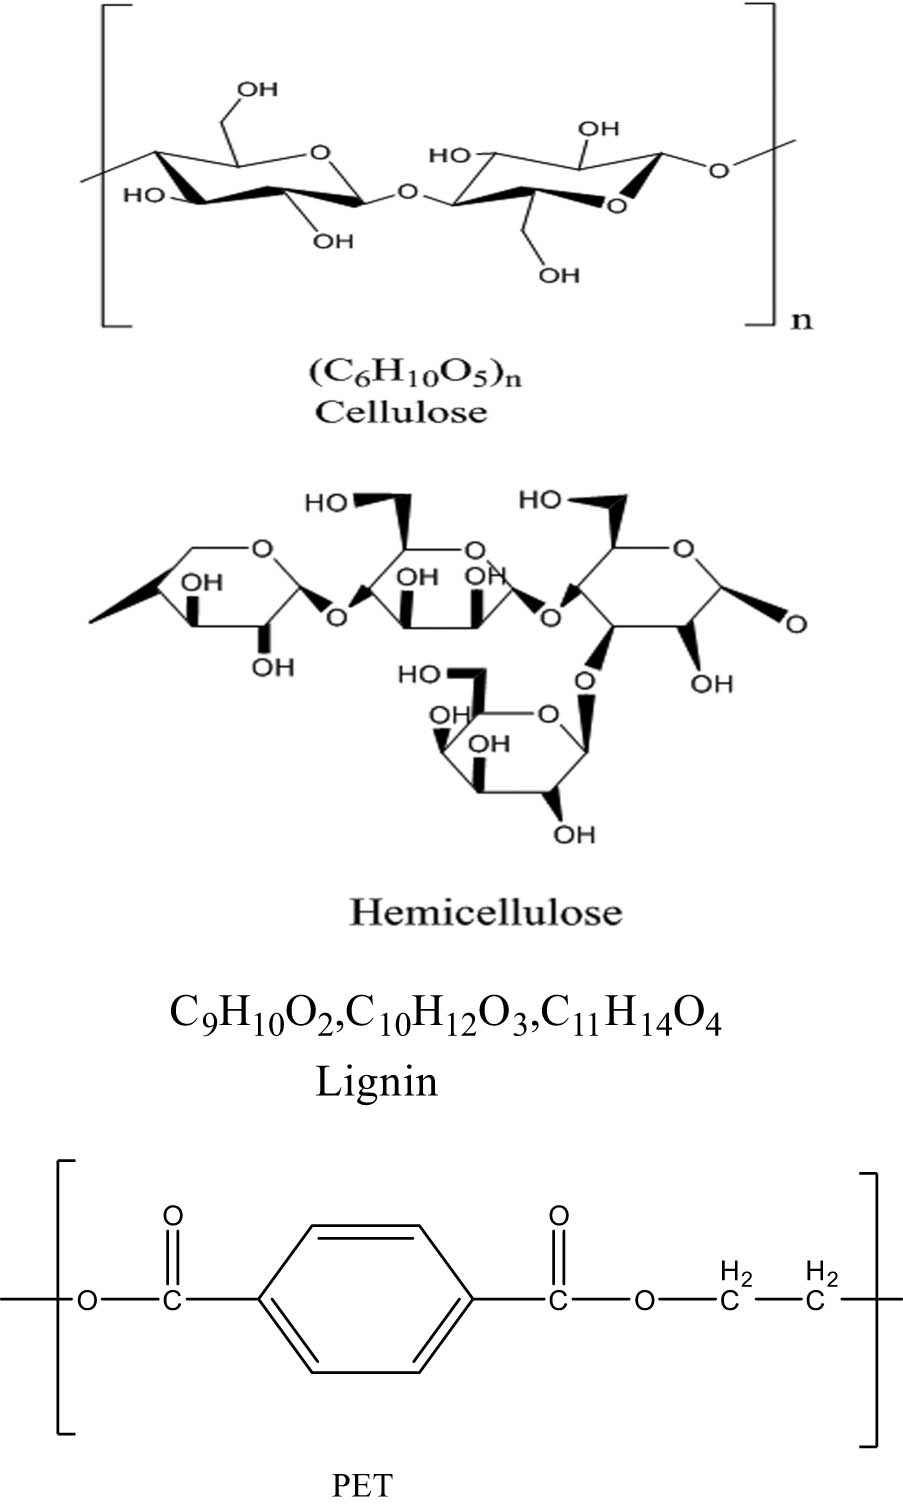
Chemical compositions of cellulose and PET fibers.
2.2 Methods
First, all types of textile fibers under study were processed on a carding machine to convert them into a form of carded sliver. From each fiber type, a carded sliver of count 0.12 Ne with a weight of 4.9 g/m was produced. All carded slivers were placed in a standard environment, i.e., temperature of 20 ± 2°C and relative humidity of 65 ± 2% for a full day.
From each fiber type, 0.54 g was taken and pressed using a hydraulic press under a pressure of approximately 127 MPa in the form of a circular disc of 0.2 cm thickness and 1.5 cm diameter and then mounted in the sample holder of the measuring instrument.
It was reported that the best tool for evaluating the optical characteristics of textile fibers is ultraviolet–visible (UV-VIS) diffuse reflectance spectroscopy [19]. In order to acquire the NIR reflectance spectra of the textile fibers under study, a spectrometer of type JASCO V-770 (Jasco Co., Japan) was used. The spectra were collected using wavelength ranges between 190 and 2,500 nm with a specified resolution of 0.5 nm and 32 scans. For each fiber sample, three spectra were obtained, and their average was calculated. It should be noted that the used range wavelength covers UV–VIS–NIR bands.
Two types of reflection occur when electromagnetic radiation is directed onto the surface of a solid powder: specular reflection and diffuse reflection (DR). The specular reflection is direct radiation from the powder sample surface, and according to Snell’s reflective law, the angles of incidence and reflection are equal. DR is the radiation that penetrates the powder sample and scatters (after several reflections, refractions, and diffractions in all directions due to nanostructured mass) as well as wavelength-dependent absorption within the nanomaterial.
The standard approach for determining the optical characteristics of powder is to use a UV–Vis spectrophotometer to detect DR [20,21].
Tauc et al. [22] calculated the band-gap energy of amorphous semiconductors using optical absorption spectra in 1966. Later on, Davis and Mott developed Tauc’s proposal further [23,24]. The Tauc technique is dependent on the presumption that the absorption coefficient, α, based on the band-gap energy, can be expressed as follows:
where ν is the frequency of the photon, h is the Plank’s constant, E g is the energy of the band-gap, and B is the constant. The m factor is 1/2 or 2 for direct and indirect transition band-gaps, respectively, depending on the nature of the electron transition [25]. Diffuse reflectance spectra are commonly used to calculate the band-gap energy. The observed reflectance spectra can be transformed to matching absorption spectra using the following Kubelka–Munk function, which was presented in 1931 [26]:
The ratio of the sample-measured reflectance (R sample) to the measurement from a highly reflecting material (R standard, with reflectance approximately 100%) is used to calculate relative reflectance (R relative).
Here,
The energy band-gap is easily derived by plotting (hν) against both (αhν)1/2 and (αhν)2.
3 Results and discussion
3.1 Reflectance values
When a light beam falls on a fiber surface, it is reflected, refracted, or absorbed, and the sum of their indices is equal to one. Reflectance values of the used raw fibers were measured using a NIR spectrometer in the UV–VIS and NIR regions. In the visible region, the reflectance spectrum uniquely describes the color of objects that are perceived by the human eyes.
Figure 4 shows the reflectance values of the used textile fibers in the UV–VIS region. It was detected that the percentage reflectance is gradually increasing until it reaches 85% at a wavelength of 400 nm for all textile fibers except for cotton fibers whose reflectance value reaches 50% at the same wavelength. Thereafter, the reflectance reaches a plateau at 90% reflectance starting from the wavelength of 400 nm, while cotton fiber is still increasing steadily until it reaches 80% at a wavelength of 880 nm. In the UV light (wavelength is less than 400 nm), the difference between cotton fibers and their counterparts of the remaining textile fibers in terms of their reflectance value is more pronounced. In the visible region, it can be concluded from Figure 4 that viscose fiber is associated with a high reflectance value, followed by bamboo, modal, and tencel fibers, respectively. In contrast, polyester and Egyptian cotton fibers have the lowest percentage of reflectance values. In the range of wavelength of 400–700, the reflectance spectra of all fibers except for cotton are overlapped, while the reflectance spectrum of cotton fiber was overlapped with bamboo and tencel fibers in the range of 900–1,000.
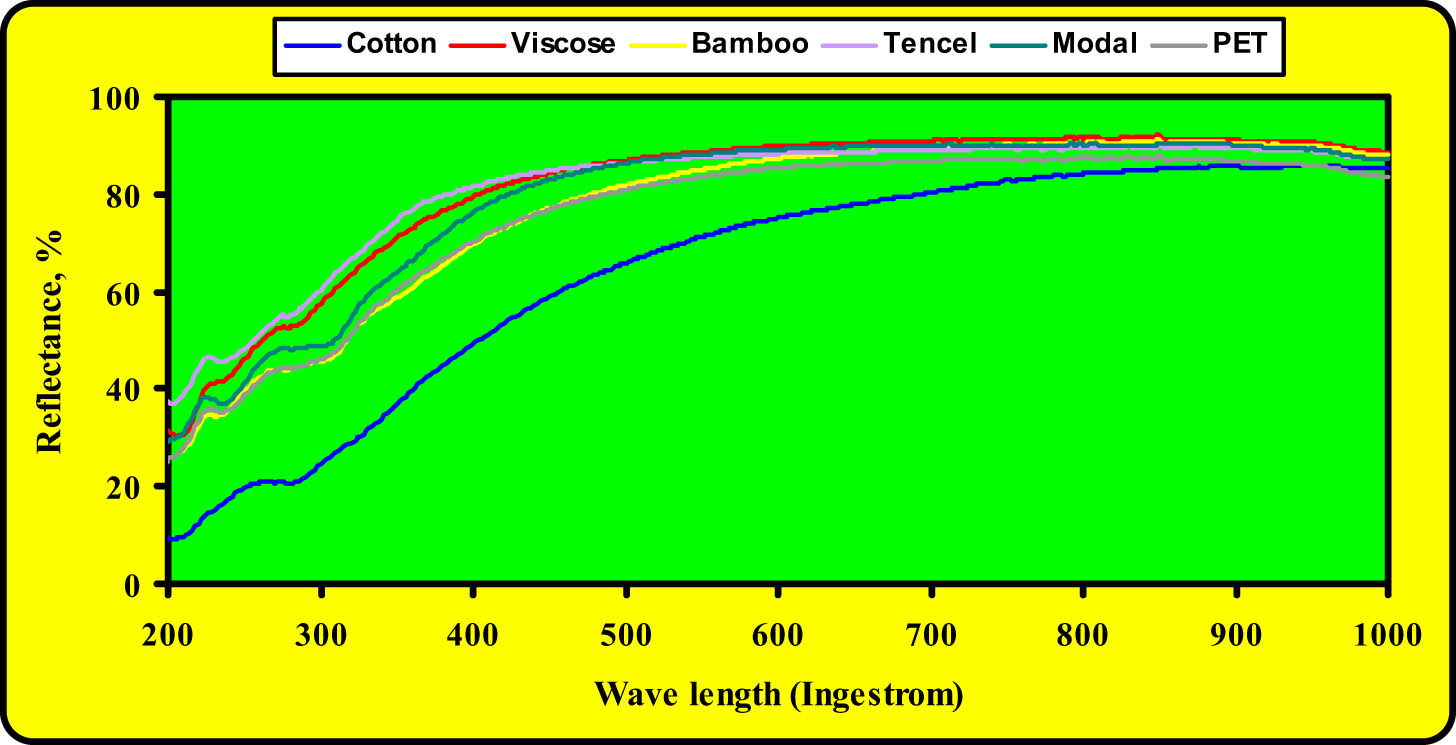
The percentage reflectance of the used textile fibers in the UV–VIS region.
Due to its significant superiority, NIR spectroscopy can be used to characterize, identify, and classify different textile fibers. Using the relationship between the vibrations of the characteristic groups and the corresponding wavelengths, quick identification and classification of the used textile fibers can be realized.
The NIR region starts from 900 to 2,500 nm, which has an overtone of stretching and vibrational modes of mid-infrared MIR, in which the FTIR measurement takes place. Figure 5 shows the NIR spectra of the used textile fibers. From this figure, it can be seen that the greatest variation was detected in the regions of 1,200–1,600 and 1,900–250 nm, respectively. The main bands are located at wavelengths of 1,460, 1,920, 2,100, 2,270, and 2,350 nm. The band located at a wavelength of 1,200 nm is associated with the second overtone of C–H stretching vibrations with a methyl group in cellulose. In contrast, the first overtone of O–H stretching vibration is the cause of the broadband located at a wavelength of 1,460 nm. The sharp band assigned at a wavelength of 1,924 nm is due to O–H asymmetric stretching and O–H deformation from free-absorbed water. The band located at a wavelength of 2,110 nm is due to the combination of O–H stretching and O–H deformation, which corroborates that all O–H groups are involved in hydrogen bridges. Both bands at 2,270 and 2,350 nm are from polysaccharides or cellulose derivatives [28,29,30,31].

NIR spectra of the used textile fibers.
3.2 Absorbance
The average absorbance values of the used textile fibers versus the wavenumber are depicted in Figure 6. From this figure, it can be noticed that at the bands of 8,200 up to 4,000 cm−1, there exist identical wave fluctuations and spectra peaks for the used textile fibers. This means that most textile fibers, except for the PET fiber, have similar chemical structures. Differences in absorption intensity are linked to the molecular composition or found chemical groups, which can be used to further determine the blending ratios among these textile fibers. The used textile fibers also displayed a different variation trend of absorbance in the spectral range over 12,500 cm−1, which can be ascribed to their color differences. This result agrees with previous findings [32,33].
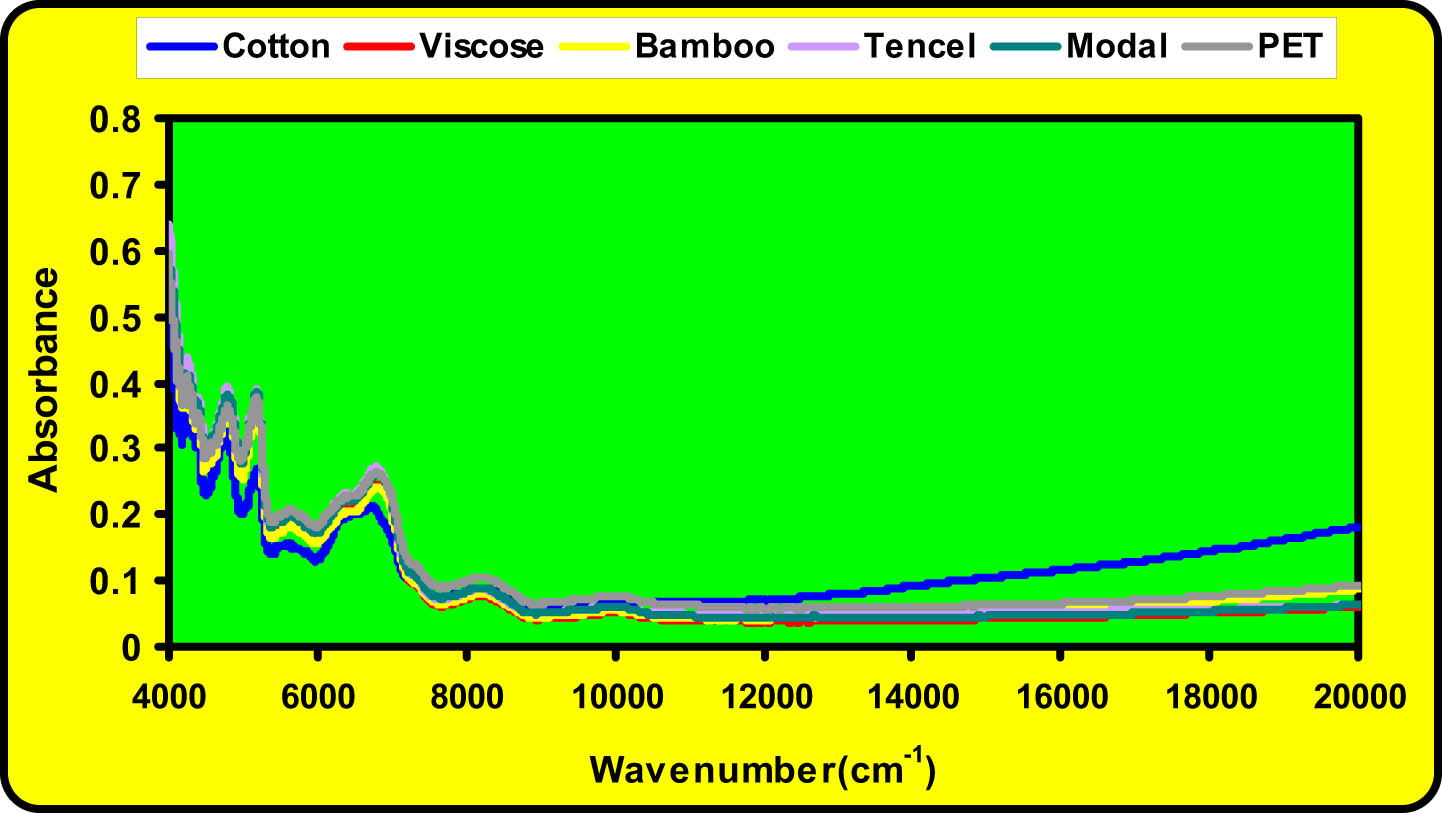
Absorbance spectra of the used textile fibers.
3.3 Band-gap energy
The values of the direct and indirect band-gap energies of the used textile fibers are depicted in Figures 7 and 8, respectively. In these figures, the values of hν were plotted against both (αhν)2 and (αhν)1/2. Generally, the extrapolation of the tangent of the straight line segment of each (αhν)2 and (αhν)1/2 against hν at ordinate is equal to zero and can be used to determine the direct and indirect band-gap energies, respectively.
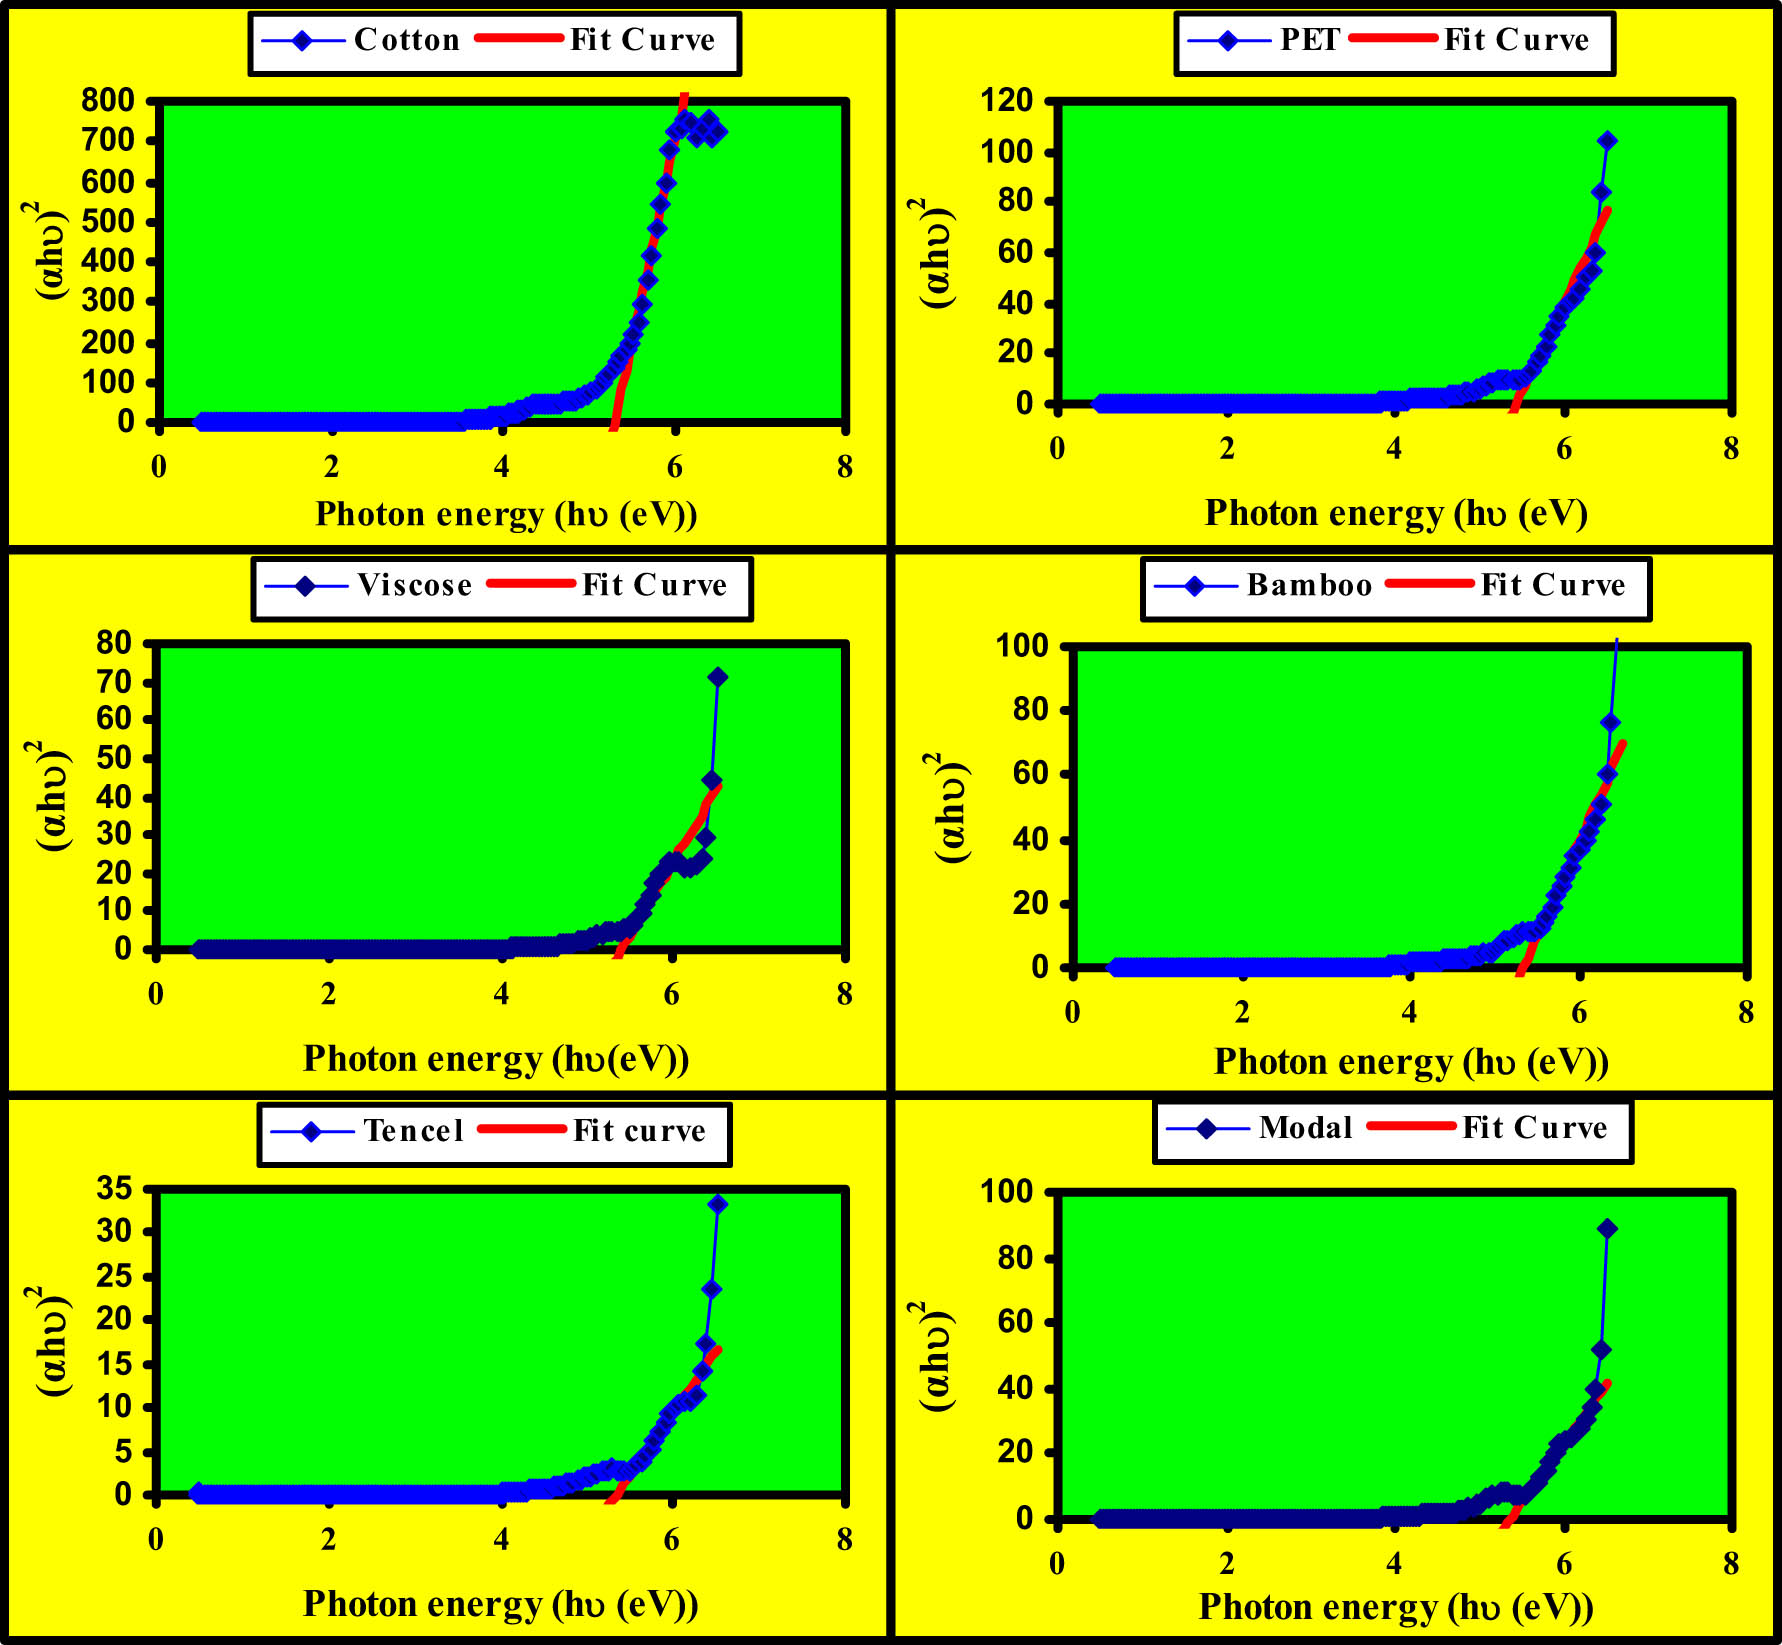
Direct band-gap energy values of the used textile fibers.
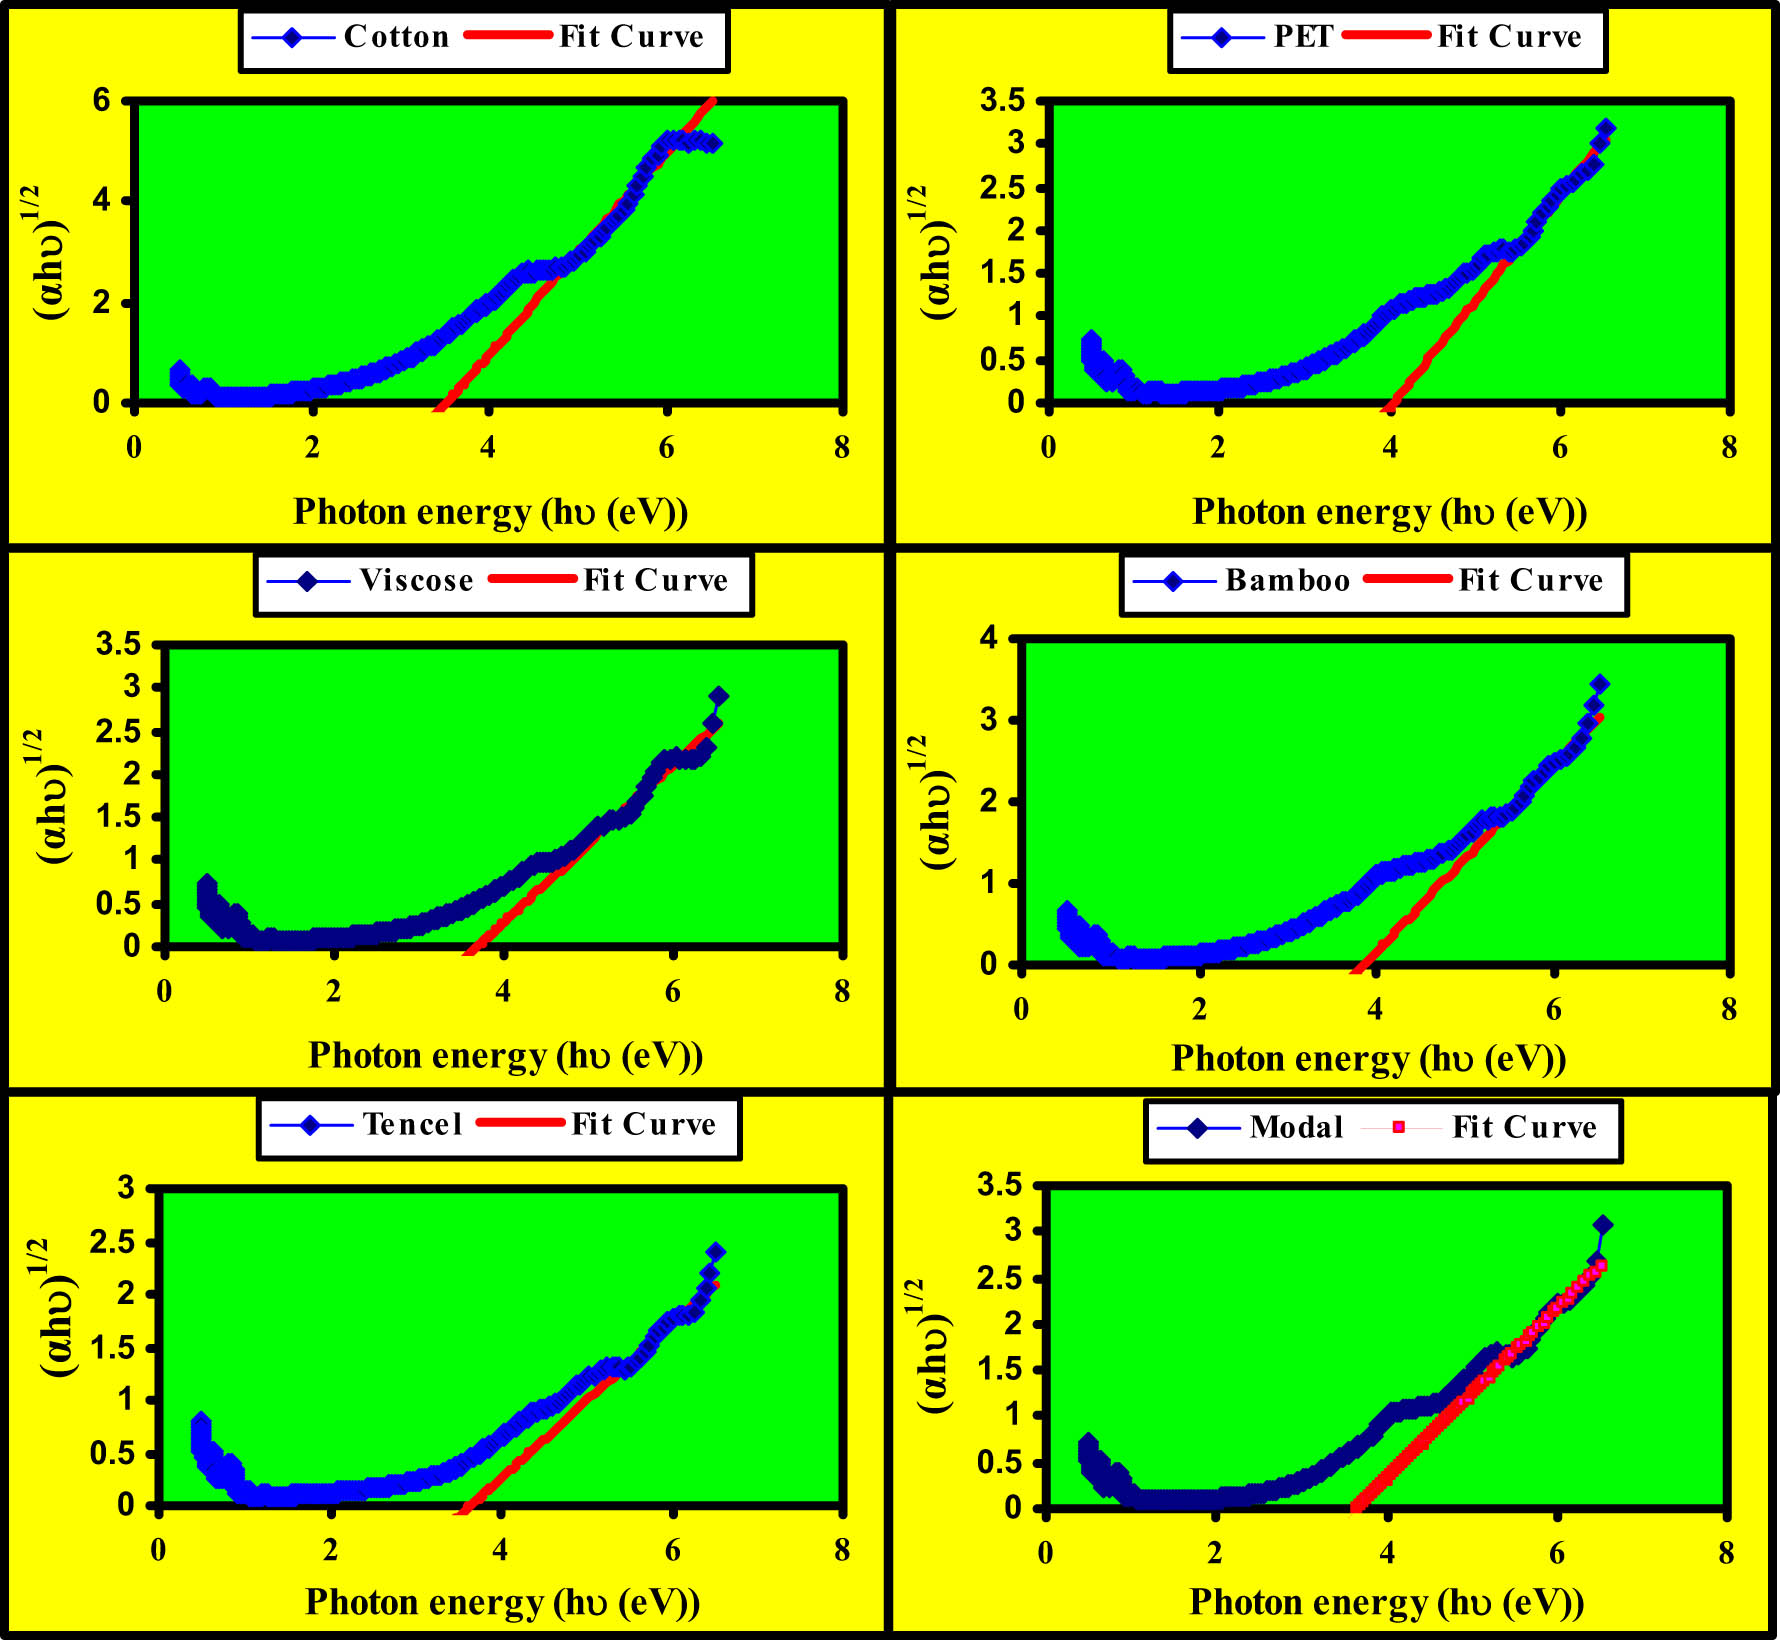
Indirect band-gap energy values of the used textile fibers.
From Figure 7, it can be seen that the direct band-gap energies of the used textile fibers ranged between 5.31 and 5.43 eV, which means that these textile fibers are good insulators. It can also be seen that polyester fibers have the highest value of the direct band-gap energy; and cotton fiber has the lowest value. The values of the direct band-gap energies of the used textile fibers can be arranged in descending order from a high value to a low value of the direct band-gap energies as follows: polyester (5.43 eV) > viscose (5.4 eV) > modal (5.37 eV) > bamboo (5.35 eV) > tencel (5.33 eV) > cotton (5.31 eV).
The indirect band-gap energies of the used textile fibers are obtained by plotting (hν) against (αhν)1/2 and are depicted in Figure 8. The extrapolation of the linear portion of each curve till its intersection with the x-axis, hν, will be used to estimate the value of the indirect band-gap energy. From these figures, it can be noted that the indirect band-gap energies of the textile fibers under study ranged between 3.52 and 4.04 eV. It was found that polyester and cotton fibers have high and low indirect band-gap energies, respectively. The values of the indirect band-gap energies of these textile fibers can be arranged from the high value to low one as follows: polyester (4.04 eV) > bamboo (3.86 eV) > viscose (3.68 eV) > modal (3.66 eV) > tencel (3.64 eV) > cotton (3.52 eV). It is surprising to note for all textile fibers that the direct band-gap energy is higher than the indirect band-gap energy.
4 Conclusion
The present study focuses on the characterization of six textile fibers of which one natural cellulose fiber, namely Egyptian cotton, and four regenerated cellulose (viscose, bamboo, Tencel, and modal) and PET fibers. The characterization and determination were conducted using UV–NIR spectroscopy, which proved its usefulness and efficiency. The direct and indirect band-gap energy of each fiber type was also estimated using the Munk–Kubelka equation. The findings of this study revealed that in the visible region, these textile fibers differ significantly in their reflectance and absorbance values. It was also estimated that the direct band-gap energy of the fibers was more than 3 eV, which means that these textile fibers are good insulators.
-
Funding information: This article is based upon work supported by the Science, Technology & Innovation Funding Authority (STIFA) under grant number 43342.
-
Conflict of interest: Authors state no conflict of interest.
References
[1] Kadolph, S. J. (2007). Textiles (10th ed., pp. 34–36). Prentice Hall, Upper Saddle River.Search in Google Scholar
[2] King, R. R. (1985). Textile identification, conservation and preservation (pp. 5–121). Noyes Publications, Parkridge.Search in Google Scholar
[3] Davis, C. B., Busch, K. W., Rabbe, D. H., Busch, M. A., Lusk, J. R. (2015). Rapid, non-destructive, textile classification using SIMCA on diffuse near-infrared reflectance spectra. Journal of Modern Physics, 6, 711–718.10.4236/jmp.2015.66076Search in Google Scholar
[4] Rodgers, J., Hosh, S. (2008). NIR Analysis of Textiles. Handbook of near-infrared analysis. In: Burns, D, Ciurczak, E. (Eds.). (3rd ed.). CRC Press, Boca Raton, FL, USA.Search in Google Scholar
[5] Montalvo, J., Von Hoven, T. (2004). Analysis of cotton. Near-infrared spectroscopy in agriculture (pp. 671–728). In: Roberts, C., Workman, J., Reeves J. (Eds.). American Society of Agronomy, Agronomy Monograph No. 44, Madison, Wisconsin, USA.10.2134/agronmonogr44.c25Search in Google Scholar
[6] James, R., Keith, B. (2008). NIR characterization and measurement of the cotton content of dyed blend fabrics. Textile Research Journal, 79(8), 675–686.10.1177/0040517508090884Search in Google Scholar
[7] Jinfeng, Z., Lingjie, Y., Qian, D., Rongwu, W. (2019). Textile fiber identification using near-infrared spectroscopy and pattern recognition. AUTEX Research Journal, 19(2), 201–209.10.1515/aut-2018-0055Search in Google Scholar
[8] Yongliang, L., Chris, D., Todd, C., Vikki, M. (2016). Application of near infrared spectroscopy in cotton fiber micronaire measurement. Information Processing in Agriculture, 3, 30–35.10.1016/j.inpa.2016.01.001Search in Google Scholar
[9] Jing, H., Chongwen, Y. (2020). Fiber content determination in linen/viscose blends using NIR spectroscopy. Bioresources, 15(2), 3006–3016.Search in Google Scholar
[10] Thomasson, J. A., Manickavasagam, S., Mengu, M. P. (2009). Cotton fiber quality characterization with light scattering and fourier transform infrared techniques. Applied Spectroscopy, 63(3), 321–330.10.1366/000370209787598870Search in Google Scholar PubMed
[11] Saad, M. A., Alsaid, A. (2008). Almetwally. Spinning techniques vs. yarn properties. Textile Asia, 7, 35–41Search in Google Scholar
[12] Saad, M. A., Almetwally, A. A., Elkady, M. (2010). Measuring efficiency of dust filter fabrics. The Indian Textile Journal, 6, 67.Search in Google Scholar
[13] Almetwally, A. A., Mona, M. (2010). Comparison between mechanical properties of fabrics woven from compact and ring spun yarns. AUTEX Research Journal, 10(1), 35–40.10.1515/aut-2010-100107Search in Google Scholar
[14] Hassan, Y. M., El-Salmawy, A., Almetwally, A. (2010). Performance of woven fabrics containing spandex. Textile Asia, 120, 39–42.Search in Google Scholar
[15] AbouNassif, N. A. (2010). Subjective evaluation of garment. Journal of Textile Asia, 41(8), 28–32.Search in Google Scholar
[16] Sharrouf, A. A. M., Salem, M. M., Alsaid, A. (2010). Almetwally. Simple geometrical study of friction spun yarn structure. Textile Asia, 6, 25–27.Search in Google Scholar
[17] Mourad, M. M., El-Salmawy, A., Almetwally, A. A. (2011). Core spun yarn and the secret behind its popular appeal. Textile Asia, 42, 41–43.Search in Google Scholar
[18] Ramadan, M. A., El Sayed, G. A., Almetwally, A. A. (2012). Treatment of cotton fabrics using microwave and subsequent dyeing. Textile Asia, 43(3), 22–25.Search in Google Scholar
[19] Hu, X., Zhang, Q., Yu, H., Zhao, D., Dong, S., Zhou, W., et al. (2015). Quantitative analysis of naturally colored cotton and white cotton blends by UV–vis diffuse reflectance spectroscopy. Journal of Applied Spectroscopy, 81, 949–955.10.1007/s10812-015-0034-ySearch in Google Scholar
[20] Wendlant, W. W., Hecht, H. G. (1966). Reflectance spectroscopy. Wiley Interscience, New York.Search in Google Scholar
[21] Murphy, A. B. (2007). Band-gap determination from diffuse reflectance measurements of semiconductor films, and application to photoelectrochemical water-splitting. Solar Energy Materials and Solar Cells, 91, 1326−1337.10.1016/j.solmat.2007.05.005Search in Google Scholar
[22] Tauc, J., Grigorovici, R., Vancu, A. (1966). Optical properties and electronic structure of amorphous germanium. Physica Status Solidi B – Basic Solid State Physics, 15, 627−637.10.1002/pssb.19660150224Search in Google Scholar
[23] Davis, E., Mott, N. (1970). Conduction in non-crystalline systems V. Conductivity, optical absorption and photoconductivity in amorphous semiconductors. Philosophical Magazine Letters, 22, 0903−0922.10.1080/14786437008221061Search in Google Scholar
[24] Mott, N. F., Davis, E. A. (2012). Electronic processes in non-crystalline materials. Oxford University Press, Oxford.Search in Google Scholar
[25] Pankove, J. I. (1975). Optical processes in semiconductors. Dover Publications, New York.Search in Google Scholar
[26] Kubelka, P., Munk, F. A. (1931). Contribution to the optics of pigments. Z Technical Physics, 12, 593−599.Search in Google Scholar
[27] Lopez, R., Gómez, R. (2012). Band-gap energy estimation from diffuse reflectance measurements on Sol−Gel and commercial TiO2: A comparative study. Journal of Sol-Gel Science and Technology, 61, 1−7.10.1007/s10971-011-2582-9Search in Google Scholar
[28] Schwaninger, M., Rodrigues, J. C., Fackler, K. (2011). A review of band assignments in near infrared spectra of wood and wood components. Journal of Near Infrared Spectroscopy, 19(5), 287–308.10.1255/jnirs.955Search in Google Scholar
[29] Schimleck, L. R., Evans, R. (2004). Estimation of Pinus radiata D. Don tracheid morphological characteristics by near infrared spectroscopy. Holzforschung, 58(1), 66–73.10.1515/HF.2004.009Search in Google Scholar
[30] Zidan, A. S., Rahman, Z., Sayeed, V., Raw, A., Yu, L., Khan, M. A. (2012). Crystallinity evaluation of tacrolimus solid dispersions by chemometric analysis. International Journal of Pharmaceutics, 423(2), 341–350.10.1016/j.ijpharm.2011.11.003Search in Google Scholar PubMed
[31] Shenk, J. S., Workman, J. J., Westerhaus, M. O. (2007). Ch. 17. Handbook of near-infrared analysis (3rd edn). In: Burns, D. A., Ciurczak, E. W. (Eds.). CRC Press, London.Search in Google Scholar
[32] Huang, J., Yu, C. (2020). Fiber content determination of linen/viscose blends using NIR spectroscopy. Bioresources, 15(2), 3006–3016.10.15376/biores.15.2.3006-3016Search in Google Scholar
[33] Miryeong, S., David, S. H., Danny, E. A., Franklin, E. B. (2005). Fourier transform near-infrared spectroscopy for determining linen conten in linen/cotton blend products. Textile Research Journal, 75(8), 583–590.10.1177/0040517505057167Search in Google Scholar
© 2024 by the authors, published by De Gruyter
This work is licensed under the Creative Commons Attribution 4.0 International License.
Articles in the same Issue
- Characterization of viscoelastic properties of yarn materials: Dynamic mechanical analysis in the transversal direction
- Analysis of omni-channel implementations that are preferred by consumers in clothing sector
- Structural modeling and analysis of three-dimensional cross-linked braided preforms
- An experimental study of mechanical properties and comfortability of knitted imitation woven shirt fabrics
- Technology integration to promote circular economy transformation of the garment industry: a systematic literature review
- Research on T-shirt-style design based on Kansei image using back-propagation neural networks
- Research on She nationality clothing recognition based on color feature fusion with PSO-SVM
- Accuracy prediction of wearable flexible smart gloves
- Preparation and performance of stainless steel fiber/Lyocell fiber-blended weft-knitted fabric
- Development of an emotional response model for hospital gown design using structural equation modeling
- Preparation and properties of stainless steel filament/pure cotton woven fabric
- Facemask comfort enhancement with graphene oxide from recovered carbon waste tyres
- Use of enzymatic processes in the tanning of leather materials
- Optical-related properties and characterization of some textile fibers using near-infrared spectroscopy
- Network modeling of aesthetic effect for Chinese Yue Opera costume simulation images
- Predicting consumers’ garment fit satisfactions by using machine learning
- Non-destructive identification of wool and cashmere fibers based on improved LDA using NIR spectroscopy
- Study on the relationship between structure and moisturizing performance of seamless knitted fabrics of protein fibers for autumn and winter
- Antibacterial and yellowing performances of sports underwear fabric with polyamide/silver ion polyurethane filaments
- Numerical and experimental analysis of ballistic performance in hybrid soft armours composed of para-aramid triaxial and biaxial woven fabrics
- Phonetic smart clothing design based on gender awareness education for preschoolers
- Determination of anthropometric measurements and their application in the development of clothing sizing systems for women in the regions of the Republic of Croatia
- Research on optimal design of pleated cheongsam based on Kano–HOQ–Pugh model
- Numerical investigation of weaving machine heald shaft new design using composite material to improve its performance
- Corrigendum to “Use of enzymatic processes in the tanning of leather materials”
- Shaping of thermal protective properties of basalt fabric-based composites by direct surface modification using magnetron sputtering technique
- Numerical modeling of the heat flow component of the composite developed on the basis of basalt fabric
- Weft insertion guideway design based on high-temperature superconducting levitation
- Ultrasonic-assisted alkali hydrolysis of polyethylene terephthalate fabric and its effect on the microstructure and dyeing properties of fibers
- Comparative study on physical properties of bio-based PA56 fibers and wearability of their fabrics
- Investigation of the bias tape roll change time efficiency in garment factories
- Analysis of foot 3D scans of boys from Polish population
- Optimization of garment sewing operation standard minute value prediction using an IPSO-BP neural network
- Influence of repeated switching of current through contacts made of electroconductive fabrics on their resistance
- Numerical calculation of air permeability of warp-knitted jacquard spacer shoe-upper materials based on CFD
- Compact Spinning with Different Fibre Types: An Experimental Investigation on Yarn Properties in the Condensing Zone with 3D-Printed Guiding Device
- Modeling of virtual clothing and its contact with the human body
- Advances in personalized modelling and virtual display of ethnic clothing for intelligent customization
- Investigation of weave influence on flame retardancy of jute fabrics
- Balloonless spinning spindle head shape optimisation
- Research on 3D simulation design and dynamic virtual display of clothing flexible body
- Turkish textile and clothing SMEs: Importance of organizational learning, digitalization, and internationalization
- Corrigendum To: “Washing characterization of compression socks”
- Study on the promotion multiple of blood flow velocity on human epidermal microcirculation of volcanic rock polymer fiber seamless knitted fabric
- Bending properties and numerical analysis of nonorthogonal woven composites
- Bringing the queen mother of the west to life: Digital reconstruction and analysis of Taoist Celestial Beings Worshiping mural’s apparel
- Modeling process for full forming sports underwear
- Retraction of: Ionic crosslinking of cotton
- An observational study of female body shape characteristics in multiracial Malaysia
- Study on theoretical model and actual deformation of weft-knitted transfer loop based on particle constraint
- Design and 3D simulation of weft-knitted jacquard plush fabrics
- An overview of technological challenges in implementing the digital product passport in the textile and clothing industry
- Understanding and addressing the water footprint in the textile sector: A review
- Determinants of location changes in the clothing industry in Poland
- Influence of cam profile errors in a modulator on the dynamic response of the heald frame
- Quantitative analysis of wool and cashmere fiber mixtures using NIR spectroscopy
- 3D simulation of double-needle bar warp-knitted clustered pile fabrics on DFS
- Finite element analysis of heat transfer behavior in glass fiber/metal composite materials under constant heat load
- Price estimation and visual evaluation of actual white fabrics used for dress shirts and their photographic images
- Effect of gluing garment materials with adhesive inserts on their multidirectional drape and bending rigidity
- Optimization analysis of carrier-track collision in braiding process
- Numerical and experimental analysis of the ballistic performance of soft bulletproof vests for women
- The antimicrobial potential of plant-based natural dyes for textile dyeing: A systematic review using prisma
- Influence of sewing parameters on the skin–fabric friction
- Validation by experimental study the relationship between fabric tensile strength and weave structures
- Optimization of fabric’s tensile strength and bagging deformation using surface response and finite element in stenter machine
- Analysis of lean manufacturing waste in the process flow of ready-to-wear garment production in Nigeria
- An optimization study on the sol–gel process to obtain multifunctional denim fabrics
- Drape test of fully formed knitted flared skirts based on 3D-printed human body posture
- Supplier selection models using fuzzy hybrid methods in the clothing textile industry