Analysis of foot 3D scans of boys from Polish population
-
Robert Gajewski
 ,
Joanna Kwiecień
,
Joanna Kwiecień

Abstract
In Poland, the currently used lasts are based on data obtained in the 1970s. These data may be largely out of date, which is due to changes resulting from secular trends, migration changes, and, above all, the fact that there are now tools that enable measurements to be made with significantly higher precision. Such tools are 3D scanners. In this article, we present the results of children’s foot measurements taken using a 3D scanner. We collected data on the feet dimensions obtained with the 3D scanner for boys in the age range of 4–13. We have obtained data on dimensions, proportions, and the rate of changes in consecutive years. The obtained data confirmed the increase in dimensions of the children’s feet as well as changes in proportions. These data will be used for development of new standard for lasts. The aim of the study was to collect anthropometrical data on boys’ feet dimensions.
1 Introduction
Footwear has been used by us for many thousands of years. The oldest known footwear found in Armenia is estimated to be approximately 5,500 years old [1]. The examples of footwear used first were probably used much earlier. For millennia, footwear was essentially made to measure. Attempts were made to make mass-produced footwear, especially for the army and the most famous case of which are the shoes of the Napoleonic army. In this case, uniformity went so far that universal shoes were applied for the left and right foot, which can be considered regression in attempts to provide the wearer with comfort. It was only at the end of the nineteenth century that we could talk about the emergence of the footwear industry producing shoes on a mass scale for “anonymous” customers.
The shape of the shoe is determined by the shoe last. Wearing comfort largely depends on its parameters. In the case of children’s shoes, it should also be taken into account that ill-fitting shoes or shoes with the non-anatomical shape may cause deformations of children’s feet. There is controversy about how proper footwear for children should be constructed, but the fact that footwear can influence them is widely accepted and confirmed by a number of publications in which populations using footwear vs walking barefoot were compared [3,4,5,6].
The basis for developing lasts is the knowledge of the foot dimensions of a given population. In Poland, the first anthropometric measurements of feet carried out on a mass scale took place in 1955–1959. The research was conducted by the Anthropometry Commission of the Polish Academy of Sciences in Wrocław. Further research conducted by IPS Łódź took place in 1968 and 1973 (the results of the latter were the basis for the construction of official standards for lasts’ design [PN-O-91050:1971 – Kopyta do przemysłowej produkcji obuwia – Kopyta zasadnicze]). Subsequent research was carried out in 1985 (the last nationwide anthropometric measurements) and 1996 – a test at the Central Laboratory of Footwear Industry in Kraków as part of the project: “Development of a system of preventive measures aimed at protecting the health of children’s feet.” The most up-to-date database of anthropometric measurements of children’s feet is the population of 11,500 children aged 0–15 examined as part of the BARTEK Healthy Foot Academy 2007–2013. The research conducted by IPS Kraków consisted of taking a static image of the foot, anthropometric measurements using hand-held measuring devices, and an orthopedic assessment of the health condition of the feet [2].
The awareness of the phenomenon of the secular trend in the foot dimensions leads to a hypothesis that contemporary footwear designed on the basis of data from the 1970s to 1980s is not adapted to the foot dimensions of today’s population – especially in children [13].
The phenomenon of the secular trend in the children’s feet is confirmed by the research of the Łukasiewicz-ŁIT (former: Institute of Leather Industry in Kraków) [13]. Taking an advantage of implementation of modern anthropometric tools, 3D scanners, we are the pioneers in Poland in measuring the children’s feet with 3D scanning technology.
The literature shows that there are data confirming that nearly 66% of the adult population wear footwear that is not adjusted to the foot size, mainly in width parameter [14]. It is due to the fact that it is possible to buy longer or shorter shoes to adjust to your feet but majority of shoes is available in one width only, consecutively, it is necessary to investigate if it is necessary to modify existing standards for lasts.
Obtaining the dimensions of the feet is not sufficient to prepare the shoe lasts. The last is not a perfect “copy” of the foot and merely averaging the results is not enough. It is necessary to translate the obtained foot dimensions into last parameters. The shape of the last must be designed in such a way that the footwear is comfortable on the one hand and aesthetic on the other. The best example of this is the need to secure additional space in footwear, especially in the forefoot.
This applies, e.g., to the functional allowance (the space between the toes and the upper part where the toes move cyclically while walking) and the fashion allowance (additional space for the toes providing them with adequate space, which is especially important in shoes with a narrow toe). The functional allowance is particularly important because in extreme cases, the foot can move forward by 13 mm (two numbers in the French size system) [7].
In the case of children’s shoes, narrow toes are not usually used, so there is no need to modify significantly the longitudinal profile of the last due to the height of the heel; however, the fact that children’s feet grow constantly, which may amount to 10 mm per year, should be taken into account [7].
There are a number of methods for designing lasts based on the results of manual measurements, such as construction of the bottom of the last by Heinrich Meier, Franciszek Schneider, H. Macy [8], or the method used in Poland described in the industry standard BN-73/7781-04.
3D scanning has a number of advantages over manual measurements. First of all, it has higher accuracy and lower risk of measurement error [9]. In terms of technology development, there has been an exponential growth in 3D scanning technologies with various applications in recent years [11,12] that claim accuracy within 1 mm.
However, the introduction of 3D scanning has one major drawback. So far, no new methods have been developed to transfer the results from 3D scanning to the last. Classical methods used to design lasts based on manual measurements are inappropriate for scanner results because the results are incomparable [9,19]. An additional difficulty is the fact that regarding the differences between scanner measurement and manual methods, the results obtained by one method cannot be converted into the results from the other method (there are no consistent rules) [10].
The aim of the study was to collect anthropometrical data on boys’ feet dimensions with a new, more precise tool – 3D scanner. In the long-term aim, these data will be used to update standards for design of footwear lasts used in industry.
2 Experimental method
Experimental research was undertaken on a sample of children from Poland. It included foremost populations from the region of Małopolska, Łódź Voivodeship, and Warszawa. Most of the children represented urbanized areas (85%), which reflects the general population in Poland. Exclusion criteria included severe foot deformations and amputations. Measurements were made for boys in the age between 1 and 17 years of age; however, in age categories 1–2 and 14–17, the number of children was insignificant, therefore in this work, data are given for boys between 4 and 13 years of age. Demographic data of children are presented in Table 1.
Demographic data of boys involved in the study
| Age | Boys |
|---|---|
| 4 | 39 |
| 5 | 29 |
| 6 | 41 |
| 7 | 121 |
| 8 | 130 |
| 9 | 132 |
| 10 | 77 |
| 11 | 79 |
| 12 | 69 |
| 13 | 68 |
| Total | 785 |
Age was defined as the number of completed years. It means that a child aged 4 years, 1 day was assigned to age group 4. Foot measurements of children aged 4 ÷ 13 years were carried out using a 3D Laser FULL Foot Scanner, which allows obtaining a scan of the child’s entire foot along with specific foot dimensions.The scanner allows us to determine length, width, height, and circumference measurements. They constitute the basic categories of anthropometric measurements used for population monitoring as well as footwear design.
The software automatically calculated measurements according to the built-in algorithm taking into account anatomical point on the foot. However, it was possible to correct the measurement if after visual inspection it was found that the measurements were made incorrectly. Data were collected for both feet.
Data collection was made as follows: Before every measurement the scanner was disinfected. This procedure was to avoid transmission of infection and measurement errors due to particles adhered to the foot surface. During measurements, participants stood on a glass plate and positioned their right and left feet in the scanner using a stable standing posture, avoiding any foot movement. Both legs of the participants were on the same level thanks to the attached to the scanner adjusting supports (Figure 1). After a successful scan, the foot was removed from the scanner and replaced by the other. The process of scanning of one foot lasts about 13 s. In case of some children, it was difficult to keep them motionless for that period and measurements were to be repeated. In some cases, the measurement was unsuccessful; therefore, their results have not been recorded. Another problem was the fact that in our scanner, the side walls were 8.5 cm thick, and consecutively, particularly small children had to stay in moderate stride.
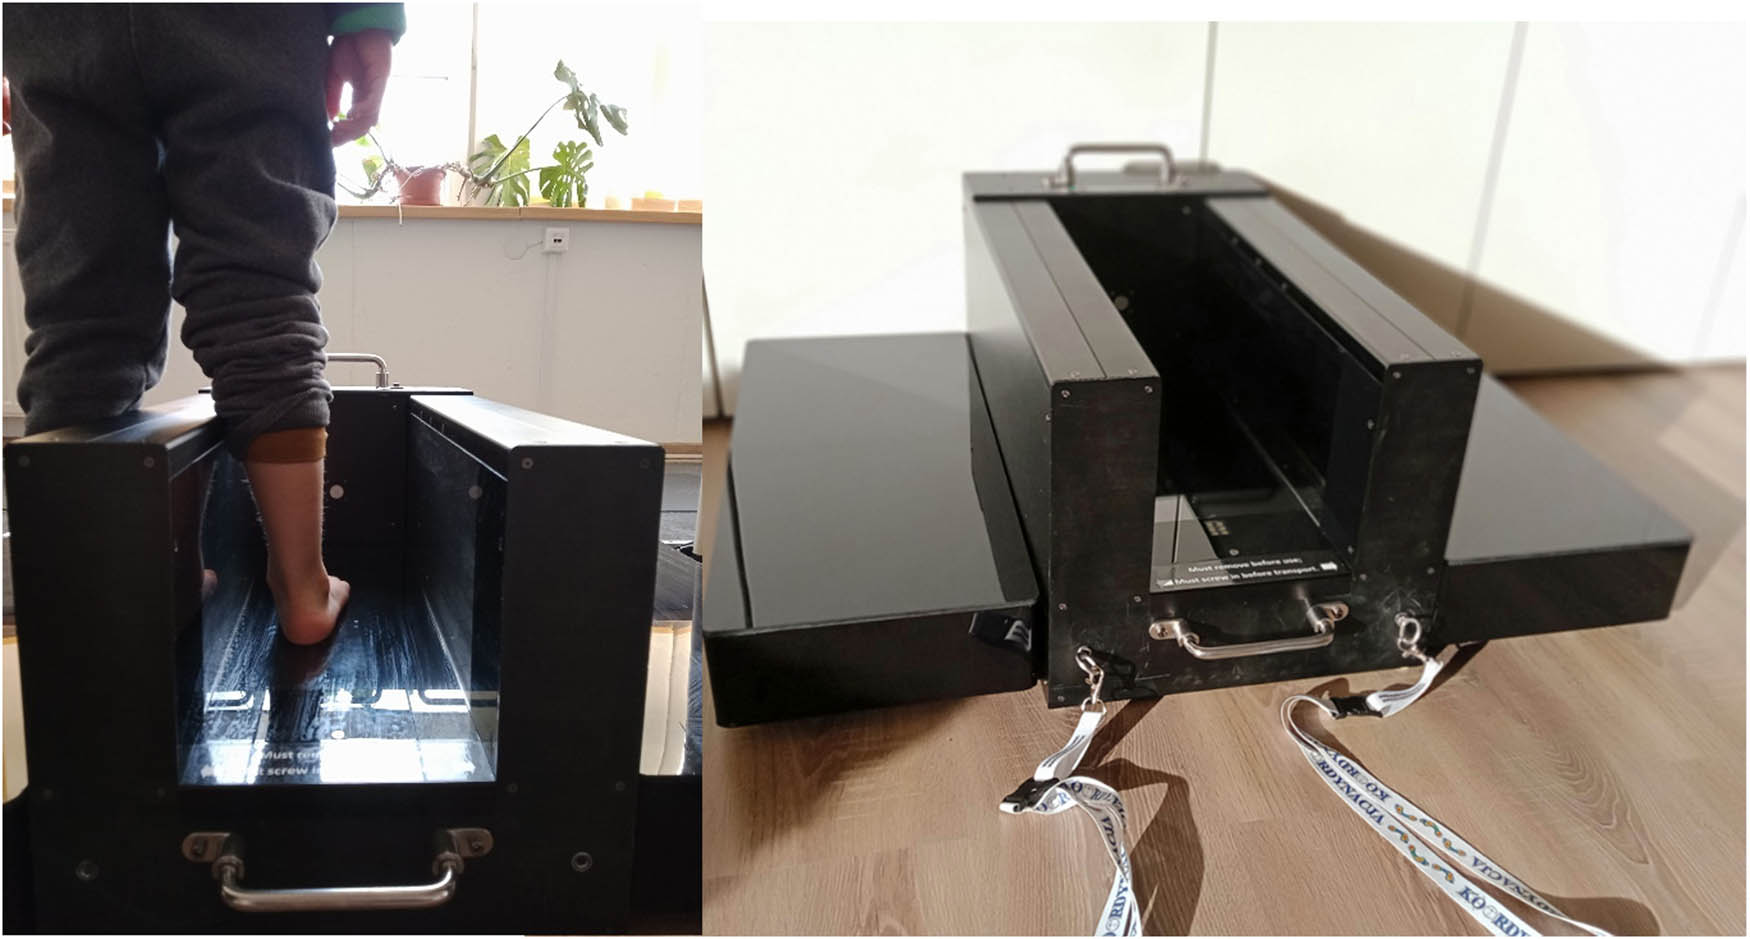
The appearance of the 3D scanning station.
The operator checked all foot scanning images and manually removed the artifacts when necessary after each scan. Since the measurements were made at schools and kindergarten, more detailed analysis and removal of artifacts and correction of measurements were made later.
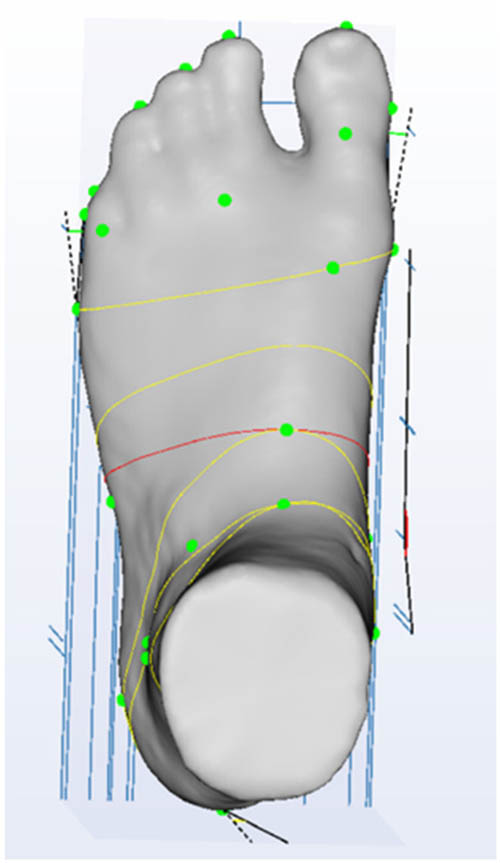
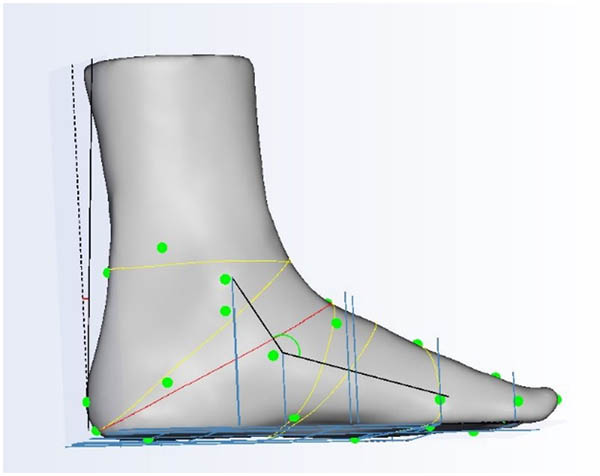
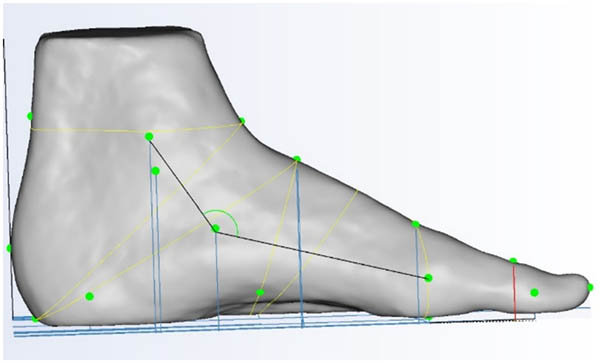
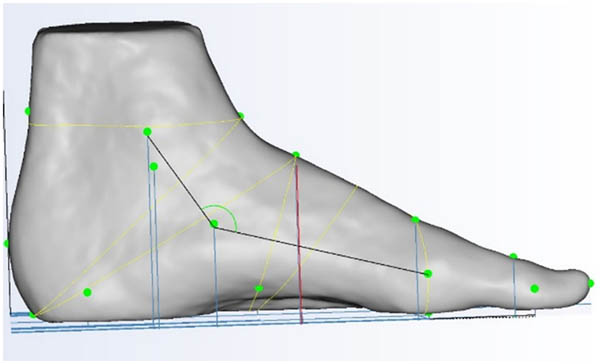
The following data were collected (the given measurement is highlighted by red line in Figures 2–8):
Foot length (distance from the most rearmost point of the foot along the axis of the foot determined in forefoot by a point in the middle between 1 and 5 metatarsal points [Figure 2]). Usually, the most forward point was placed on the second toe. These points correspond to Pternion point [15] in the rearfoot and Pododaktylion II [16].
Instep girth (circumferential dimension taken along point placed on dorsal part of the foot in the place corresponding to os cuneiform intermedium [Figure 5]).
Long heel girth (circumferential dimension through the middle of the heel and the point placed on dorsal part of the foot in the place corresponding to os cuneiform intermedium [Figures 6]).
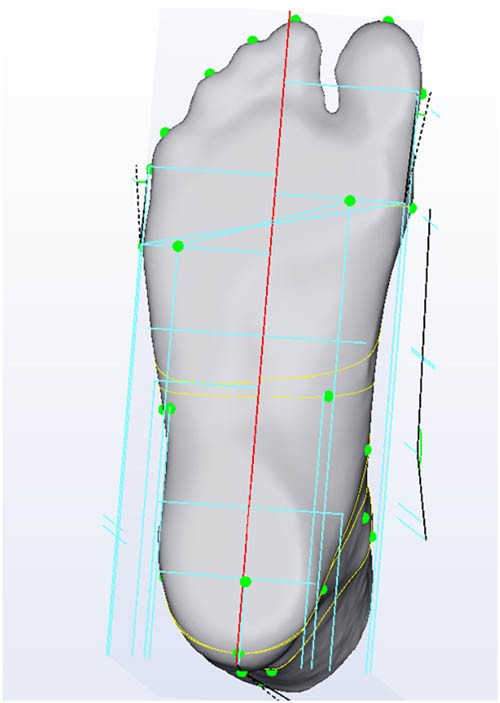
Foot length.
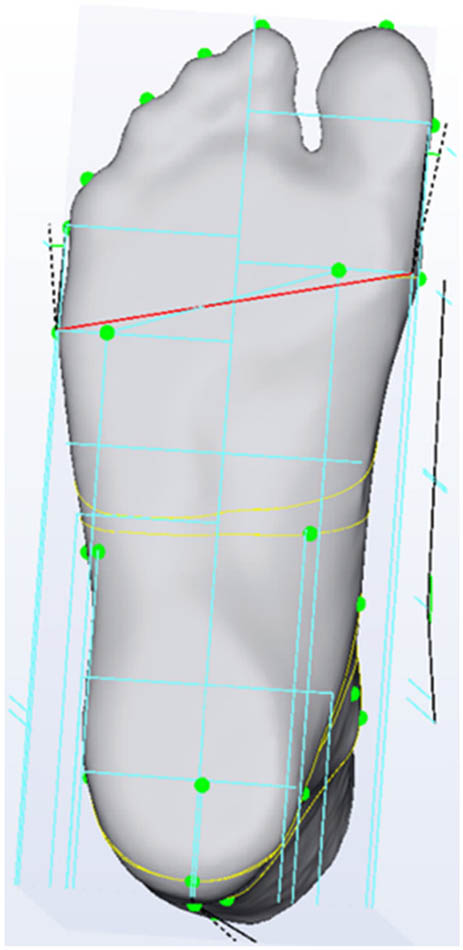
Forefoot width measurement.
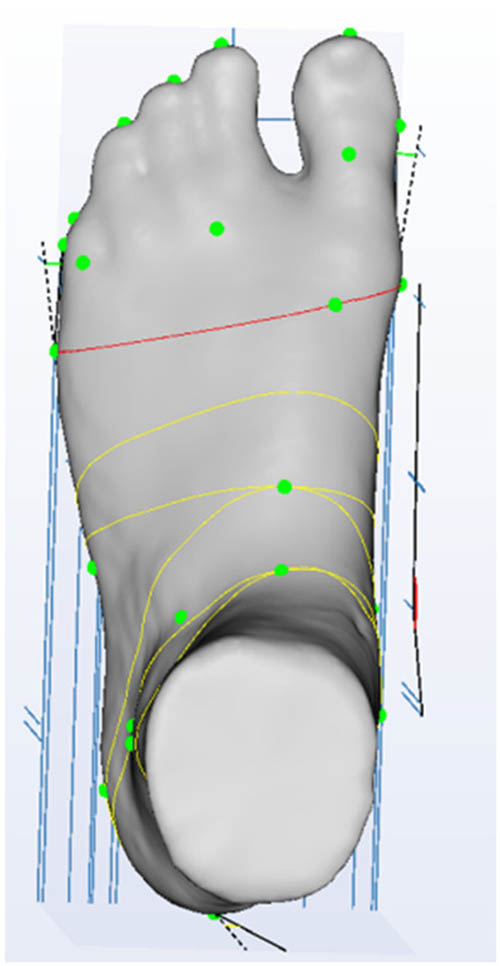
Ball girth.
Instep girth.
Long heel girth.
First toe metatarsal joint height.
Instep height.
The most significant difference between manual and 3D scanning measurements concerns foot length measurements. Although the measurement point on the heel is located where measurements are taken manually (Pternion), the front point is different. In manual measurements, the front point is the Acropodion. Usually Acropodion is on the first toe, sometimes on the second, whereas in 3D scanning the forward point is in point Pododaktylion II [16]. Therefore, theoretically dimensions reported with 3D scanner should be shorter.
3 Results and discussion
Tables 2–9 summarize the obtained results for every parameter. Data are presented for left and right feet separately and together. However, one should state that, according to the results of Student’s t-test, at 0.05 significance level difference between left and right foot in relation to every parameter was insignificant. Data are presented in graphic format in Figures 9–16. Data “L + R” given in the tables were calculated as an average of all left and right feet together.
Summary of statistical parameters analyzed for foot length
| 4 | 5 | 6 | |||||||
|---|---|---|---|---|---|---|---|---|---|
| Left | Right | L + R | Left | Right | L + R | Left | Right | L + R | |
| Average | 166.9 | 166.8 | 166.8 | 179.7 | 179.7 | 179.7 | 187.2 | 186.9 | 187.0 |
| SD | 10.4 | 10.9 | 10.6 | 10.3 | 10.7 | 10.4 | 12.0 | 11.5 | 11.7 |
| Min. | 143.9 | 145.5 | 143.9 | 165.0 | 164.3 | 164.3 | 155.1 | 158.6 | 155.1 |
| Max. | 191.7 | 193.5 | 193.5 | 198.5 | 202.9 | 202.9 | 218.1 | 219.7 | 219.7 |
| 7 | 8 | 9 | |||||||
|---|---|---|---|---|---|---|---|---|---|
| Left | Right | L + R | Left | Right | L + R | Left | Right | L + R | |
| Average | 200.5 | 200.5 | 200.5 | 209.1 | 209.2 | 209.1 | 216.9 | 217.0 | 217.0 |
| SD | 12.3 | 12.0 | 12.2 | 11.3 | 10.9 | 11.1 | 12.6 | 12.8 | 12.7 |
| Min. | 169.5 | 170.2 | 169.5 | 184.7 | 186.2 | 184.7 | 191.6 | 187.6 | 187.0 |
| Max. | 233.9 | 234.3 | 234.3 | 235.9 | 233.1 | 235.9 | 248.6 | 250.2 | 250.2 |
| 10 | 11 | 12 | 13 | |||||||||
|---|---|---|---|---|---|---|---|---|---|---|---|---|
| Left | Right | L + R | Left | Right | L + R | Left | Right | L + R | Left | Right | L + R | |
| Average | 224.1 | 224.2 | 224.1 | 233.2 | 234.2 | 233.7 | 244.6 | 244.6 | 244.6 | 252.8 | 252.4 | 252.6 |
| SD | 12.9 | 13.2 | 13.0 | 11.1 | 11.0 | 18.7 | 15.1 | 14.9 | 15.0 | 13.8 | 13.3 | 13.5 |
| Min. | 192.0 | 195.1 | 192.0 | 206.5 | 206.2 | 206.2 | 211.0 | 209.0 | 209.0 | 219.0 | 220.6 | 219.0 |
| Max. | 259.4 | 259.8 | 259.8 | 262.3 | 261.8 | 262.3 | 275.1 | 275.1 | 275.1 | 278.1 | 279.0 | 279.0 |
Summary of statistical parameters analyzed for the forefoot width
| 4 | 5 | 6 | |||||||
|---|---|---|---|---|---|---|---|---|---|
| Left | Right | L + R | Left | Right | L + R | Left | Right | L + R | |
| Average | 67.9 | 70.9 | 69.4 | 72.0 | 72.5 | 72.2 | 74.1 | 74.7 | 74.4 |
| SD | 2.5 | 16.2 | 11.5 | 3.4 | 3.6 | 3.5 | 3.5 | 4.1 | 3.8 |
| Min. | 64.1 | 62.7 | 62.7 | 65.7 | 65.9 | 65.7 | 67.3 | 66.7 | 66.7 |
| Max. | 76.0 | 166.5 | 166.5 | 80.1 | 80.8 | 80.8 | 80.6 | 82.8 | 82.8 |
| 7 | 8 | 9 | |||||||
|---|---|---|---|---|---|---|---|---|---|
| Left | Right | L + R | Left | Right | L + R | Left | Right | L + R | |
| Average | 77.6 | 78.1 | 77.8 | 80.7 | 81.1 | 80.9 | 84.4 | 84.7 | 84.5 |
| SD | 3.7 | 3.8 | 3.7 | 3.5 | 3.7 | 3.6 | 4.0 | 4.1 | 4.0 |
| Min. | 68.1 | 69.2 | 68.1 | 70.0 | 71.1 | 70.0 | 76.2 | 75.8 | 75.8 |
| Max. | 88.5 | 89.3 | 89.3 | 91.1 | 90.3 | 91.1 | 94.6 | 95.6 | 95.6 |
| 10 | 11 | 12 | 13 | |||||||||
|---|---|---|---|---|---|---|---|---|---|---|---|---|
| Left | Right | L + R | Left | Right | L + R | Left | Right | L + R | Left | Right | L + R | |
| Average | 88.0 | 88.2 | 88.1 | 91.8 | 92.0 | 91.9 | 96.6 | 97.0 | 96.8 | 100.7 | 101.0 | 100.9 |
| SD | 3.9 | 4.1 | 4.0 | 5.4 | 5.5 | 5.5 | 5.7 | 5.4 | 5.5 | 6.0 | 6.2 | 6.1 |
| Min. | 79.3 | 79.9 | 79.3 | 82.0 | 81.6 | 81.6 | 84.2 | 85.0 | 84.2 | 88.7 | 87.4 | 87.4 |
| Max. | 97.9 | 96.6 | 97.9 | 107.1 | 109.1 | 109.1 | 112.3 | 111.5 | 112.3 | 115.0 | 116.2 | 116.2 |
Summary of statistical parameters analyzed for the ball girth
| 4 | 5 | 6 | |||||||
|---|---|---|---|---|---|---|---|---|---|
| Left | Right | L + R | Left | Right | L + R | Left | Right | L + R | |
| Average | 167.1 | 168.0 | 167.5 | 176.3 | 177.7 | 177.0 | 175.7 | 178.1 | 182.9 |
| SD | 7.1 | 7.5 | 7.2 | 8.3 | 8.3 | 8.2 | 193.9 | 196.4 | 8.4 |
| Min. | 156.1 | 153.2 | 153.2 | 159.9 | 162.5 | 159.9 | 182.1 | 183.7 | 166.4 |
| Max. | 186.7 | 184.2 | 186.7 | 196.5 | 195.6 | 196.5 | 8.0 | 8.8 | 203.3 |
| 7 | 8 | 9 | |||||||
|---|---|---|---|---|---|---|---|---|---|
| Left | Right | L + R | Left | Right | L + R | Left | Right | L + R | |
| Average | 190.4 | 191.7 | 191.0 | 198.5 | 199.3 | 198.9 | 206.7 | 207.7 | 207.2 |
| SD | 8.9 | 8.7 | 8.8 | 8.4 | 8.4 | 8.4 | 9.7 | 9.7 | 9.7 |
| Min. | 166.8 | 171.0 | 166.8 | 174.1 | 176.3 | 174.1 | 186.0 | 187.2 | 186.0 |
| Max. | 212.0 | 213.6 | 213.6 | 221.9 | 223.1 | 223.1 | 232.5 | 234.1 | 234.1 |
| 10 | 11 | 12 | 13 | |||||||||
|---|---|---|---|---|---|---|---|---|---|---|---|---|
| Left | Right | L + R | Left | Right | L + R | Left | Right | L + R | Left | Right | L + R | |
| Average | 214.4 | 215.9 | 215.1 | 224.5 | 225.5 | 225.0 | 234.6 | 232.6 | 233.6 | 244.8 | 245.6 | 245.2 |
| SD | 9.3 | 9.4 | 9.3 | 12.3 | 12.9 | 12.6 | 13.1 | 28.6 | 22.2 | 13.2 | 13.4 | 13.3 |
| Min. | 196.0 | 199.4 | 196.0 | 201.0 | 201.8 | 201.0 | 208.8 | 208.7 | 201.0 | 219.0 | 216.4 | 216.4 |
| Max. | 238.1 | 239.6 | 239.6 | 257.5 | 262.7 | 262.7 | 269.9 | 267.9 | 269.9 | 278.1 | 280.2 | 280.2 |
Summary of statistical parameters analyzed for the instep girth
| 4 | 5 | 6 | |||||||
|---|---|---|---|---|---|---|---|---|---|
| Left | Right | L + R | Left | Right | L + R | Left | Right | L + R | |
| Average | 173.4 | 172.9 | 173.1 | 180.6 | 179.1 | 179.8 | 187.7 | 187.9 | 187.8 |
| SD | 15.1 | 13.3 | 14.1 | 10.5 | 10.1 | 10.3 | 12.4 | 12.7 | 12.5 |
| Min. | 157.3 | 154.1 | 154.1 | 160.1 | 159.3 | 159.3 | 173.0 | 170.7 | 170.7 |
| Max. | 255.5 | 231.5 | 255.5 | 210.7 | 205.6 | 210.7 | 228.2 | 230.7 | 230.7 |
| 7 | 8 | 9 | |||||||
|---|---|---|---|---|---|---|---|---|---|
| Left | Right | L + R | Left | Right | L + R | Left | Right | L + R | |
| Average | 194.4 | 193.0 | 193.7 | 204.7 | 204.0 | 204.3 | 210.0 | 208.0 | 209.0 |
| SD | 12.2 | 10.5 | 11.4 | 11.8 | 11.4 | 11.6 | 10.2 | 19.4 | 15.4 |
| Min. | 169.3 | 169.6 | 169.3 | 180.5 | 180.5 | 180.5 | 186.4 | 23.3 | 23.3 |
| Max. | 260.9 | 245.3 | 260.9 | 261.1 | 251.3 | 261.1 | 250.0 | 260.9 | 260.9 |
| 10 | 11 | 12 | 13 | |||||||||
|---|---|---|---|---|---|---|---|---|---|---|---|---|
| Left | Right | L + R | Left | Right | L + R | Left | Right | L + R | Left | Right | L + R | |
| Average | 218.4 | 218.9 | 218.6 | 227.5 | 227.3 | 227.4 | 237.1 | 235.8 | 236.5 | 249.6 | 247.7 | 248.6 |
| SD | 12.8 | 12.4 | 12.5 | 12.0 | 12.3 | 12.1 | 12.8 | 11.3 | 12.1 | 14.4 | 12.9 | 13.7 |
| Min. | 198.1 | 197.9 | 197.9 | 202.4 | 203.6 | 202.4 | 210.1 | 206.3 | 202.4 | 220.5 | 222.3 | 220.5 |
| Max. | 280.0 | 266.8 | 280.0 | 263.0 | 263.0 | 263.0 | 285.0 | 266.2 | 285.0 | 298.5 | 292.3 | 298.5 |
Summary of statistical parameters analyzed for the long heel girth
| 4 | 5 | 6 | |||||||
|---|---|---|---|---|---|---|---|---|---|
| Left | Right | L + R | Left | Right | L + R | Left | Right | L + R | |
| Average | 219.2 | 219.4 | 219.3 | 237.6 | 236.0 | 236.8 | 253.9 | 253.8 | 253.9 |
| SD | 27.5 | 25.2 | 26.2 | 23.1 | 23.4 | 23.0 | 13.5 | 13.7 | 13.5 |
| Min. | 159.2 | 160.8 | 159.2 | 173.9 | 171.8 | 171.8 | 178.7 | 179.8 | 178.7 |
| Max. | 249.8 | 246.1 | 249.8 | 259.2 | 261.0 | 261.0 | 269.1 | 273.7 | 273.7 |
| 7 | 8 | 9 | |||||||
|---|---|---|---|---|---|---|---|---|---|
| Left | Right | L + R | Left | Right | L + R | Left | Right | L + R | |
| Average | 267.5 | 267.4 | 267.4 | 283.5 | 284.7 | 284.1 | 297.5 | 296.1 | 296.8 |
| SD | 14.6 | 15.2 | 14.8 | 11.4 | 8.8 | 10.2 | 10.1 | 10.6 | 10.3 |
| Min. | 185.4 | 187.3 | 185.4 | 183.8 | 264.0 | 183.8 | 228.1 | 213.9 | 213.9 |
| Max. | 301.9 | 289.3 | 301.9 | 302.0 | 313.0 | 313.0 | 321.1 | 316.8 | 321.1 |
| 10 | 11 | 12 | 13 | |||||||||
|---|---|---|---|---|---|---|---|---|---|---|---|---|
| Left | Right | L + R | Left | Right | L + R | Left | Right | L + R | Left | Right | L + R | |
| Average | 308.5 | 308.4 | 308.5 | 321.0 | 319.1 | 320.1 | 333.8 | 332.9 | 333.3 | 347.8 | 344.4 | 346.1 |
| SD | 7.6 | 8.5 | 8.0 | 13.8 | 13.7 | 13.7 | 10.1 | 10.1 | 10.1 | 23.6 | 26.8 | 25.2 |
| Min. | 290.5 | 287.8 | 287.8 | 231.1 | 230.5 | 230.5 | 313.4 | 312.1 | 230.5 | 244.2 | 242.8 | 242.8 |
| Max. | 331.1 | 329.0 | 331.1 | 357.2 | 347.6 | 357.2 | 385.0 | 356.6 | 385.0 | 375.3 | 375.7 | 375.7 |
Summary of statistical parameters analyzed for the toe hip height
| 4 | 5 | 6 | |||||||
|---|---|---|---|---|---|---|---|---|---|
| Left | Right | L + R | Left | Right | L + R | Left | Right | L + R | |
| Average | 13.4 | 13.4 | 13.4 | 14.5 | 14.9 | 14.7 | 14.9 | 15.0 | 15.0 |
| SD | 0.9 | 1.2 | 1.1 | 1.3 | 1.2 | 1.2 | 1.5 | 1.8 | 1.7 |
| Min. | 11.9 | 11.1 | 11.1 | 12.9 | 12.6 | 12.6 | 11.7 | 12.4 | 11.7 |
| Max. | 15.3 | 16.4 | 16.4 | 18.4 | 17.4 | 18.4 | 21.3 | 20.8 | 21.3 |
| 7 | 8 | 9 | |||||||
|---|---|---|---|---|---|---|---|---|---|
| Left | Right | L + R | Left | Right | L + R | Left | Right | L + R | |
| Average | 15.6 | 15.9 | 15.8 | 16.0 | 16.4 | 16.2 | 16.7 | 17.3 | 17.0 |
| SD | 2.0 | 2.1 | 2.0 | 1.5 | 1.6 | 1.6 | 1.6 | 1.7 | 1.6 |
| Min. | 12.2 | 11.8 | 11.8 | 11.7 | 12.9 | 11.7 | 12.7 | 13.5 | 12.7 |
| Max. | 31.5 | 31.8 | 31.8 | 20.7 | 20.6 | 20.7 | 21.1 | 20.8 | 21.1 |
| 10 | 11 | 12 | 13 | |||||||||
|---|---|---|---|---|---|---|---|---|---|---|---|---|
| Left | Right | L + R | Left | Right | L + R | Left | Right | L + R | Left | Right | L + R | |
| Average | 17.3 | 17.4 | 17.4 | 18.0 | 18.4 | 18.2 | 18.6 | 19.0 | 18.8 | 19.9 | 20.6 | 20.2 |
| SD | 1.4 | 1.6 | 1.5 | 1.7 | 1.8 | 1.7 | 1.7 | 1.9 | 1.8 | 1.6 | 1.6 | 1.7 |
| Min. | 13.9 | 13.5 | 13.5 | 13.0 | 13.4 | 13.0 | 14.0 | 14.4 | 13.0 | 17.1 | 17.6 | 17.1 |
| Max. | 20.3 | 21.0 | 21.0 | 22.0 | 21.8 | 22.0 | 23.0 | 23.8 | 23.8 | 24.8 | 25.5 | 25.5 |
Summary of statistical parameters analyzed for the first metatarsal joint height
| 4 | 5 | 6 | |||||||
|---|---|---|---|---|---|---|---|---|---|
| Left | Right | L + R | Left | Right | L + R | Left | Right | L + R | |
| Average | 25.9 | 25.5 | 25.7 | 26.7 | 26.8 | 26.8 | 27.6 | 27.2 | 27.4 |
| SD | 1.7 | 2.2 | 2.0 | 1.9 | 1.8 | 1.9 | 3.1 | 3.1 | 3.1 |
| Min. | 22.7 | 21.3 | 21.3 | 20.6 | 21.4 | 20.6 | 17.8 | 15.9 | 15.9 |
| Max. | 28.6 | 29.4 | 29.4 | 30.0 | 30.6 | 30.6 | 32.0 | 31.7 | 32.0 |
| 7 | 8 | 9 | |||||||
|---|---|---|---|---|---|---|---|---|---|
| Left | Right | L + R | Left | Right | L + R | Left | Right | L + R | |
| Average | 28.3 | 27.8 | 28.0 | 28.6 | 28.3 | 28.5 | 30.1 | 29.8 | 29.9 |
| SD | 3.6 | 3.3 | 3.4 | 4.7 | 4.6 | 4.6 | 4.3 | 4.0 | 4.2 |
| Min. | 18.4 | 19.0 | 18.4 | 19.1 | 18.8 | 18.8 | 18.1 | 18.5 | 18.1 |
| Max. | 35.6 | 32.9 | 35.6 | 53.1 | 51.1 | 53.1 | 36.9 | 37.6 | 37.6 |
| 10 | 11 | 12 | 13 | |||||||||
|---|---|---|---|---|---|---|---|---|---|---|---|---|
| Left | Right | L + R | Left | Right | L + R | Left | Right | L + R | Left | Right | L + R | |
| Average | 30.9 | 30.7 | 30.8 | 33.3 | 32.8 | 33.1 | 33.6 | 33.1 | 33.4 | 34.9 | 34.0 | 34.4 |
| SD | 4.0 | 4.2 | 4.1 | 3.9 | 3.6 | 3.7 | 4.3 | 4.1 | 4.2 | 4.4 | 4.2 | 4.3 |
| Min. | 21.4 | 22.1 | 21.4 | 23.4 | 21.7 | 21.7 | 25.1 | 24.1 | 21.7 | 24.1 | 24.0 | 24.0 |
| Max. | 36.6 | 37.6 | 37.6 | 40.6 | 39.2 | 40.6 | 41.6 | 40.6 | 41.6 | 42.6 | 41.3 | 42.6 |
Summary of statistical parameters analyzed for the instep height
| 4 | 5 | 6 | |||||||
|---|---|---|---|---|---|---|---|---|---|
| Left | Right | L + R | Left | Right | L + R | Left | Right | L + R | |
| Average | 43.4 | 43.8 | 43.6 | 45.3 | 46.1 | 45.7 | 47.4 | 47.0 | 47.2 |
| SD | 2.8 | 3.0 | 2.9 | 4.6 | 4.4 | 4.4 | 5.8 | 5.2 | 5.5 |
| Min. | 37.6 | 38.5 | 37.6 | 31.2 | 31.1 | 31.1 | 29.4 | 29.8 | 29.4 |
| Max. | 49.5 | 50.7 | 50.7 | 51.7 | 53.5 | 53.5 | 55.6 | 53.4 | 55.6 |
| 7 | 8 | 9 | |||||||
|---|---|---|---|---|---|---|---|---|---|
| Left | Right | L + R | Left | Right | L + R | Left | Right | L + R | |
| Average | 48.1 | 47.9 | 48.0 | 48.2 | 48.3 | 48.2 | 51.5 | 51.6 | 51.6 |
| SD | 7.9 | 7.3 | 7.6 | 9.6 | 9.7 | 9.6 | 9.2 | 9.2 | 9.2 |
| Min. | 29.8 | 29.8 | 29.8 | 30.7 | 31.1 | 30.7 | 30.8 | 31.3 | 30.8 |
| Max. | 63.4 | 58.9 | 63.4 | 63.5 | 65.9 | 65.9 | 66.0 | 65.4 | 66.0 |
| 10 | 11 | 12 | 13 | |||||||||
|---|---|---|---|---|---|---|---|---|---|---|---|---|
| Left | Right | L + R | Left | Right | L + R | Left | Right | L + R | Left | Right | L + R | |
| Average | 52.6 | 52.5 | 52.6 | 57.5 | 57.5 | 57.5 | 57.2 | 56.9 | 57.0 | 58.1 | 58.3 | 58.2 |
| SD | 9.5 | 10.0 | 9.7 | 8.8 | 9.0 | 8.9 | 11.2 | 11.0 | 11.1 | 11.3 | 11.5 | 11.4 |
| Min. | 33.7 | 32.7 | 32.7 | 32.4 | 32.3 | 32.3 | 35.2 | 35.0 | 32.3 | 35.6 | 38.8 | 35.6 |
| Max. | 66.6 | 67.1 | 67.1 | 67.8 | 72.7 | 72.7 | 78.2 | 78.3 | 78.3 | 77.6 | 79.6 | 79.6 |
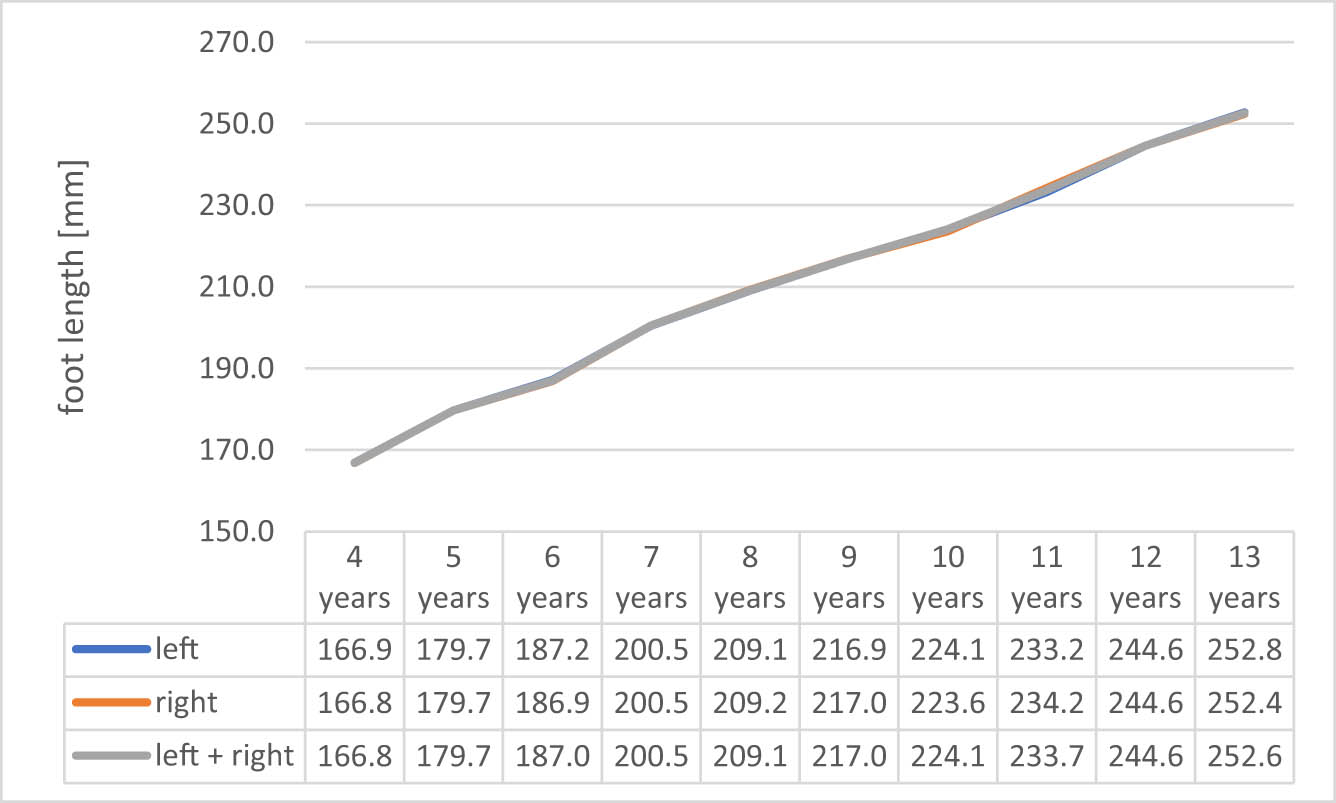
Changes in the foot length.
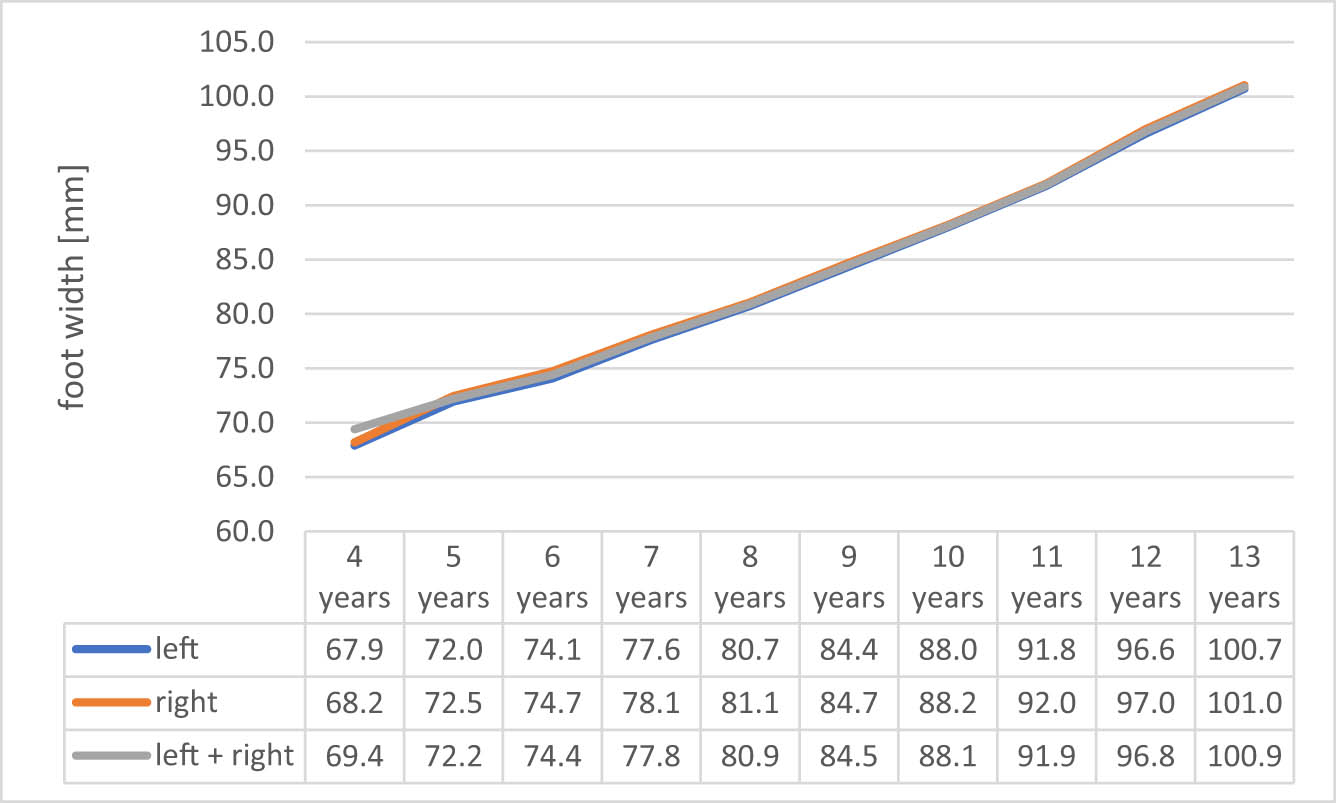
Changes in the foot width.
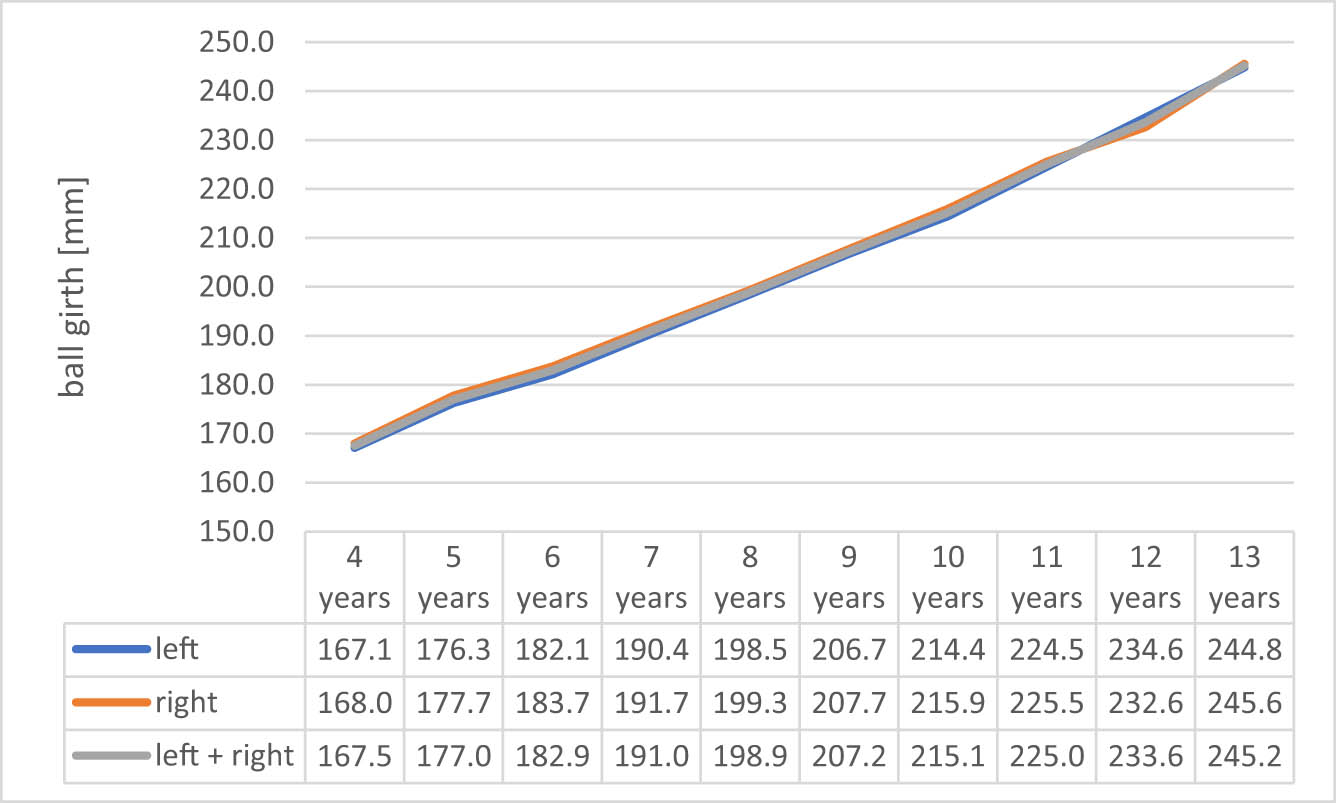
Changes in the ball girth.
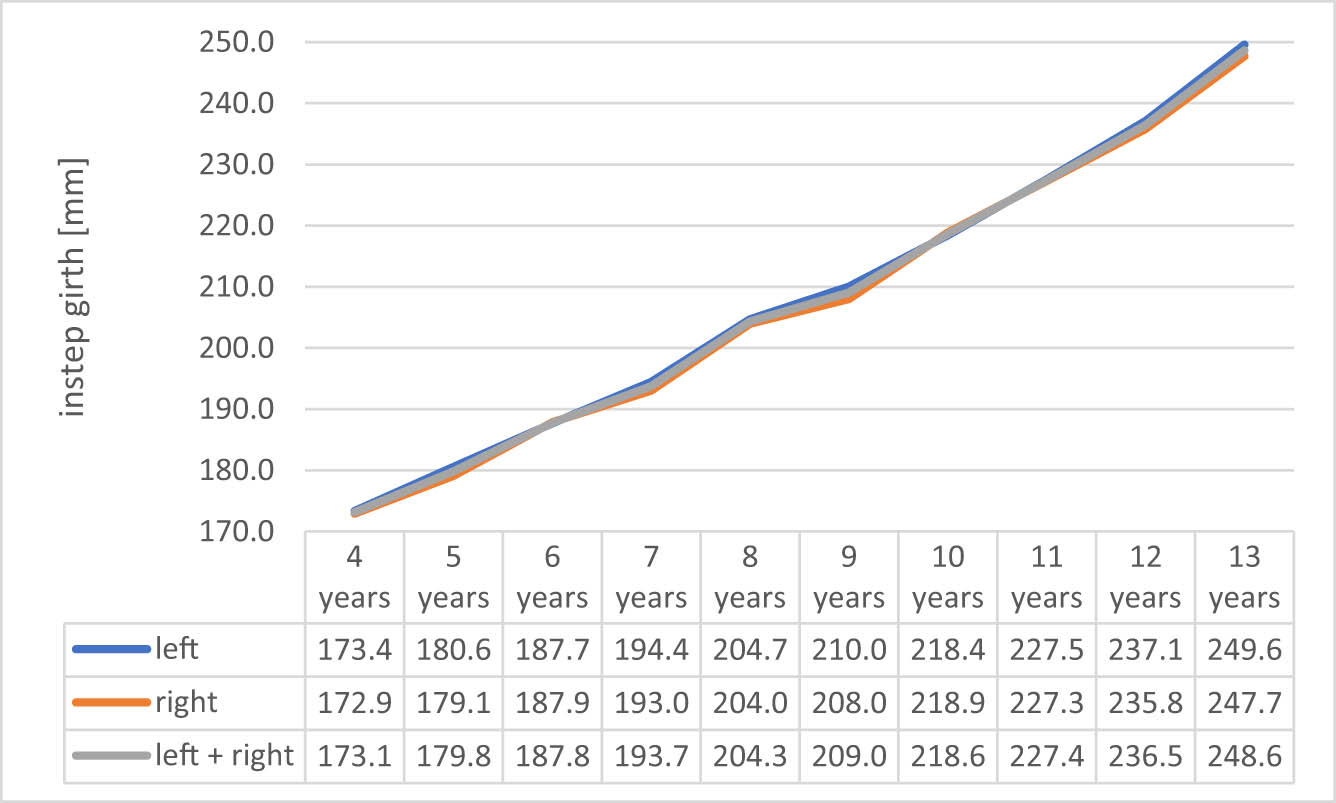
Changes in the instep girth.
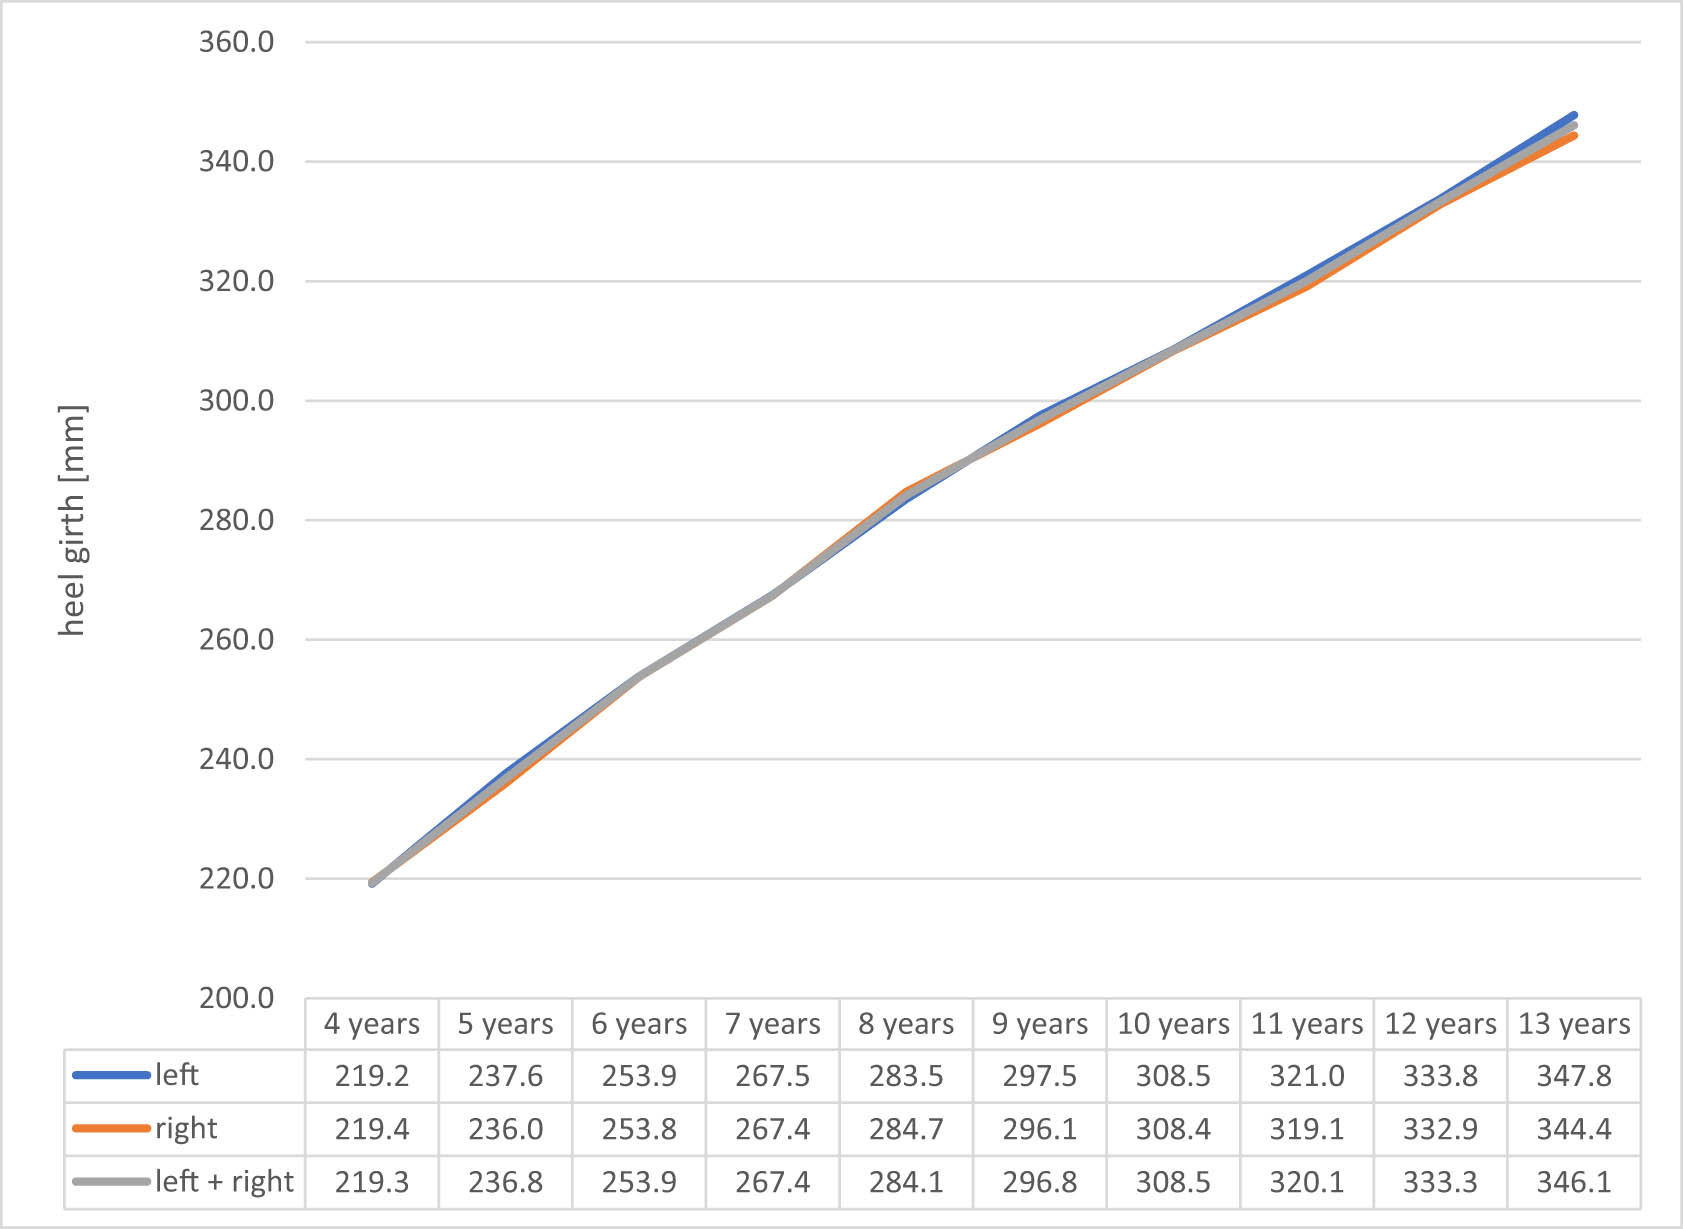
Changes in the heel girth.
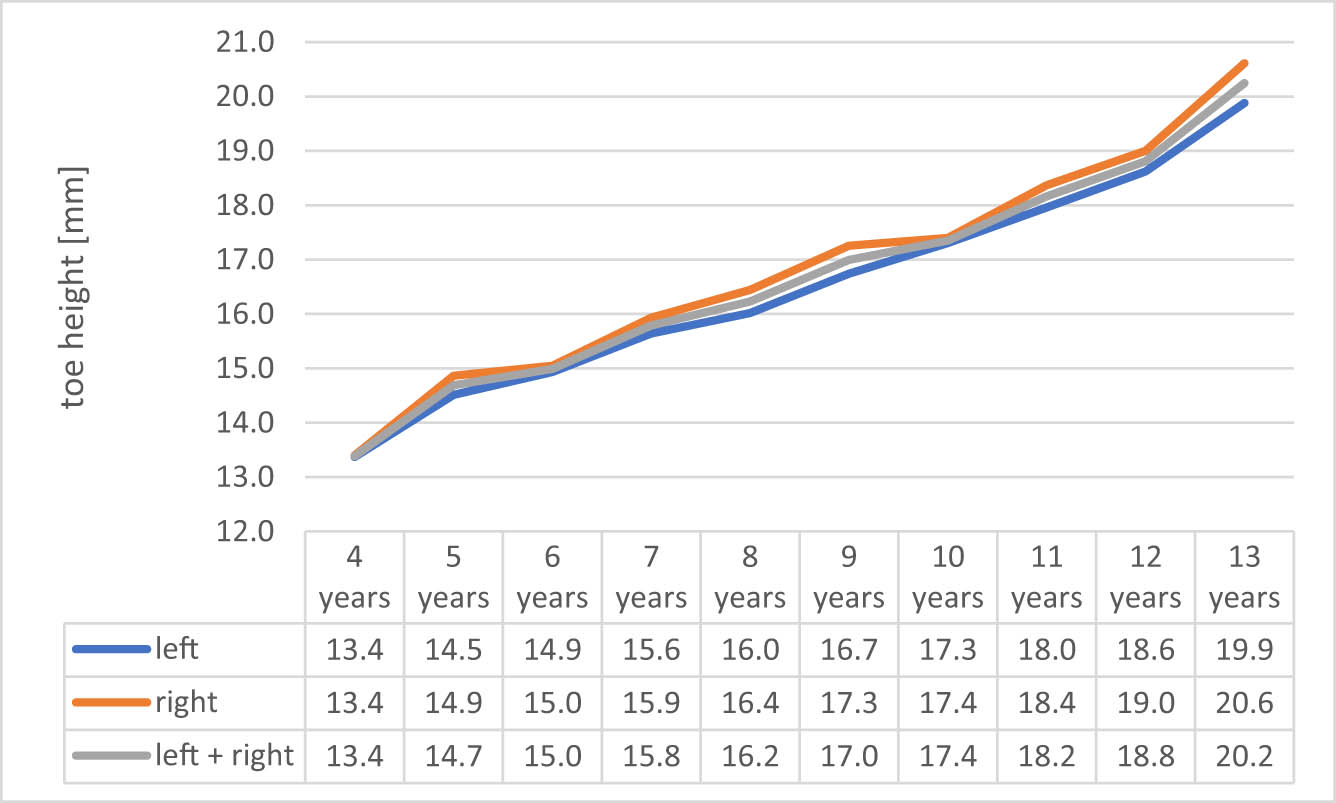
Changes in the toe height.
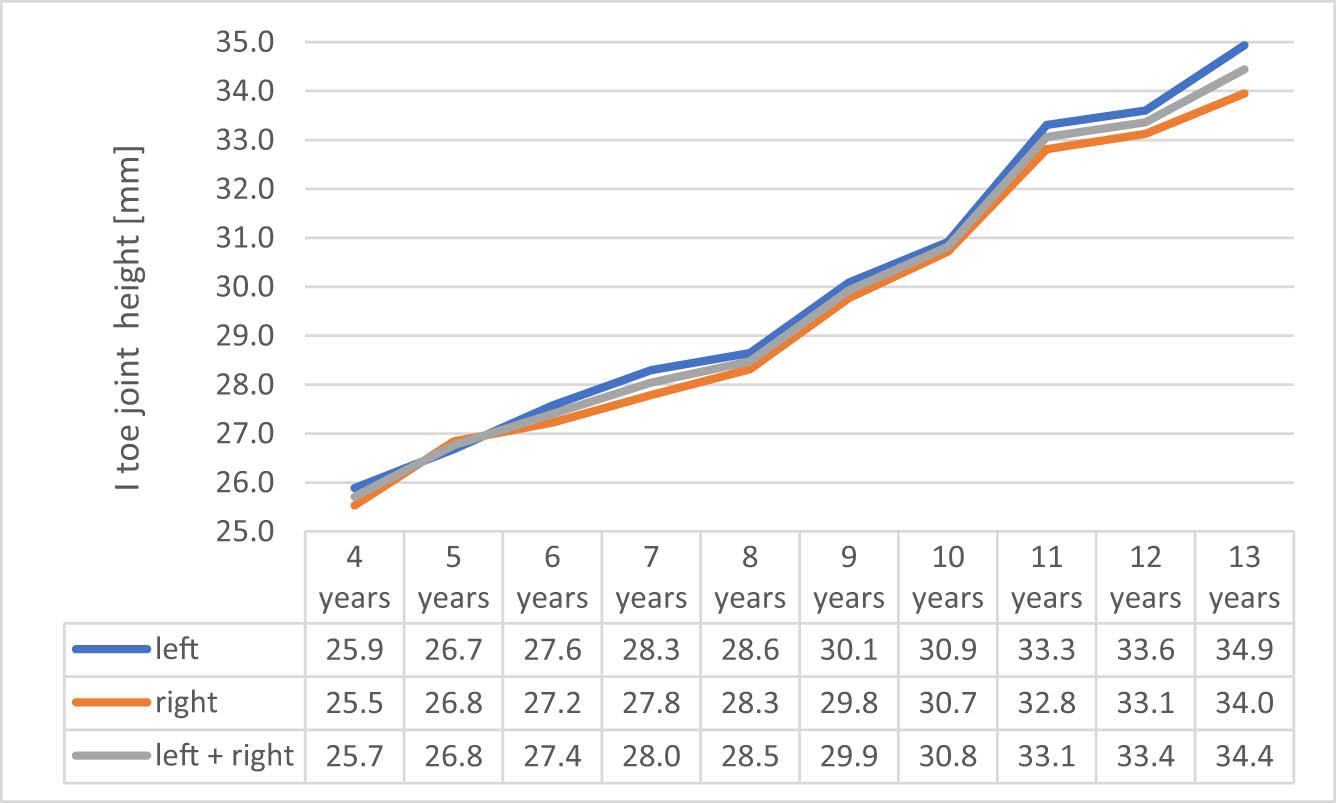
Changes in the first toe joint height.
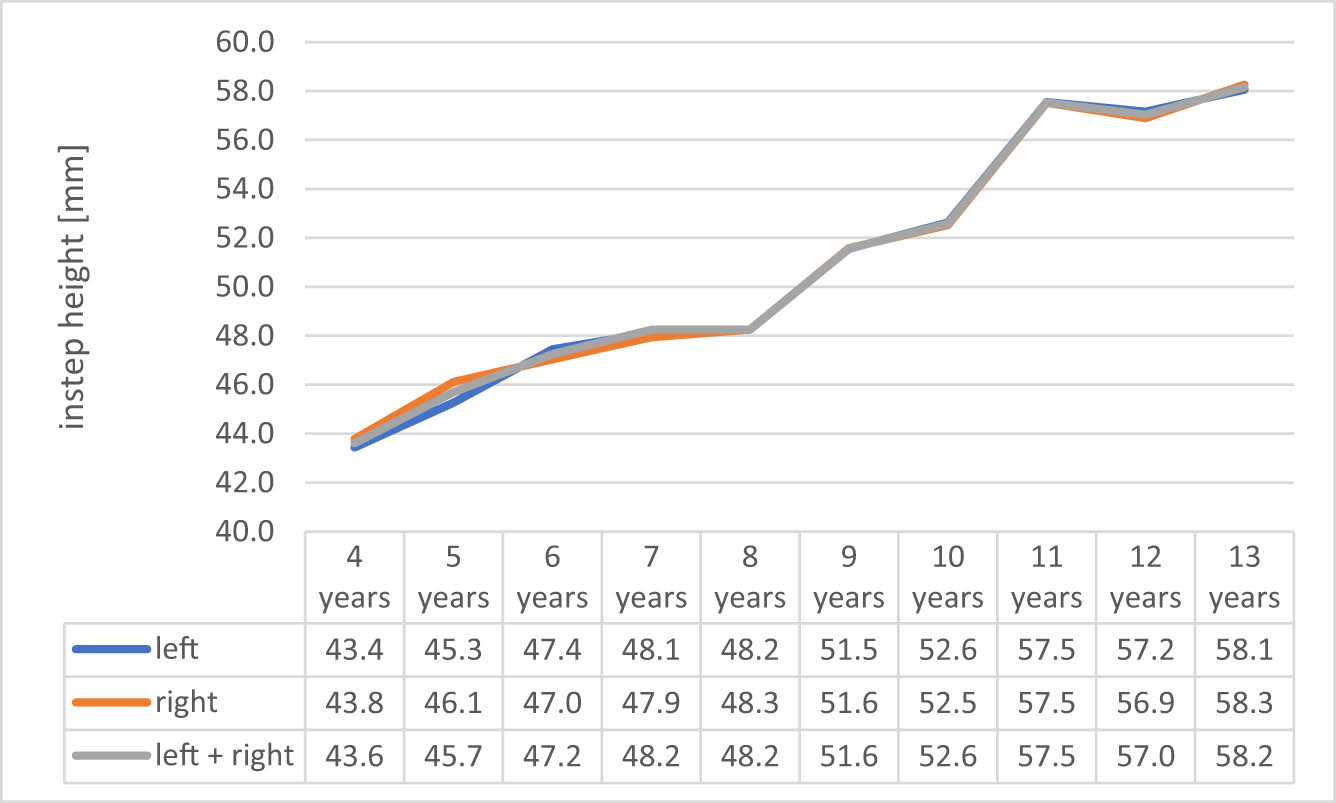
Changes in the instep height.
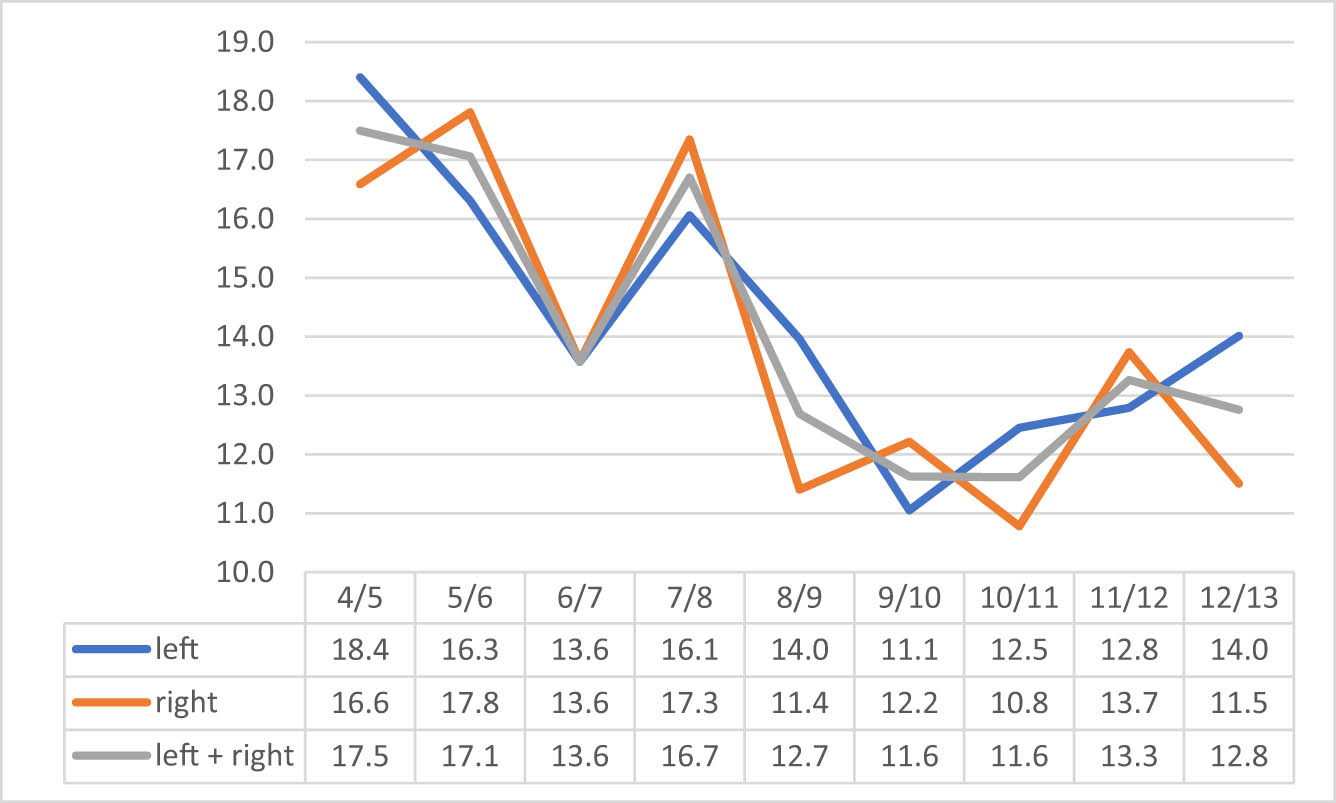
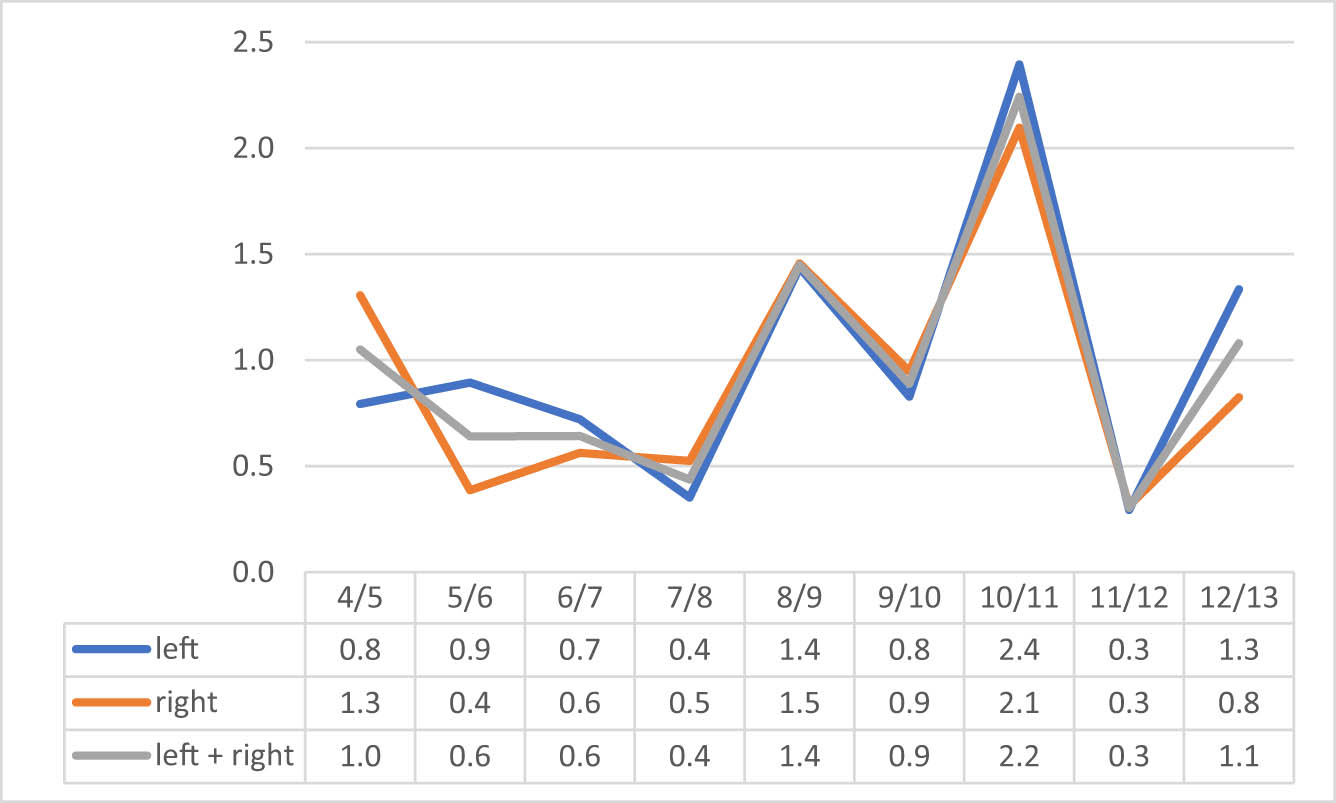
In all the measured parameters, an increase in the values was observed. However, the magnitude of changes varied depending on age. In Figures 17–23, data on change in values between various ages are presented. Dynamics of changes mean the difference between results in consecutive years.
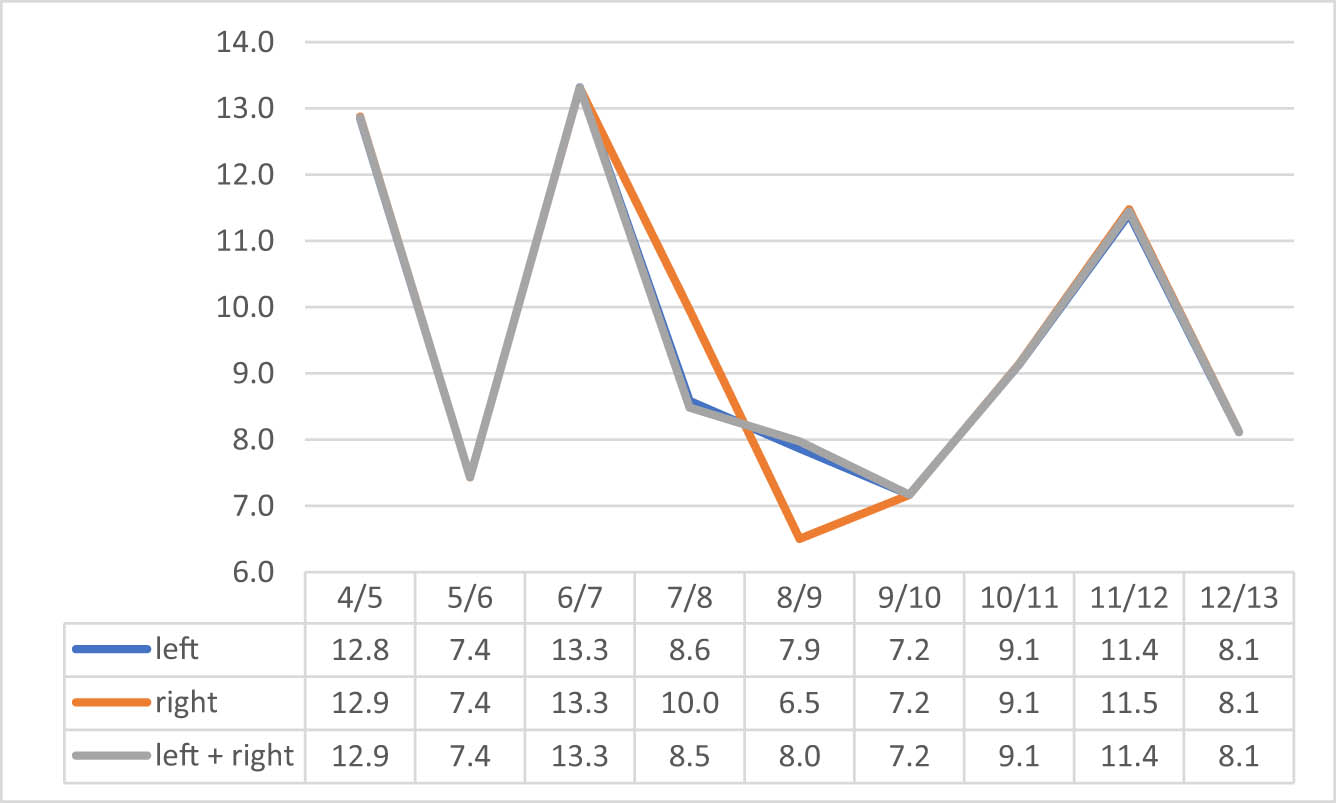
Dynamics of changes in the foot length, in mm.
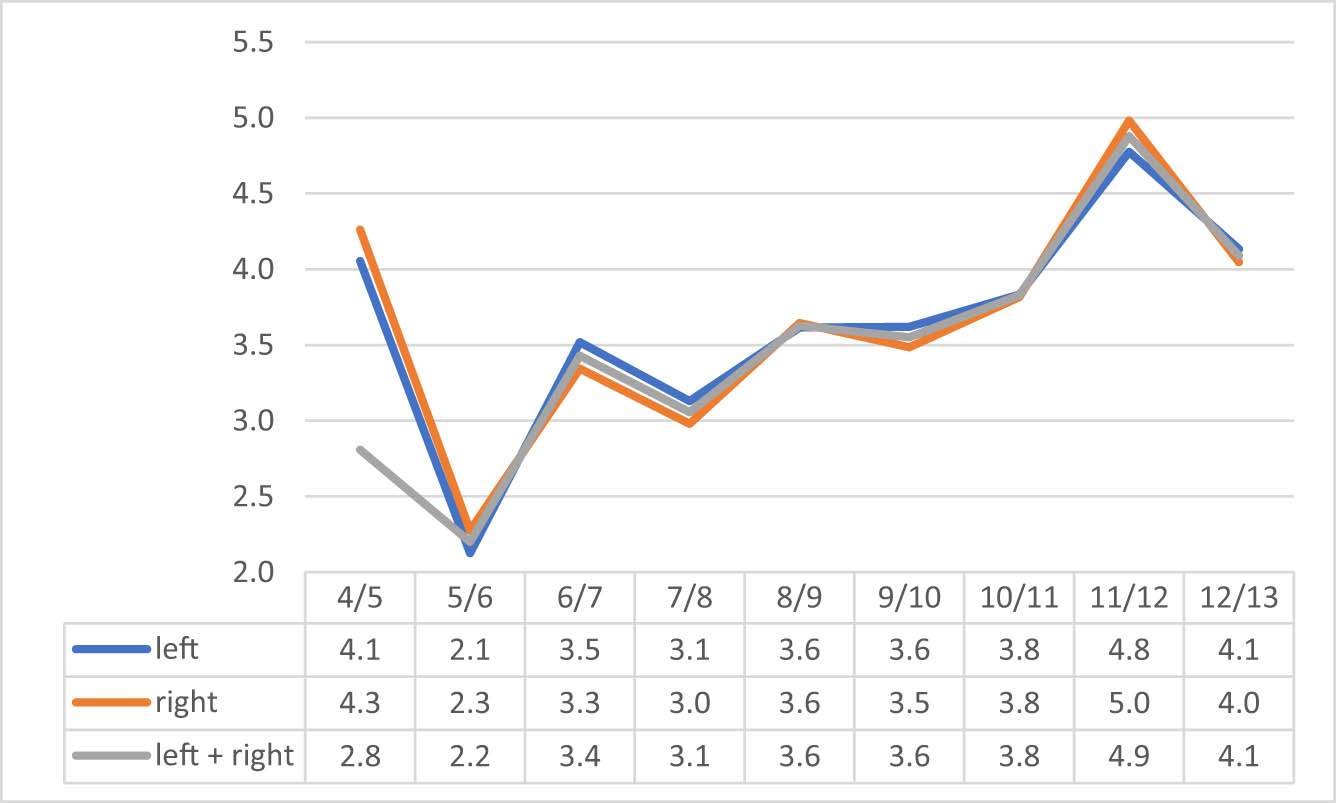
Dynamics of changes in the forefoot width, in mm.
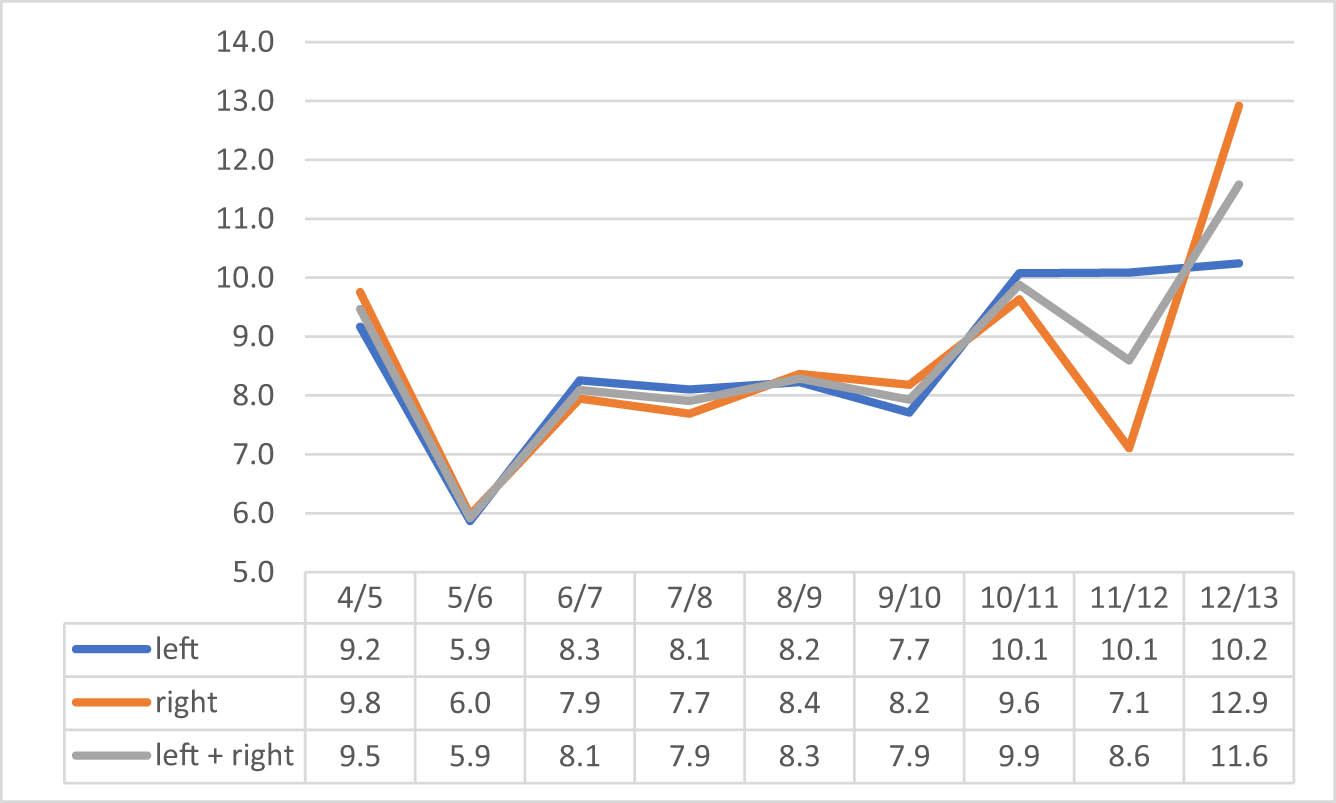
Dynamics of changes in the ball girth, in mm.
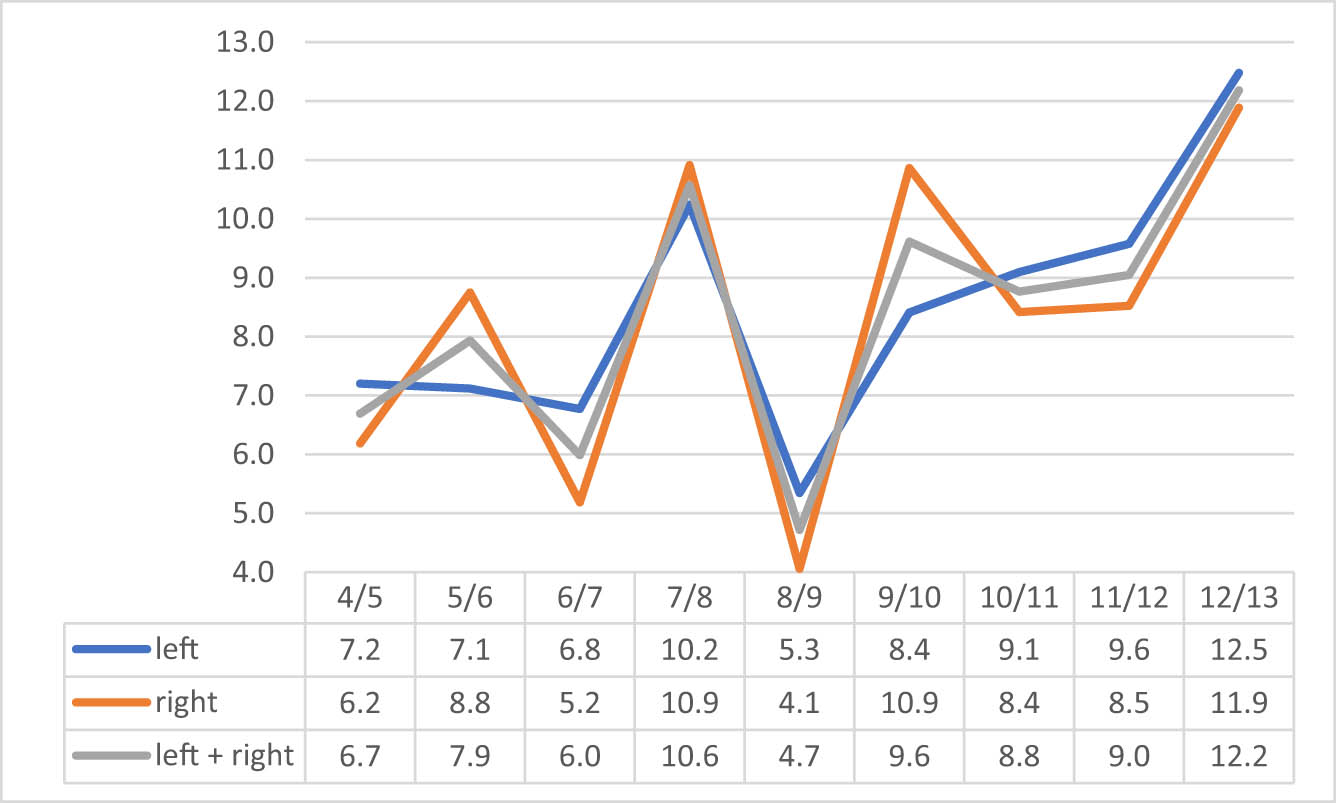
Dynamics of changes in the instep girth, in mm.
Dynamics of changes in the heel girth, in mm.
Dynamics of changes in the first toe joint, in mm.
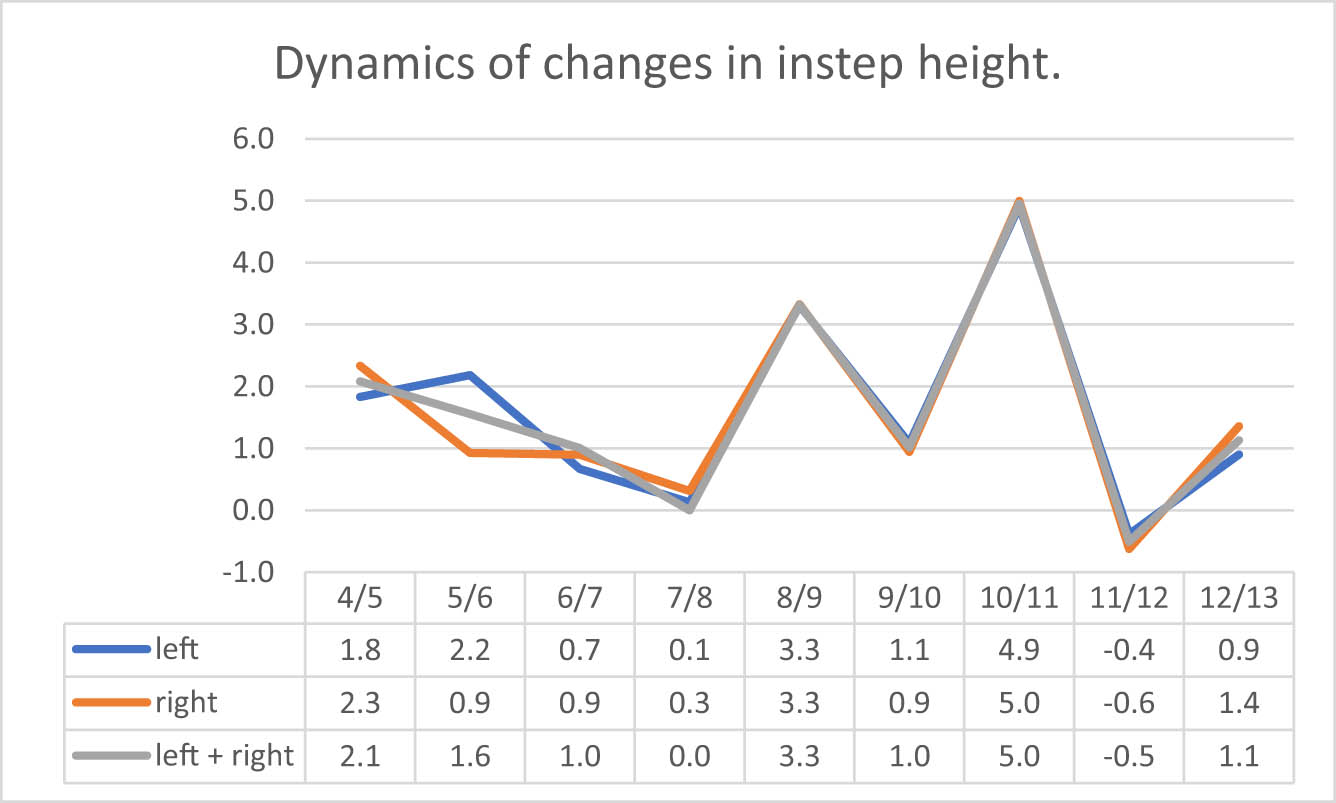
Dynamics of changes in instep height, in mm.
Based on the results, we may conclude that dynamics of changes varied notably between various ages. In case of foot length, the most intense increase was between 3 and 4 years, and 5 and 6 years, after which, there was a gradual decrease, which later, in the age range of 10–11 reaches a third peak. In case of forefoot width, an intense increase is observed between age range 4 and 5, which reaches the lowest value between age range 5 and 6, and again gradually increases up to the age 12/13. In case of the ball girth, a similar situation is observed, but the intense increase is continued till the age 12/13. In case of the instep girth, it is difficult to point out any consistent trend; however, the most intense increase is observed in older age (from 11 and up). This observation is in line with known phases of ontogenetic changes identified by various authors, Weissenberg, Stratz, Huth [15]. Regarding changes in the heel girth, the most intensive increase was observed in earlier years of age, while in older age, it was less steady, lower level. Due to the fact that various dynamics of changes were observed in different foot parameters, the proportions of the feet changed. Data of changes in proportion of the foot length and other dimensions are presented in Figures 24–29, which show a polynomial trend line with the equation.
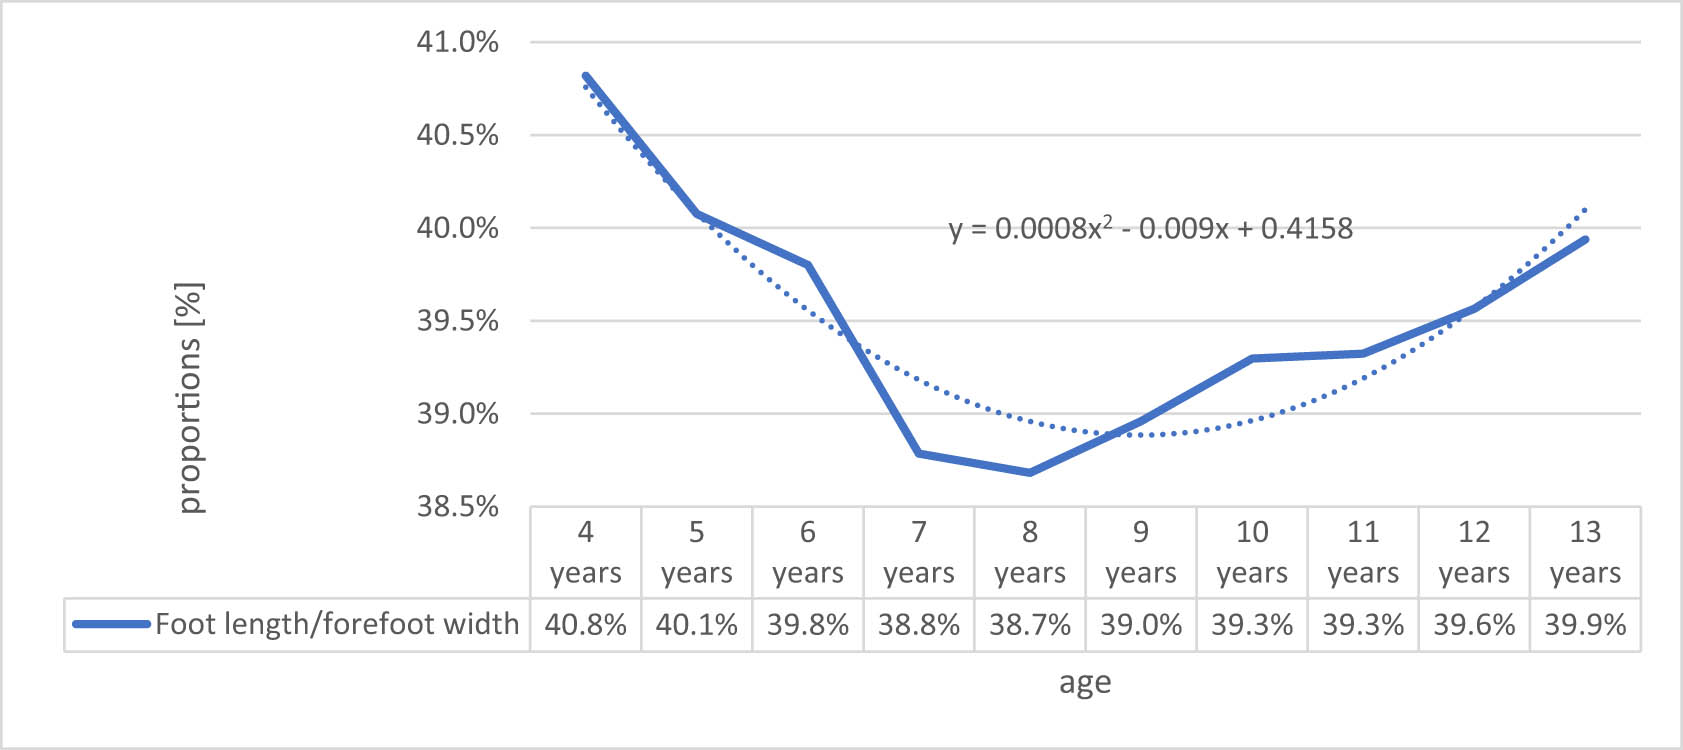
Proportion of the foot length to the forefoot width.
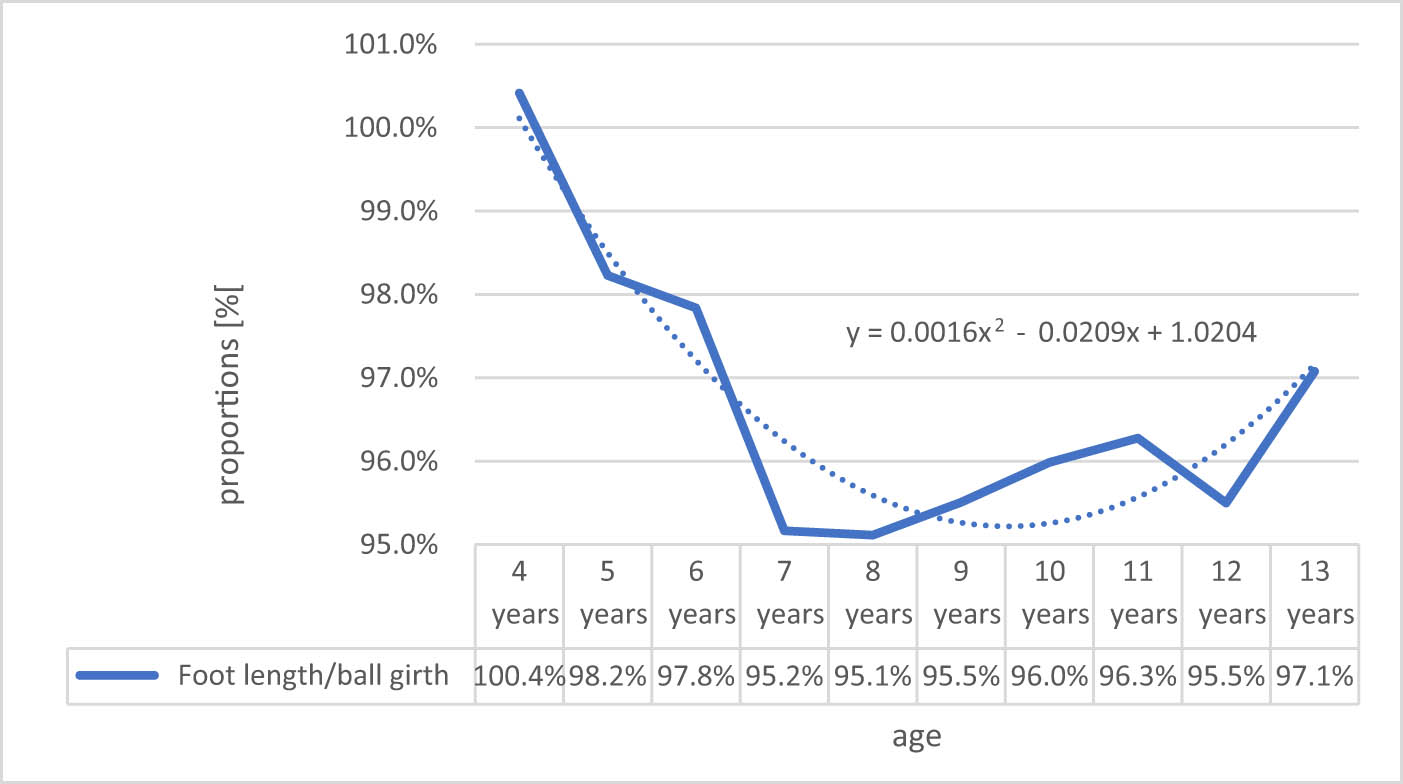
Proportion of the foot length to the ball girth.
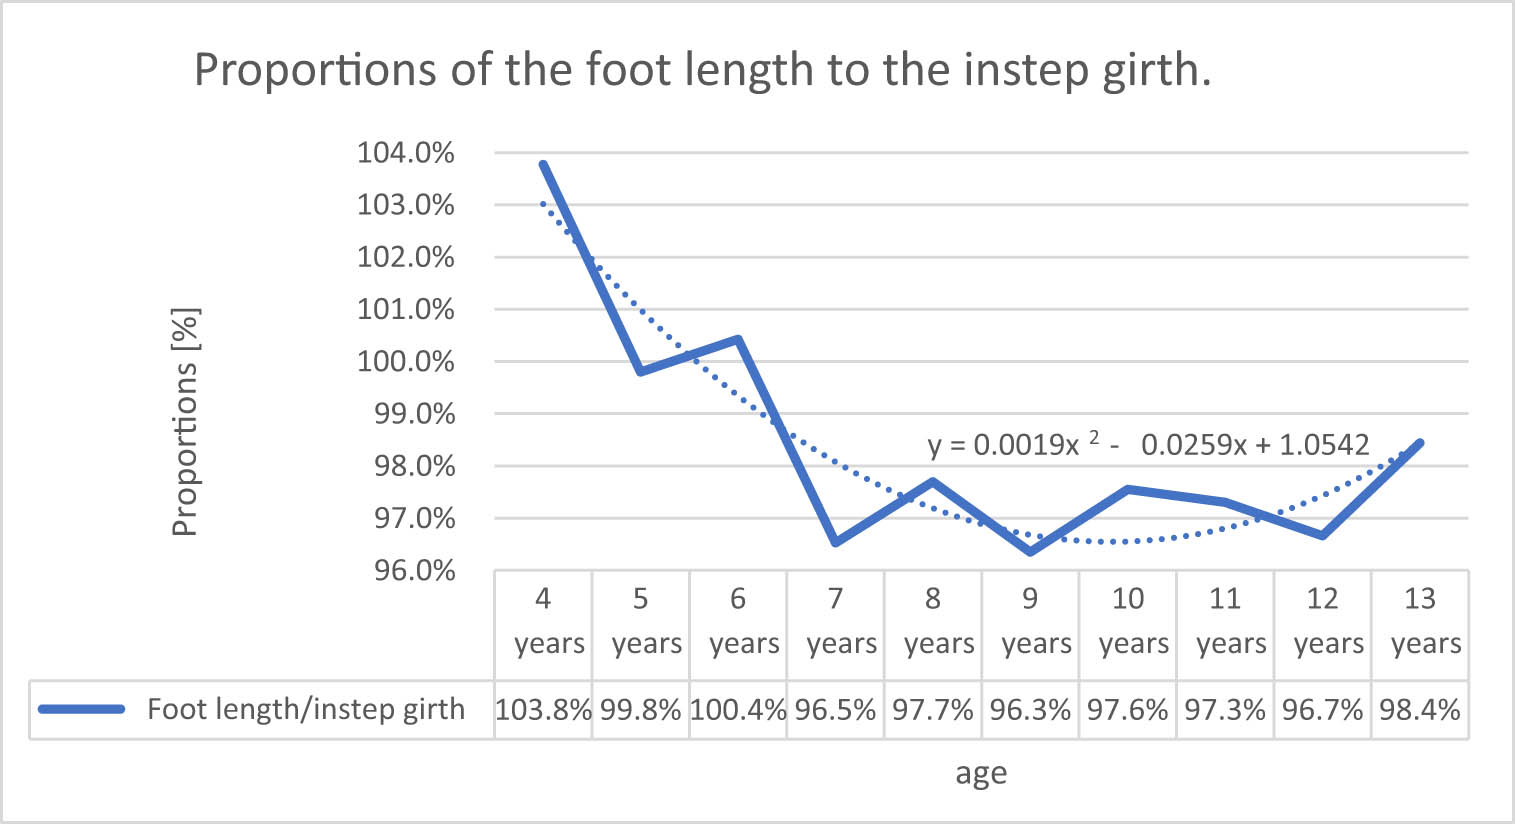
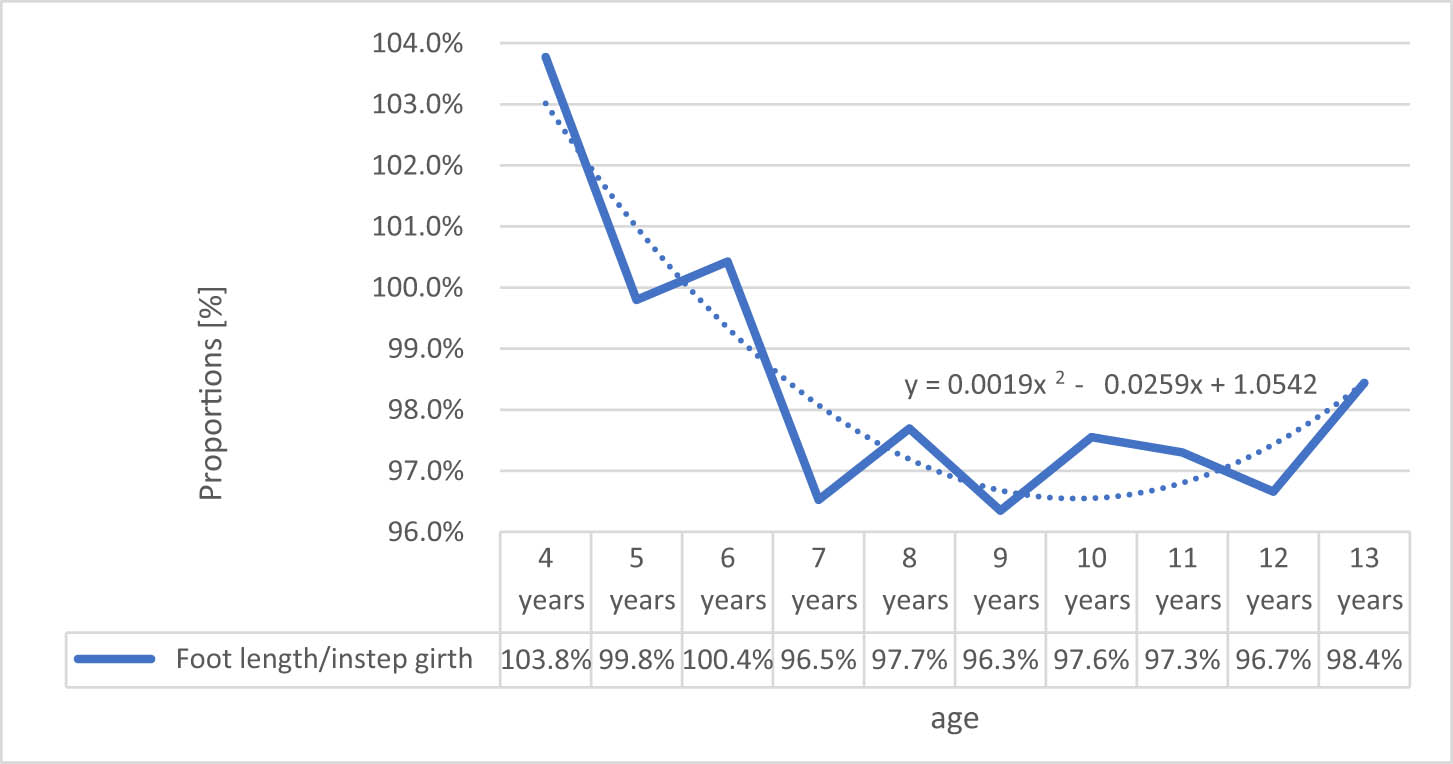
Proportion of the foot length to the instep girth.
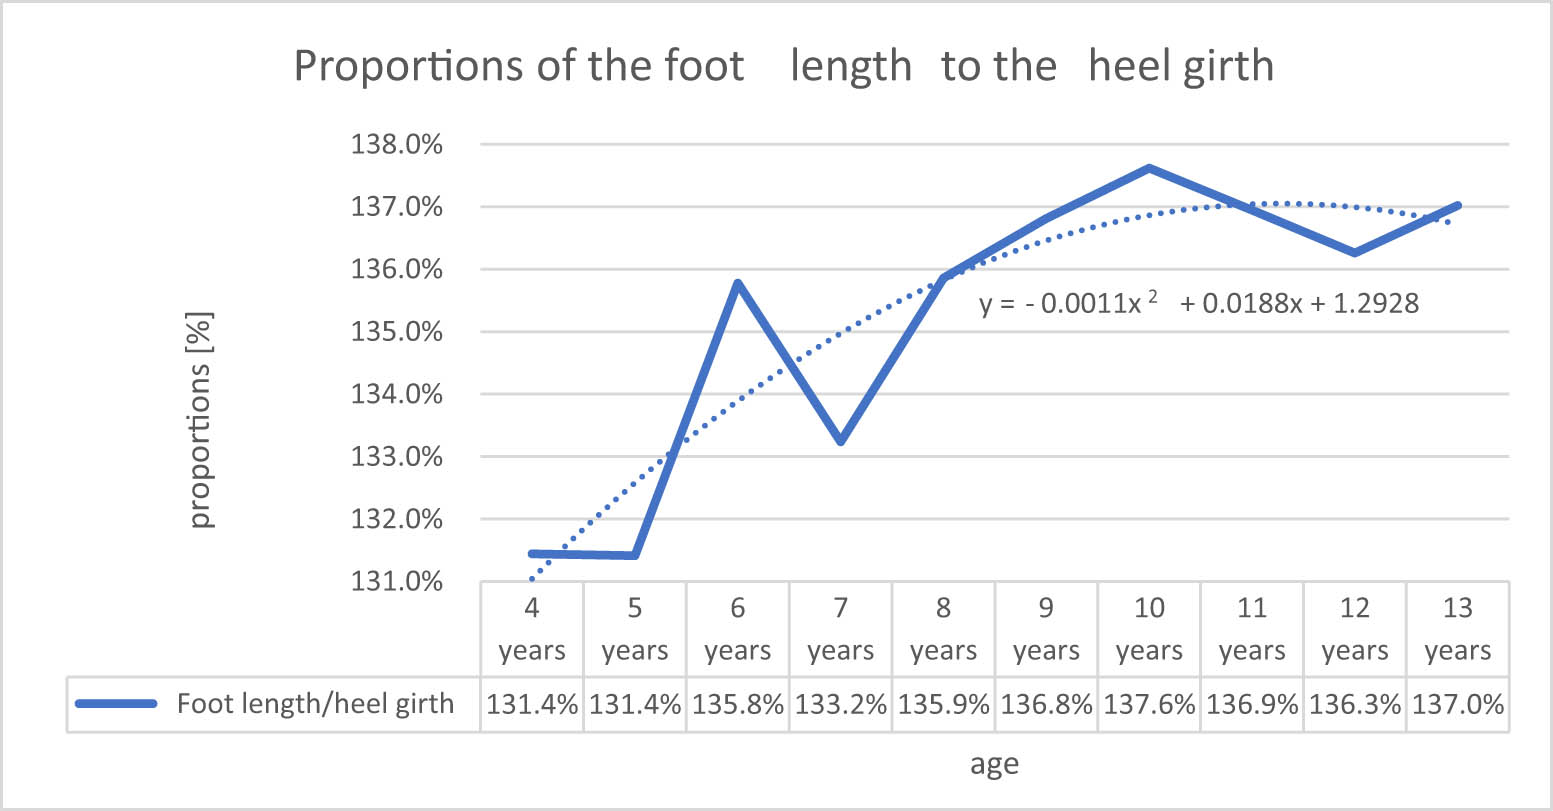
Proportion of the foot length to the heel girth.
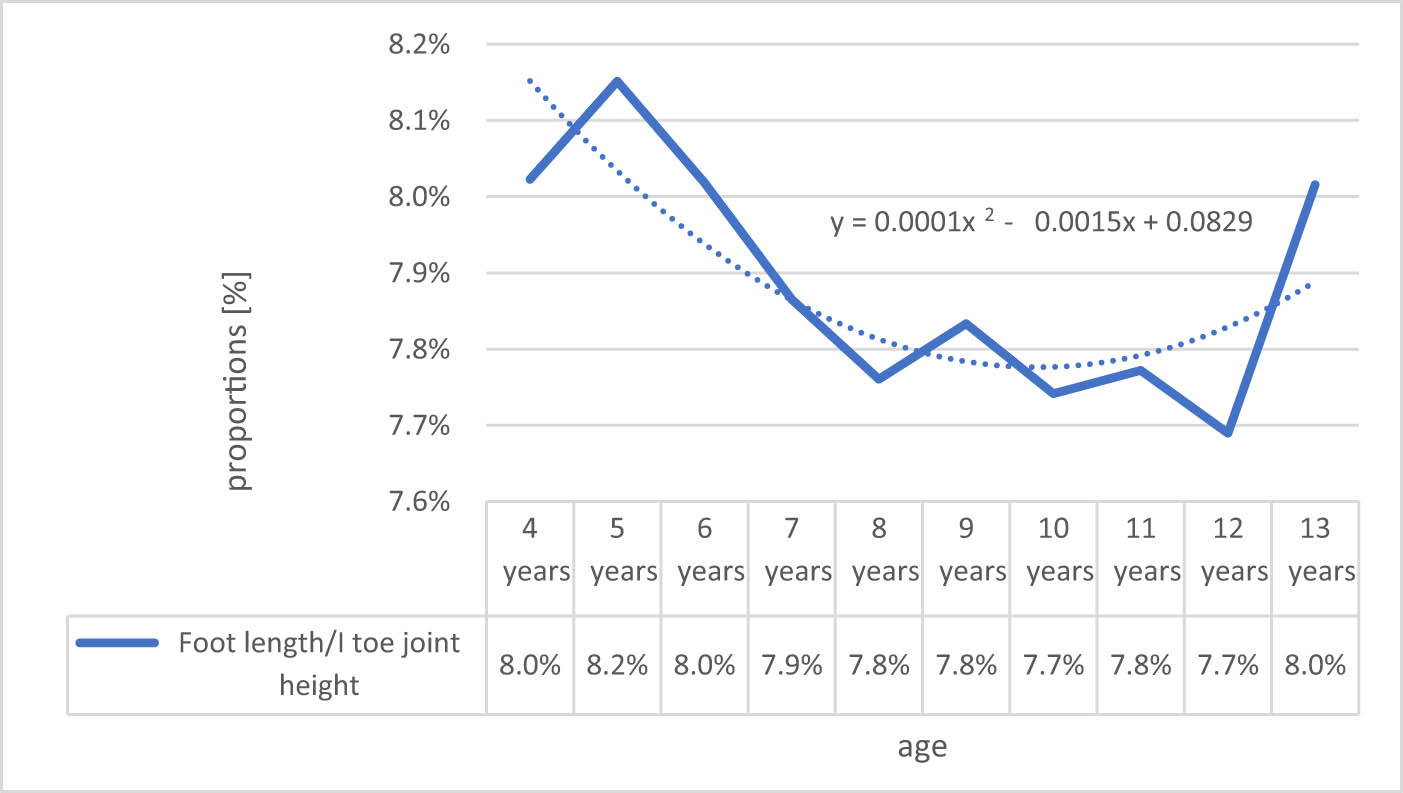
Proportion of the foot length to the first toe joint height.
Proportion of the foot length to the instep girth.
In case of dynamics of increase in forefoot width there was observed gradual decrease of this parameter till age 7, 8 years and then there is observed growth, but till 13th year it does not reach the value from the 4 years of age. Similar situation is observed in case of ball girth, which is not surprising taking into account that these parameters relate to the same “area” of the foot. In case of the instep girth, a decrease in value is observed between 4 and 7 years. Later proportions seem to be stable with slight increase in 13 years. This increase, however, is not observed in case of instep height.
These results are consistent with the data presented by Varga et al. [17] who indicated that for children aged between 2 and 7, with the increase in age, the foot becomes thinner. Since they did not measure children over 7, we cannot confirm if there was the opposite trend in older age, such as it was observed in our research. In this case, one should also take into account the observations from measurements made in years 2008 and 2009 [18], when a high fraction of boys aged 11 years was observed, in whom a high incidence of foot deformities such as lowering of the arch and heel overpronation was still observed (26 and 32.3%, respectively). The fact that their feet still developed may be associated with a rapid increase in the height of the instep in age range of 11–13 years (as it was also observed according to the data related to the dynamics of changes in instep height). However, to evaluate it, it is necessary to obtain statistically significant population of boys of age over 13. In case of heel girth, a steady growth of this parameter is observed throughout the whole period. In case of first toe joint height, proportions are more or less the same.
As mentioned before, these measurements are made with 3D scanner for the first time in Poland, therefore, it is difficult to find data to compare. However, in case of proportions, one should assume that even the numbers are different, the tendencies of changes in proportions should be independent of measurement tools used. In this case, the most convenient would be comparison with data obtained in the years 2008–2009 in measurements made with manual tools in the so-called “Akademia Zdrowej Stopy” initiative [2]. In these measurements, data were collected on boys aged 4–11 years. In case of proportions of the foot length/forefoot width, the initial proportions in age 4 were nearly identical (40.8 vs 39.1 in AZS). Later the value of proportions decreased gradually up to the age of 11, when it reached 37.3. In case of our recent measurements, the value of proportions decreased to 38.7 at the age of 8, but later it started to increase. In AZS measurements, there were no data on children older than 11, so we cannot exclude the possibility that later it increased too, but differences in boys of age 8–11 is notable. Analogical situation is in case of proportions of the foot length to the ball girth. In case of AZS, it is 97.6 (in this research 100.4). In case of AZS, there is a constant decrease up to the age of 11, whereas in case of this research, analogically as in case of foot length/width, the proportion reaches its minimum at the age of 8 and later starts to increase. Difference between both population is just 14 or 15 years; therefore, it is difficult to point out secular trend as responsible for such differences. We will be investigating this problem more thoroughly in the future on bigger population.
Changes in proportions of the feet in children are an important aspect which should be taken into account during design of lasts. The actual standard for lasts used in Poland takes it into account and there are differences in proportions for every age group.
4 Conclusion
The 3D scanning method significantly speeds up the foot measurement process and allows us to obtain more accurate data. First of all, it is more comfortable for children. However, due to the algorithms used and the selection of places on the foot on which the measurements are performed, it is not possible to compare the obtained results with archive data – obtained in manual measurements. Therefore, it is not possible to objectively confirm the common opinions that children’s feet are slimmer than those of their peers from decades ago, and therefore the secular trend cannot be confirmed. We assume that the obtained data, thanks to their accuracy, will allow us to develop lasts that are better adjusted to the requirements of the users.
The observed increase in all dimensions had different rates in relation to individual parts of the foot. The largest increase occurred in the length of the foot, so the foot became slimmer with age. However, after the age of 8, the trend reverses. The exception to this rule is the increase in the heel girth in relation to the length of the foot. From the point of view of footwear and last manufacturers, this observation is important because it means that when grading lasts, the change in proportions should be taken into account so that the lasts reflect this trend. For a given measurement, different growth rates occurred during different periods of growth. In the case of foot length, the highest was at a younger age. Forefoot width and circumference increased with the increase in age. These differences in growth rates can be considered consistent with cycles of ontogenetic development in children. However, reliable confirmation of this fact would require conducting studies on the same population of children year after year.
Obtained data will be used to modify the standards for footwear lasts used in Poland in particular. We expect to modify the standard for lasts – PN-O-91055: 1987 Kopyta Wielkości (last sizes). We also hope there will be an opportunity to compare our data with data in other countries.
-
Funding information: This publication is co-financed by the state budget under the program of the Ministry of Science and Higher Education called “Science for Society” (Poland), project title “The impact of footwear design, materials and proper fit on the health of children and adolescents,” project number NdS/539367/2021/2021, amount of funding 796964,00 PLN, and total value of the project 796964,00 PLN.
-
Conflict of interest: Authors state no conflict of interest.
References
[1] Pinhasi, R., Gasparian, B., Areshian, G., Zardaryan, D., Smith, A., Bar-Oz, G., et al. (2010). First direct evidence of chalcolithic footwear from the Near Eastern Highlands. PLoS ONE, 5(6), e10984. 10.1371/journal.pone.0010984.Search in Google Scholar PubMed PubMed Central
[2] Skrzyńska, B., Rajchel-Chyla, B., Dworska, K., Janocha, M., Gajewski, R. (2012). Analysis of dimensions of the children feet at age 1–11 examined in 2008–2009 in large Polish cities. Footwear: Safety and functionality. (pp. 141–164). In: Przyjemska, L., Rajchel-Chyla, B. (Eds.). Wydawnictwo Instytutu Przemysłu Skórzanego (Kraków).Search in Google Scholar
[3] Rao, U. B., Joseph, B. (1992). The influence of footwear on the prevalence of flatfoot. A survey of 2300 children. The Journal of Bone & Joint Surgery. British Volume, 525–527. 10.1302/0301-620X.74B4.1624509.Search in Google Scholar PubMed
[4] Sachithanandam, V., Joseph, B. (1995). The influence of footwear on the prevalence of flat foot. A survey of 1846 skeletally mature persons. The Journal of Bone & Joint Surgery. British Volume, 77(2), 254–257.10.1302/0301-620X.77B2.7706341Search in Google Scholar
[5] Didia, B. C., Omu, E. T., Obuoforibo, A. A. (1987). The use of footprint contact index II for classification of flat feet in a Nigerian population. Foot Ankle, 7(5), 285–289.10.1177/107110078700700504Search in Google Scholar PubMed
[6] Sim-Fook, L. A., Hodgson, A. R. (1958). A comparison of foot forms among non-shoe and shoe wearing Chinese populations. The Journal of Bone & Joint Surgery, 40A, 1058–1062.10.2106/00004623-195840050-00007Search in Google Scholar
[7] Rajchel-Chyla, B., Skrzyńska, B., Janocha, M., Gajewski, R. (2012). The foot length changes due to age as well as load during ambulation and determintion of the toe allowance (pp. 23–26). Przegląd Włókno, Odzież, Skóra.Search in Google Scholar
[8] Pytlik, K. (1983). Projektowanie i konstrukcja spodów obuwia. Wydawnictwa Naukowo-Techniczne, Warszawa.Search in Google Scholar
[9] Lee, Y. C., Lin, G., Wang, M. J J. (2014). Comparing 3D foot scanning with conventional measurement methods. Journal of Foot and Ankle Research. https://jfootankleres.biomedcentral.com/articles/10.1186/s13047-014-0044-7, access: 21.10.2021.10.1186/s13047-014-0044-7Search in Google Scholar PubMed PubMed Central
[10] Piotrowska, K., Gajewski, R., Kwiecień, J., Janocha, M. (2021). Comparative analysis of the results of anthropometric measurements of the feet obtained traditional method and using a 3D scanner. Proceedings of COKA Conference (Zlin). 21.10.2021.Search in Google Scholar
[11] Blais, F., Bisson, J. A., Williams, S., Robertson, N., Rozin, S., Nelson, A. (2000). The shape grabber footscanner: A low cost high accuracy 3-D system for the acquisition of human feet. In: Corner, B. D., Nurre, J. H. (Eds.). Three-Dimensional Image Capture and Applications III. Proceedings of the SPIE (Vol. 3958, pp. 178–186).10.1117/12.380039Search in Google Scholar
[12] Gärtner, H., Lavoie, J. F., Vermette, E., Houle, P. S. (1999). Multiple structured light system for the 3D-measurement of feet. Proceedings of Three-dimensional Image Capture and Applications II (IS&T/SPIE) Conference. SPIE, San Jose, California, 3640, pp. 104–114.10.1117/12.341052Search in Google Scholar
[13] Skrzyńska, B., Dworska, K., Rajchel-Chyla, B., Gajewski, R., Janocha, M. (2012). Dimensions of the children’s feet as a basis for shoe design and construction (Results of anthropometric Measurements carried out within Akademia Zdrowej Stopy BARTEK [Healthy Foot Academy of BARTEK company] in 2008–2009). In: Bartkowiak, G., Frydrych, I., Gniotek, K., Bakar, M. (Eds.). Innovations in clothing technology & measurements techniques. Technical University of Lodz Press, Lodz.Search in Google Scholar
[14] Chantelau, E., Gede, A. (2012). Foot dimensions of elderly people with and without diabetes mellitus –a data basis of shoe design. Gerontology, 48(2), 241–244.10.1159/000058357Search in Google Scholar PubMed
[15] Jasicki, B., Panek, S., Sikora, P., Stołychwo, E. (1962). Zarys antropologii. PWN, Warszawa.Search in Google Scholar
[16] Malinowski, A., Bożiłow, W. (1997). Podstawy antropometrii. Metody, techniki, normy (pp. 90–93). Wydawnictwo Naukowe PWN, Lodz.Search in Google Scholar
[17] Varga, M., Price, C., Morrison, S. C. (2020). Three-dimensional foot shape analysis in children: a pilot analysis using three dimensional shape descriptors. Journal of Foot and Ankle Research. https://jfootankleres.biomedcentral.com/articles/10.1186/s13047-020-0373-7, access: 23.10.2021.10.1186/s13047-020-0373-7Search in Google Scholar PubMed PubMed Central
[18] Rajchel-Chyla, B., Skrzyńska, B., Dworska, K., Janocha, M., Gajewski, R. (2012). The health status of the feet in children at age 1–11 examined in the Bartek Healthy Foot Academy. Footwear: Safety and functionality. (pp. 120–140). In: Przyjemska, L., Rajchel-Chyla, B. (Eds.). Wydawnictwo Instytutu Przemysłu Skórzanego, Kraków.Search in Google Scholar
[19] Mueller, J., Richter, M., Schaefer, K., Ganz, J., Lohscheller, J., Mueller S. (2023). How to measure children’s feet: 3D foot scanning compared with established 2D manual or digital methods. Journal of Foot and Ankle Research. https://jfootankleres.biomedcentral.com/articles/10.1186/s13047-023-00618-y, access: 23.10.2021.10.1186/s13047-023-00618-ySearch in Google Scholar PubMed PubMed Central
© 2024 by the authors, published by De Gruyter
This work is licensed under the Creative Commons Attribution 4.0 International License.
Articles in the same Issue
- Characterization of viscoelastic properties of yarn materials: Dynamic mechanical analysis in the transversal direction
- Analysis of omni-channel implementations that are preferred by consumers in clothing sector
- Structural modeling and analysis of three-dimensional cross-linked braided preforms
- An experimental study of mechanical properties and comfortability of knitted imitation woven shirt fabrics
- Technology integration to promote circular economy transformation of the garment industry: a systematic literature review
- Research on T-shirt-style design based on Kansei image using back-propagation neural networks
- Research on She nationality clothing recognition based on color feature fusion with PSO-SVM
- Accuracy prediction of wearable flexible smart gloves
- Preparation and performance of stainless steel fiber/Lyocell fiber-blended weft-knitted fabric
- Development of an emotional response model for hospital gown design using structural equation modeling
- Preparation and properties of stainless steel filament/pure cotton woven fabric
- Facemask comfort enhancement with graphene oxide from recovered carbon waste tyres
- Use of enzymatic processes in the tanning of leather materials
- Optical-related properties and characterization of some textile fibers using near-infrared spectroscopy
- Network modeling of aesthetic effect for Chinese Yue Opera costume simulation images
- Predicting consumers’ garment fit satisfactions by using machine learning
- Non-destructive identification of wool and cashmere fibers based on improved LDA using NIR spectroscopy
- Study on the relationship between structure and moisturizing performance of seamless knitted fabrics of protein fibers for autumn and winter
- Antibacterial and yellowing performances of sports underwear fabric with polyamide/silver ion polyurethane filaments
- Numerical and experimental analysis of ballistic performance in hybrid soft armours composed of para-aramid triaxial and biaxial woven fabrics
- Phonetic smart clothing design based on gender awareness education for preschoolers
- Determination of anthropometric measurements and their application in the development of clothing sizing systems for women in the regions of the Republic of Croatia
- Research on optimal design of pleated cheongsam based on Kano–HOQ–Pugh model
- Numerical investigation of weaving machine heald shaft new design using composite material to improve its performance
- Corrigendum to “Use of enzymatic processes in the tanning of leather materials”
- Shaping of thermal protective properties of basalt fabric-based composites by direct surface modification using magnetron sputtering technique
- Numerical modeling of the heat flow component of the composite developed on the basis of basalt fabric
- Weft insertion guideway design based on high-temperature superconducting levitation
- Ultrasonic-assisted alkali hydrolysis of polyethylene terephthalate fabric and its effect on the microstructure and dyeing properties of fibers
- Comparative study on physical properties of bio-based PA56 fibers and wearability of their fabrics
- Investigation of the bias tape roll change time efficiency in garment factories
- Analysis of foot 3D scans of boys from Polish population
- Optimization of garment sewing operation standard minute value prediction using an IPSO-BP neural network
- Influence of repeated switching of current through contacts made of electroconductive fabrics on their resistance
- Numerical calculation of air permeability of warp-knitted jacquard spacer shoe-upper materials based on CFD
- Compact Spinning with Different Fibre Types: An Experimental Investigation on Yarn Properties in the Condensing Zone with 3D-Printed Guiding Device
- Modeling of virtual clothing and its contact with the human body
- Advances in personalized modelling and virtual display of ethnic clothing for intelligent customization
- Investigation of weave influence on flame retardancy of jute fabrics
- Balloonless spinning spindle head shape optimisation
- Research on 3D simulation design and dynamic virtual display of clothing flexible body
- Turkish textile and clothing SMEs: Importance of organizational learning, digitalization, and internationalization
- Corrigendum To: “Washing characterization of compression socks”
- Study on the promotion multiple of blood flow velocity on human epidermal microcirculation of volcanic rock polymer fiber seamless knitted fabric
- Bending properties and numerical analysis of nonorthogonal woven composites
- Bringing the queen mother of the west to life: Digital reconstruction and analysis of Taoist Celestial Beings Worshiping mural’s apparel
- Modeling process for full forming sports underwear
- Retraction of: Ionic crosslinking of cotton
- An observational study of female body shape characteristics in multiracial Malaysia
- Study on theoretical model and actual deformation of weft-knitted transfer loop based on particle constraint
- Design and 3D simulation of weft-knitted jacquard plush fabrics
- An overview of technological challenges in implementing the digital product passport in the textile and clothing industry
- Understanding and addressing the water footprint in the textile sector: A review
- Determinants of location changes in the clothing industry in Poland
- Influence of cam profile errors in a modulator on the dynamic response of the heald frame
- Quantitative analysis of wool and cashmere fiber mixtures using NIR spectroscopy
- 3D simulation of double-needle bar warp-knitted clustered pile fabrics on DFS
- Finite element analysis of heat transfer behavior in glass fiber/metal composite materials under constant heat load
- Price estimation and visual evaluation of actual white fabrics used for dress shirts and their photographic images
- Effect of gluing garment materials with adhesive inserts on their multidirectional drape and bending rigidity
- Optimization analysis of carrier-track collision in braiding process
- Numerical and experimental analysis of the ballistic performance of soft bulletproof vests for women
- The antimicrobial potential of plant-based natural dyes for textile dyeing: A systematic review using prisma
- Influence of sewing parameters on the skin–fabric friction
- Validation by experimental study the relationship between fabric tensile strength and weave structures
- Optimization of fabric’s tensile strength and bagging deformation using surface response and finite element in stenter machine
- Analysis of lean manufacturing waste in the process flow of ready-to-wear garment production in Nigeria
- An optimization study on the sol–gel process to obtain multifunctional denim fabrics
- Drape test of fully formed knitted flared skirts based on 3D-printed human body posture
- Supplier selection models using fuzzy hybrid methods in the clothing textile industry