Research on T-shirt-style design based on Kansei image using back-propagation neural networks
-
Han Xu


Abstract
Users’ Kansei image preferences have become one of the most important factors influencing purchase decisions. However, defining Kansei image can be complex. To address this issue, researchers have widely applied back-propagation neural networks due to their capacity to handle extensive data, adaptively adjust weights and biases, conduct multi-class classification and regression predictions, and offer interpretability analysis, among other features. In this study, a clothing-style design model based on users’ Kansei image cognition is proposed, using collarless T-shirts as an example. Furthermore, the attributes of T-shirt patterns are quantified using parametric graphics principles, and a semantic scale system for emotions is established through user research. The quantified sample data and corresponding semantic scale scores are then used as inputs for training a back-propagation neural network algorithm. Consequently, a design model grounded in users’ Kansei image cognition is developed, resulting in five optimal clothing design forms across various Kansei image categories. Additionally, the styles are showcased through the Style 3D platform, and the design evaluation is presented using radar charts. The results demonstrate that the five female T-shirt designs generated by the model align with users’ style preferences based on Kansei image.
1 Introduction
With the rapid development of social economy, people’s consumption and aesthetic level have been comprehensively improved. The consumer concept of users has gradually transitioned from material and physiological needs to spiritual and image needs [1]. Consumers are increasingly concerned about the emotional attributes presented by products. Due to the lack of exploration of users’ potential emotional and imaginary needs during the product design process, designers rely solely on subjective experience and find it difficult to accurately grasp users’ real, complex, and fuzzy perceptual needs and expected images [2,3]. Kansei image preference has become one of the most critical factors influencing users’ purchasing decisions [4]. Kansei can be represented by the English word “sensitive,” which is the ability to sense, recall, desire, and contemplate the beauty of objects [5]. Design theories closely related to this research include Kansei engineering and affective design [6]. Kansei engineering theory has an important place and influence in exploring how to translate consumers’ vague emotional imagery into product design elements [7]. This theory has been widely applied in many fields, such as automobiles, electrical appliances, and architecture [8]. Research that applies Kansei engineering theories to garment design and development is not uncommon. Most studies have been conducted from the perspective of garment colours [9,10,11], garment fabrics [12,13,14], and prints [15,16,17]. However, a few researchers have approached module development, product optimisation, and design evaluation from the perspective of garment style [18,19]. However, clothing pattern design methods and principles are different from industrial design methods, such as automobiles, household appliances, and other daily necessities. Pattern design is based on the human body, while the industrial modelling design works on the object, which is indirectly related to human beings. Therefore, pattern design cannot be regarded as a purely structural design of an object. In Kansei engineering, commonly used methods such as shape structure analysis and silhouette extraction typically extract design elements directly from the outer contour characteristics of an object. When applied to the field of clothing design, this method may lead to design deviations during the pattern-making process. Therefore, when applying Kansei engineering methods, it can be advantageous to start directly from clothing pattern making. Using parametric pattern-making theories to guide the quantification of key elements and referencing relevant indicators can be a more suitable approach to style design [20].
The T-shirt is one of the clothing items that women wear on a daily basis, and it holds a relatively large market share in women’s fashion. Therefore, this research takes a collarless women’s T-shirt as an example and completes the sample’s emotional image rating based on the results of a user questionnaire survey. Key design elements are quantified using parameterisation pattern-making methods. Finally, an artificial neural network algorithm is used to establish the mapping relationship between user Kansei image cognition and product attribute categories, in order to obtain a design model for women’s T-shirts. The aim of this research is to improve the efficiency of design research and development, train and obtain optimal styles under users’ Kansei image cognition, and provide clear and feasible design strategies for enterprises and designers in terms of element specification and strong feasibility.
2 Methods
2.1 Clothing pattern attribute category quantification method
Parametric patterning in clothing involves defining mathematical expressions by constraining the geometric and dimensional relationships of the figure, thus creating a mathematical model that interrelates the dimensions of geometric objects [21,22]. In this research, we propose a method for quantifying the attribute categories of patterns based on the theory of parametric pattern making. Starting from the garment body prototype, a program is written in the MatLab software platform to draw the clothing patterns using the coordinate positions of key points and the dimensional calculation formulae based on the inherent structural relationship of the garment. The key design points are identified according to the garment’s key structure, and a three-layer hierarchy of key elements, element attributes, and attribute categories is established. The final quantification process involves assigning element attributes to the key design points in the pattern and subdividing them into attribute category parameters.
2.2 Back-propagation neural network algorithm
The back-propagation neural network is a data processing system that simulates the structure of neural networks in the brain. It can generally be explained using a multi-layer perceptron model and is often used to solve complex problems [23]. Back-propagation networks are suitable for learning multi-layer neural networks, where the network connection weights are stably distributed within a fixed range through repeated learning of a large number of training samples. Its topology is divided into an input layer, a hidden layer, and an output layer. In the Kansei image study of women’s T-shirt styles, the normalised data of the attribute categories and the image evaluation values are used as training samples for supervised learning. After multiple rounds of training, the error oscillation converges to convergence, the research objective is considered achieved, and the model construction is completed.
2.3 Radar chart evaluation method
The radar chart evaluation method, also known as the spider chart evaluation method, determines the main evaluation indicators of the study object according to the actual needs, obtains the evaluation indicator data, and performs a dimensionless process [24]. This method allows for the characterisation of multiple indicators on a two-dimensional plane and visualisation of the strengths and weaknesses of each evaluation object in that indicator. An n-dimensional coordinate system is established using a point as the origin. Each coordinate axis is divided into m segments, and the specific evaluation values of each dimension are labelled and connected on the axes to form an n-dimensional polygon. The area and perimeter of the polygon are used as parameters for a comprehensive evaluation. The user questionnaires were used to rate the ratings, and the radar chart was used to visually characterise the distribution of the rated objects in terms of each Kansei image attribute [25].
3 Kansei image cognitive experiment
The back-propagation neural network algorithm was used to train the optimal combination model of women’s T-shirt attribute categories based on users’ emotional image perception. A wide range of samples of collarless T-shirt categories for women were collected, and representative samples were selected and pre-processed. The data were normalised and quantified using parametric mapping theory, and the stepwise descent method was used to develop the classification criteria. The key Kansei image vocabulary and sample image evaluation values were obtained through user research. The key parameters were selected to build a neural network model, and the results of the design element processing and the intentional evaluation value were inputted into the model to obtain the optimal combination of design elements for women’s T-shirts under the target image.
3.1 Sample collection
Sample collection was conducted through two methods: product image gathering and computer-aided simulation. Beginning with clothing styles and external features, the samples were acquired from both online platforms and physical stores. We conducted online research by reviewing and recording data from various mainstream online shopping platforms, specialised clothing retail platforms, and electronic resources. T-shirt products that ranked among the top 25 in sales and met our criteria were collected. Details, including brand, style, website, and other pertinent information, were documented and encoded and subsequently incorporated into our sample database. Simultaneously, offline surveys were conducted at three prominent shopping malls in Gusu District, Suzhou. Here, we physically recorded information about the products, encompassing brand, style, and addresses. After encoding, these data were also integrated into our sample database. Following screening for similarity and clarity, we initially selected and collected 279 images of women’s T-shirts. After conducting cluster analysis and comparisons, we retained 137 T-shirt samples with distinctive features. Based on the information in our sample database, we purchased the selected 137 samples for further research. To eliminate potential interference from external factors such as brand logos, fabric, patterns, and colours during the experimentation process, we uniformly pre-processed the initially selected samples. This involved using virtual clothing modelling software to simulate and virtually showcase the product samples.
Virtual garment modelling software is an effective tool for visualising clothing designs. It allows for the quick construction of body models, virtual sewing of fabric panels, and realistic fabric simulation, all with high levels of accuracy and efficiency. Currently, mature virtual clothing design tools include the US Gerber company’s V-stitcher, Germany’s Assyst system, China Lingdi company’s Style 3D, and South Korea’s CLO Virtual Fashion company’s CLO 3D. In this study, we used the V4.7.369 version of the Style 3D apparel digital modelling platform to model samples by measuring their physical dimensions. During the modelling process of the T-shirt samples, common basic cotton knitted fabric was selected. The size of the virtual model was based on the Chinese standard GB/T 1335.2-2008 “Women’s clothing size” for a female model with a height of 165 cm and a size of 88 A. The 21 T-shirt styles with more distinctive image and style differences among the 137 samples were mainly displayed. The samples were modelled, worn on the same virtual model, and paired with consistent basic-style trousers. The results of the pre-processed modelling samples are shown in Figure 1.
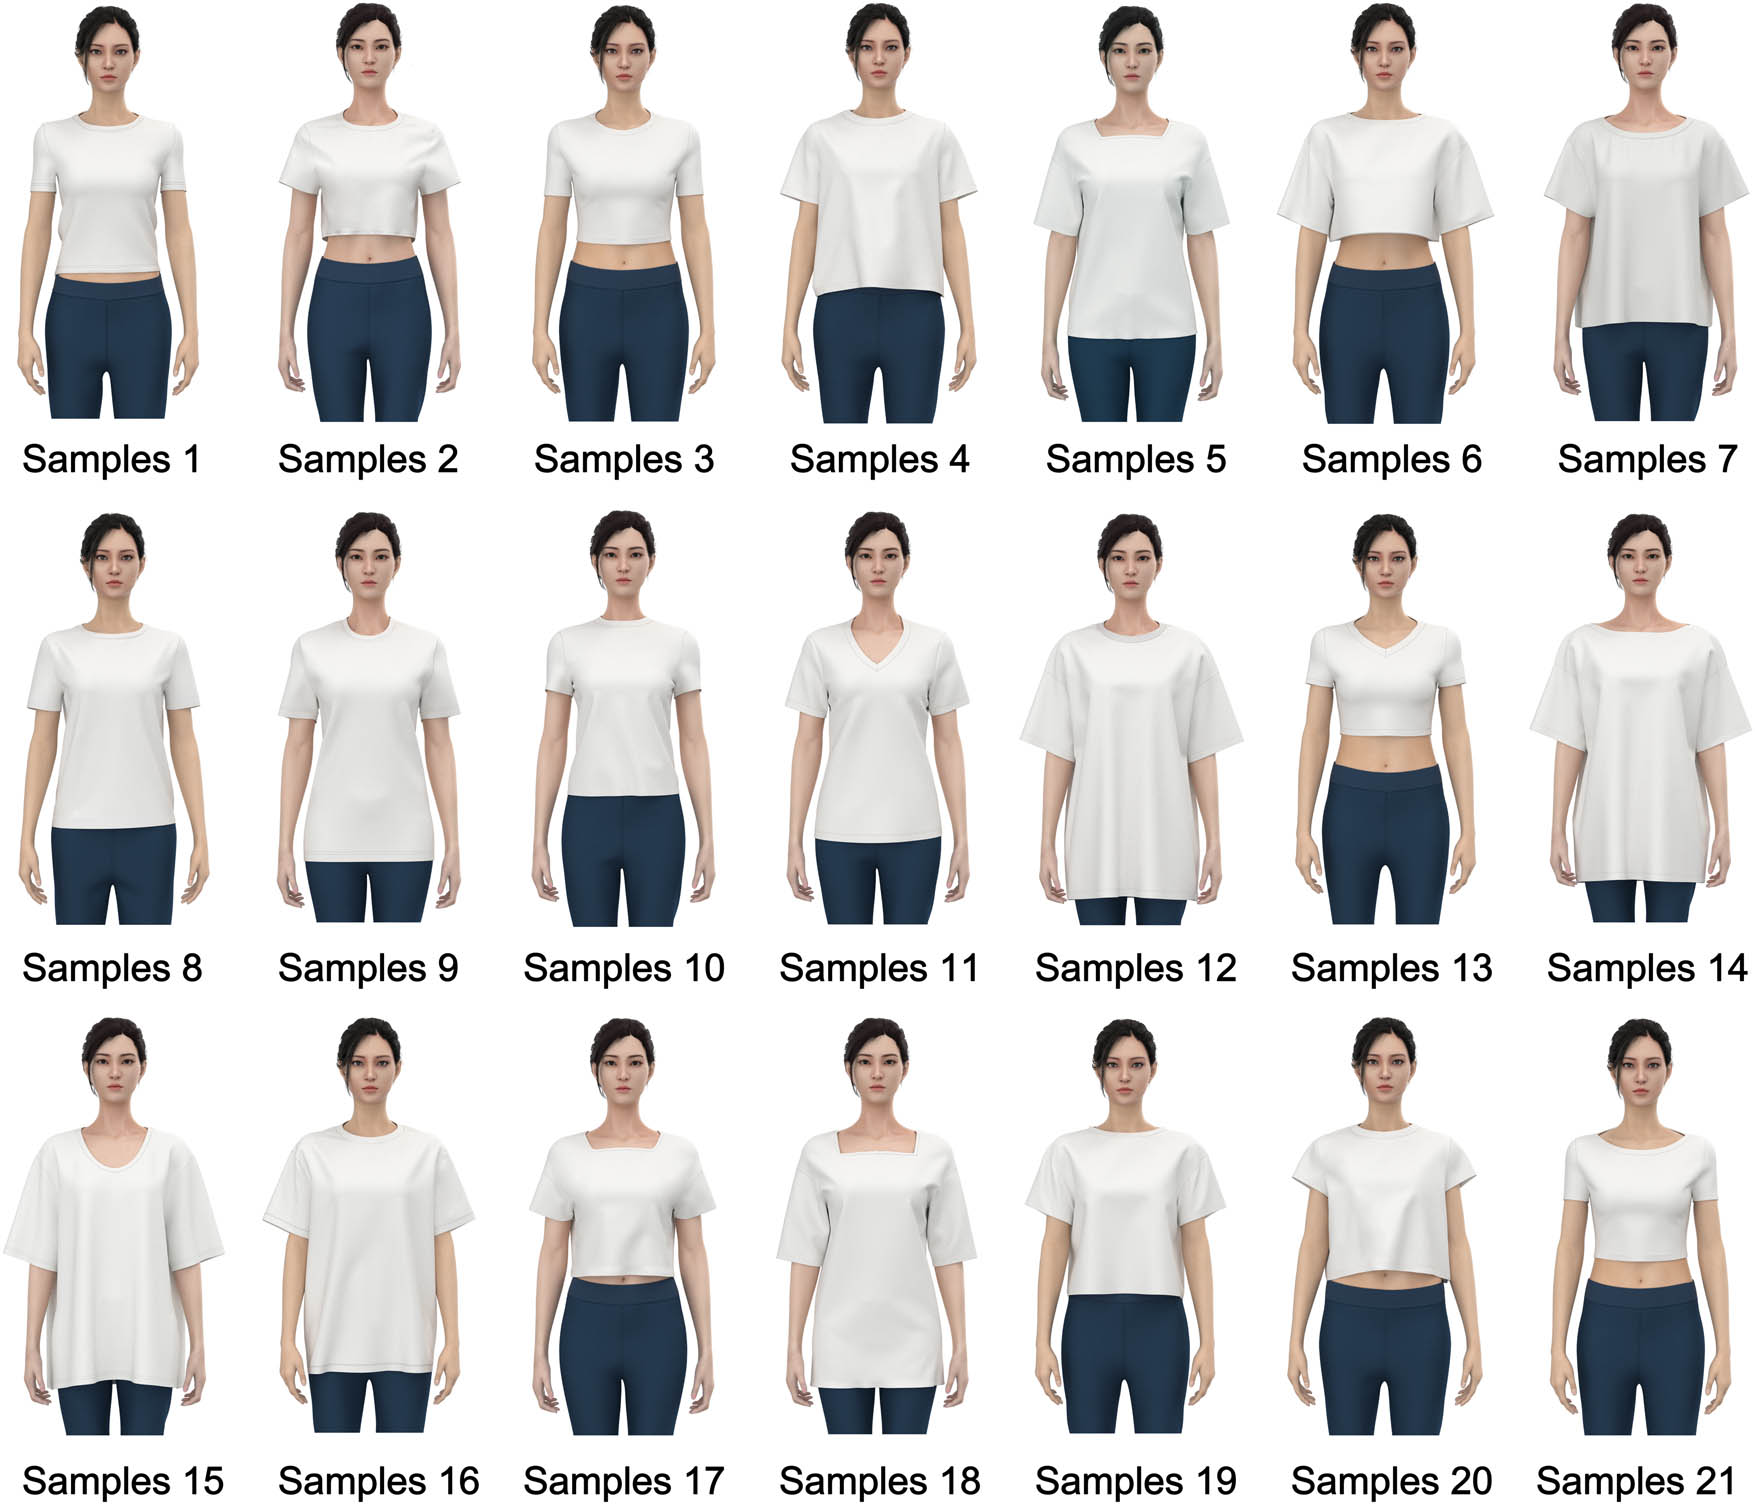
Representative sample modelling diagram.
3.2 Analysis of key elements
3.2.1 Parametric pattern making
Popular general drafting CAD software includes AutoCAD developed by Autodesk in the United States, MatLab developed by Mathworks, and Lectra developed in France. MatLab is primarily used for scientific calculation, data visualisation, and interactive programming. It features a powerful image processing toolkit that allows designers to handle complex curves in paper samples more easily and solves issues such as the inability of traditional automatic code pushing to adjust each dimension independently [26]. For parametric mapping in this study, we selected the MatLab software platform to draw clothing patterns and determined the dimensional formulae for the function programs based on the intrinsic structural relationships.
Taking the front piece and sleeve piece of a women’s T-shirt as an example, the design method of the women’s clothing style and pattern series in the reference book for clothing students in Chinese higher education institutions is referred to, and the intrinsic calculation formula and parametric drawing method of the paper pattern structure are proposed. The key variables for the front piece of a women’s T-shirt are the bust, collar, shoulder width, and garment length, while the key variables for the sleeve piece are the sleeve cage and sleeve length. The standardised front piece and sleeve piece structure design is shown in Figure 2. The front piece of the garment is designed using the cage depth line as the horizontal axis and the front centre line as the vertical axis to establish a co-ordinate system with the intersection of the two lines as the origin of the front piece. For the sleeve piece, the horizontal axis is the drop line and the vertical axis is the sleeve centre line. The sizing formula is determined based on the structural relationships inherent in the garment, as shown in Table 1. The coordinate points are determined according to how the key variables and other secondary variables are plotted in the clothing pattern, as shown in Table 2.
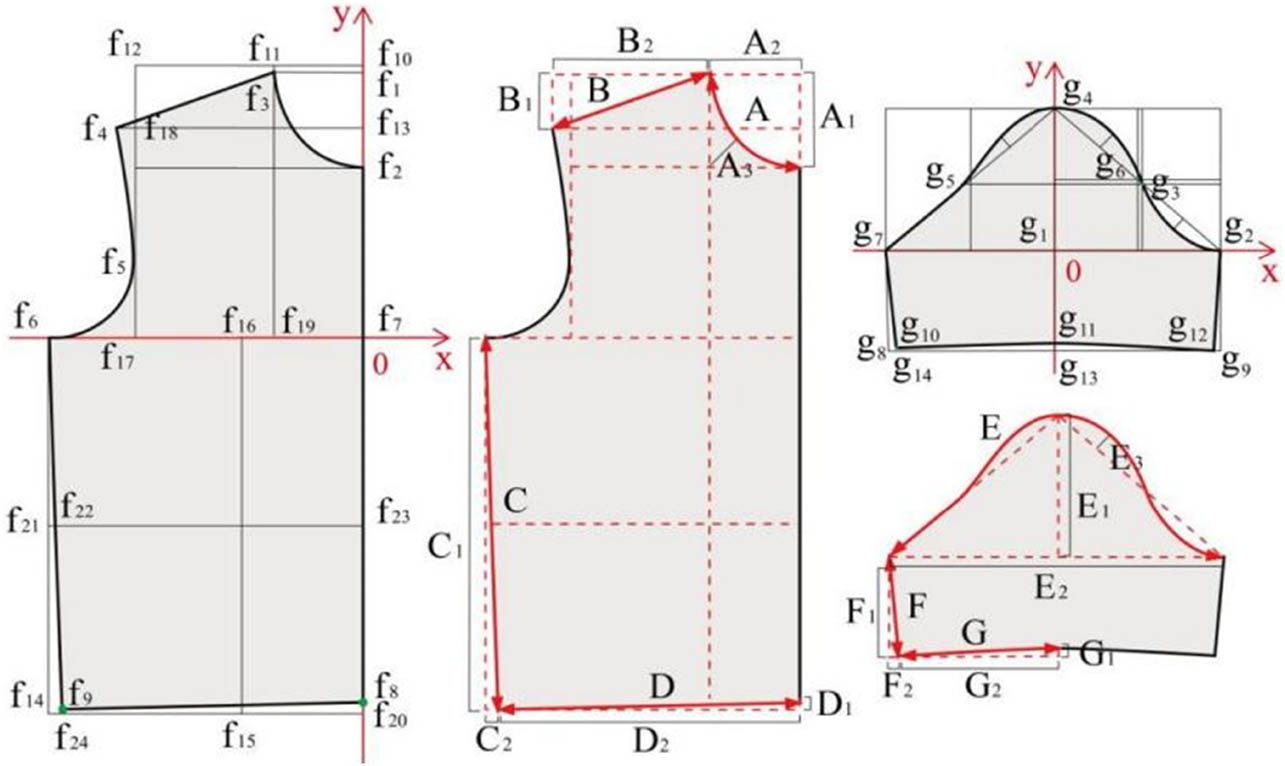
Structure of the front piece and sleeve piece of the women’s standardised T-shirt.
Women’s standardised T-shirt front piece and sleeve piece structure size relationship
| Location of the structure | Structural lines | Size calculation formula | Location of the structure | Structural lines | Size calculation formula |
|---|---|---|---|---|---|
| Length of clothing | f 1 f 20 | L | Side seam hem rise | f 9 f 24 | a 4 |
| Armhole depth | f 7 f 10 | B/6 + 7 | Side seam bottom hem retraction | f 9 f 14 | a 5 |
| Front neck drop | f 1 f 2 | N/5 + a 1 | Waist retraction amount | f 21 f 22 | a 6 |
| Front neck across | f 1 f 3 | N/5 + a 2 | Front sleeve diagonal | g 2 g 4 | AH/2 |
| Side shoulder | f 4 f 13 | S/2 | Back sleeve diagonal | g 4 g 7 | AH/2 + 1 |
| Protruding front shoulder line | f 4 f 18 | 2 | Sleeve cap height | g 1 g 4 | AH/3 − b 1 |
| Front drop shoulder line | f 12 f 18 | B/18 | Sleeve length | g 4 g 13 | SL |
| Chest width | f 7 f 17 | B/6 + 3 | Sleeve side seam bottom hem retraction | g 8 g 10 | b 2 |
| Width of front | f 6 f 7 | B/4 + 2.5 | Sleeve side seam hem rise | g 10 g 12 | b 3 |
| Rise of front midsole swing | f 8 f 20 | a 3 | Rise of the middle hem of the sleeve | g 11 g 13 | b 4 |
Note: B is the bust, N is the neck, S is the shoulder breadth, L is the length of garment, AH is the arm hole, and a 1–a 6 and b 1–b 4 are the variables (set based on empirical).
Key points of women’s standardised T-shirt front piece and sleeve piece
| Point | X-coordinate | Y-coordinate | Point | X-coordinate | Y-coordinate |
|---|---|---|---|---|---|
| f 1 | 0 | B/6 + 7 − 0.5 | f 20 | 0 | −L + B/6 + 7 − 0.5 |
| f 2 | 0 | B/6 + 7 − N/5 − a 1 | f 21 | −(B/4 + 2.5) | −(L/2 − B/12 − 3.5) |
| f 3 | −(N/5 + a 2) | B/6 + 7 − 0.5 | f 22 | −(B/4 + 2.5 − a 6) | −(L/2 − B/12 − 3.5) |
| f 4 | −S/2 | B/6 + 7 − B/18 | f 23 | 0 | −(L/2 − B/12 − 3.5) |
| f 5 | −(B/6 + 3) | B/18 + 0.5 | f 24 | −(B/4 + 2.5) | −(L − B/6 − 7) |
| f 6 | −(B/4 + 2.5) | 0 | g 1 | 0 | 0 |
| f 7 | 0 | 0 | g 2 | 5(AH)2/36 | 0 |
| f 8 | 0 | −(L − B/6 – 7 − a 3) | g 3 | 5(AH)2/72 − 0.7 | AH/6 − 0.7 |
| f 9 | −(B/4 + 2.5 − a 4) | −(L − B/6 – 7 − a 5) | g 4 | 0 | AH/3 − b1 |
| f 10 | 0 | B/6 + 7 | g 5 | −5(AH)2/72 + 0.7 | AH/6 − 0.7 |
| f 11 | −(N/5 + a 2) | B/6 + 7 | g 6 | 5(AH)2/72 | AH/6 |
| f 12 | −(B/6 + 3) | B/6 + 7 | g 7 | −5(AH)2/36 − AH − 1 | 0 |
| f 13 | 0 | B/6 + 7 − B/18 | g 8 | −5(AH)2/36 − AH − 1 | −(SL − AH/3) |
| f 14 | −(B/4 + 2.5) | −(L − B/6 – 7) | g 9 | 5(AH)2/36 | −(SL − AH/3) |
| f 15 | −(B/12 + 1.5) | −(L − B/6 – 7) | g 10 | −5(AH)2/36 − AH − 1 − b 2 | −(SL − AH/3 + b 3) |
| f 16 | −(B/12 + 1.5) | 0 | g 11 | 0 | −(SL − AH/3 − b 4) |
| f 17 | −(B/6 + 3) | 0 | g 12 | 5(AH)2/36 − b 2 | −(SL − AH/3 + b 3) |
| f 18 | −(B/6 + 3) | B/9 + 7 | g 13 | 0 | −(SL − AH/3) |
| f 19 | −(N/5 + a 2) | 0 | g 14 | −5(AH)2/36 − AH − 1 − b 2 | −(SL − AH/3) |
Note: B is the bust, N is the neck, S is the shoulder breadth, L is the length of garment, AH is the arm hole, and a 1–a 6 and b 1–b 4 are the variables (set based on empirical).
The straight lines in the pattern were drawn using the plot function on the MatLab software platform, including the centre front line f 2 f 8, the shoulder line f 3 f 4, the side seam line f 6 f 9, the hem line f 8 f 9, the sleeve side seam lines g 7 g 10 and g 2 g 12, and the sleeve hem lines g 10 g 11 and g 11gg 12. The curves in the pattern were drawn using the Bezier curve model [27,28], including the front collar curve f 2 f 11, the front sleeve cage line f 4 f 6, the front sleeve cage line g 2 g 4 in the sleeve, and the back sleeve cage line g 4 g 7. Finally, the women’s T-shirt front piece and sleeve piece parametric planar platemaking function program was completed in MatLab. When the program is run, the mssback function in the Command Window is called, three samples are randomly selected as examples, and the corresponding parameter values are entered as shown in Table 3, resulting in the front and sleeve paper samples for the different parameter values shown in Figure 3.
Corresponding parameter values
| Name | B | N | S | L | AH | SL | a 1 | a 2 | a 3 | a 4 | a 5 | a 6 | b 1 | b 2 | b 3 | b 4 |
|---|---|---|---|---|---|---|---|---|---|---|---|---|---|---|---|---|
| Example 1/cm | 81.00 | 36.00 | 38.50 | 55.00 | 42.00 | 18.50 | 0.00 | 3.00 | 0.00 | 0.50 | 0.00 | 0.00 | 0.00 | 0.50 | 0.00 | 0.00 |
| Example 2/cm | 86.00 | 41.00 | 40.00 | 40.00 | 52.00 | 17.00 | 0.00 | 2.50 | 2.50 | 0.00 | 1.50 | 9.00 | 30.00 | 0.50 | 0.00 | 0.00 |
| Example 3/cm | 90.00 | 44.00 | 38.00 | 52.00 | 44.80 | 19.50 | 0.00 | 2.00 | 0.00 | 1.00 | 0.50 | 0.00 | 1.00 | 0.50 | 0.50 | 0.00 |
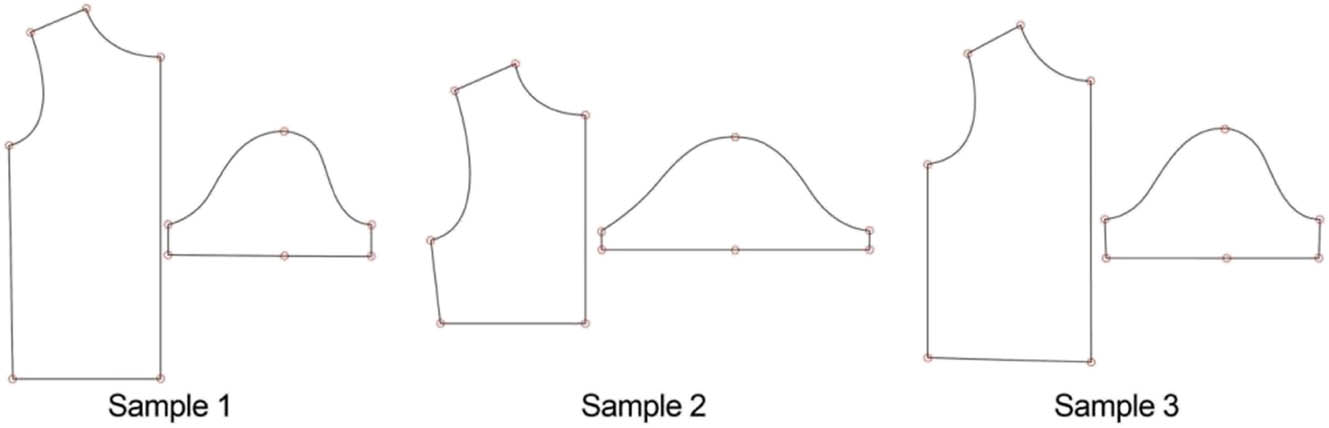
Women’s T-shirt front and sleeve pattern based on parameter values.
3.2.2 Quantification of key design elements
The pattern structure is decomposed according to four key parts: collar type, shoulder type, style and sleeve type, to obtain a total of seven elemental attributes from A to G. Further subdivisions are made according to the hierarchy to obtain the attribute categories. The reference for the subdivision includes the depth of the longitudinal direction, the width of the horizontal direction, and the squareness of the curvature range. We use Z, J, and K to denote a specific design element, Z for the specific element attribute, J for the Jth category attribute, and K for the Kth form of the attribute, as shown in Table 4. According to the proposed quantification method, three categories under seven attributes with a total of 48 attribute categories are identified as the basis for the parameterisation of the pattern structure, the samples are divided according to the attribute categories, and their optimal solutions are sought using an iterative optimisation algorithm.
Hierarchical classification of key elements, element attributes, and attribute categories
| Key elements | Collar shape | Shoulder shape | Styling | Sleeve shapes | ||||
|---|---|---|---|---|---|---|---|---|
| Elemental attributes | Attribute A | Attribute B | Attribute C | Attribute D | Attribute E | Attribute F | Attribute G | |
| Attribute category | Y-axis direction | Shallow type A11 | Flat type B11 | Short type C11 | Upper concave type D11 | Short type E11 | Short type F11 | Upper concave type G11 |
| Moderate type A12 | Moderate type B12 | Moderate type C12 | Flat type D12 | Moderate type E12 | Moderate type F12 | Flat type G12 | ||
| Deep type A13 | Drop type B13 | Long Type C13 | Downward arc type D13 | Long type E13 | Long type F13 | Downward arc type G13 | ||
| X-axis direction | Narrow type A21 | Narrow type B21 | Straight type C21 | Narrow type D21 | Narrow type E21 | Straight type F21 | Narrow type G21 | |
| Moderate type A22 | Moderate type B22 | Tucked-in waist type C22 | Moderate type D22 | Moderate type E22 | Inwardly concave type F22 | Moderate type G22 | ||
| Wide type A23 | Wide type B23 | Outwardly convex type C23 | Wide type D23 | Wide type E23 | Outwardly convex type F23 | Wide type G23 | ||
| Radian range | Square type A31 | / | / | / | Small curvature type E31 | / | / | |
| Round type A32 | / | / | / | Moderate type E32 | / | / | ||
| V-shape type A33 | / | / | / | Large curvature type E33 | / | / | ||
3.2.3 Data normalisation processing
Back-propagation neural network algorithms commonly used in artificial neural networks include steepest descent method [29], gradient descent [30], and Newton method [31]. Among them, gradient descent is the core training algorithm in the field of computer learning, with the advantages of small storage requirements, high operability, and low implementation difficulty. In this study, the stochastic gradient descent (SGD) [32] is used for model optimisation. Given the huge variation in size between the different features of the data, we need to normalise the mapping data of the design elements before using the gradient descent method. The min–max method is adopted to process the training set and test set data so that they fall within the interval [0,1], as shown in equation (1):
Taking the subdivision category A1 under attribute A as an example, the further subdivisions A11, A12, and A13 under category A1 were labelled as {0,0.5,1}. The same normalisation process was carried out for all attribute category subdivision data according to equation (1) to obtain the data for the sample as shown in Table 5.
Attribute category parameters
| Serial number | A1 | A2 | A3 | B1 | B2 | C1 | C2 | D1 | D2 | E1 | E2 | E3 | F1 | F2 | G1 | G2 |
|---|---|---|---|---|---|---|---|---|---|---|---|---|---|---|---|---|
| Sample 1 | 0.5 | 1 | 0.5 | 0.5 | 0 | 0.5 | 1 | 0.5 | 0 | 1 | 0 | 1 | 0.5 | 0 | 0 | 0 |
| Sample 2 | 0.5 | 0.5 | 0.5 | 0.5 | 0.5 | 0 | 1 | 0 | 0 | 0 | 1 | 1 | 0 | 1 | 0 | 1 |
| Sample 3 | 1 | 0.5 | 0.5 | 0.5 | 0 | 0 | 1 | 0 | 0 | 1 | 0 | 1 | 0.5 | 1 | 0 | 0 |
| Samples 4–136 | ||||||||||||||||
| Sample 137 | 1 | 1 | 0.5 | 0 | 0 | 0 | 1 | 0 | 0 | 1 | 0 | 1 | 0 | 1 | 0 | 0 |
3.3 Kansei image acquisition
The 62 T-shirt-style intention words initially collected were analysed and aggregated into 11 words with high frequency of occurrence. After the second round of cluster analysis, five basic Kansei intention words were obtained, which were avant-garde, casual, sporty, classic, and elegant. The Likert scale, the most widely used in survey research, was selected to combine the 5 words with 137 samples to build a 5-level scale, and a questionnaire on the perception of women’s T-shirt style Kansei image was distributed through an online platform. A total of 76 valid questionnaires were returned, and the image evaluation values were obtained using statistical analysis, as shown in Table 6.
Evaluation values of Kansei image
| Serial number | Avant-garde | Casual | Sporty | Classic | Elegant |
|---|---|---|---|---|---|
| Sample 1 | 1.76 | 2.14 | 4.25 | 3.32 | 2.68 |
| Sample 2 | 4.12 | 3.43 | 1.89 | 2.05 | 2.73 |
| Sample 3 | 3.14 | 2.57 | 4.07 | 2.33 | 3.26 |
| Samples 4–135 | |||||
| Sample 136 | 3.33 | 3.56 | 2.67 | 3.20 | 1.96 |
| Sample 137 | 4.19 | 1.78 | 3.43 | 2.74 | 2.14 |
3.4 Construction of cognitive model for styling intention
Back-propagation neural network algorithms are trained using MatLab software. The network training results are judged on the basis of the errors in the test and validation sets. The number of iterations of the network training should be moderate, too few iterations of the algorithm are not accurate, and too many may lead to overfitting. The smaller the mean square error value of the training data, the closer the output value is to the target value. The size of the error gradient indicates the size of the change in weights and thresholds. The closer the parameter curve in the training process graph is to the target curve, the better the network is trained [33]. The number of neuron layers in the input layer is 18 and the number of neuron layers in the output layer is 5, which is consistent with the structure of the training sample data. Sigmoid was chosen as the activation function of the hidden layer, linear was chosen as the activation function of the output layer, and the back-propagation method was used to perform the operation. The algorithm path is shown in Figure 4. More than 50 iterations of training were carried out during the training iteration. The network reached the optimum when the 46th training was performed, so the current network parameters were applied. The training results are shown in Figure 5, where the R value indicates the prediction accuracy of the neural network (taking values in the range of 0–1). The model constructed by multiple training (R ≥ 0.81) has a high accuracy, which is in line with the experimental design research needs.
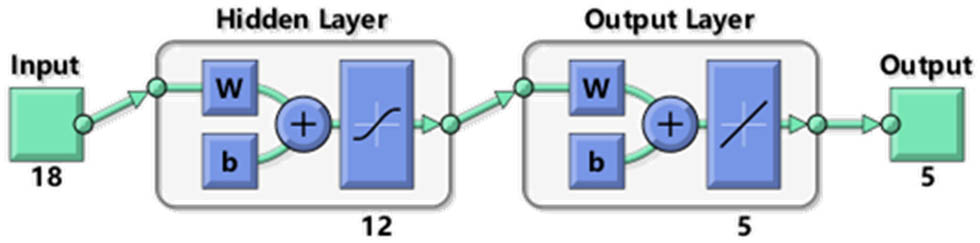
Algorithm path.
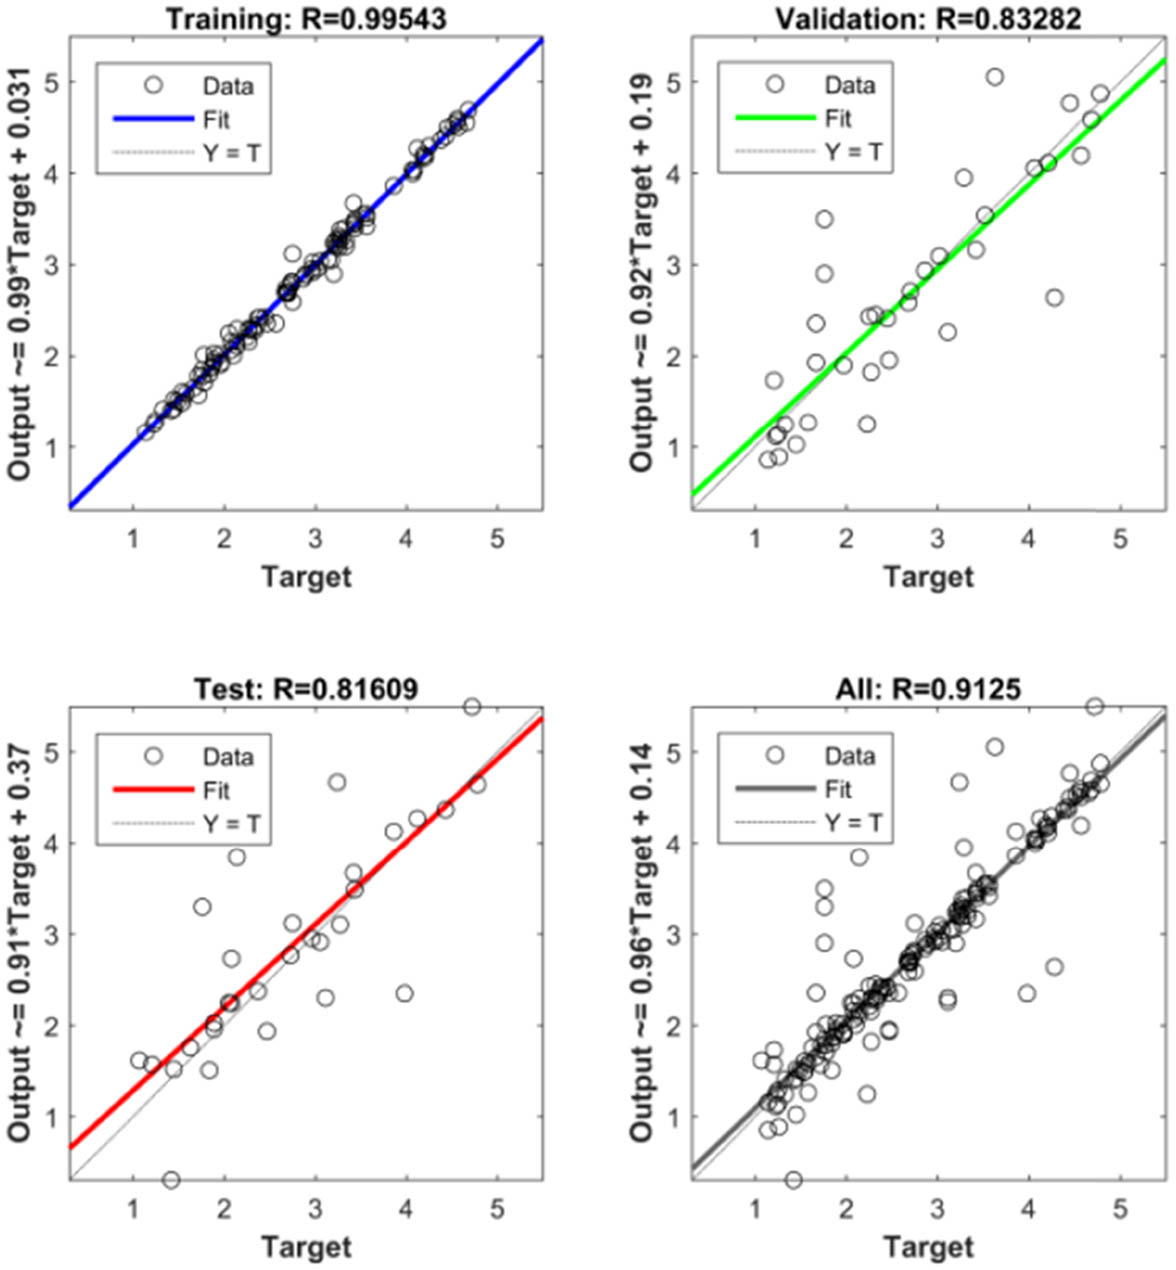
Optimal training results.
4 Experimental conclusions and evaluation
4.1 Conclusion
The generalisation ability of the neural network can reasonably predict the probability of a change in the same type of sample, and by combining it with the enumeration algorithm, the optimal combination form can be derived by verifying the pattern of all combinations of attribute categories. A function is created from the aforementioned back-propagation neural network model and called in the enumeration algorithm to obtain an optimisation algorithm for the combination of women’s T-shirt attribute categories. The optimal combination of attribute categories under the perception of the user’s target Kansei image is shown in Table 7. The optimal-style design form was modelled and displayed in the Style 3D platform, as shown in Figure 6.
The optimal combination form
| Characteristic | Avant-garde | Casual | Sporty | Classic | Elegant |
|---|---|---|---|---|---|
| Attribute A | Moderate type A12 | Deep type A13 | Shallow type A11 | Moderate type A12 | Deep type A13 |
| Wide type A23 | Moderate type A22 | Moderate type A22 | Moderate type A22 | Wide type A23 | |
| Round type A32 | Round type A32 | Round type A32 | Round type A32 | Square type A31 | |
| Attribute B | Flat type B11 | Drop type B13 | Moderate type B12 | Moderate type B12 | Drop type B13 |
| Moderate type B22 | Moderate type B22 | Narrow type B21 | Moderate type B22 | Wide type B23 | |
| Attribute C | Short type C11 | Long type C13 | Moderate type C12 | Long type C13 | Moderate type C12 |
| Straight type C21 | Straight type C21 | Tucked-in waist type C22 | Tucked-in waist type C22 | Tucked-in waist type C22 | |
| Attribute D | Upper concave type D11 | Downward arc type D13 | Flat type D12 | Downward arc type D13 | Flat type D12 |
| Narrow type D21 | Wide type D23 | Narrow type D21 | Moderate type D22 | Moderate type D22 | |
| Attribute E | Short type E11 | Short type E11 | Long type E13 | Moderate type E12 | Short type E11 |
| Wide type E23 | Wide type E23 | Narrow type E21 | Wide type E23 | Wide type E23 | |
| Large curvature type E33 | Large curvature type E33 | Large curvature type E33 | Large curvature type E33 | Small curvature type E31 | |
| Attribute F | Short type F11 | Long type F13 | Moderate type F12 | Moderate type F12 | Long type F13 |
| Straight type F21 | Outwardly convex type F23 | Outwardly convex type F23 | Outwardly convex type F23 | Outwardly convex type F23 | |
| Attribute G | Flat type G12 | Flat type G12 | Flat type G12 | Upper concave type G11 | Flat type G12 |
| Wide type G23 | Wide type G23 | Narrow type G21 | Wide type G23 | Wide type G23 |

Optimal-style design form under target image.
4.2 Evaluation
The radar chart method is applied to visually characterise the weight of each indicator of the research object, quantify the contribution of each indicator to the overall morphology, and evaluate the distribution of the research object in each Kansei image attribute. Determine five evaluation indicators with the same weight based on emotional intention style. The radar diagram was constructed based on the indicators, and the average of the corresponding research scores was represented by different shaped “dots” on the indicator dimension axes. By connecting the dots on adjacent axes in the diagram, a closed polygon is formed, which represents the overall state of the sample’s Kansei image. The standardised radar chart is confined to a pentagon with a radius of 1, and the indicators are divided into 0.2, 0.4, 0.6, 0.8, and 1. The closer the value of the indicator is to 1, the higher the level of the indicator.
A questionnaire survey was conducted in three large shopping malls in Suzhou, China, in the clothing shopping area. A total of 89 questionnaires were returned, 86 of which were valid, with an effective rate of 96.63%. In the questionnaire, users were invited to rate a range of optimal-style designs for the target image on five main evaluation criteria dimensions. The data collected were statistically analysed and plotted as a radar chart. As can be seen from the results in Figure 7, the five optimal women’s T-shirt-style designs all fit well with the users’ Kansei perceptions. Therefore, the design method proposed in this study can be better applied in product design. Summarising the technology roadmap of this study is shown in Figure 8.
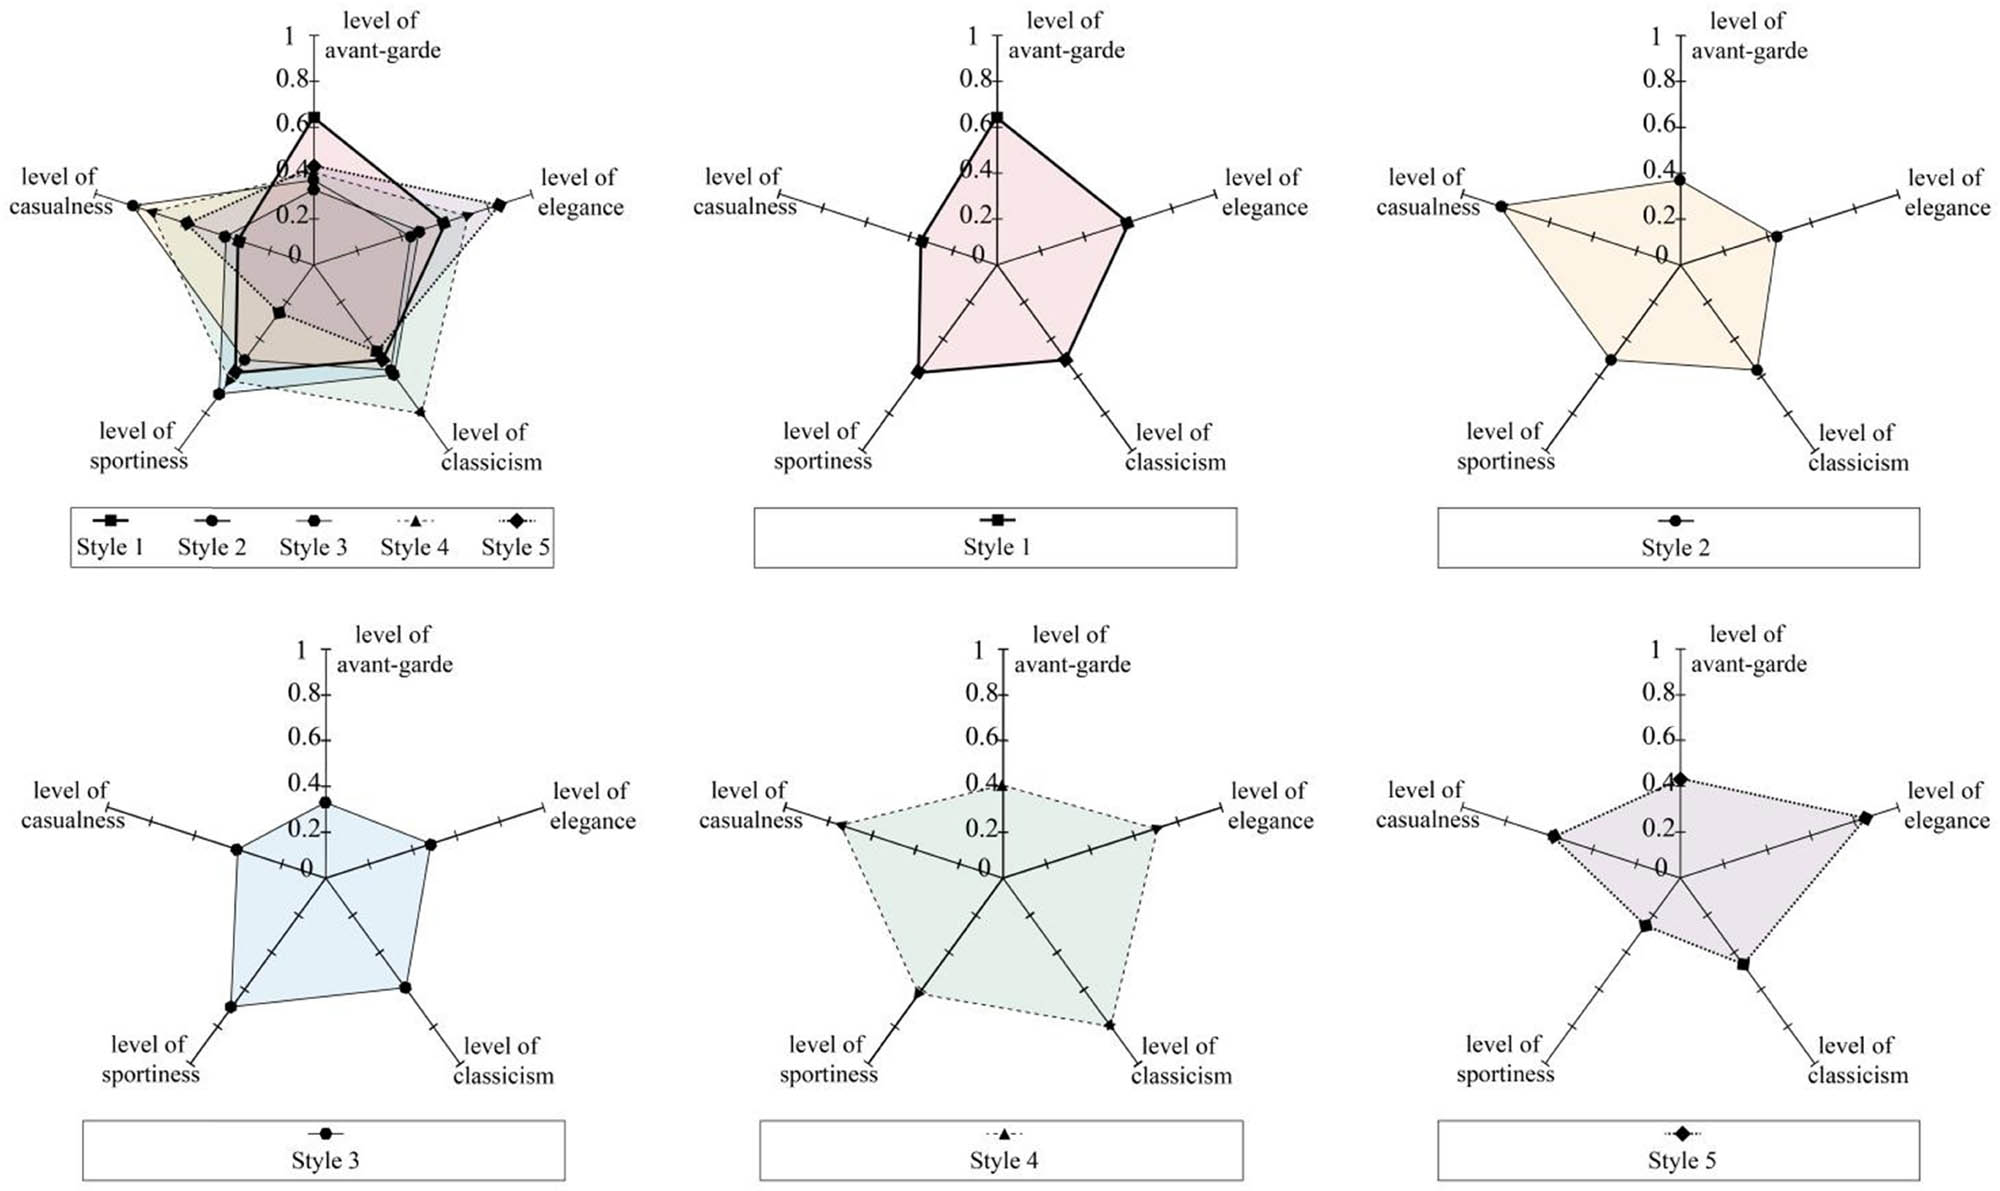
Indicator evaluation results.
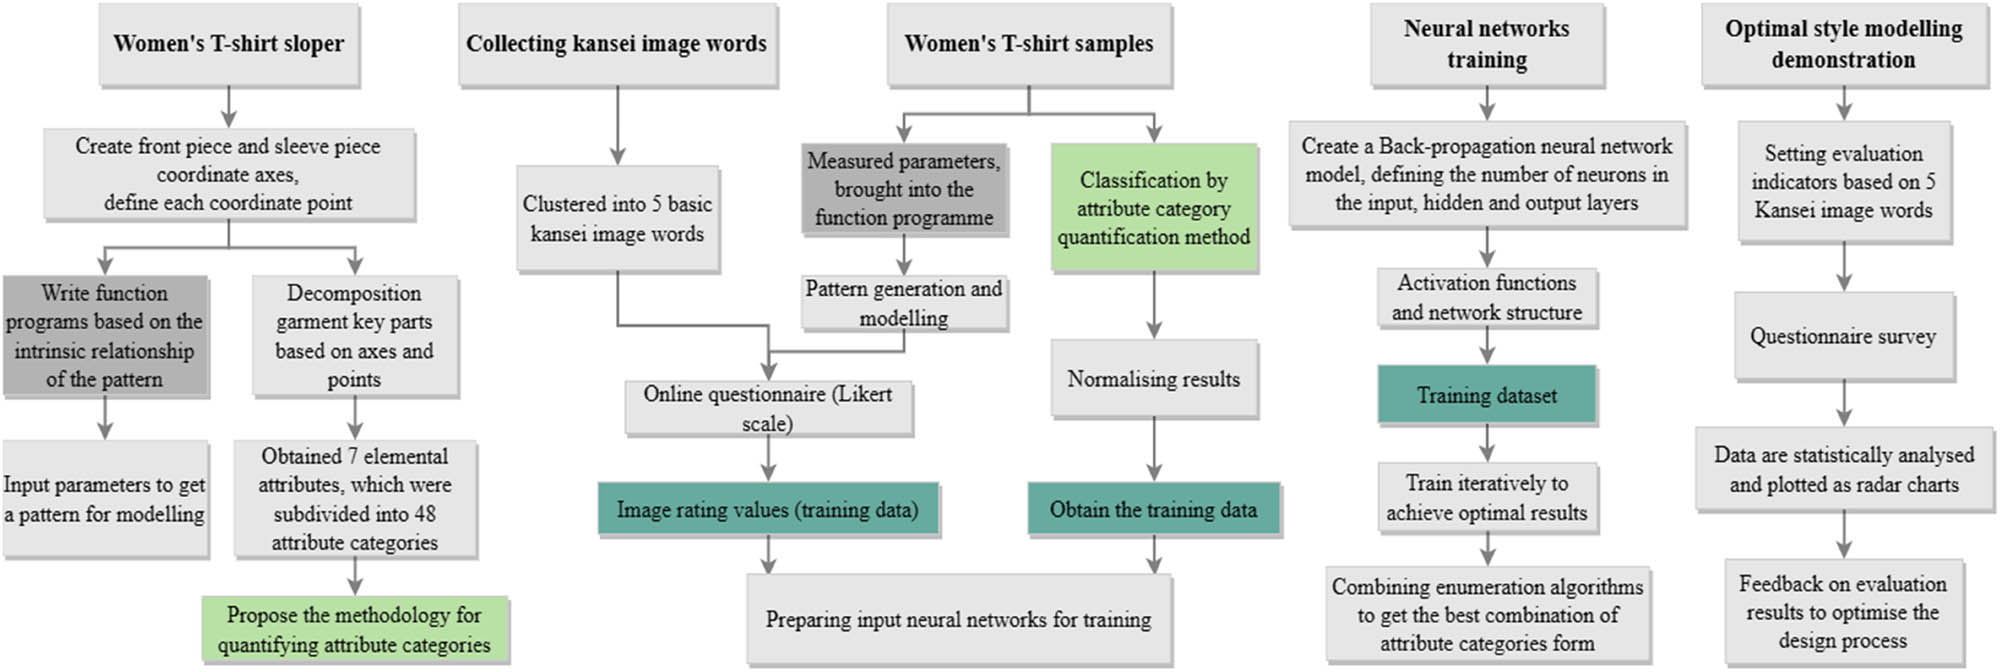
Technology roadmap.
5 Conclusions
The attribute category quantification method guided by parametric graphics theory can establish the key element breakdown hierarchy and guide the quantification process of the sample data in a more scientific and efficient way. With the aid of the MatLab software platform, we established a basic functional model of the clothing patterns using the mathematical relationship between key structural points and key parameters of the garment to obtain the parameters of the experimental samples. Building the neural network model and combining it with an enumeration algorithm allows analysing the optimal form of combination of style attribute categories. The parameters of the attribute categories of the normalised representative samples are combined with the user image evaluation indexes to form a training set and brought into the model training, and finally, the optimal design results of five categories of women’s T-shirt styles under the target image are proposed. According to the results of the radar chart multi-indicator evaluation, the model has a certain degree of credibility. The design model can transform users’ ambiguous emotional perceptions into effective design strategies and provide a reference for the implementation of computer-aided apparel style design.
-
Funding information: This work was supported by the Postgraduate Research and Practice Innovation Program of Jiangsu Province (Grant Number KYCX20_1891).
-
Conflict of interest: Authors state no conflict of interest.
References
[1] Tekin, S., Kanat, S. (2022). The effects of sensory marketing on clothing-buying behavior. Autex Research Journal, 23, 315–322. 10.2478/aut-2022-0016.Search in Google Scholar
[2] Hartono, M. (2020). The modified Kansei engineering-based application for sustainable service design. International Journal of Industrial Ergonomics, 79, 102985.10.1016/j.ergon.2020.102985Search in Google Scholar
[3] Hartono, M., Raharjo, H. (2015). Exploring the mediating role of affective and cognitive satisfaction on the effect of service quality on loyalty. Total Quality Management & Business Excellence, 26(9–10), 971–985.10.1080/14783363.2015.1068595Search in Google Scholar
[4] Guo, F., Qu, Q. X., Nagamachi, M., Duffy, V. G. (2020). A proposal of the event-related potential method to effectively identify Kansei words for assessing product design features in Kansei engineering research. International Journal of Industrial Ergonomics, 76, 102940.10.1016/j.ergon.2020.102940Search in Google Scholar
[5] Sunkyoung, B., Myunggwon, H., Hyunsook, C., Pankoo, K. (2008). Kansei factor space classified by information for Kansei image modeling. Applied Mathematics and Computation, 205(2), 874–882.10.1016/j.amc.2008.05.080Search in Google Scholar
[6] Yeh, C. T., Chen, M. C. (2018). Applying Kansei Engineering and data mining to design door-to-door delivery service. Computers & Industrial Engineering, 120, 401–417.10.1016/j.cie.2018.05.011Search in Google Scholar
[7] Coronado, E., Venture, G., Yamanobe, N. (2020). Applying Kansei/affective engineering methodologies in the design of social and service robots: A systematic review. International Journal of Social Robotics, 13(5), 1161–1171.10.1007/s12369-020-00709-xSearch in Google Scholar
[8] Nagamachi, M. (1995). Kansei engineering: A new ergonomic consumer-oriented technology for product development. International Journal of Industrial Ergonomics, 15(1), 3–11.10.1016/0169-8141(94)00052-5Search in Google Scholar
[9] Wu, Y. H., Lin. L. (2021). The construction of a KCQ-KE model for the color image cognition of Miao costumes in Guizhou. Journal of Silk, 58(2), 122–130.Search in Google Scholar
[10] Lv, X. J., Xu, J. (2021). Color matching evaluation of women’s garments based on Kansei engineering. Wool Textile Journal, 49(2), 94–98.Search in Google Scholar
[11] Yu, X. L. (2016) Research on online clothing store design based on Kansei image. Journal of Silk, 53(7), 43–48.Search in Google Scholar
[12] Huang, X., Sobue, S., Chen, Y. W. (2003). Retrieval of clothing fabric images based on Kansei words. Information, 6, 215–230.Search in Google Scholar
[13] Kodžoman, D., Hladnik, A., Čuden, A. P., Čok, V. (2022). Assessment and Semantic Categorization of Fabric Visual Texture Preferences. Autex Research Journal, 23, 279–291.10.2478/aut-2022-0006Search in Google Scholar
[14] Fujii, C., Takatera, M., Kim, K. (2017). Effects of combinations of patternmaking methods and dress forms on garment appearance. Autex Research Journal, 17(3), 277–286.10.1515/aut-2016-0020Search in Google Scholar
[15] Zheng, T. Z., Wang, J. P. (2020). Perceptual research on printing pattern design for clothing. Journal of Textile Research, 41(8), 101–107.Search in Google Scholar
[16] Hu, M. Y., Ji, Y. B., Liu, K. X. (2021). Geometric pattern evaluation of men’s shirts based on Kansei engineering. Wool Textile Journal, 49(7), 35–39.Search in Google Scholar
[17] Chen, D., Cheng, P., Simatrang, S., Joneurairatana, E. (2021). Kansei engineering as a tool for the design of traditional pattern. Autex Research Journal, 21(1), 125–134.10.2478/aut-2019-0052Search in Google Scholar
[18] Li, Q. W., Wang, J. P., Yang Y. L., Zhang, B. J., Li, Z. L. (2021). Perceptual evaluation of men’s suit style elements based on quantitative theory I. Journal of Textile Research, 42(5), 155–161.Search in Google Scholar
[19] Chen, D., Cheng, P. (2020). The style design of professional female vest based on Kansei engineering. International Journal of Clothing Science and Technology, 32(1), 5–11.10.1108/IJCST-07-2018-0090Search in Google Scholar
[20] Yang, C. C. (2011). Constructing a hybrid Kansei engineering system based on multiple affective responses: Application to product form design. Computers & Industrial Engineering, 60(4), 760–768.10.1016/j.cie.2011.01.011Search in Google Scholar
[21] Ye, Q. W., Zhang, G. P. (2019). Generation of personalized garment pattern based on AutoCAD parameterization. Journal of Textile Research, 40(4), 103–110.Search in Google Scholar
[22] Olaru, S., Filipescu, E., Niculescu, C., Filipescu, E. (2013). Morphological assessment of human body for clothing patterns design. Industria Textila, 64(5), 254–259.Search in Google Scholar
[23] Haglin, J. M., Jimenez, G., Eltorai, A. E. (2019). Artificial neural networks in medicine. Health and Technology, 9, 1–6.10.1007/s12553-018-0244-4Search in Google Scholar
[24] Zhang, L. (2016). Study on location selection of logistics distribution center based on spider chart. International Journal of u-and e-Service, Science and Technology, 9(1), 297–308.10.14257/ijunesst.2016.9.10.28Search in Google Scholar
[25] Li, X., Hong, W., Wang, J., Song, J., Kang, J. (2006). Research on the radar chart theory applied to the indoor environmental comfort level evaluation. In 2006 6th World Congress on Intelligent Control and Automation (Vol. 1, pp. 5214–5217). IEEE.Search in Google Scholar
[26] Zhang, L. L., Zhang, G. P. (2019). Parametric flat pattern design for clothing based on MatLab. Journal of Textile Research, 40(1), 130–135.Search in Google Scholar
[27] Song, K., Zhang, W. Y. (2001). Approximation of the apparel construction curves with Bézier curves. Melliand China, 4, 76–79.Search in Google Scholar
[28] Wang, C. W. (2021). New extension of cubic Bézier curve with three parameters and their application. Journal of Beijing Institute of Fashion Technology (Natural Science Edition), 41(1), 54–60.Search in Google Scholar
[29] Chester, C., Friedman, B., Ursell, F. (1957). An extension of the method of steepest descents. Mathematical Proceedings of the Cambridge Philosophical Society, Cambridge University Press, 53(3), 599–611.10.1017/S0305004100032655Search in Google Scholar
[30] Lee, J. D., Simchowitz, M., Jordan, M. I., Recht, B. (2016). Gradient descent only converges to minimizers. In Conference on learning theory, PMLR, 49, 1246–1257.Search in Google Scholar
[31] Setiono, R., Hui, L. C. K. (1995). Use of a quasi-Newton method in a feedforward neural network construction algorithm. IEEE Transactions on Neural Networks, 6(1), 273–277.10.1109/72.363426Search in Google Scholar PubMed
[32] Bottou, L. (1998). Online algorithms and stochastic approximations. Online Learning in Neural Networks.10.1017/CBO9780511569920.003Search in Google Scholar
[33] Pradhan, B., Lee, S. (2010). Regional landslide susceptibility analysis using back-propagation neural network model at Cameron Highland, Malaysia. Landslides, 7(1),13–30.10.1007/s10346-009-0183-2Search in Google Scholar
© 2024 by the authors, published by De Gruyter
This work is licensed under the Creative Commons Attribution 4.0 International License.
Articles in the same Issue
- Characterization of viscoelastic properties of yarn materials: Dynamic mechanical analysis in the transversal direction
- Analysis of omni-channel implementations that are preferred by consumers in clothing sector
- Structural modeling and analysis of three-dimensional cross-linked braided preforms
- An experimental study of mechanical properties and comfortability of knitted imitation woven shirt fabrics
- Technology integration to promote circular economy transformation of the garment industry: a systematic literature review
- Research on T-shirt-style design based on Kansei image using back-propagation neural networks
- Research on She nationality clothing recognition based on color feature fusion with PSO-SVM
- Accuracy prediction of wearable flexible smart gloves
- Preparation and performance of stainless steel fiber/Lyocell fiber-blended weft-knitted fabric
- Development of an emotional response model for hospital gown design using structural equation modeling
- Preparation and properties of stainless steel filament/pure cotton woven fabric
- Facemask comfort enhancement with graphene oxide from recovered carbon waste tyres
- Use of enzymatic processes in the tanning of leather materials
- Optical-related properties and characterization of some textile fibers using near-infrared spectroscopy
- Network modeling of aesthetic effect for Chinese Yue Opera costume simulation images
- Predicting consumers’ garment fit satisfactions by using machine learning
- Non-destructive identification of wool and cashmere fibers based on improved LDA using NIR spectroscopy
- Study on the relationship between structure and moisturizing performance of seamless knitted fabrics of protein fibers for autumn and winter
- Antibacterial and yellowing performances of sports underwear fabric with polyamide/silver ion polyurethane filaments
- Numerical and experimental analysis of ballistic performance in hybrid soft armours composed of para-aramid triaxial and biaxial woven fabrics
- Phonetic smart clothing design based on gender awareness education for preschoolers
- Determination of anthropometric measurements and their application in the development of clothing sizing systems for women in the regions of the Republic of Croatia
- Research on optimal design of pleated cheongsam based on Kano–HOQ–Pugh model
- Numerical investigation of weaving machine heald shaft new design using composite material to improve its performance
- Corrigendum to “Use of enzymatic processes in the tanning of leather materials”
- Shaping of thermal protective properties of basalt fabric-based composites by direct surface modification using magnetron sputtering technique
- Numerical modeling of the heat flow component of the composite developed on the basis of basalt fabric
- Weft insertion guideway design based on high-temperature superconducting levitation
- Ultrasonic-assisted alkali hydrolysis of polyethylene terephthalate fabric and its effect on the microstructure and dyeing properties of fibers
- Comparative study on physical properties of bio-based PA56 fibers and wearability of their fabrics
- Investigation of the bias tape roll change time efficiency in garment factories
- Analysis of foot 3D scans of boys from Polish population
- Optimization of garment sewing operation standard minute value prediction using an IPSO-BP neural network
- Influence of repeated switching of current through contacts made of electroconductive fabrics on their resistance
- Numerical calculation of air permeability of warp-knitted jacquard spacer shoe-upper materials based on CFD
- Compact Spinning with Different Fibre Types: An Experimental Investigation on Yarn Properties in the Condensing Zone with 3D-Printed Guiding Device
- Modeling of virtual clothing and its contact with the human body
- Advances in personalized modelling and virtual display of ethnic clothing for intelligent customization
- Investigation of weave influence on flame retardancy of jute fabrics
- Balloonless spinning spindle head shape optimisation
- Research on 3D simulation design and dynamic virtual display of clothing flexible body
- Turkish textile and clothing SMEs: Importance of organizational learning, digitalization, and internationalization
- Corrigendum To: “Washing characterization of compression socks”
- Study on the promotion multiple of blood flow velocity on human epidermal microcirculation of volcanic rock polymer fiber seamless knitted fabric
- Bending properties and numerical analysis of nonorthogonal woven composites
- Bringing the queen mother of the west to life: Digital reconstruction and analysis of Taoist Celestial Beings Worshiping mural’s apparel
- Modeling process for full forming sports underwear
- Retraction of: Ionic crosslinking of cotton
- An observational study of female body shape characteristics in multiracial Malaysia
- Study on theoretical model and actual deformation of weft-knitted transfer loop based on particle constraint
- Design and 3D simulation of weft-knitted jacquard plush fabrics
- An overview of technological challenges in implementing the digital product passport in the textile and clothing industry
- Understanding and addressing the water footprint in the textile sector: A review
- Determinants of location changes in the clothing industry in Poland
- Influence of cam profile errors in a modulator on the dynamic response of the heald frame
- Quantitative analysis of wool and cashmere fiber mixtures using NIR spectroscopy
- 3D simulation of double-needle bar warp-knitted clustered pile fabrics on DFS
- Finite element analysis of heat transfer behavior in glass fiber/metal composite materials under constant heat load
- Price estimation and visual evaluation of actual white fabrics used for dress shirts and their photographic images
- Effect of gluing garment materials with adhesive inserts on their multidirectional drape and bending rigidity
- Optimization analysis of carrier-track collision in braiding process
- Numerical and experimental analysis of the ballistic performance of soft bulletproof vests for women
- The antimicrobial potential of plant-based natural dyes for textile dyeing: A systematic review using prisma
- Influence of sewing parameters on the skin–fabric friction
- Validation by experimental study the relationship between fabric tensile strength and weave structures
- Optimization of fabric’s tensile strength and bagging deformation using surface response and finite element in stenter machine
- Analysis of lean manufacturing waste in the process flow of ready-to-wear garment production in Nigeria
- An optimization study on the sol–gel process to obtain multifunctional denim fabrics
- Drape test of fully formed knitted flared skirts based on 3D-printed human body posture
- Supplier selection models using fuzzy hybrid methods in the clothing textile industry