Testing and evaluation of cold-start emissions from a gasoline engine in RDE test at two different ambient temperatures
-
Jacek Pielecha
 ,
Kinga Skobiej
,
Kinga Skobiej

Abstract
In order to better reflect the actual ecological performance of vehicles in traffic conditions, both the emission standards and the applied emission tests are being developed, for example by considering exhaust emissions for a cold engine start. This article presents the research results on the impact of ambient temperature during the cold start of a gasoline engine in road emission tests. The Real Driving Emissions (RDE) tests apply to passenger cars that meet the Euro 6 emissions norm and they are complementary to their type approval tests. A portable emissions measurement system was used to record the engine and vehicle operating parameters, as well as to measure the exhaust emissions during tests. This allowed for parameters such as engine load, engine speed and vehicle speed to be monitored. The cold start conditions for two different temperatures (8°C and 25°C) were compared in detail. Moreover, the engine operating parameters, exhaust concentration values and road emissions for the 300 s time interval, were compared. The summary of the article presents the share of a passenger car’s cold start phase for each exhaust compound in the urban part of the test and in the entire Real Driving Emissions test depending on the ambient temperature.
1 Introduction
Increasingly stringent environmental requirements have resulted in significant changes in the exhaust emissions evaluation from motor vehicles. It was considered that type approval tests carried out in laboratory conditions (on a chassis dynamometer) are not sufficient. Complementary exhaust emissions testing in real traffic conditions has been introduced to amend that. Such real traffic conditions may be characterized by variability of parameters (in an extent as limited by standards) while the values of exhaust emissions cannot be greater than those specified in the relevant regulations. The tests are possible to perform by using Portable Emissions Measurement Systems (PEMS) type mobile research equipment.
According to the Commission Regulation (EU) 2016/646 of 20 April 2016 amending Regulation (EC) No. 692/2008 a new emissions norm Euro 6d-Temp has been established. The requirements of this norm are an extension of the Euro 6 emissions norm regarding road exhaust emissions of nitrogen oxides (NOx) and the particle number (PN) emissions for passenger cars equipped with gasoline engines, as well as introducing conformity factors (excess emissions) which have been given the value of 1.43 (from 2020). The real driving emissions (RDE) procedure has been introduced in the European Union by Regulation 2017/1151 of 1 July 2017 and updated by Regulation 2017/1154 of 7 July 2017.
For practical purposes, the RDE procedure has been developed in four separate packages [1]. The first package, which was adopted in May 2015, defined the general RDE test procedure. The second package, which was adopted in October 2015, introduced the NOx Conformity Factor (CF). From September 2020, RDE emissions of new car models need to meet an NTE (Not-To-Exceed) emissions limit and the conformity factor for NOx emissions equal to 1.43 (an extra 43 percent tolerance in emission value compared to the current NOx limit of 60 mg/km – in the case of a spark-ignition engine). Package 3 introduced both conformity factor for particle number and RDE cold start emissions, while Package 4 has added not only In-Service Conformity RDE testing but also market surveillance.
2 The range of emission studies in real driving conditions
The studies carried out so far indicate that the best reflection of the actual ecological performance of motor vehicles is obtained during the emission tests from these vehicles in real traffic conditions. The following [2, 3]. can be cited as examples. Testing in such conditions enables the calibration of drive units to limit the emission of pollutants in the entire range of engine operation (and not only for the operating points used during dynamometer tests). As a result, more and more advanced exhaust gas after treatment systems are being developed [4, 5]. This makes it possible to meet increasingly restrictive legal acts. It is worth noting that the solutions introduced so far are not sufficient and still need to be developed. This is especially noticeable during the cold start phase. This is confirmed not only by the results we have obtained but also other scientists’ research.
More and more attention is currently being paid to particulate emissions, especially for nanoparticles, from internal combustion engines also powered by alternative fuels – e.g. natural gas [6, 7] The article [6] also emphasizes considerable mileage of the vehicle using alternative fuels, which in turn causes an 8-fold increase in emitted particle number for a vehicle with a mileage of 500,000 km compared to the vehicle with mileage of 75,000 km. The authors of publication [7] noted that the ambient temperature has a significant impact on the exhaust emissions from light duty vehicles fueled with gasoline and LPG (liquefied petroleum gas). This issue is particularly visible in urban phase; for both cold and hot start. The authors tested a car equipped with a gasoline engine that meet the Euro 6d standard. However, their research was limited to laboratory testing only. The choice of ambient temperature was slightly different from our research but it can be compared.
The accuracy of exhaust emission measurements in traffic conditions [8, 9] depends on the engine and vehicle operating conditions (including the speed of other vehicles, road surface, driver’s predispositions, and his driving style, and other aspects determining road traffic). These conditions are unpredictable and can have a significant impact on the exhaust emission measurement results. However, according to data contained in publications, the thermal state of the vehicle (the engine) [10], average speed [11] driving dynamics [12] and road topography have the greatest impact on the achieved emission results. This means that the same vehicle but on different routes (meeting the requirements of the RDE test) will obtain different exhaust emission results. Moreover, such a change is possible already during a change of driver or test date. This makes further research necessary to take account of these minor changes. This applies to both laboratory and road tests.
The publication [13] summarized the legislative changes in the on-road emissions legislation that have been introduced in Europe over the past years. The authors of the publication [14] made an attempt to quantify the on-road emissions of on-road particle number (PN) emissions from a GDI vehicle depending on a catalytic stripper (CS) and a metal-foam gasoline particulate filter (GPF). One of their research aims was to study the PN emissions from a GDI vehicle in different conditions. The use of a catalytic reactor reduced PN emissions during a cold start, but the additional use of GPF significantly intensified this operation. This phenomenon has been observed especially in the rural and motorway part of the test. The analysis of the impact of driving dynamics in the RDE test was discussed in [15]. The authors defined the correlations between the on-road exhaust emission and dynamic parameters (the vehicle velocity and acceleration product, relative positive acceleration and 95th percentile of V · a+). The [16] notes that one rapid acceleration introduces more pollutants into the atmosphere than several accelerations with lower dynamics.
The authors of the paper [17], in turn, have dealt with the assessment of the procedure of emission testing in real traffic conditions. According to the authors, the MAW (Moving Average Window) method is not suitable for the evaluation of exhaust emissions from the cold start phase. The authors performed tests during various heat states of the internal combustion engine. It was found that ambient temperature has an impact on exhaust emissions, but the greatest impact on emissions from this stage of the test has the driving dynamics. Furthermore, in the definition of a cold start, the focus should be on the coolant temperature only. Other views at the issue of cold start had [18]. They created a mathematical model of the influence of the fleet age structure used in Poland on the cold-start emissions which are released into the air shortly after the engine’s start. All of the simulations were carried out using the COPERT 5 software.
Concerning the boundary conditions (such as vehicle payload and test mass, ambient and dynamic conditions, vehicle condition and operation), trip and operational requirements, they all are stated in Commission Regulation 2016/427. The following features exist in the RDE regulations:
Euro 6d-Temp contains the full Euro 6 emission requirements assessed using both lab test cycle and RDE testing adjusted by temporary conformity factors,
according to the regulation, by way of derogation the lower temperature for moderate conditions shall be greater or equal to 3°C and the lower temperature for extended conditions shall be greater or equal to 2°C between the NTE emission limits coming into effect as defined in section 2.1 and until five years after the dates given in paragraphs 4 and 5 of Article 10 of Regulation (EC) No 715/2007,
the cold start phase includes the first 5 minutes after the initial start of the combustion engine. If the coolant temperature can be reliably determined, this period ends once the coolant has reached 70°C for the first time but no later than 5 min after the initial engine start,
if during a specified time period of the RDE test, the ambient conditions are extended, the emissions during this time period shall be divided by a value ext before being evaluated for compliance with the requirements.
The test under real traffic conditions is also characterized by drive cycle requirements, which are summarized in Table 1.
Drive cycle requirements for a valid RDE test
| Driving portion | Urban | Rural | Motorway |
|---|---|---|---|
| Vehicle speed (V) | V ≤ 60 km/h | 60 <V ≤ 90 km/h | 90 km/h <V |
| Minimum distance | 16 km | 16 km | 16 km |
| Distance share | 29–44% | 23–43% | 23–43% |
| Total trip duration | 90–120 minutes | ||
| Average speed | 15 <V <40 km/h | – | – |
| Total stop time | 6–30% Urban time | – | – |
| (V <1 km/h) | |||
| Stop time | ≤ 300 s | – | – |
| V >100 km/h | – | – | ≥ 5 min |
| V >145 km/h | – | – | <3% |
Cold start period is included in the whole RDE test (especially in the urban part of the test) [12]:
duration of the cold start period is defined from engine start to after the first 5 minutes or coolant temp reaching >70°C,
max vehicle speed during cold start ≤ 60 km/h,
the average vehicle speed (including stops) shall be between 15 km/h and 40 km/h,
total stop time during cold start <90 s,
idling after ignition <15 s,
vehicle conditioning for cold start testing: driven for at least 30 min followed by soak duration in the range of 6 to 56 hours.
3 Research aim
The studies consisted of pollutant emissions comparison and determining the relations between results obtained in ambient temperatures of 8°C and 25°C. There was used a passenger car equipped with gasoline engine, which meets the Euro 6d-temp emission standards. The measurements were carried out for the following on-road exhaust emission components:
carbon monoxide (CO),
carbon dioxide (CO2),
nitrogen oxides (NOx),
number of particles (PN).
Twenty-four hours before a test in real traffic conditions (before the engine start), the vehicle has been conditioned at ambient temperature. Therefore, the engine oil and engine coolant temperatures were the same as the ambient temperature, which was the requirement of cold start emissions test (including an appropriate ambient temperature).
4 Research methodology
4.1 Research object
During the tests, a passenger car with a curb weight of approximately 1450 kg, fitted with a turbocharged spark-ignition engine with direct injection and displacement volume of 1.6 dm3, a maximum power of approximately 130 kW and meeting the Euro 6d-Temp emissions norm (vehicle approved according to the WLTP procedure). The exhaust aftertreatment system was typical for SIDI engines, i.e. a three-way catalytic converter with a particulate filter. The choice of such a research object was dictated by the fulfillment of RDE emission tests requirements. Additionally, more than 70% of new vehicles equipped with a gasoline engine and meeting the Euro 6d-Temp norm is fitted with such drive units. Due to the tests being carried out within the same week, the fuel and engine oil used in both cases were the same. They fulfilled the properties given in the Tables 2 and 3.
Properties of unleaded gasoline fuel EuroSuper 95 (petrol E5)
| Parameter | Unit | Value (min/max) |
|---|---|---|
| Octane | RON (MON) | 95/– (85/–) |
| Reid Vapor Pressure | kPa | 60/90 |
| Density at 15°C | kg/m3 | 720/775 |
| Distillation at 100°C | % vol | 46/71 |
| Distillation at 150°C | % vol | 75/– |
| Final Boiling Point | °C | –/210 |
| Aromatics | % vol | –/35 |
| Olefins | % vol | –/18 |
| Benzene | % vol | –/1.0 |
| Oxygen | % mass | –/2.7 |
| Sulfur | mg/kg | –/10 |
Properties of oil
| Parameter | Unit | Typical value |
|---|---|---|
| SAE viscosity class | – | 5W-30 |
| Kinematic viscosity (at 100°C) | mm2/s | 9.8 |
| Viscosity index | – | 163 |
| Pour point | °C | −30 |
| Total Base Number | Mg KOH/g | 9.5 |
| Sulphated ash | % vol | 0.9 |
| Evaporative loss according to Noack | % mass | 8.2 |
4.2 Exhaust emission measurements
Emission measurements were carried out under real driving conditions; this approach requires the installation of the gas sampling apparatus on the vehicle in such a way that ensures its normal operation. Therefore, a gas sampling system was prepared, which together with the system measuring the flow rate of the exhaust gas also performed partial sampling of the flue gas for the analyzers to enable making the measurement (Figure 1 shows the wiring schematic of the measuring equipment).
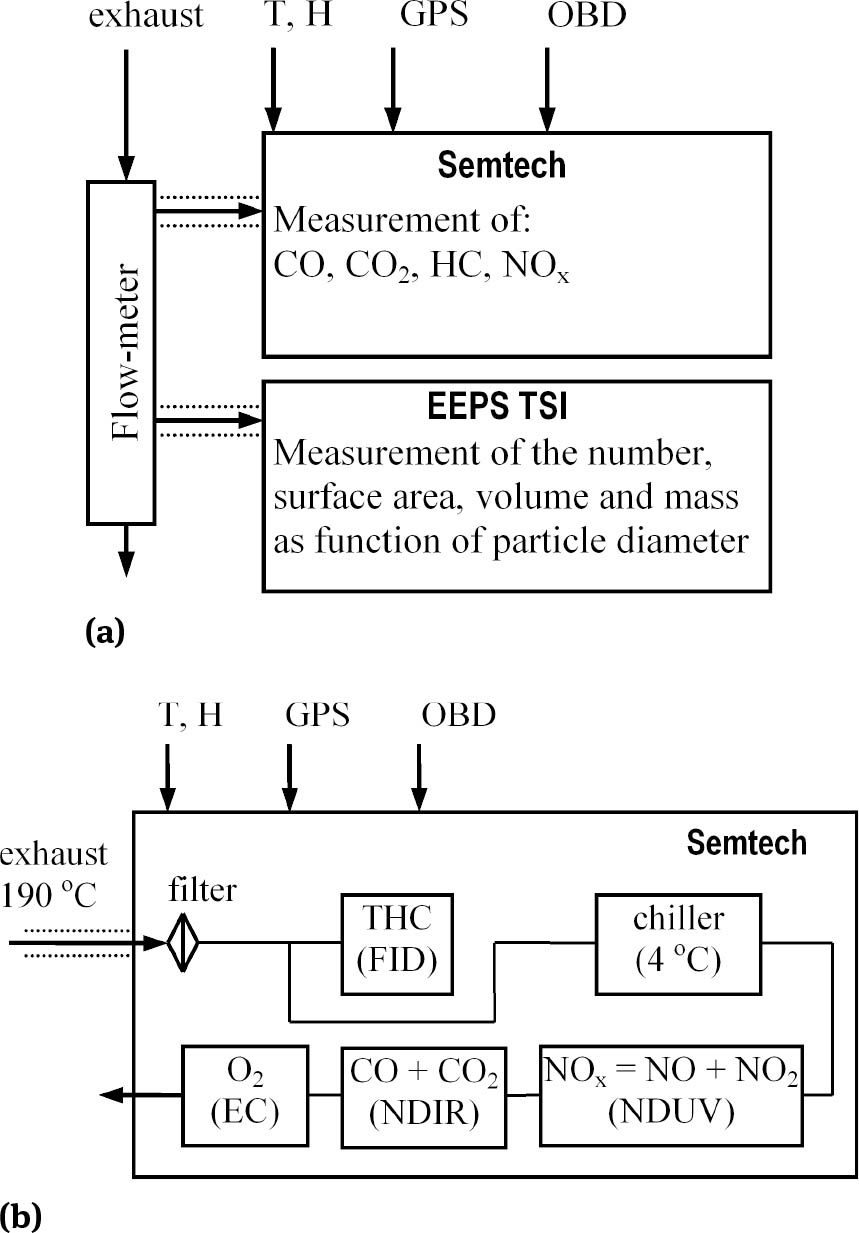
Diagram of the measurement system used for testing (a) and mobile exhaust gas analyzer with marked flue gas flow (b) for the measurement of gaseous compounds and particulates; T – ambient temperature, H – air humidity
4.3 Test route
The test route has been selected in accordance with RDE requirements and divided into three sections: urban, rural and motorway (Figure 2). The driving distance and shares of the individual test sections have been chosen so that they meet the requirements described in the Commission Regulations EU 2016/646. The total distance of the test route was approximately 90 km. The test was repeated twice for two different ambient temperatures (8°C and 25°C).

Vehicle velocity of individual route tests
5 Analysis of recorded parameters
The first stage of the research was to validate the performance of road tests, which are specified in Regulations 2016/646, 692/2008 and 2017/1154, mainly in relation to the length of individual section of the test and their shares in the entire RDE test, the test duration, the share of vehicle parking duration in the urban portion and driving dynamics in individual sections of the RDE test. All parameters were verified by appropriate procedures and no deviations from the required values were found. However, the most important was to check the validity of the cold start emission parameters and the boundary conditions (parameters that were discussed in the introduction of this study). Therefore, the analysis of vehicle velocity after the cold start has been made – the requirement is for the vehicle to be driving for a maximum of 15 seconds after starting the engine (Figure 3). This condition was met in both cases and at the same time a similar character of the vehicle velocity profiles in the first 300 s of the RDE test is shown (slightly higher values of the maximum vehicle velocity were recorded for lower ambient temperature).

Vehicle velocity after the cold start at different ambient temperatures
The comparison of the coolant temperature in both cases also showed that the RDE procedure requirements were met, i.e. it did not exceed the value of 70°C. For the cold start at the ambient temperature of 25°C, after 300 seconds since the engine started, the engine coolant temperature achieved a value of 69°C. For the ambient temperature of 8°C, the coolant temperature was only 57°C. The initial coolant temperature difference of 17°C, after 300 s since the engine started, has decreased down to 12°C. Therefore, a greater coolant temperature gradient was found for lower ambient temperature (Figure 4). A similar character of the changes was also observed during the analysis of exhaust gas temperature, measured at the end of the vehicle exhaust system. The difference occurring for the measurement time (t = 0 s) amounting to about 12°C has been compensated already after about 100 s, where the temperature of the exhaust gas was around 30°C. The further changes of exhaust gas temperature are very similar to each other, and the differences occurring in the period up to 300 s are very small (Figure 5).

The coolant temperature after the cold start at different ambient temperatures

The exhaust gas temperature after the cold start at different ambient temperatures
The analysis of selected engine operating parameters allows to find very similar engine and vehicle operating conditions, and the parameter differentiating both measurements is the ambient temperature. On this basis, it is reasonable to take further actions that could be used to determine whether there are differences in concentration and emissions of exhaust compounds in the initial period of the engine (the vehicle) operation.
5.1 Ecological parameters
The recorded exhaust gas concentration changes characteristic in the first period (t = 0 – 300 s) after the cold start for two different ambient temperatures (8°C and 25°C) are shown below (Figure 6). The carbon dioxide concentration analysis indicates that during a cold start and warming up of an engine, the concentration was the same and amounted to about 15%. Slight fluctuations of this value were the result of a change in vehicle velocity – in dynamic conditions. However, the average value of this parameter is not affected by the ambient temperature at which a cold start took place. The characteristic of the carbon monoxide concentration shows a different pattern: the characteristic instantaneous increase in concentration after a cold start reaches the value of about 30,000 ppm. However, it decreases very quickly to its minimum value during the cold start at 25°C. This reduction takes place in about 20 seconds. On the other hand, for a cold start at 8°C, the first main concentration peak decreases. This decrease reaches about 5000 ppm, and only after approximately 70 seconds reaches the minimum value.

The change of exhaust gases concentration during the initial 300 s from the cold start for different values of ambient temperature for: carbon dioxide, carbon monoxide, nitrogen oxides, and particles number
6 The analysis of test results regarding the cold start period
Taking into account the mass flow rate of the exhaust gas, a quantitative evaluation of the engine exhaust emissions was carried out in the period of 300 s from the cold start in the considered ambient temperatures (Figure 7). In the case of carbon dioxide mass, it is higher by 16% (after 300 s from the engine started); if the measurement started at 8°C, in this case the mass of carbon dioxide was 677 g. For the cold start at a temperature of 25°CC, this mass was equal to 587 g. The mass of carbon monoxide, during 300 s from the cold start at a temperature of 25°C, was 1.18 g and for the temperature of 8°C it was 195% higher (3.47 g). The smallest relative exhaust mass difference during the emission measurements at two different temperatures occurred for the nitrogen oxides emissions. In this case, a higher emission of nitrogen oxides was found for the cold start at a temperature of 25°C (by 11%) than at a temperature of 8°C (0.040 g and 0.036 g respectively). The particles number emitted during the initial 300 s from starting the engine has increased by 280% when the ambient temperature was lower from 25°C to 8°C (7.5·1010 and 2.8·1010).
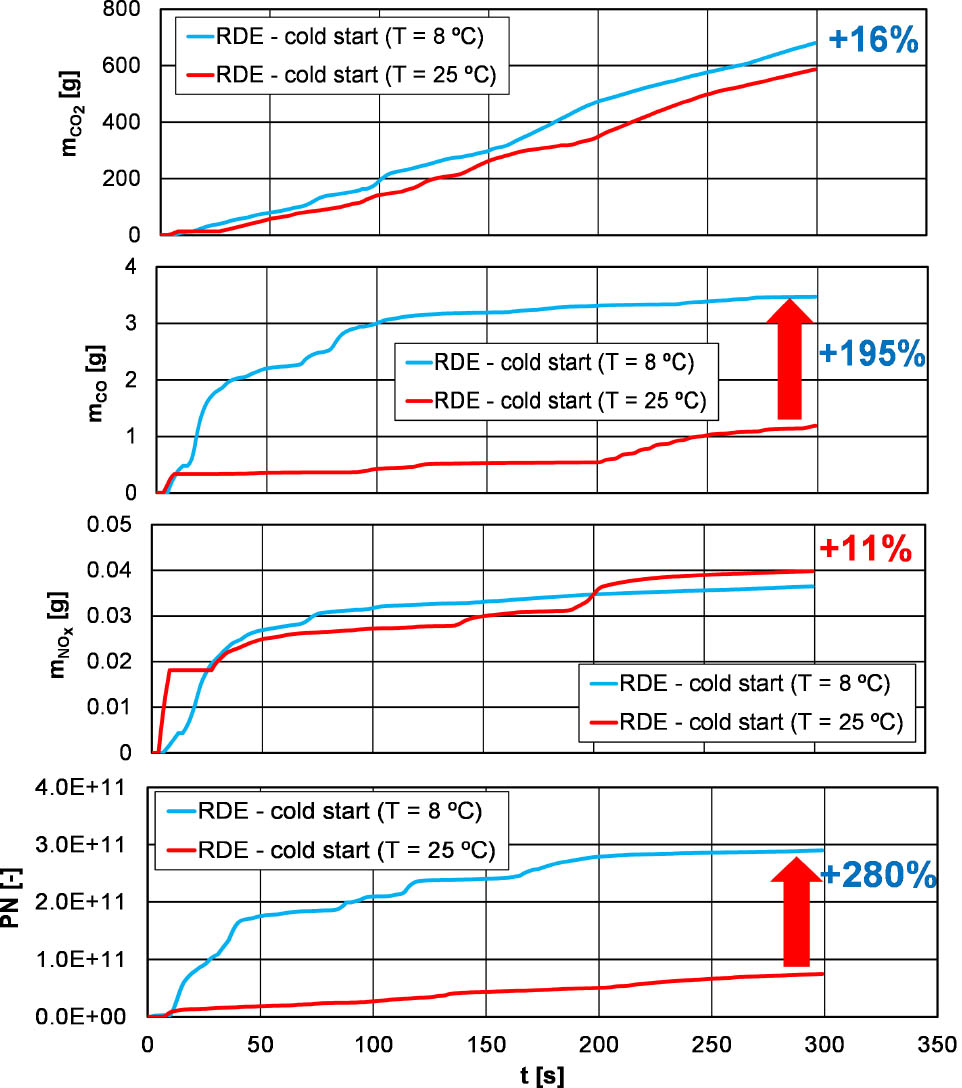
The mass of carbon dioxide, carbon monoxide, nitrogen oxides and particles number in first 300 s from the cold start for different values of an ambient temperature
The presented data was used to determine the road emissions (the conversion of emission values to mass per unit of distance) during the cold start (lasting 300 s) and the entire urban phase (lasting 3450 s). The comparison of the exhaust emission results of an engine cold start at an ambient temperature of 8°C to the results in the whole urban part of the RDE test is as follows (Figure 8):
carbon dioxide road emissions in the cold start test (348 g/km) are higher by 64% than the average for the entire urban section of the RDE test (212 g/km),
carbon monoxide road emissions in the cold start test (260 mg/km) are higher by 172% than the average for the entire urban section of RDE test (96 mg/km),
nitrogen oxides road emissions in the cold start test (103 mg/km) are higher by 11% than the average for the entire urban section of RDE test (9.2 mg/km),
the particles number road emissions in the cold start test (2.2·1010 1/km) are higher by 138% than the average for the entire urban section of RDE test (0.94·1010 1/km).

The on-road emissions of carbon dioxide, carbon monoxide, nitrogen oxides, and particles number during the cold start for an ambient temperature of 8°C
Accordingly, the emissions of carbon monoxide flow rates should increase significantly in the first period after the cold start at the lower ambient temperature of 8°C compared to the value measured at 25°C. The concentration of nitrogen oxides behaves much differently from the analysis of the previous compound. For a higher temperature of the cold start (25°C) an increased concentration of nitrogen oxides (up to 300–400 ppm) is observed during the first 50 seconds after the engine start. At this point in time (50 s), the concentration of nitrogen oxides during a cold start at 8°C is several times higher (80 ppm) than at 25°C (10 ppm). The time it takes the measured concentration values of this compound to reach values below 10 ppm is similar and equals about 100 s. Regarding the number of particulates, increased values for cold start at 8°C were observed, this increase was about 100 times the value in the first 70 s after the cold start. The average value of the particulate concentration for the cold start at 25°C was 1·104 1/cm3, and for the cold start at 8°C this value changed from an initial 1·106 1/cm3 to a value of 1·104 1/cm3 (300 s after cold start). After about 230 seconds from the cold start, the numerical concentration of solid particles in both cases stabilized at 1·104 1/cm3.
The changes in road emissions of exhaust compounds during the cold start at a temperature of 25°C in relation to the whole urban part of the RDE test are as follows (Figure 9):
carbon dioxide road emissions are higher by 51% (304 g/km and 202 g/km respectively),
carbon monoxide road emissions are higher by 64% (155 mg/km and 95 mg/km respectively),
nitrogen oxides road emissions are higher by 89% (20.5 mg/km and 10.9 mg/km respectively),
particles number road emissions are higher by 182% (1.5·1010 1/km and 0.52·1010 1/km respectively).

The on-road emissions of carbon dioxide, carbon monoxide, nitrogen oxides, and particles number during the cold start for an ambient temperature of 25°C
The comparing of the cold start phases for different ambient temperatures in the urban section of the test and in the entire RDE test, it was found that:
for the cold start at a temperature of 8°C (Figure 10):
the share of carbon dioxide emissions during the cold start (300 s) relative to the urban part of the RDE test is 11.6%, and to the entire RDE test, it decreases to 3.4%,
the share of carbon monoxide emissions during the cold start (300 s) relative to the urban part of the RDE test is 26%, and to the entire RDE test, it decreases to 10.7%,
the share of nitrogen oxides emissions during the cold start (300 s) relative to the urban part of the RDE test is 10.6%, and to the entire RDE test, it decreases to 2.9%,
the share of particles number emissions during the cold start (300 s) relative to the urban part of the RDE test is 22.7%, and to the entire RDE test, it decreases to 0.1%,
for the cold start at a temperature of 25°C (Figure 11):
the share of carbon dioxide emissions during the cold start (300 s) relative to the urban part of the RDE test is 9.8%, and to the entire RDE test, it decreases to 3.4%,
the share of carbon monoxide emissions during the cold start (300 s) relative to the urban part of the RDE test is 10.6%, and to the entire RDE test, it decreases to 4.6%,
the share of nitrogen oxides emissions during the cold start (300 s) relative to the urban part of the RDE test is 12.3%, and to the entire RDE test, it decreases to 3.4%,
the share of particles number emissions during the cold start (300 s) relative to the urban part of the RDE test is 18.4%, and to the entire RDE test, it decreases to 0.15%.

The share of exhaust emissions during the cold start in relation to the urban part of the RDE test, and the entire RDE test for an ambient temperature of 8°C

The share of exhaust emissions during the cold start in relation to the urban part of the RDE test, and the entire RDE test for an ambient temperature of 25°C
7 Conclusions
In the third regulatory RDE package, the pollutants exhaust emission results from the engine at cold start is included in the total exhaust emissions assessment. It causes an increase in the on-road exhaust emissions. This is mainly due to the time required to heat the exhaust after treatment devices, and at the same time to the pressure of the exhaust for as much emissions reduction as possible in the first period after the cold start.
The tests were performed in the ambient temperature range, in accordance with the current regulation on exhaust emission measurements under real traffic conditions. As expected, the results obtained during the cold start phase differed significantly.
The reduction of the ambient temperature (from 25°C to 8°C) during the cold start (in the considered period of 300 s) resulted in:
an increase by 16% of carbon dioxide mass (and hence in fuel consumption),
an increase by 195% of carbon monoxide mass,
a decrease by 11% of nitrogen oxides mass,
an increase by 280% of particles number.
The emissions from the cold start phase were also compared with the emission results obtained in the urban part only, but also in the entire RDE test.
The share of the cold start in the urban part and in the entire RDE test is the highest when measured from a temperature of 8°C. The values are as follows:
for carbon dioxide on-road emissions: 11.6% (the urban part) and 3.4% (the entire RDE test),
for carbon monoxide on-road emissions: 26% and 10.7%,
for nitrogen oxides on-road emissions: 10.6% and 2.9%,
for particles number on-road emissions: 22.7% and 0.1%.
The share of the cold start at a temperature of 25°C in the urban part and the entire RDE test is as follows:
for carbon dioxide on-road emissions: 9.8% (the urban part) and 3.4% (the entire RDE test),
for carbon monoxide on-road emissions: 10.6% and 4.6%,
for nitrogen oxides on-road emissions: 12.3% and 3.4%,
for particles number on-road emissions: 18.4% and 0.15%.
Detailed determination of exhaust gas emissions in individual phases, including a cold start period, will undoubtedly allow for even greater development of exhaust gas aftertreatment systems. Such analyses of conventional vehicles exhaust emissions will simplify emission tests for alternative vehicles. Moreover, such detailed analyses of the most problematic parts of the emission tests will contribute to the improvement of research methods.
Funding: This study was funded by Projects 05/52/DSPB/1278.
References
[1] Clenci A, Sălan V, Niculescu R, Iorga-Simăn V, Zaharia C. Assessment of real driving emissions via portable emission measurement system. IOP Conf. Ser.: Mater. Sci. Eng. 2017;252;012084.10.1088/1757-899X/252/1/012084Suche in Google Scholar
[2] Pielecha J, Andrych-Zalewska M, Skobiej K. The impact of using an in-cylinder catalyst on the exhaust gas emission in real driving conditions tests of a Diesel engine. IOP Conf. Ser.: Mater. Sci. Eng. 2018;42;042064.10.1088/1757-899X/421/4/042064Suche in Google Scholar
[3] Suarez-Bertoa R, Astorga C. Impact of cold temperature on Euro 6 passenger car emissions. Environ. Pollut. 2018;234:318–329.10.1016/j.envpol.2017.10.096Suche in Google Scholar PubMed PubMed Central
[4] Pielecha J, Magdziak A, Brzezinski L. Nitrogen oxides emission evaluation for Euro 6 category vehicles equipped with combustion engines of different displacement volume. IOP Conf. Ser.: Earth. Environ. Sci. 2019;214;012010.10.1088/1755-1315/214/1/012010Suche in Google Scholar
[5] Triantafyllopoulos G, Katsaounis D, Karamitros D, Ntziachristos L, Samaras Z. Experimental assessment of the potential to decrease diesel NOx emissions beyond minimum requirements for Euro 6 Real Drive Emissions (RDE) compliance. Sci. Total Environ. 2018;618:1400–1407.10.1016/j.scitotenv.2017.09.274Suche in Google Scholar PubMed
[6] Pielecha J, Merkisz J, Markowski J, Jasinski R. Analysis of passenger car emission factors in RDE tests. E3S Web Conf. 2016;10;00073.10.1051/e3sconf/20161000073Suche in Google Scholar
[7] Jaworski A, Mądziel M, Kuszewski H, Lejda K. et al. Analysis of cold start emission from light duty vehicles fueled with gasoline and LPG for selected ambient temperatures. SAE Technical Paper. 2020;01:2207.10.4271/2020-01-2207Suche in Google Scholar
[8] Fuc P, Lijewski P, Kurczewski P, Ziolkowski A, Dobrzynski M. The analysis of fuel consumption and exhaust emissions from forklifts fueled by diesel fuel and liquefied petroleum gas (LPG) obtained under real driving conditions. 2017;IMECE;70158;V006T08A060.10.1115/IMECE2017-70158Suche in Google Scholar
[9] Lijewski P, Merkisz J, Fuc P, Ziolkowski A, Rymaniak L, Kusiak W. Fuel consumption and exhaust emissions in the process of mechanized timber extraction and transport. Eur. J. Forest. Res. 2017;136;1:153–160.10.1007/s10342-016-1015-2Suche in Google Scholar
[10] Yan S, Fangxi X, Wei H, Xiaoping L, Tingting H. Experimental study of particulate emission characteristics from a gasoline direct injection engine during starting process. Int. J. Automot. Technol. 2019;20;2:411–421.10.1007/s12239-019-0040-9Suche in Google Scholar
[11] Pielecha I, Cieslik W, Szalek A. Operation of electric hybrid drive systems in varied driving conditions. Eksploat. Niezawodn. 2018;20;1:16–23.10.17531/ein.2018.1.3Suche in Google Scholar
[12] Weiss M, Paffumi E, Clairotte M, Drossinos Y, Vlachos T, Bonnel P, et al. Including cold-start emissions in the Real-Driving Emissions (RDE) test procedure. Publications Office of the European Union. 2017.Suche in Google Scholar
[13] Valverde Morales V, Clairotte M, Pavlovic J, Giechaskiel B, et al. On-Road emissions of Euro 6d-TEMP vehicles: consequences of the entry into force of the RDE regulation in Europe. SAE Techn. Paper. 2020;01;2219.10.4271/2020-01-2219Suche in Google Scholar
[14] Ko J, Kim K, Chung W, Myung CL, Park S. Characteristics of on-road particle number (PN) emissions from a GDI vehicle depending on a catalytic stripper (CS) and a metal-foam gasoline particulate filter (GPF). Fuel. 2019;238:363–374.10.1016/j.fuel.2018.10.091Suche in Google Scholar
[15] Kurtyka K, Pielecha J. The evaluation of exhaust emission in RDE tests including dynamic driving conditions. Transp. Research Proc. 2019; 40:338–345.10.1016/j.trpro.2019.07.050Suche in Google Scholar
[16] Satlawa M, Pajdowski P, Pietras D. The Impact of the driver’s driving style on the EXHAUST emissions of a passenger car during a real road cycle. SAE Techn. Paper. 2020;01;2214.10.4271/2020-01-2214Suche in Google Scholar
[17] Du B, Zhamg L, Geng Y, Zhang Y, Xu H, Xiang G. Testing and evaluation of cold-start emissions in a real driving emissions test. Transportation Research Part. 2020;86;102447.10.1016/j.trd.2020.102447Suche in Google Scholar
[18] Zimakowska-Laskowska M, Laskowski P, Zasina D. The impact of the fleet age structure on the cold-start emission. Case study of the Polish passenger cars and light commercial vehicles. SAE Techn. Paper. 2020;01;2091.10.4271/2020-01-2091Suche in Google Scholar
© 2021 Jacek Pielecha et al., published by De Gruyter
This work is licensed under the Creative Commons Attribution 4.0 International License.
Artikel in diesem Heft
- Regular Articles
- Electrochemical studies of the synergistic combination effect of thymus mastichina and illicium verum essential oil extracts on the corrosion inhibition of low carbon steel in dilute acid solution
- Adoption of Business Intelligence to Support Cost Accounting Based Financial Systems — Case Study of XYZ Company
- Techno-Economic Feasibility Analysis of a Hybrid Renewable Energy Supply Options for University Buildings in Saudi Arabia
- Optimized design of a semimetal gasket operating in flange-bolted joints
- Behavior of non-reinforced and reinforced green mortar with fibers
- Field measurement of contact forces on rollers for a large diameter pipe conveyor
- Development of Smartphone-Controlled Hand and Arm Exoskeleton for Persons with Disability
- Investigation of saturation flow rate using video camera at signalized intersections in Jordan
- The features of Ni2MnIn polycrystalline Heusler alloy thin films formation by pulsed laser deposition
- Selection of a workpiece clamping system for computer-aided subtractive manufacturing of geometrically complex medical models
- Development of Solar-Powered Water Pump with 3D Printed Impeller
- Identifying Innovative Reliable Criteria Governing the Selection of Infrastructures Construction Project Delivery Systems
- Kinetics of Carbothermal Reduction Process of Different Size Phosphate Rocks
- Plastic forming processes of transverse non-homogeneous composite metallic sheets
- Accelerated aging of WPCs Based on Polypropylene and Birch plywood Sanding Dust
- Effect of water flow and depth on fatigue crack growth rate of underwater wet welded low carbon steel SS400
- Non-invasive attempts to extinguish flames with the use of high-power acoustic extinguisher
- Filament wound composite fatigue mechanisms investigated with full field DIC strain monitoring
- Structural Timber In Compartment Fires – The Timber Charring and Heat Storage Model
- Technical and economic aspects of starting a selected power unit at low ambient temperatures
- Car braking effectiveness after adaptation for drivers with motor dysfunctions
- Adaptation to driver-assistance systems depending on experience
- A SIMULINK implementation of a vector shift relay with distributed synchronous generator for engineering classes
- Evaluation of measurement uncertainty in a static tensile test
- Errors in documenting the subsoil and their impact on the investment implementation: Case study
- Comparison between two calculation methods for designing a stand-alone PV system according to Mosul city basemap
- Reduction of transport-related air pollution. A case study based on the impact of the COVID-19 pandemic on the level of NOx emissions in the city of Krakow
- Driver intervention performance assessment as a key aspect of L3–L4 automated vehicles deployment
- A new method for solving quadratic fractional programming problem in neutrosophic environment
- Effect of fish scales on fabrication of polyester composite material reinforcements
- Impact of the operation of LNG trucks on the environment
- The effectiveness of the AEB system in the context of the safety of vulnerable road users
- Errors in controlling cars cause tragic accidents involving motorcyclists
- Deformation of designed steel plates: An optimisation of the side hull structure using the finite element approach
- Thermal-strength analysis of a cross-flow heat exchanger and its design improvement
- Effect of thermal collector configuration on the photovoltaic heat transfer performance with 3D CFD modeling
- Experimental identification of the subjective reception of external stimuli during wheelchair driving
- Failure analysis of motorcycle shock breakers
- Experimental analysis of nonlinear characteristics of absorbers with wire rope isolators
- Experimental tests of the antiresonance vibratory mill of a sectional movement trajectory
- Experimental and theoretical investigation of CVT rubber belt vibrations
- Is the cubic parabola really the best railway transition curve?
- Transport properties of the new vibratory conveyor at operations in the resonance zone
- Assessment of resistance to permanent deformations of asphalt mixes of low air void content
- COVID-19 lockdown impact on CERN seismic station ambient noise levels
- Review Articles
- FMEA method in operational reliability of forest harvesters
- Examination of preferences in the field of mobility of the city of Pila in terms of services provided by the Municipal Transport Company in Pila
- Enhancement stability and color fastness of natural dye: A review
- Special Issue: ICE-SEAM 2019 - Part II
- Lane Departure Warning Estimation Using Yaw Acceleration
- Analysis of EMG Signals during Stance and Swing Phases for Controlling Magnetorheological Brake applications
- Sensor Number Optimization Using Neural Network for Ankle Foot Orthosis Equipped with Magnetorheological Brake
- Special Issue: Recent Advances in Civil Engineering - Part II
- Comparison of STM’s reliability system on the example of selected element
- Technical analysis of the renovation works of the wooden palace floors
- Special Issue: TRANSPORT 2020
- Simulation assessment of the half-power bandwidth method in testing shock absorbers
- Predictive analysis of the impact of the time of day on road accidents in Poland
- User’s determination of a proper method for quantifying fuel consumption of a passenger car with compression ignition engine in specific operation conditions
- Analysis and assessment of defectiveness of regulations for the yellow signal at the intersection
- Streamlining possibility of transport-supply logistics when using chosen Operations Research techniques
- Permissible distance – safety system of vehicles in use
- Study of the population in terms of knowledge about the distance between vehicles in motion
- UAVs in rail damage image diagnostics supported by deep-learning networks
- Exhaust emissions of buses LNG and Diesel in RDE tests
- Measurements of urban traffic parameters before and after road reconstruction
- The use of deep recurrent neural networks to predict performance of photovoltaic system for charging electric vehicles
- Analysis of dangers in the operation of city buses at the intersections
- Psychological factors of the transfer of control in an automated vehicle
- Testing and evaluation of cold-start emissions from a gasoline engine in RDE test at two different ambient temperatures
- Age and experience in driving a vehicle and psychomotor skills in the context of automation
- Consumption of gasoline in vehicles equipped with an LPG retrofit system in real driving conditions
- Laboratory studies of the influence of the working position of the passenger vehicle air suspension on the vibration comfort of children transported in the child restraint system
- Route optimization for city cleaning vehicle
- Efficiency of electric vehicle interior heating systems at low ambient temperatures
- Model-based imputation of sound level data at thoroughfare using computational intelligence
- Research on the combustion process in the Fiat 1.3 Multijet engine fueled with rapeseed methyl esters
- Overview of the method and state of hydrogenization of road transport in the world and the resulting development prospects in Poland
- Tribological characteristics of polymer materials used for slide bearings
- Car reliability analysis based on periodic technical tests
- Special Issue: Terotechnology 2019 - Part II
- DOE Application for Analysis of Tribological Properties of the Al2O3/IF-WS2 Surface Layers
- The effect of the impurities spaces on the quality of structural steel working at variable loads
- Prediction of the parameters and the hot open die elongation forging process on an 80 MN hydraulic press
- Special Issue: AEVEC 2020
- Vocational Student's Attitude and Response Towards Experiential Learning in Mechanical Engineering
- Virtual Laboratory to Support a Practical Learning of Micro Power Generation in Indonesian Vocational High Schools
- The impacts of mediating the work environment on the mode choice in work trips
- Utilization of K-nearest neighbor algorithm for classification of white blood cells in AML M4, M5, and M7
- Car braking effectiveness after adaptation for drivers with motor dysfunctions
- Case study: Vocational student’s knowledge and awareness level toward renewable energy in Indonesia
- Contribution of collaborative skill toward construction drawing skill for developing vocational course
- Special Issue: Annual Engineering and Vocational Education Conference - Part II
- Vocational teachers’ perspective toward Technological Pedagogical Vocational Knowledge
- Special Issue: ICIMECE 2020 - Part I
- Profile of system and product certification as quality infrastructure in Indonesia
- Prediction Model of Magnetorheological (MR) Fluid Damper Hysteresis Loop using Extreme Learning Machine Algorithm
- A review on the fused deposition modeling (FDM) 3D printing: Filament processing, materials, and printing parameters
- Facile rheological route method for LiFePO4/C cathode material production
- Mosque design strategy for energy and water saving
- Epoxy resins thermosetting for mechanical engineering
- Estimating the potential of wind energy resources using Weibull parameters: A case study of the coastline region of Dar es Salaam, Tanzania
- Special Issue: CIRMARE 2020
- New trends in visual inspection of buildings and structures: Study for the use of drones
- Special Issue: ISERT 2021
- Alleviate the contending issues in network operating system courses: Psychomotor and troubleshooting skill development with Raspberry Pi
- Special Issue: Actual Trends in Logistics and Industrial Engineering - Part II
- The Physical Internet: A means towards achieving global logistics sustainability
- Special Issue: Modern Scientific Problems in Civil Engineering - Part I
- Construction work cost and duration analysis with the use of agent-based modelling and simulation
- Corrosion rate measurement for steel sheets of a fuel tank shell being in service
- The influence of external environment on workers on scaffolding illustrated by UTCI
- Allocation of risk factors for geodetic tasks in construction schedules
- Pedestrian fatality risk as a function of tram impact speed
- Technological and organizational problems in the construction of the radiation shielding concrete and suggestions to solve: A case study
- Finite element analysis of train speed effect on dynamic response of steel bridge
- New approach to analysis of railway track dynamics – Rail head vibrations
- Special Issue: Trends in Logistics and Production for the 21st Century - Part I
- Design of production lines and logistic flows in production
- The planning process of transport tasks for autonomous vans
- Modeling of the two shuttle box system within the internal logistics system using simulation software
- Implementation of the logistics train in the intralogistics system: A case study
- Assessment of investment in electric buses: A case study of a public transport company
- Assessment of a robot base production using CAM programming for the FANUC control system
- Proposal for the flow of material and adjustments to the storage system of an external service provider
- The use of numerical analysis of the injection process to select the material for the injection molding
- Economic aspect of combined transport
- Solution of a production process with the application of simulation: A case study
- Speedometer reliability in regard to road traffic sustainability
- Design and construction of a scanning stand for the PU mini-acoustic sensor
- Utilization of intelligent vehicle units for train set dispatching
- Special Issue: ICRTEEC - 2021 - Part I
- LVRT enhancement of DFIG-driven wind system using feed-forward neuro-sliding mode control
- Special Issue: Automation in Finland 2021 - Part I
- Prediction of future paths of mobile objects using path library
- Model predictive control for a multiple injection combustion model
- Model-based on-board post-injection control development for marine diesel engine
- Intelligent temporal analysis of coronavirus statistical data