Simulation assessment of the half-power bandwidth method in testing shock absorbers
-


Abstract
The work deals with usability of the half-power bandwidth method in the diagnostic testing of automotive shock absorbers. In all the simulation tests, the front and rear suspension system of a present-day medium-classmotor car was considered. At the first stage, calculations were made in the frequency domain for a linear “quarter-car” model with two degrees of freedom; then, simulations were carried out in the time domain with using a similar but strongly nonlinear model. In the latter case, actual characteristics (corresponding to those obtained from test rig measurements) of shock absorber damping, suspension and tire elasticity, sliding friction in the suspension, and “wheel hop” were considered. The calculations were carried out every time for twelve levels of viscous damping in the suspension system, which made 48 calculation series in total. The factors of gain in the vertical force between the tester’s vibration plate and the vehicle tire (relative to the input force applied) and the dimensionless coefficients of viscous damping in the suspension system, determined by the half-power bandwidth method, were thoroughly analyzed. The calculation results were presented in graphical form. Attention was also paid to the distortions caused by the force of inertia of the tester’s vibration plate.
1 Introduction
The technical condition of automotive shock absorbers is essential for vehicle motion safety and occupants’ comfort.With the development of damping components of suspension systems, newer and better methods of diagnosing such parts are sought. The “on-vehicle” tests are particularly useful thanks to their low cost and short time. Predominantly, “forced vibration tests” are used for this purpose [1, 2]. At present, efforts are made to adopt in Europe a uniform (standard) method of forcing the vibration for all the shock absorber testers. As one of the peculiarities of such a method, the stroke of the tester’s vibration plate is to be constant, equal to e.g. 6 mm, as it is in the case of the EUSAMA machines [1, 2, 3, 4]. Unfortunately, such testers, which are most popular, suffer from a major drawback: the final test result strongly depends on tire inflation pressure (i.e. tire stiffness), sprung mass, sliding friction in the suspension system, test conditions, and tester characteristics [1, 2, 4, 5]. In consideration of the above, the authors, when searching for new “on-vehicle” shock absorber assessment methods and having reviewed the literature, paid particular attention to publications [3, 6], where a suggestion was made to introduce some modifications to the EUSAMA testers and to use the half-power bandwidth method for determining the dimensionless coefficients of damping in the motor vehicle suspension system. This method is derived from modal analysis [7]. However, it is applied to systems with a single degree of freedom and with low damping (where the dimensionless damping coefficients are below 0.1 – see also e.g. [8]). The authors decided to assess the usability of this method in diagnostic testing of automotive suspension systems, where the relative damping coefficient reaches and even exceeds a value of 0.3. A novelty in relation to publications [3, 6] is here the use of a linear and a strongly nonlinear quarter-car model.
2 The half-power bandwidth method in the testing of automotive shock absorbers
The authors of publication [3] have shown that the said half-power bandwidth method [7] may be used to determine the dimensionless coefficient of damping in the suspension system. They used a modified EUSAMA tester (with a system to measure the vertical force under the vibration plate, at a sinusoidal input with a constant amplitude of 3 mm), but with the test duration time being significantly extended (to 140 s). Thus, small changes in the input frequency were obtained (from 25 Hz to 0, with a rate of 0.18 Hz/s) and, in consequence, quasi-state conditions of motion were ensured for the core phase of the test. Additionally, the vertical displacement of the tester’s vibration plate was measured. Thus, with using the fast Fourier transform, factors of gain in the vertical force measured under the EUSAMA tester’s vibration plate (relative to the input force), i.e. the absolute values of their transmittance (for linear systems), may be determined. By analyzing the curves representing these quantities close to the second natural frequency of the undamped system and with using the half-power bandwidth method (Figure 1), the estimated value of the coefficient of viscous damping in the motor vehicle suspension system may be determined from formula (1) [3, 7]:
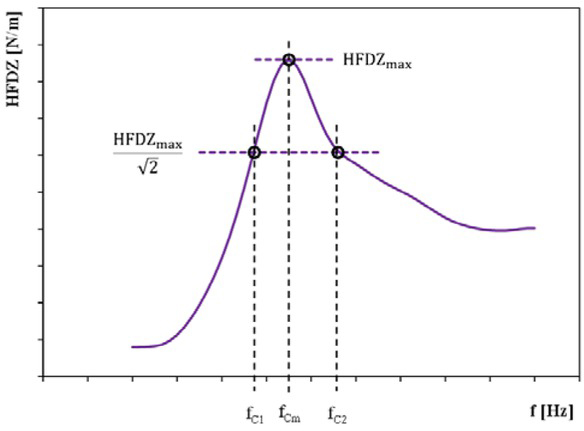
Illustration showing the characteristic points of the factor of gain in the force measured in the tester (HFDZ) in the half-power bandwidth method
where: fCm is the frequency corresponding to the maximum value of the factor of gain in the force measured in the tester (HFDZmax) and fC1 and fC2 √are the frequencies corresponding to the value
The considerations presented in publication [3] were continued in [6] (by the same authors). It was ascertained that shock absorbers might be tested with making use of the effect of amplification of the vertical force (measured under the tester’s vibration plate) in the resonance area, for the first natural frequency. In this connection, the input frequency should decline in the core phase of the test from 3Hz to 0 for a period of 30 s (with a rate of 0.1 Hz/s). For the suspension deflection rates during the test to be similar to those occurring in typical road conditions, the amplitude of the sinusoidal input was increased to 12.5 mm. Additionally, an assumption was made that the curves used as characteristics of the factor of gain in the force measured in the tester were symmetrical and, therefore, a simplified equation (2) might be applied here:
3 Simulation models used
The usability of the half-power bandwidth method in the diagnostic testing of automotive shock absorbers was assessed in two stages. At first, simulations were carried out in the frequency domain with using a linear quarter-car model placed on a suspension tester (Figure 2a). Next, time domain simulations were performed using an analogous, highly non-linear model (Figure 2b and 2c).

Quarter-car model on a diagnostic shock absorber tester: a) general structure of linear version; b) general structure of nonlinear version; c) force system in nonlinear version
3.1 Linear model
In this representation (Figure 2a), sprung mass m1, unsprung mass m2, and mass m3 of tester’s vibration plate were taken into account. The vertical displacements of model bodies relative to their equilibrium positions (for the exciter, i.e. the vibration plate, being in its rest position) are denoted here by z1 and z2; ζ is the time-varying kinematic input applied by the exciter. The stiffness and damping of the suspension system are denoted by k1 and c1, respectively, and the radial stiffness and damping of the tire are denoted by k2 and c2, respectively. To check the distorting impact of the inertia of tester’s vibration plate (exciter) on the final shock absorber test results, the dynamic component of the normal reaction at the tire-exciter contact point (Fdz) and the dynamic component of the force measured in the tester (Fmd) were distinguished.
The equations of motion were derived in accordance with the principle of dynamic force analysis (see [9]), with taking into account the forces of inertia of individual mass elements. The equations in their full and concise matrix form have been shown below (3):
where: M, C, K, Cζ , and Kζ are, respectively, the matrices of inertia, viscous damping, stiffness, and matrices representing the excitation impact exerted through the tire damping and the radial stiffness of the tire;
The Laplace transform of (3) at zero initial conditions and some subsequent transformations have resulted in the obtaining of equation (4) and its solution (5):
The operational transmittances (transfer functions) for displacements, velocities, and accelerations were expressed by relations (6), (7), (8) as the ratios of the Laplace transform of the output signal to the Laplace transform of the input signal (excitation):
To pass from the Laplace transform to the Fourier transform, it will be enough to pass from domain s to parameter i · ω (with assuming that the real part is equal to zero). For the linear model used here, the Fourier transform of the dynamic component of the vertical force at the tire-exciter contact point was described by (9):
Based on equations (6)–(9) and in result of appropriate transformations, a compact end form of the spectral transmittance for the dynamic vertical force at the tire-exciter contact point was finally obtained (with remembering that q1 = z1 and q2 = z2):
The difference between the dynamic component of the force measured in the tester (Fmd) and the dynamic vertical force at the tire-exciter contact point (Fdz) arises from the force of inertia of tester’s vibration plate (exciter):
The quantities describing the properties of the linear model, i.e. the Hertz and radian natural frequency (f01/02 and ω01/02, respectively) of the undamped system (12), critical damping coefficient ckr1 (13), and relative damping coefficient ϑ1 (14) were also used:
3.2 Nonlinear model
At the second stage, numerical computations were carried out in the time domain with using a strongly nonlinear quarter-car model (Figure 2b and 2c). Force Fst balances the weight of system masses (m1·g, m2·g, m3·g). The dynamic components Fmd and Fdz were taken separately to compare the results obtained for the two models.
The actual elasticity characteristics of vehicle suspension and tires, sliding friction in the suspension system, and tire separation from the ground were taken into account. The description of these properties was exactly consistent with the results of test rig measurements of the real system. The equations of motion (15) of the nonlinear quarter-car model were derived according to the principle of dynamic force analysis.
where:
The elasticity force in the suspension system was approximated by a linear function and a 2nd or 3rd degree polynomial:
where: A1s1 and A2s1 to D2s1 are coefficients of the functions that describe the elasticity force in the suspension system at low and high deflection values, respectively; u1gris boundary between areas of different descriptions of the elasticity force; u1 is deflection of the suspension system, according to (17):
where: om0 is the difference between coordinates ζ1 and ζ2 at which Fs1 = 0.
The force of sliding friction in the suspension system is represented as follows:
where: Ats1 is amplitude of the force of sliding friction in the suspension system and
The force of viscous damping in the suspension system is described by (20):
where: iz is a coefficient describing the kinematic relations in the suspension system; c0 and cu are shock absorber damping coefficients for the rebound and compression stroke; Wo and Wu are exponents of the function that describes the shock absorber damping for the rebound and compression stroke.
The tire elasticity force was approximated by a 3rd degree polynomial:
where: As2 to Cs2 are coefficients of the polynomial that describes the tire elasticity force and u2 is radial deflection of the tire, according to (22):
where: R is free radius of the pneumatic tire.
According to equation (23), the damping force in the tire model is a linear function of the rate of tire deflection in the radial direction:
where: c2 is damping coefficient and u2 is deflection rate, according to (24):
The solutions of the equations of motion (15) were obtained in the time domain by approximate techniques involving numerical integration, with using an authorial program built in the Matlab-Simulink environment [2].
4 Parameters of the models and of the test conditions
All the simulation tests were carried out for nominal parameters of the front and rear “quarter” of the selected medium-class car (Tables 1 and 2), which had been previously subjected to test rig measurements.
Parameters of the linear model
| Symbol | Unit | Value for the front “quarter car” | Value for the rear “quarter car” |
|---|---|---|---|
| m1 | kg | 346 | 160 |
| m2 | kg | 36 | 35 |
| k1 | N/m | 25570 | 24882 |
| k2 | N/m | 253161 | 206526 |
| c2 | N·s/m | 150 | 150 |
| f01 | Hz | 1.30 (8.19) | 1.87 (11.77) |
| (ω01) | (rad/s) | ||
| f02 | Hz | 14.01 (88.03) | 12.96 (81.42) |
| (ω02) | (rad/s) | ||
| ckr1 | N·s/m | 5669 | 3770 |
Additional parameters of the nonlinear model and the diagnostic tester
| Symbol | Unit | Value for the front “quarter car” | Value for the rear “quarter car” |
|---|---|---|---|
| A1s1 | N/m | 2.267E+05 | 4.400E+05 |
| A2s1 | N/m3 | 0 | 7.290E+05 |
| B2s1 | N/m2 | 1.852E+04 | −5.037E+04 |
| C2s1 | N/m | 2.310E+04 | 2.155E+04 |
| D2s1 | N | 1.526E+03 | 4.094E+02 |
| u1gr | m | 0.0075 | 0.001 |
| om0 | m | 0.337 | 0.309 |
| Ats1 | N | 200 | 40 |
| ü1gr | m/s | 0.005 | 0.005 |
| cu | N·sWu/mWu | 975 | 850 |
| co | N·sWo/mWo | 1700 | 3200 |
| Wu | - | 0.8 | 0.65 |
| Wo | - | 1 | 1.2 |
| iz | - | 0.9936 | 0.7068 |
| As2 | N/m3 | −9.367E+07 | −3.021E+07 |
| Bs2 | N/m2 | 5.653E+06 | 3.592E+06 |
| Cs2 | N/m | 1.525E+05 | 1.553E+05 |
| R | m | 0.311 | 0.311 |
| m3 | kg | 14.5 | 14.5 |
| ζmax | m | 0.025 or 0.006 | 0.025 or 0.006 |
In pursuance of the objective of this work, only the viscous damping in the suspension system was changed, with using the dimensionless (relative) coefficient (14) and with applying every time 12 values of this parameter, ranging from 0.04 to 0.48 (with Δϑ1 = 0, 04).
For the nonlinear model, the force of viscous damping in the suspension system was reproduced from the nominal characteristic curve, with multiplying it by a percentage factor appropriately selected so that the energy dissipated in a single cycle in the shock absorber being simulated was equal to that dissipated in the corresponding linear element of the model.
The analysis was focused on the factors of gain in the vertical force at the tire-exciter contact point (relative to the input force) and on the relative coefficients of viscous damping in the suspension system, determined by the half-power bandwidth method. The distortions caused by the force of exciter’s inertia were also shown if deemed significant.
5 Results of simulation computations
The spectral characteristic curves obtained from the simulation tests carried out with using the linear model of the front “quarter car” were almost symmetrical, especially when the value of the dimensionless coefficient of damping in the suspension system did not exceed 0.24 (Figures 3a, 4a, and 5a). Close to the first natural frequency, the diagnostic parameters ϑC1 and ϑC2 (equations (1) and (2)) could be determined but only for the 6 lowest damping levels (of the range 0.04÷0.24). Close to the second natural frequency, in turn, the use of the half-power bandwidth method was reasonable in 7 of 12 cases. In contrast, the values of ϑC1 and ϑC2 could be estimated for all the damping levels under consideration (Figure 5a), if the factors of gain in the force under the tester’s vibration plate (measured by means of real diagnostic testers) were used. For the calculations carried out with using the nonlinear model of the front “quarter car”, the results obtained were less optimistic. The spectral characteristic curves showed some symmetry, but only close to the second natural frequency. For the curves presented in Figures 3b, 4b, and 5b, the parameters ϑC1m and ϑC2m could only be estimated for the first 2, first 5, and all the damping levels in question, respectively.
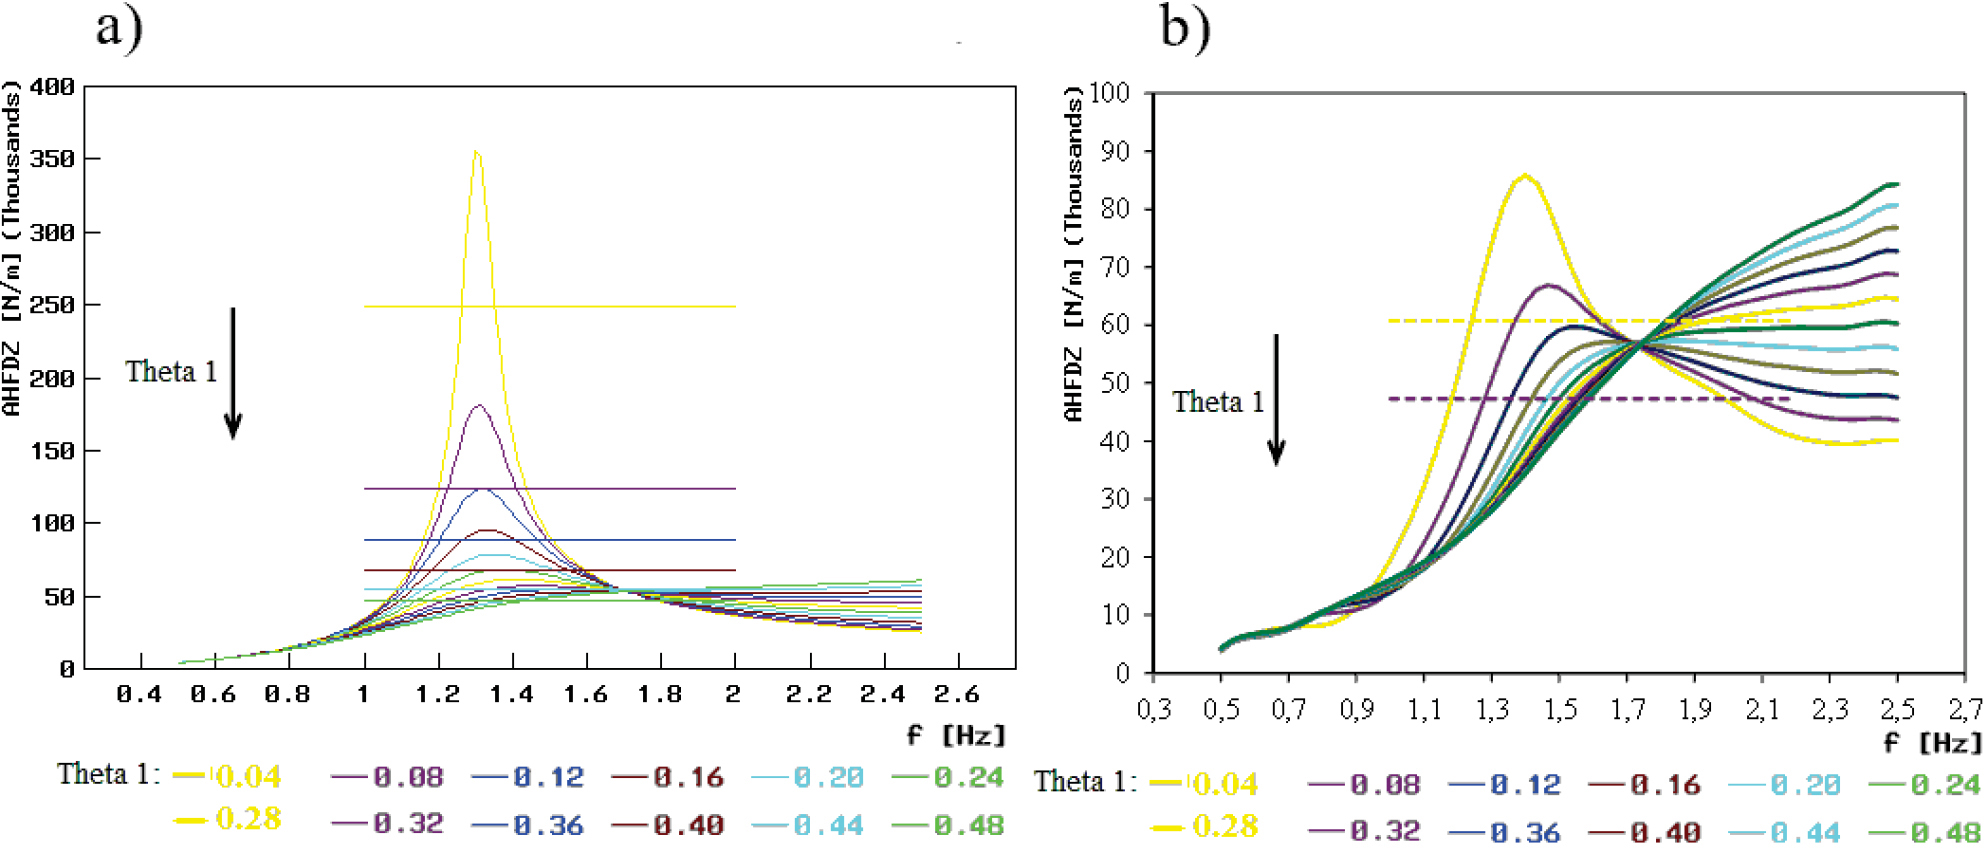
Factors of gain (AHFDZ) in the vertical force at the tire-exciter contact point (relative to the input force) close to the first natural frequency of the front “quarter car” for various damping values ϑ1 (Theta1): The horizontal lines represent the values of

Factors of gain (AHFDZ) in the vertical force at the tire-exciter contact point (relative to the input force) close to the second natural frequency of the front “quarter car” for various damping values ϑ1 (Theta1): the horizontal lines represent the values of

Factors of gain (AHFDZM) in the force measured by the real diagnostic tester, i.e. under the exciter (relative to the input force), close to the second natural frequency of the front “quarter car” for various damping values ϑ1 (Theta1): the horizontal lines represent the values of
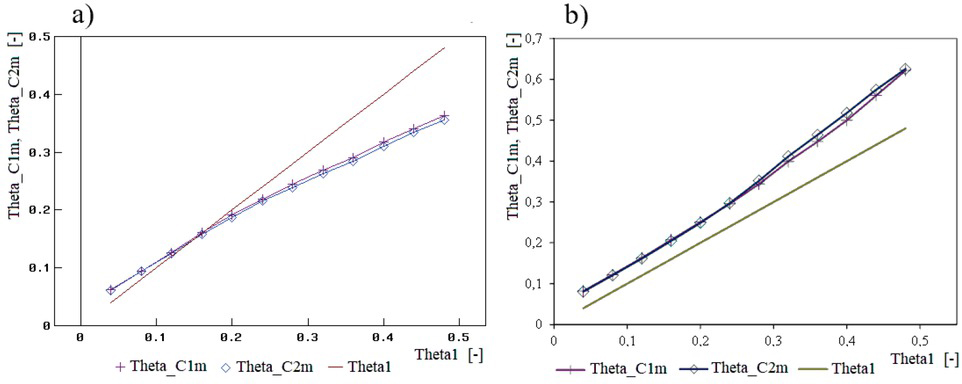
The final simulation results, determined from the spectral characteristic curves close to the first natural frequency of the linear model corresponded to the applied values of the dimensionless coefficient of damping of the range 0.04÷0.24 (Figures 6a and 9a). For higher values of this coefficient, a trend to overestimate the values of ϑC1 and ϑC2 (even by about 25%) was noticed or the values could not be determined at all.

Values of diagnostic parameters ϑC1 (Theta_C1) and ϑC2 (Theta_C2) as functions of the dimensionless coefficient of damping in the suspension system ϑ1 (Theta1), obtained from an analysis of the factor of gain in the vertical force at the tire-exciter contact point (relative to the input force) close to the first natural frequency of the front “quarter car”: a) results for the linear model; b) results for the nonlinear model

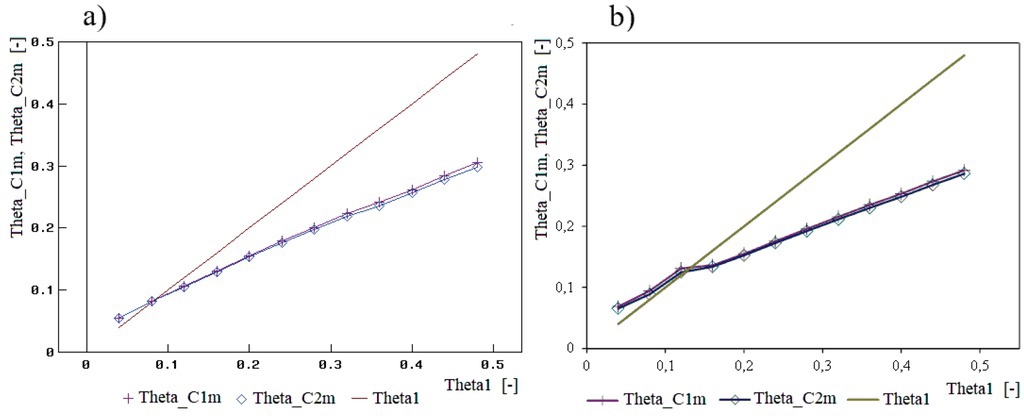
Values of diagnostic parameters ϑC1 (Theta_C1) and ϑC2 (Theta_C2) as functions of the dimensionless coefficient of damping in the suspension system ϑ1 (Theta1), obtained from an analysis of the factor of gain in the vertical force at the tire-exciter contact point (relative to the input force) close to the second natural frequency of the front “quarter car”: a) results for the linear model; b) results for the nonlinear model
Values of diagnostic parameters ϑC1m (Theta_C1m) and ϑC2m (Theta_C2m) as functions of the dimensionless coefficient of damping in the suspension system ϑ1 (Theta1), obtained from an analysis of the factor of gain in the force measured by the real diagnostic tester, i.e. under the exciter (relative to the input force), close to the second natural frequency of the front “quarter car”: a) results for the linear model; b) results for the nonlinear model

Values of diagnostic parameters ϑC1 (Theta_C1) and ϑC2 (Theta_C2) as functions of the dimensionless coefficient of damping in the suspension system ϑ1 (Theta1), obtained from an analysis of the factor of gain in the vertical force at the tire-exciter contact point (relative to the input force) close to the first natural frequency of the rear “quarter car”: a) results for the linear model; b) results for the nonlinear model
For the nonlinear model of the front “quarter car”, in turn, high sliding friction forces in the suspension system prevented the obtaining of final test results except for the tests with the two lowest damping levels, where the results were several times overestimated at that (Figure 6b). Somewhat better results were obtained for the rear suspension system (Figure 8b). However, the ϑC1 and ϑC2 values could only be determined for the five lowest damping levels and the values corresponding to the levels of 0.04 and 0.2 were overestimated even by as much as several ten percent.
In the case of using the factors of gain in the vertical force at the tire-exciter contact point (relative to the input force) close to the second natural frequency of the front “quarter car”, quite good conformity was obtained between the final test results and the predefined values, but only when the latter were relatively low (Figures 7a and 10a). For the front suspension system, significant over-estimation of parameters ϑC1 and ϑC2 (even by as much as several ten percent) was observed when the damping level exceeded 0.16. For the rear suspension system, the value of this threshold was 0.28.

Values of diagnostic parameters ϑC1 (Theta_C1) and ϑC2 (Theta_C2) as functions of the dimensionless coefficient of damping in the suspension system ϑ1 (Theta1), obtained from an analysis of the factor of gain in the vertical force at the tire-exciter contact point (relative to the input force) close to the second natural frequency of the rear “quarter car”: a) results for the linear model; b) results for the nonlinear model
For the nonlinear front “quarter car” model, the calculations produced test results overestimated by several ten to about two hundred percent in the whole range of changes in the damping (Figure 7b). The results obtained in this case were markedly better for the rear suspension system (Figure 10b). Parameters ϑC1 and ϑC2 adequately described the shock absorber condition, but only within the medium damping range. For very low and very high damping levels (0.04÷0.12 and above 0.36), the overestimation of the final test results reached a few ten percent. The phenomenon of tire separation from the exciter (“bouncing”) resulted in conspicuous distortions of the initial parts of the curves plotted (Figures 10b and 11b).
Values of diagnostic parameters ϑC1m (Theta_C1m) and ϑC2m (Theta_C2m) as functions of the dimensionless coefficient of damping in the suspension system ϑ1 (Theta1), obtained from an analysis of the factor of gain in the force measured by the real diagnostic tester, i.e. under the exciter (relative to the input force), close to the second natural frequency of the rear “quarter car”: a) results for the linear model; b) results for the nonlinear model
Wherever the calculations made for the front “quarter car” were based on the factors of gain in the force measured under the tester’s vibration plate, their results better represented the suspension damping applied, in comparison with the case that the vertical force at the tire-exciter contact point was taken as a basis (see Figures 7 and 8). For the linear model, the diagnostic parameters were generally underestimated (by up to about 25%); conversely, those obtained for the nonlinear representation remained overestimated, but definitely less than it can be seen in Figure 7b. A different situation was observed for the rear suspension system: here, the ϑC1m and ϑC2m values represented the suspension damping levels worse than ϑC1 and ϑC2 did and they were underestimated in most cases (see Figures 10 and 11).
6 Recapitulation
Based on the simulation tests carried out, the usability of the half-power bandwidth method in the diagnostic testing of automotive shock absorbers was found to be limited.
The final calculation results were approximately in conformity with expectations but in general, this was only true for low suspension system damping values. However, such cases, occurring when the shock absorbers are in poor condition, are most important in the practical applications of this method. At high damping levels, overestimation of the diagnostic parameters was usually observed, although different situations occurred as well.
A distorting impact of sliding friction in the suspension system on the final test results was noticed. The cases have also been shown where the new diagnostic parameters proposed cannot be determined at all.
The results presented indicate the usability of the linear model, although many important characteristics of a real object are not taken into account in such a model.
In authors’ opinion, experimental verification of the results obtained is necessary because in practice, at low-frequency input (even if the input amplitude is raised to 12.5 mm), the extremum of the response of the system under test becomes hardly distinguishable. Moreover, the shock absorber under test usually fails to function in such conditions if the sliding friction in the suspension system is strong enough.
Acknowledgement
The work was done within project “UNILINE QUANTUM (...)” sponsored by the European Union within the European Regional Development Fund, Smart Growth Operational Programme, Sub-measure 1.1.1. Project No: POIR.01.01.01-00-0949/15. Task carried out by the authors for UNIMETAL Sp. z o.o. in Złotów.
References
[1] Stańczyk TL, Jurecki R. [Comparative analysis of testing methods of hydraulic shock absorbers]. Proceedings of the Institute of Vehicles, Warsaw University of Technology. 2014;4(100):25-45. Polish.Search in Google Scholar
[2] Zdanowicz P. Assessment of vehicle shock-absorbers’ condition having considered dry friction in the suspension [dissertation]. Warsaw: Warsaw University of Technology; 2012.Search in Google Scholar
[3] Calvo JA, Diaz V, San Román JL. Establishing inspection criteria to verify the dynamic behaviour of the vehicle suspension system by a platform vibrating test bench. International Journal of Vehicle Design. 2005;38(4):290-306.10.1504/IJVD.2005.007623Search in Google Scholar
[4] Lozia Z, Zdanowicz P. Simulation assessment of the impact of inertia of the vibration plate of a diagnostic suspension tester on results of the EUSAMA test of shock absorbers mounted in a vehicle. IOP Conference Series: Materials Science and Engineering. 2018;421(2):1-10.10.1088/1757-899X/421/2/022018Search in Google Scholar
[5] Lozia Z, Mikołajczuk J. Ocena przydatności testu diagnostycznego stanu amortyzatorów zamontowanych w pojeździe, wykorzystującego wymuszenie kinematyczne w kontakcie koła z podłożem. The Archives of Automotive Engineering. 1997;2:3-24. Polish.Search in Google Scholar
[6] Calvo JA, San Román JL, Alvarez-Caldas C. Procedure to verify the suspension system on periodical motor vehicle inspection. International Journal of Vehicle Design. 2013;63(1):1-17.10.1504/IJVD.2013.055497Search in Google Scholar
[7] He J, Fu ZF. Modal analysis. 1st ed. Woburn: Butterworth-Heinemann; 2001.10.1016/B978-075065079-3/50001-2Search in Google Scholar
[8] Pugi L, Reatti A, Corti F. Application of modal analysis methods to the design of wireless power transfer systems. Meccanica. 2019;54:321–31.10.1007/s11012-018-00940-xSearch in Google Scholar
[9] Lozia Z. The use of a linear quarter-car model to optimize the damping in a passive automotive suspension system – a follow-on from many authors’ works of the recent 40 years. The Archives of Automotive Engineering. 2016;71(1):33-65.10.14669/AM.VOL71.ART3Search in Google Scholar
© 2021 Z. Lozia and P. Zdanowicz, published by De Gruyter
This work is licensed under the Creative Commons Attribution 4.0 International License.
Articles in the same Issue
- Regular Articles
- Electrochemical studies of the synergistic combination effect of thymus mastichina and illicium verum essential oil extracts on the corrosion inhibition of low carbon steel in dilute acid solution
- Adoption of Business Intelligence to Support Cost Accounting Based Financial Systems — Case Study of XYZ Company
- Techno-Economic Feasibility Analysis of a Hybrid Renewable Energy Supply Options for University Buildings in Saudi Arabia
- Optimized design of a semimetal gasket operating in flange-bolted joints
- Behavior of non-reinforced and reinforced green mortar with fibers
- Field measurement of contact forces on rollers for a large diameter pipe conveyor
- Development of Smartphone-Controlled Hand and Arm Exoskeleton for Persons with Disability
- Investigation of saturation flow rate using video camera at signalized intersections in Jordan
- The features of Ni2MnIn polycrystalline Heusler alloy thin films formation by pulsed laser deposition
- Selection of a workpiece clamping system for computer-aided subtractive manufacturing of geometrically complex medical models
- Development of Solar-Powered Water Pump with 3D Printed Impeller
- Identifying Innovative Reliable Criteria Governing the Selection of Infrastructures Construction Project Delivery Systems
- Kinetics of Carbothermal Reduction Process of Different Size Phosphate Rocks
- Plastic forming processes of transverse non-homogeneous composite metallic sheets
- Accelerated aging of WPCs Based on Polypropylene and Birch plywood Sanding Dust
- Effect of water flow and depth on fatigue crack growth rate of underwater wet welded low carbon steel SS400
- Non-invasive attempts to extinguish flames with the use of high-power acoustic extinguisher
- Filament wound composite fatigue mechanisms investigated with full field DIC strain monitoring
- Structural Timber In Compartment Fires – The Timber Charring and Heat Storage Model
- Technical and economic aspects of starting a selected power unit at low ambient temperatures
- Car braking effectiveness after adaptation for drivers with motor dysfunctions
- Adaptation to driver-assistance systems depending on experience
- A SIMULINK implementation of a vector shift relay with distributed synchronous generator for engineering classes
- Evaluation of measurement uncertainty in a static tensile test
- Errors in documenting the subsoil and their impact on the investment implementation: Case study
- Comparison between two calculation methods for designing a stand-alone PV system according to Mosul city basemap
- Reduction of transport-related air pollution. A case study based on the impact of the COVID-19 pandemic on the level of NOx emissions in the city of Krakow
- Driver intervention performance assessment as a key aspect of L3–L4 automated vehicles deployment
- A new method for solving quadratic fractional programming problem in neutrosophic environment
- Effect of fish scales on fabrication of polyester composite material reinforcements
- Impact of the operation of LNG trucks on the environment
- The effectiveness of the AEB system in the context of the safety of vulnerable road users
- Errors in controlling cars cause tragic accidents involving motorcyclists
- Deformation of designed steel plates: An optimisation of the side hull structure using the finite element approach
- Thermal-strength analysis of a cross-flow heat exchanger and its design improvement
- Effect of thermal collector configuration on the photovoltaic heat transfer performance with 3D CFD modeling
- Experimental identification of the subjective reception of external stimuli during wheelchair driving
- Failure analysis of motorcycle shock breakers
- Experimental analysis of nonlinear characteristics of absorbers with wire rope isolators
- Experimental tests of the antiresonance vibratory mill of a sectional movement trajectory
- Experimental and theoretical investigation of CVT rubber belt vibrations
- Is the cubic parabola really the best railway transition curve?
- Transport properties of the new vibratory conveyor at operations in the resonance zone
- Assessment of resistance to permanent deformations of asphalt mixes of low air void content
- COVID-19 lockdown impact on CERN seismic station ambient noise levels
- Review Articles
- FMEA method in operational reliability of forest harvesters
- Examination of preferences in the field of mobility of the city of Pila in terms of services provided by the Municipal Transport Company in Pila
- Enhancement stability and color fastness of natural dye: A review
- Special Issue: ICE-SEAM 2019 - Part II
- Lane Departure Warning Estimation Using Yaw Acceleration
- Analysis of EMG Signals during Stance and Swing Phases for Controlling Magnetorheological Brake applications
- Sensor Number Optimization Using Neural Network for Ankle Foot Orthosis Equipped with Magnetorheological Brake
- Special Issue: Recent Advances in Civil Engineering - Part II
- Comparison of STM’s reliability system on the example of selected element
- Technical analysis of the renovation works of the wooden palace floors
- Special Issue: TRANSPORT 2020
- Simulation assessment of the half-power bandwidth method in testing shock absorbers
- Predictive analysis of the impact of the time of day on road accidents in Poland
- User’s determination of a proper method for quantifying fuel consumption of a passenger car with compression ignition engine in specific operation conditions
- Analysis and assessment of defectiveness of regulations for the yellow signal at the intersection
- Streamlining possibility of transport-supply logistics when using chosen Operations Research techniques
- Permissible distance – safety system of vehicles in use
- Study of the population in terms of knowledge about the distance between vehicles in motion
- UAVs in rail damage image diagnostics supported by deep-learning networks
- Exhaust emissions of buses LNG and Diesel in RDE tests
- Measurements of urban traffic parameters before and after road reconstruction
- The use of deep recurrent neural networks to predict performance of photovoltaic system for charging electric vehicles
- Analysis of dangers in the operation of city buses at the intersections
- Psychological factors of the transfer of control in an automated vehicle
- Testing and evaluation of cold-start emissions from a gasoline engine in RDE test at two different ambient temperatures
- Age and experience in driving a vehicle and psychomotor skills in the context of automation
- Consumption of gasoline in vehicles equipped with an LPG retrofit system in real driving conditions
- Laboratory studies of the influence of the working position of the passenger vehicle air suspension on the vibration comfort of children transported in the child restraint system
- Route optimization for city cleaning vehicle
- Efficiency of electric vehicle interior heating systems at low ambient temperatures
- Model-based imputation of sound level data at thoroughfare using computational intelligence
- Research on the combustion process in the Fiat 1.3 Multijet engine fueled with rapeseed methyl esters
- Overview of the method and state of hydrogenization of road transport in the world and the resulting development prospects in Poland
- Tribological characteristics of polymer materials used for slide bearings
- Car reliability analysis based on periodic technical tests
- Special Issue: Terotechnology 2019 - Part II
- DOE Application for Analysis of Tribological Properties of the Al2O3/IF-WS2 Surface Layers
- The effect of the impurities spaces on the quality of structural steel working at variable loads
- Prediction of the parameters and the hot open die elongation forging process on an 80 MN hydraulic press
- Special Issue: AEVEC 2020
- Vocational Student's Attitude and Response Towards Experiential Learning in Mechanical Engineering
- Virtual Laboratory to Support a Practical Learning of Micro Power Generation in Indonesian Vocational High Schools
- The impacts of mediating the work environment on the mode choice in work trips
- Utilization of K-nearest neighbor algorithm for classification of white blood cells in AML M4, M5, and M7
- Car braking effectiveness after adaptation for drivers with motor dysfunctions
- Case study: Vocational student’s knowledge and awareness level toward renewable energy in Indonesia
- Contribution of collaborative skill toward construction drawing skill for developing vocational course
- Special Issue: Annual Engineering and Vocational Education Conference - Part II
- Vocational teachers’ perspective toward Technological Pedagogical Vocational Knowledge
- Special Issue: ICIMECE 2020 - Part I
- Profile of system and product certification as quality infrastructure in Indonesia
- Prediction Model of Magnetorheological (MR) Fluid Damper Hysteresis Loop using Extreme Learning Machine Algorithm
- A review on the fused deposition modeling (FDM) 3D printing: Filament processing, materials, and printing parameters
- Facile rheological route method for LiFePO4/C cathode material production
- Mosque design strategy for energy and water saving
- Epoxy resins thermosetting for mechanical engineering
- Estimating the potential of wind energy resources using Weibull parameters: A case study of the coastline region of Dar es Salaam, Tanzania
- Special Issue: CIRMARE 2020
- New trends in visual inspection of buildings and structures: Study for the use of drones
- Special Issue: ISERT 2021
- Alleviate the contending issues in network operating system courses: Psychomotor and troubleshooting skill development with Raspberry Pi
- Special Issue: Actual Trends in Logistics and Industrial Engineering - Part II
- The Physical Internet: A means towards achieving global logistics sustainability
- Special Issue: Modern Scientific Problems in Civil Engineering - Part I
- Construction work cost and duration analysis with the use of agent-based modelling and simulation
- Corrosion rate measurement for steel sheets of a fuel tank shell being in service
- The influence of external environment on workers on scaffolding illustrated by UTCI
- Allocation of risk factors for geodetic tasks in construction schedules
- Pedestrian fatality risk as a function of tram impact speed
- Technological and organizational problems in the construction of the radiation shielding concrete and suggestions to solve: A case study
- Finite element analysis of train speed effect on dynamic response of steel bridge
- New approach to analysis of railway track dynamics – Rail head vibrations
- Special Issue: Trends in Logistics and Production for the 21st Century - Part I
- Design of production lines and logistic flows in production
- The planning process of transport tasks for autonomous vans
- Modeling of the two shuttle box system within the internal logistics system using simulation software
- Implementation of the logistics train in the intralogistics system: A case study
- Assessment of investment in electric buses: A case study of a public transport company
- Assessment of a robot base production using CAM programming for the FANUC control system
- Proposal for the flow of material and adjustments to the storage system of an external service provider
- The use of numerical analysis of the injection process to select the material for the injection molding
- Economic aspect of combined transport
- Solution of a production process with the application of simulation: A case study
- Speedometer reliability in regard to road traffic sustainability
- Design and construction of a scanning stand for the PU mini-acoustic sensor
- Utilization of intelligent vehicle units for train set dispatching
- Special Issue: ICRTEEC - 2021 - Part I
- LVRT enhancement of DFIG-driven wind system using feed-forward neuro-sliding mode control
- Special Issue: Automation in Finland 2021 - Part I
- Prediction of future paths of mobile objects using path library
- Model predictive control for a multiple injection combustion model
- Model-based on-board post-injection control development for marine diesel engine
- Intelligent temporal analysis of coronavirus statistical data