Comparison of STM’s reliability system on the example of selected element
-
Lidia Buda-Ożóg


Abstract
This paper presents optimization of the reliability system for different Strut and Tie models of beams loaded with a torsional and bending moment. In this paper, three STMs depending on the angle of diagonal strut were compared. The presented beam models have a serial system reliability. In the analyses, the full correlation of the top chord of truss - upper reinforcement, full correlation of bottom chord of truss - compression concrete, full correlation of members mapping individual stirrups and concrete in diagonals between stirrups. Estimation of the reliability of the adopted structures was carried out in a software package of Strurel. The variables of concrete, and steel strength as well as concentrated load magnitude were described by a mean value, a standard deviation and a type of distribution. Summing up the results of the analysis, it was noted, that methods for reliability estimation using information about the model’s reliability structure are an excellent alternative to time consuming simulation methods. These methods allow not only to estimate the reliability of the structure, but also to determine the impact of individual members on the reliability of the entire element.
1 Introduction
The use of strut-and-tie model (STM) for the design of reinforced concrete structures has a very long history and is practically inseparable from the history of reinforced concrete structures. The concepts of the STM are originally referred to the truss analogy proposed by Ritter [1] and Mörsch [2] over a century ago. In the following years, strut-and-tie modelling techniques have been extensively investigated in comprehensive works by Thürlimann [3], Schlaich et al. [4], Kuchma [5] and many others. The STM idealizes a complex force flow in structures as a collection of compression members (struts), tension members (ties), and the intersection of such members (nodes).
The choice of the STM depending on the considered issue can be made by using truss analogies, the load path and knowledge of stress trajectories based on numerical models and topological optimization. Despite such a large number of studies, the standard recommendations and the literature do not provide rules to determine unambiguously the shape and direction of elements in the ST method, and the choice of the STM is usually made without reliability assessment of the obtained model.
The adopted ST models are characterized by a specified reliability structure. Analysing the connections of members in this structure and reliability of individual members of the structure the reliability of the entire system can be determined.
Information on the impact of individual components on the reliability of the whole system can be used to optimize the analysed ST models.
In this paper, based on information on the reliability structure of the adopted ST models, the methods of estimating and optimizing the reliability of the whole element are presented. The subject matter of the analysis are cantilever reinforced concrete beams loaded with a torsional and bending moment, having reinforcement arrangements obtained on the basis of different STM but preserving the same overall geometry and loading.
2 Reliability structures of STM’s
From the point of view of reliability, the assumption that a technical object is a simple object is in practice often unjustified. An ordinary object consists of many interrelated members, each of which performs other tasks. Therefore, we are interested not only in the reliability characteristics of such an object as a whole, but also in the impact of the reliability of individual components or groups of components on the reliability of the whole object. Such systems usually do not show similarity to the modelled structure and are called heuristic models. The method of interrelations of members of a given system, defining the dependence of a system’s failure on the failure of its members, is called the reliability structure of this system. The reliability structure of complex technical objects and the reliability of such objects can be analysed by various methods. In the case of building structures, the structure of system reliability should be limited to the consideration of two states, i.e. system members may be safe or fail, omitting intermediate states. There are several methods to assess the reliability of certain non-renewable systems that can be implemented in the analysis of the reliability of limit states of load bearing capacity of building elements and structures. Among them, non-renewable systems with serial-parallel structures are the most popular [6].
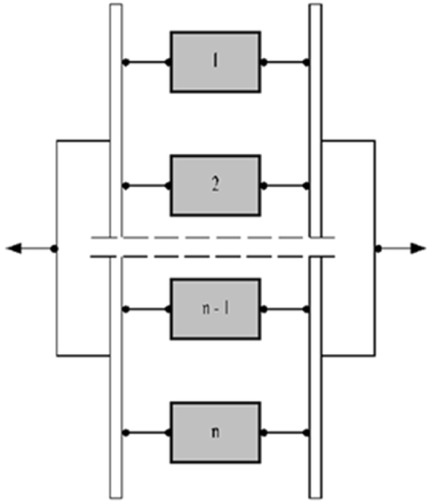
The system has a serial structure in the sense of reliability, the failure of one member leads to the failure of the entire system. The graphic illustrations of this structure for the n- members of the system are shown in the Figure 1.

The n-members serial structures
If the failures of individual system members are independent events, then the probability that all members will be undamaged is equal to the product of the coefficients (probabilities) of the suitability of all members:
where:
Qi – the probability that the i-th member of the system is not damaged
The probability of the failure of a system with a serial reliability structure is determined by the formula:
where:
Pfi = 1 − Qi – the probability of failure the i-th member.
Serial systems model the behaviour of statically determinate structures effectively. In the case of hyperstatic structures, the serial model can be used to estimate the minimum load bearing capacity of the system.
The system has a parallel structure in the sense of reliability if the system is failure when all system components are failure. The graphic illustrations of the parallel structure for n-elements are shown in the Figure 2.
The n- members parallel structures
For independently members, the reliability of the system is expressed by the following formula:
where:
Q j – the probability that the j-th member of the system is not damaged
The probability of a failure of a system with a parallel reliability structure is determined by the formula:
where:
Pfi = 1 − Qj – the probability of failure the j-th member.
A parallel structure occurs when several members perform one and the same function. Only one member is enough to meet it, therefore the remaining members are spare members.
Many structures can be considered as a combination of series and parallel systems. Such systems are referred to as hybrid or combined systems. In the presented methods of analysing the reliability structure of complex technical objects and assessing their reliability, it was assumed that the failures of individual system components are independent events. In practice, systems with different reliability structures consist of correlated members or groups of members. In case of two random variables X and Y, the correlation coefficient is defined as:
where:
Cov (X,Y) – covariance of random variables X, Y,
σx, σy – standard deviation of X, Y random variables.
In real structures, the constant value of the correlation coefficient is a very rare phenomenon, usually individual elements of the system are differently correlated and described by the correlation matrix:
The exact determination of the probability of destruction – Pf , a complex system with correlated elements is in practice very difficult, and sometimes even impossible. Therefore, complex systems usually estimate the range of extreme values of the correlation coefficient:
3 Subject of analysis
In this paper, three Strut and Tie Models (STMs) depending on the angle of diagonal strut were compared [7, 8]. The angle of concrete compression diagonal struts were chosen so that the recommendations given in the national annex of the standard [9] for truss model were met. The first model (for B1 beam: ST1) was a spatial truss similar to the Leonhardt truss [10], in which the concrete compression diagonal struts, separated by cracks on each side of the vertical and horizontal element were inclined to the axis of the chords at the angle of 45∘. The vertical elements of truss represent reinforcement in the shape of stirrups. The top and bottom chords of the truss represent tension reinforcement and compressed accordingly. In the second STM, the concrete compression diagonal strut were inclined to the axis of the chord at the angle of 37∘ (for B2 beam: ST2), but in the third STM the diagonal struts were inclined at the angle of 26.6∘. (for B3 beam: ST3). For all analysed beams (STM), the designed reinforcement was performed for the design load of 60 kN. The analysed model of cantilever beams are shown in Figure 3.

The analysed model of cantilever beams, a) beam B1, b) beam B2, c) beam B3
On the basis of the obtained forces in the STM’s, longitudinal reinforcement and stirrups were designed, the allowable compressive stresses in concrete struts of the STM and the anchorages of reinforcement were checked. The cross-section of analysed cantilever beams with reinforcement obtained on the basis of the adopted STM are shown in Figure 4.
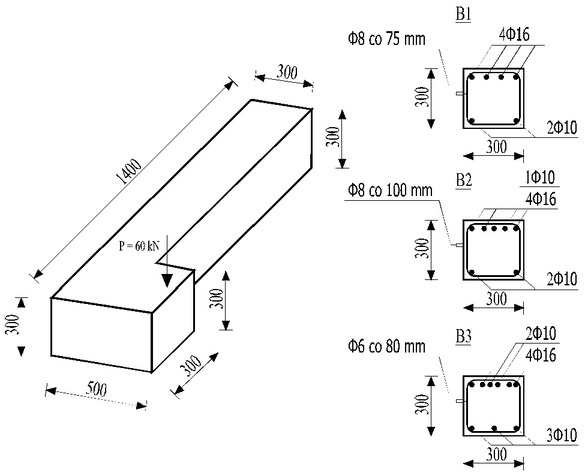
Geometry and reinforcement of the analysed beams
4 System reliability of analysed STM’s
The presented beam models have a serial system reliability. Due to the method of making these types of members (the same concrete, the same reinforcement) in the analyses, the full correlation of the top chord of truss – upper reinforcement, full correlation of bottom chord of truss – compression concrete, full correlation of members mapping individual stirrups and concrete in diagonals between stirrups. The particular members of the B3 beam system reliability are shown in Figure 5. Analogous correlations of members were adopted for models B1 and B2 beams.

The particular members of the B3 beam system reliability
Estimation of the reliability of the adopted structures was carried out in a package of Strurel programs (Comrel, Costrel and Sysrel) enabling the user to define the functions of the limit state in symbolic processor notation. In case of normal and logarithmically normal variables, the structure of the model dependence can be given directly by means of correlation coefficients obtained from the covariance matrix, while in the complex model correlation coefficients in the input matrix should be given [11]. The Sysrel program for defined limit state functions of individual members and the type of system reliability (serial, parallel, complex) makes it possible to analyse the reliability of the whole structure. The limit state functions depending on the type of members in the STM are defined as follows:
where:
Zi – the limit state function of the i-th member,
Asi – the area of the reinforcement of the i-th member,
F i – the force in the i-th member of the STM is obtained for mean external loads,
fy – mean strength of reinforcing steel,
σmax(i) – allowable compressive stresses in concrete struts of the STM
tef – effective wall thickness of the hollow section in the torsion elements,
ai – width of the i-th compressed strut
The statistic parameters were described using the recommendations specified in JCSS [12] and [13]. The input values should be properly described, e.g. with a mean value, a standard deviation or a type of distribution. The distribution and standard deviation for the input variables of concrete, steel and concentrated load are shown in Table 1. The reliability of beams were assessed using probabilistic method FORM (First Order Reliability Metod) and SORM(Second Order Reliability Method). These are one of the most effective approximate methods for calculating reliability.
The mean value, standard deviation and distribution for the input variables
| Input | Mean value | Standard deviation | Distribution |
|---|---|---|---|
| 43 | 4.86 | Lognormal | |
| 545 | 27.25 | Lognormal | |
| P [kN] | 45 | 6.75 | Normal |
In the analyses, a correlation between the values of forces in individual ST members at the level of 0.9 was assumed. The reliability index estimated by the SORM method for individual members of the systems has been presented in Table 2. The values of the reliability index and the probability of failure of the whole system estimated by two methods, ie FORMand SORM, are compared in Table 3.
Reliability index of individual members in the reliability structures of the analysed beams
| STM1 – B1 | STM2 – B2 | STM3 –B3 | |||
|---|---|---|---|---|---|
| Element | βSORM | Element | βSORM | Element | βSORM |
| T1, T2 | 4.82 | T1, T2 | 5.24 | T1, T2 | 5.18 |
| T3, T4, | 6.61 | T3, T4, | 6.61 | T3, T4 | 6.61 |
| T5, T6 | T5 | ||||
| S1 | 5.75 | S1 | 6.86 | S1 | 6.15 |
| S2 | 9.32 | S2 | 12.74 | S2 | 9.86 |
| S3, S4, | 6.78 | S3, S4, | 6.50 | S3, S4 | 5.13 |
| S5, S6 | S5 | ||||
Reliability index and failure probability for whole system
| Series | βFORM | βSORM | ||
|---|---|---|---|---|
| B1 | 4.78 | 8.676·10−7 | 4.82 | 7.185·10−7 |
| B2 | 5.23 | 8.276·10−8 | 5.24 | 7.888·10−8 |
| B3 | 5.01 | 2.699·10−7 | 5.02 | 2.541·10−7 |
Knowledge of the reliability structure allows determining the impact of the change of positional parameters and the distribution of random variables on the change of the index of system reliability. It is easy to assess the sensitivity of the system to changes in the quality of materials or permanent or variable load. An example of such an analysis may be the effect of changing the average compressive strength of concrete to the estimated value of the reliability index of the STM, as shown in Figure 6.

Impact of concrete strength on the reliability index of analysed STMs
Based on the conducted analyses, it can be concluded that the reliability structure of the ST3 model is more sensitive to a change of concrete class than the ST1 or ST2 model. In the case of concrete with a mean compressive strength of 33 MP (concrete class C25/30), the safety condition of the RC2 construction reliability class and 50 years of use are not met. However, in the case of ST1 and ST2 models, the sensitivity of the reliability structure to the change of the concrete class above C30/37 is insignificant.
Knowledge of the reliability characteristics of the system members and their impact on the reliability of the whole structure allows increasing the safety of the structure, by increasing the reliability of the weakest members in the structure. Analysing the value of the reliability index of individual members, presented in Table 2, it can be noticed that T1 and T2 ties are characterized by the highest probability of failure. Increasing the adopted reinforcement area from 402 mm2 (2 ϕ 16mm) to 450 mm2 (2 ϕ 16mm + 1 ϕ 8 mm) in the above ties results in a change in the reliability index of the members from βSORM = 4.82 to βSORM = 5.93. This results in a significant change in the probability of the whole system failure from PfSORM = 8.676·10−7 to PfSORM = 5.986·10−9. The reliability index determined for the optimized reliability structure corresponding to the probability of failure is βSORM = 5.70. Analogical optimization of the reliability structure can be carried out for the STM2, here the weakest members of the system are the ties: T1 and T2. By changing the surface of reinforcement by adding one bar ϕ 8mm, the reliability index of members increases from βSORM = 5.24 to βSORM = 6.51, and as a result, the probability of the whole system failure is reduced from PfSORM = 7.888 · 10−8 on PfSORM = 9.392 · 10−11. The reliability index for such an optimized structure is βSORM = 6.37.
In the case of the STM3 model, increasing the reliability of the structure is not so easy as in the previous models. The Table 2 shows that in the STM3 model the weakest members are ties T1 and T2 and struts S3, S4. This means that increasing the reliability of the system requires increasing the class of concrete and the area of the reinforcement for ties T1 and T2.
5 Conclusion
The paper presents the probabilistic assessment of system reliability for different STM of beams loaded with a torsional moment, bending moment as well as a shear force. Summing up the results of the analysis, it was noted that methods for reliability estimation using information about the model’s reliability structure are an excellent alternative to time consuming simulation methods. This methods allow not only estimating the reliability of the structure, but also determining the impact of individual members on the reliability of the entire element. Awareness of the reliability of individual members and their impact on the reliability of the whole system, allows its optimization so that the adopted model has the lowest probability of failure. Fulfilling the condition of the highest reliability of the analysed structure can be achieved by increasing the reliability of the weakest members in the system.
In this paper, it has been shown that the methods of estimating reliability using information about the model structure can be easily implemented to optimization of reliability of reinforced concrete structures designed on the basis of STMs.
References
[1] Ritter W. Die Bauweise Hennebique. Schweizerische Bauzeitung, vol. 33, Februry, pp. 41-43, 49-52 and 59-61, 1899.Suche in Google Scholar
[2] Morsch E. Der Eisenbetonbau seine Theorie und Anwendung. Stuttgart: Verlag K. Wittwer; 1929.Suche in Google Scholar
[3] Thurlimann, B. et al., Vorlesung Zum Fortbildungskurs Fur Bauingeniure, Eth Zuri: Institute Fur Bauststik Und Konstruktion, 1983.Suche in Google Scholar
[4] Schlaich J., Schäfer K., Jennewein M., Toward a consistent design of structural concrete. (PCI J 1987;32(3):74–150 1987.10.15554/pcij.05011987.74.150Suche in Google Scholar
[5] Kuchma D. i Tjhin, T., CAST (Computer Aided Strut-and-Tie) design tool. Structures Congress 2011.Suche in Google Scholar
[6] Nowak A. i Collins, K., Reliability of Structures. McGraw – Hill, 2000.Suche in Google Scholar
[7] Buda-Ożóg L. Assessment of stiffness beams subjected to combined shear and torsion designed using STM. Procedia Engineering. Tom. 2017;193:152–9.10.1016/j.proeng.2017.06.198Suche in Google Scholar
[8] Buda-Ożóg, L., Niezawodność konstrukcji żelbetowych projektowanych metodą Strut and Tie, Oficyna wydawnicza Politechniki Rzeszowskiej, 2019 (in Polish).Suche in Google Scholar
[9] EN 1992-1-1, Eurocode 2: Design of concrete structures - Part 1-1: General rules and rules for buildings, 2004.Suche in Google Scholar
[10] Leonhardt F, Mönning E. Vorlesungen über Massivbau. Teil I. Berlin: Springer Verlag; 1973.10.1007/978-3-662-07601-9Suche in Google Scholar
[11] Strurel, Technical Reference, User Manual. Munchen: RCP Consult GmbH; 2018.Suche in Google Scholar
[12] JCSS. Probabilistic model code. JCSS working material [online], http://www.jcss.ethz.ch/ 2012.Suche in Google Scholar
[13] Woliński S. Niezawodność konstrukcji budowlanych. Rozdział 4.11, w: Praca zbiorowa, Budownictwo ogólne. T.3. Warszawa: Arkady; 2008. pp. 376–419. [(in Polish)].Suche in Google Scholar
© 2021 L. Buda-Ożóg, published by De Gruyter
This work is licensed under the Creative Commons Attribution 4.0 International License.
Artikel in diesem Heft
- Regular Articles
- Electrochemical studies of the synergistic combination effect of thymus mastichina and illicium verum essential oil extracts on the corrosion inhibition of low carbon steel in dilute acid solution
- Adoption of Business Intelligence to Support Cost Accounting Based Financial Systems — Case Study of XYZ Company
- Techno-Economic Feasibility Analysis of a Hybrid Renewable Energy Supply Options for University Buildings in Saudi Arabia
- Optimized design of a semimetal gasket operating in flange-bolted joints
- Behavior of non-reinforced and reinforced green mortar with fibers
- Field measurement of contact forces on rollers for a large diameter pipe conveyor
- Development of Smartphone-Controlled Hand and Arm Exoskeleton for Persons with Disability
- Investigation of saturation flow rate using video camera at signalized intersections in Jordan
- The features of Ni2MnIn polycrystalline Heusler alloy thin films formation by pulsed laser deposition
- Selection of a workpiece clamping system for computer-aided subtractive manufacturing of geometrically complex medical models
- Development of Solar-Powered Water Pump with 3D Printed Impeller
- Identifying Innovative Reliable Criteria Governing the Selection of Infrastructures Construction Project Delivery Systems
- Kinetics of Carbothermal Reduction Process of Different Size Phosphate Rocks
- Plastic forming processes of transverse non-homogeneous composite metallic sheets
- Accelerated aging of WPCs Based on Polypropylene and Birch plywood Sanding Dust
- Effect of water flow and depth on fatigue crack growth rate of underwater wet welded low carbon steel SS400
- Non-invasive attempts to extinguish flames with the use of high-power acoustic extinguisher
- Filament wound composite fatigue mechanisms investigated with full field DIC strain monitoring
- Structural Timber In Compartment Fires – The Timber Charring and Heat Storage Model
- Technical and economic aspects of starting a selected power unit at low ambient temperatures
- Car braking effectiveness after adaptation for drivers with motor dysfunctions
- Adaptation to driver-assistance systems depending on experience
- A SIMULINK implementation of a vector shift relay with distributed synchronous generator for engineering classes
- Evaluation of measurement uncertainty in a static tensile test
- Errors in documenting the subsoil and their impact on the investment implementation: Case study
- Comparison between two calculation methods for designing a stand-alone PV system according to Mosul city basemap
- Reduction of transport-related air pollution. A case study based on the impact of the COVID-19 pandemic on the level of NOx emissions in the city of Krakow
- Driver intervention performance assessment as a key aspect of L3–L4 automated vehicles deployment
- A new method for solving quadratic fractional programming problem in neutrosophic environment
- Effect of fish scales on fabrication of polyester composite material reinforcements
- Impact of the operation of LNG trucks on the environment
- The effectiveness of the AEB system in the context of the safety of vulnerable road users
- Errors in controlling cars cause tragic accidents involving motorcyclists
- Deformation of designed steel plates: An optimisation of the side hull structure using the finite element approach
- Thermal-strength analysis of a cross-flow heat exchanger and its design improvement
- Effect of thermal collector configuration on the photovoltaic heat transfer performance with 3D CFD modeling
- Experimental identification of the subjective reception of external stimuli during wheelchair driving
- Failure analysis of motorcycle shock breakers
- Experimental analysis of nonlinear characteristics of absorbers with wire rope isolators
- Experimental tests of the antiresonance vibratory mill of a sectional movement trajectory
- Experimental and theoretical investigation of CVT rubber belt vibrations
- Is the cubic parabola really the best railway transition curve?
- Transport properties of the new vibratory conveyor at operations in the resonance zone
- Assessment of resistance to permanent deformations of asphalt mixes of low air void content
- COVID-19 lockdown impact on CERN seismic station ambient noise levels
- Review Articles
- FMEA method in operational reliability of forest harvesters
- Examination of preferences in the field of mobility of the city of Pila in terms of services provided by the Municipal Transport Company in Pila
- Enhancement stability and color fastness of natural dye: A review
- Special Issue: ICE-SEAM 2019 - Part II
- Lane Departure Warning Estimation Using Yaw Acceleration
- Analysis of EMG Signals during Stance and Swing Phases for Controlling Magnetorheological Brake applications
- Sensor Number Optimization Using Neural Network for Ankle Foot Orthosis Equipped with Magnetorheological Brake
- Special Issue: Recent Advances in Civil Engineering - Part II
- Comparison of STM’s reliability system on the example of selected element
- Technical analysis of the renovation works of the wooden palace floors
- Special Issue: TRANSPORT 2020
- Simulation assessment of the half-power bandwidth method in testing shock absorbers
- Predictive analysis of the impact of the time of day on road accidents in Poland
- User’s determination of a proper method for quantifying fuel consumption of a passenger car with compression ignition engine in specific operation conditions
- Analysis and assessment of defectiveness of regulations for the yellow signal at the intersection
- Streamlining possibility of transport-supply logistics when using chosen Operations Research techniques
- Permissible distance – safety system of vehicles in use
- Study of the population in terms of knowledge about the distance between vehicles in motion
- UAVs in rail damage image diagnostics supported by deep-learning networks
- Exhaust emissions of buses LNG and Diesel in RDE tests
- Measurements of urban traffic parameters before and after road reconstruction
- The use of deep recurrent neural networks to predict performance of photovoltaic system for charging electric vehicles
- Analysis of dangers in the operation of city buses at the intersections
- Psychological factors of the transfer of control in an automated vehicle
- Testing and evaluation of cold-start emissions from a gasoline engine in RDE test at two different ambient temperatures
- Age and experience in driving a vehicle and psychomotor skills in the context of automation
- Consumption of gasoline in vehicles equipped with an LPG retrofit system in real driving conditions
- Laboratory studies of the influence of the working position of the passenger vehicle air suspension on the vibration comfort of children transported in the child restraint system
- Route optimization for city cleaning vehicle
- Efficiency of electric vehicle interior heating systems at low ambient temperatures
- Model-based imputation of sound level data at thoroughfare using computational intelligence
- Research on the combustion process in the Fiat 1.3 Multijet engine fueled with rapeseed methyl esters
- Overview of the method and state of hydrogenization of road transport in the world and the resulting development prospects in Poland
- Tribological characteristics of polymer materials used for slide bearings
- Car reliability analysis based on periodic technical tests
- Special Issue: Terotechnology 2019 - Part II
- DOE Application for Analysis of Tribological Properties of the Al2O3/IF-WS2 Surface Layers
- The effect of the impurities spaces on the quality of structural steel working at variable loads
- Prediction of the parameters and the hot open die elongation forging process on an 80 MN hydraulic press
- Special Issue: AEVEC 2020
- Vocational Student's Attitude and Response Towards Experiential Learning in Mechanical Engineering
- Virtual Laboratory to Support a Practical Learning of Micro Power Generation in Indonesian Vocational High Schools
- The impacts of mediating the work environment on the mode choice in work trips
- Utilization of K-nearest neighbor algorithm for classification of white blood cells in AML M4, M5, and M7
- Car braking effectiveness after adaptation for drivers with motor dysfunctions
- Case study: Vocational student’s knowledge and awareness level toward renewable energy in Indonesia
- Contribution of collaborative skill toward construction drawing skill for developing vocational course
- Special Issue: Annual Engineering and Vocational Education Conference - Part II
- Vocational teachers’ perspective toward Technological Pedagogical Vocational Knowledge
- Special Issue: ICIMECE 2020 - Part I
- Profile of system and product certification as quality infrastructure in Indonesia
- Prediction Model of Magnetorheological (MR) Fluid Damper Hysteresis Loop using Extreme Learning Machine Algorithm
- A review on the fused deposition modeling (FDM) 3D printing: Filament processing, materials, and printing parameters
- Facile rheological route method for LiFePO4/C cathode material production
- Mosque design strategy for energy and water saving
- Epoxy resins thermosetting for mechanical engineering
- Estimating the potential of wind energy resources using Weibull parameters: A case study of the coastline region of Dar es Salaam, Tanzania
- Special Issue: CIRMARE 2020
- New trends in visual inspection of buildings and structures: Study for the use of drones
- Special Issue: ISERT 2021
- Alleviate the contending issues in network operating system courses: Psychomotor and troubleshooting skill development with Raspberry Pi
- Special Issue: Actual Trends in Logistics and Industrial Engineering - Part II
- The Physical Internet: A means towards achieving global logistics sustainability
- Special Issue: Modern Scientific Problems in Civil Engineering - Part I
- Construction work cost and duration analysis with the use of agent-based modelling and simulation
- Corrosion rate measurement for steel sheets of a fuel tank shell being in service
- The influence of external environment on workers on scaffolding illustrated by UTCI
- Allocation of risk factors for geodetic tasks in construction schedules
- Pedestrian fatality risk as a function of tram impact speed
- Technological and organizational problems in the construction of the radiation shielding concrete and suggestions to solve: A case study
- Finite element analysis of train speed effect on dynamic response of steel bridge
- New approach to analysis of railway track dynamics – Rail head vibrations
- Special Issue: Trends in Logistics and Production for the 21st Century - Part I
- Design of production lines and logistic flows in production
- The planning process of transport tasks for autonomous vans
- Modeling of the two shuttle box system within the internal logistics system using simulation software
- Implementation of the logistics train in the intralogistics system: A case study
- Assessment of investment in electric buses: A case study of a public transport company
- Assessment of a robot base production using CAM programming for the FANUC control system
- Proposal for the flow of material and adjustments to the storage system of an external service provider
- The use of numerical analysis of the injection process to select the material for the injection molding
- Economic aspect of combined transport
- Solution of a production process with the application of simulation: A case study
- Speedometer reliability in regard to road traffic sustainability
- Design and construction of a scanning stand for the PU mini-acoustic sensor
- Utilization of intelligent vehicle units for train set dispatching
- Special Issue: ICRTEEC - 2021 - Part I
- LVRT enhancement of DFIG-driven wind system using feed-forward neuro-sliding mode control
- Special Issue: Automation in Finland 2021 - Part I
- Prediction of future paths of mobile objects using path library
- Model predictive control for a multiple injection combustion model
- Model-based on-board post-injection control development for marine diesel engine
- Intelligent temporal analysis of coronavirus statistical data