Estimating the potential of wind energy resources using Weibull parameters: A case study of the coastline region of Dar es Salaam, Tanzania
-
Enock Michael
 and
Aditya Rio Prabowo
and
Aditya Rio Prabowo

Abstract
This study aimed to compare the graphical method (GM) and standard deviation method (SDM), based on analyses and efficient Weibull parameters by estimating future wind energy potential in the coastline region of Dar es Salaam, Tanzania. Hence, the conclusion from the numerical method comparisons will also determine suitable wind turbines that are cost-effective for the study location. The wind speed data for this study were collected by the Tanzania Meteorological Authority Dar es Salaam station over the period of 2017 to 2019. The two numerical methods introduced in this study were both found to be appropriate for Weibull distribution parameter estimation in the study area. However, the SDM gave a higher value of the Weibull parameter estimation than the GM. Furthermore, the five selected commercial wind turbine models that were simulated in terms of performance were based on a capacity factor using the SDM and were both over 25% the recommended capacity factor value. The Polaris P50-500 commercial wind turbine is recommend as a suitable wind turbine to be installed in the study area due to its maximum annual capacity factor value over 3 years.
1 Introduction
Energy is considered as one of the primary benchmarks for the growth of the economic and industrial sectors of a country [1,2]. Among the major energy resources are fossil fuels, but these have reserve limits [3]; the use of fossil fuels, however, is no doubt one of the key factors that contributes to the gases that cause the greenhouse effect [4,5,6,7]. A way to avoid these harmful effects is the utilization of renewable energies, such as hydro [8], biomass [9], geothermal [10], solar [11], and wind energy [12,13,14].
Among these different renewable energy sources, wind energy is noted as a promising source of renewable energy, which has presently gained greater awareness due to its many locations, adequate availabilities, and its sustainable characteristics [15,16,17,18,19,20]. Additionally, wind energy first captured interest in Europe and USA due to the worldwide oil crises in the 1970s and 1980s. In the 1980s and 1990s, the construction of modern wind farms began, which allowed the cumulative installed wind capacity of the whole world to be around 6,100 MW; the installed wind capacity reached 16,863 MW by the end of 2000 [2]. Eighty percent of the installed wind capacity belonged to Germany, USA, Denmark, and Spain at that time [21]. Investments in wind energy worldwide increased 10× by 2010 compared with the end of 2000 [2]. By the end of 2019, worldwide wind capacity installation reached about 622,704 MW for both onshore and offshore farms, as shown in Figure 1 [2].

The global installed wind capacity until the end of 2019.
Wind data analysis is regarded as the first stage of estimation of the future wind energy potential of a study site. For wind speed frequency distribution estimations over a period of time, there are probability distribution functions that can be used, such as the two-parameter Weibull distribution and Rayleigh methods [22,23,24,25,26]. The two-parameter Weibull distribution is considered efficient for wind-data fitting and is also able to provide accurate wind energy potential predictions [27,28]. There are several types of two-parameter Weibull distributions, such as the moment method, energy pattern factor method, graphical method (GM), empirical method of Justus, empirical method of Lysen, standard deviation method (SDM), and the maximum likelihood method [29]. This study used the GM and SDM for wind speed frequency distribution analyses.
Furthermore, this work is a logical part of examining, in detail, the wind energy potential of the coastline region of Dar es Salaam, Tanzania, using an attentive, more extensive, and accurate comparative study of the two numerical methods for Weibull parameter estimation. The wind energy potential of the coast of Dar es Salaam seems promising; however, there have been no previous studies related to the wind energy potential conducted in the area. The yearly mean values estimated from the wind speed data were analyzed in this work to evaluate methods of adjustment for the study site. As the height of the hub of many commercial wind turbines is higher than the height of an anemometer (a device used for the measurement of wind speed), determining yearly wind power density requires exploration of the height of wind-speed data. The GM and SDM were used at a height of 70 m. The obtained results from both the numerical methods were compared for accurate determination. Three statistical tests, namely root mean square error (RMSE), Chi-square error (χ 2), and the determination of the coefficient (R 2) were used to perform the evaluation process. Hence, wind turbine performance assessment was evaluated from the best fit numerical method, based on the capacity factor of the wind turbine using five commercial wind turbine models.
2 Wind energy in Tanzania, Dar es Salaam description, and data collection
The wind resources in Tanzania are very strong, and the wind speeds are between 6 and 8 m/s, particularly in the regions around Rift Valley and the coastline of the country [30]. There have been a number of ongoing research studies for some years, including an exploration program that receives sponsorship from the Tanzania Ministry of Energy and Minerals, Tanzania National Electric Supply Company Limited (TANESCO), and Tanzania Traditional Energy Development Organization as well as technical and financial support from the Denmark National Laboratory (Risø) and the Danish International Development Agency (DANIDA) [30]. The mentioned institutions have conducted a significant amount of work in terms of wind resource assessment and also aim to determine the feasibility of wind energy utilization. The exploration ended in 2003 and produced detailed information for specific locations, as described in Table 1. Presently, the first wind farm operating in Tanzania has been opened and the installed wind capacity of the Mwenga wind farm is 2.4 MW; it is located at Usokami Village in the Mufindi District. The wind farm is a privately owned plant and consists of three 800 kW enecorn wind turbines [31]. The study site location is the region of Dar es Salaam and is located at latitude 6°48′S, longitude 39°17′E, at an altitude of 55 m above sea level, and in the east of the country. The region is 442 km east of the capital, Dodoma, and 625 km south of the headquarters of the East African community, Arusha, as shown on the map of Tanzania in Figure 2. It covers an area of 1,590 km2, of which 450 km2 is coastline [32]. Additionally, Dar es Salaam has a tropical climate feature with a fairly high temperature and high humidity. The average rainfall in the region is 1,000 mm per year, which occurs throughout the year but primarily during the two rainy seasons [32]. The wind speed data used in this study were provided by the Tanzania Meteorological Authority. The wind speed data were recorded using an anemometer every 3 h at a height of 10 m above the ground over 3 years (from January 2017 to December 2019).
Wind resources in Tanzania
| Location | Study | 10 (m) wind speed (m/s) | 30 (m) wind speed (m/s) |
|---|---|---|---|
| Makambako (Njombe) | Original Wind East Africa | 7.6 | 8.7 |
| Singida | Wind East Africa | 8.2 | 9.4 |
| Karatu (Arusha) | DANIDA/Risø/TANESCO | 4.9 | 5.5 |
| Mkumbara (Tanga) | DANIDA/Risø/TANESCO | 4.14 | 4.9 |
| Gomvu (Dar es Salaam) | DANIDA/Risø/TANESCO | 3.56 | 4.28 |
| Litembe (Mtwara) | DANIDA/Risø/TANESCO | 3.21 | 4.47 |

The map of Tanzania.
3 Weibull distribution method
3.1 Weibull probability density function
The Weibull probability density function is the function where the value at any specified point can be explained by providing a relative likelihood that the random variable value would be equal to that sample. In the context of wind speed, this offers the frequency at which a particular value of wind speed is noticed in a studied region. The Weibull probability density function is given by [33,34,35,36]:
where
Then, the cumulative distribution function is determined as follows [38,39,40]:
3.2 Mean wind power density and energy density
The mean wind power density can be defined using the equation below [41]:
where
The energy density can be defined using the following expression [42]:
where
3.3 Weibull parameter variation with height
Generally, available wind speed data are measured at a height that is different from that of the hub height of a wind turbine. It is noted that wind speed in this regard, for wind power applications, is the wind speed at the hub height. Thus, the available wind speeds are converted to the wind turbine hub height using the polar law expression [43,44,45]:
where
Wind speed placed at a given height (
4 Methods used for estimation of Weibull distribution parameters
As is known, there are several Weibull distribution methods that can be used in shape and scale Weibull factor determination for wind-speed measurements. In this study, the GM and the SDM were used to estimate the Weibull probability density function parameters. The Sections 4.1 and 4.2 summarize these two Weibull distribution methods.
4.1 The GM
The GM requires wind speed to be in the format of a cumulative frequency distribution. In this distribution method, the wind-speed data are interpolated using a straight line and the concept of least squares regression was used. Logarithmic transformation is the foundation of this method. By converting equation (1) into a logarithmic form, equation (9) is obtained [48]:
The Weibull shape and scale factor parameters were used for estimation by graphing
4.2 The SDM
In the SDM, the wind speed average and the standard deviation values are used to estimate the Weibull distribution function. Shape k and scale c coefficients can be estimated, as in equations (10) and (11) [46]:
where
5 Performance analyses of the models
Usually, the RMSE, Chi-square error (χ
2), and the determination of the coefficient
where
6 Wind turbine performance assessment
For determining the most efficient and suitable type of wind turbine based on the studied area, five wind turbine models (small to medium sizes) with a rated power between 50 and 1,000 kW were simulated, and their performances were based on a capacity factor. The capacity factor,
The mean power output,
where
7 Results and discussion
7.1 Comparison based on Weibull distribution parameter estimation
An average monthly Weibull distribution parameter for all years (2017–2019), as estimated by both methods, is shown in Table 2 for an anemometer that was placed at a height of 10 m. In addition, extrapolated wind characteristics obtained for a 70 m height are also shown in the same table. The Weibull distribution parameter variation depended on the month. The highest monthly Weibull shape factor
Yearly shape
| Method | Month |
|
|
|
Method | Month |
|
|
|
|---|---|---|---|---|---|---|---|---|---|
| SDM | Jan | 3.25 | 6.81 | 138.34 | SDM | Jan | 3.92 | 10.91 | 473.84 |
| Feb | 3.02 | 6.42 | 115.23 | Feb | 3.65 | 10.42 | 407.52 | ||
| Mar | 2.76 | 5.75 | 80.77 | Mar | 3.33 | 9.55 | 303.13 | ||
| Apr | 2.85 | 5.85 | 86.62 | Apr | 3.44 | 9.68 | 321.91 | ||
| May | 2.96 | 5.66 | 78.88 | May | 3.58 | 9.44 | 297.42 | ||
| Jun | 2.82 | 6.18 | 102.46 | Jun | 3.41 | 10.11 | 368.24 | ||
| Jul | 2.61 | 5.69 | 78.41 | Jul | 3.15 | 9.47 | 297.42 | ||
| Aug | 2.62 | 5.67 | 77.95 | Aug | 3.16 | 9.44 | 295.16 | ||
| Sep | 2.72 | 5.64 | 77.48 | Sep | 3.28 | 9.41 | 294.03 | ||
| Oct | 2.49 | 5.72 | 80.29 | Oct | 3.01 | 9.51 | 300.84 | ||
| Nov | 2.62 | 5.23 | 61.58 | Nov | 3.16 | 8.85 | 242.21 | ||
| Dec | 2.65 | 6.11 | 98.06 | Dec | 3.21 | 10.02 | 356.59 | ||
| GM | Jan | 2.21 | 3.63 | 100.25 | GM | Jan | 2.66 | 6.63 | 364.33 |
| Feb | 1.91 | 5.46 | 79.82 | Feb | 2.31 | 9.16 | 300.84 | ||
| Mar | 1.71 | 4.53 | 53.61 | Mar | 2.06 | 7.89 | 216.45 | ||
| Apr | 2.08 | 4.24 | 56.19 | Apr | 2.51 | 7.51 | 223.88 | ||
| May | 1.89 | 4.71 | 52.89 | May | 2.28 | 8.16 | 213.71 | ||
| Jun | 1.86 | 4.82 | 66.48 | Jun | 2.24 | 8.29 | 257.37 | ||
| Jul | 1.94 | 3.95 | 47.69 | Jul | 2.34 | 7.08 | 196.01 | ||
| Aug | 1.72 | 4.62 | 47.02 | Aug | 2.08 | 8.03 | 194.29 | ||
| Sep | 1.89 | 4.47 | 49.04 | Sep | 2.28 | 7.82 | 200.34 | ||
| Oct | 2.34 | 4.06 | 46.36 | Oct | 2.83 | 7.25 | 191.74 | ||
| Nov | 1.68 | 3.79 | 36.89 | Nov | 2.03 | 6.87 | 158.32 | ||
| Dec | 1.91 | 4.29 | 60.01 | Dec | 2.29 | 7.57 | 237.29 |

Time variation of Weibull shape factor

Time variation of Weibull shape factor

Time variation of Weibull scale factor

Time variation of Weibull scale factor
7.2 Comparison based on the monthly average wind speed
The monthly average wind speed for all years (2017–2019) at heights of 10 and 70 m were also observed for both numerical methods. For the SDM, the highest and lowest monthly average wind speeds at 10 m were 6.09 and 4.65 m/s in January and November, respectively, while for the GM, at the same height, the highest and lowest average wind speeds were observed as 5.47 and 3.92 m/s (also in January and November, respectively) as shown in Figure 7. The highest and lowest monthly average wind speeds at a height of 70 m were observed using the SDM and were 9.18 and 7.34 m/s, which were both recorded in January and November, respectively, as shown in Figure 8. For the same height of 70 m, using the GM, the observed highest and lowest average wind speeds were 8.41 and 6.37 m/s in January and November, respectively, as shown in Figure 8. For both wind speed heights (10 m and 70), the SDM provided the highest number of average monthly wind speed when compared with the GM, as shown in Figures 7 and 8.

Average monthly wind speed characteristics at a height of 10 m.

Average monthly wind speed characteristics at a height of 70 m.
7.3 Comparison based on the actual wind speed data
The Weibull distribution plots of the wind speeds at a height of 10 m are presented in Figure 9a–c. The histogram plots show the values of the actual wind speed data, and are illustrated in the figures for comparison of the obtained results of the SDM and the GM. The observed results show that the SDM provides a satisfactory result for all years (2017–2019), while the GM provides weak results for all years (2017–2019).

Comparison of Weibull distribution of actual wind speed data and the two numerical methods. (a) year 2017, (b) year 2018, and (c) year 2019.
7.4 Comparison based on the statistical tests
Wind-speed frequency evaluation for the numerical methods was made using three different statistical tests, namely, the RMSE, Chi-square error (χ
2), and the determination of coefficient
Statistical test for yearly performance evaluation using two Weibull numerical methods at a height of 10 m
| Year | Method | RMSE | χ 2 |
|
|---|---|---|---|---|
| 2017 | SDM | 0.0322 | 0.0105 | 0.9999 |
| GM | 0.0009 | 0.0098 | 0.9995 | |
| 2018 | SDM | 0.0271 | 0.0075 | 0.9999 |
| GM | 0.0026 | 0.0279 | 0.9987 | |
| 2019 | SDM | 0.0313 | 0.0099 | 0.9999 |
| GM | 0.0012 | 0.0125 | 0.9994 |
7.5 Performance of wind turbine based on the annual power output and capacity factor (
C
f
)
There were five commercial wind turbine models that ranged in size from small to medium and had a rated power range between 50 and 1,000 kW that were selected and simulated to determine their performance at the study location. The selected commercial wind turbines were: the Polaris P15-50, Bonus 300 kW/33, Polaris P50-500, Bonus 1 MW/54, and WWD-1-60 and their performances are shown in Table 4.
The selected wind turbine performance
| Polaris P15-50 | Bonus 300 kW/33 | Polaris P50-500 | Bonus 1 MW/54 | WWD-1-60 | |
|---|---|---|---|---|---|
| Rated power (kW) | 50 | 300 | 500 | 1,000 | 1,000 |
| Hub height (m) | 30 | 30 | 50 | 45 | 70 |
| Rotor Diameter (m) | 15.2 | 33.4 | 50 | 54 | 60 |
| Cut-in wind speed (m/s) | 2.5 | 3 | 2.5 | 3 | 3.6 |
| Rated wind speed (m/s) | 10 | 14 | 12 | 14 | 12.5 |
| Cut-out wind speed (m/s) | 25 | 25 | 25 | 25 | 25 |
The average annual energy output, based on the SDM for all commercial wind turbine models, showed that the Bonus 1 MW/54 recorded the maximum value when compared with the other four commercial wind turbine models, after recording an average annual power outputs of 331.594, 359.1664, and 352.7686 MW h/year, in 2017, 2018, and 2019, respectively, as shown in Figure 10. Using the Bonus 1 MW/54 commercial wind turbine, the month of October recorded the highest average monthly energy output of 362.808 MW h/month and the month of May recorded the lowest average monthly energy output of 296.459 MW h/month, based on the SDM, as shown in Figure 11.

Average annual power output.

Average monthly power output.
The capacity factor based on the SDM showed that the Polaris P50-500 recorded the highest maximum values of 41.14, 43.84, and 43.25% in 2017, 2018, and 2019, respectively, as shown in Figure 12. Furthermore, the Polaris P50-500 commercial wind turbine recorded the highest average monthly capacity factor of 44.25% in the month of October, and May recorded the lowest average monthly capacity factor of 37.63%, based on the SDM, as shown in Figure 13.
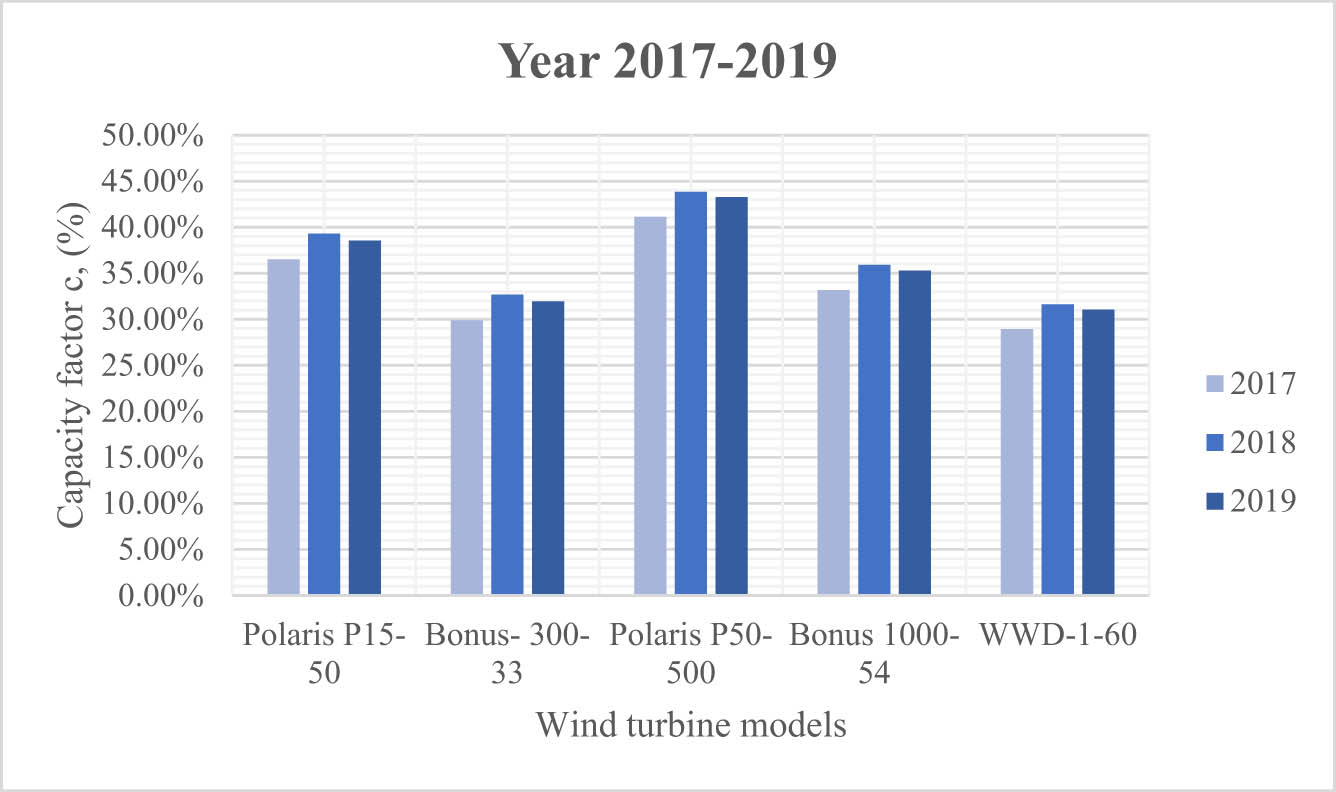
Yearly capacity factor.

Average monthly capacity factor based on years.
8 Conclusion
In this study, the investigation of the yearly characteristics of wind speed and potential wind energy using the Weibull distribution method for a coastline of the Dar es Salaam region was performed. In addition, analysis and efficient comparison between the SDM and the GM were determined. The results obtained from this study showed that the SDM gave a higher value than the GM in the Weibull distribution parameter analysis. Furthermore, a recommended suitable commercial wind turbine was obtained using the SDM. The recommended commercial wind turbine for wind power production was obtained after a simulated performance using five different commercial wind turbines (Polaris P15-50, Bonus 300 kW/33, Polaris P50-500, Bonus 1 MW/54, and WWD-1-60), in which the Polaris P50-500 stands out as the recommended commercial wind turbine, which is suitable for the study area due to its highest value of the capacity factor, for all 3 years.
-
Conflict of interest: Authors state no conflict of interest.
References
[1] Potić I, Joksimović T, Milinčić U, Kićović D, Milinčić M. Wind energy potential for the electricity production – Knjaževac Municipality case study (Serbia). Energy Strateg Rev. 2021;33:100589.10.1016/j.esr.2020.100589Search in Google Scholar
[2] Gönül Ö, Duman AC, Deveci K, Güler Ö. An assessment of wind energy status, incentive mechanisms and market in Turkey. Eng Sci Technol Int J. 2021;24(6):1383–95.10.1016/j.jestch.2021.03.016Search in Google Scholar
[3] Tasneem Z, Al Noman A, Das SK, Saha DK, Islam MR, Ali MF, et al. An analytical review on the evaluation of wind resource and wind turbine for urban application: prospect and challenges. Dev Built Env. 2020;4(October):100033.10.1016/j.dibe.2020.100033Search in Google Scholar
[4] Gnatowska R, Moryń-Kucharczyk E. Current status of wind energy policy in Poland. Renew Energy. 2019;135:232–7.10.1016/j.renene.2018.12.015Search in Google Scholar
[5] Mahmoodi K, Ghassemi H, Razminia A. Wind energy potential assessment in the Persian Gulf: a spatial and temporal analysis. Ocean Eng. 2020;216(June):107674.10.1016/j.oceaneng.2020.107674Search in Google Scholar
[6] Colmenar-Santos A, Perera-Perez J, Borge-Diez D, Depalacio-Rodríguez C. Offshore wind energy: a review of the current status, challenges and future development in Spain. Renew Sustain Energy Rev. 2016;64:1–18.10.1016/j.rser.2016.05.087Search in Google Scholar
[7] Sharma A, Srivastava J, Kar SK, Kumar A. Wind energy status in India: a short review. Renew Sustain Energy Rev. 2012;16(2):1157–64.10.1016/j.rser.2011.11.018Search in Google Scholar
[8] Caban J, Gardyński L. Evacuation systems of screw-type water turbines in small hydropower plant. Adv Sci Technol – Res J. 2013;7(19):20–6.10.5604/20804075.1062334Search in Google Scholar
[9] Kantová NČ, Sładek S, Jandačka J, Čaja A, Nosek R. Simulation of biomass combustion with modified flue gas tract. Appl Sci. 2021;11(3):1–11.10.3390/app11031278Search in Google Scholar
[10] Lebbihiat N, Atia A, Arıcı M, Meneceur N. Geothermal energy use in Algeria: a review on the current status compared to the worldwide, utilization opportunities and countermeasures. J Clean Prod. 2021;302:126950.10.1016/j.jclepro.2021.126950Search in Google Scholar
[11] Kilikevičienė K, Matijošius J, Kilikevičius A, Jurevičius M, Makarskas V, Caban J, et al. Research of the energy losses of photovoltaic (PV) modules after hail simulation using a newly-created testbed. Energies. 2019;12(23):4537.10.3390/en12234537Search in Google Scholar
[12] Aukitino T, Khan MGM, Ahmed MR. Wind energy resource assessment for Kiribati with a comparison of different methods of determining Weibull parameters. Energy Convers Manag. 2017;151:641–60.10.1016/j.enconman.2017.09.027Search in Google Scholar
[13] Carvajal-Romo G, Valderrama-Mendoza M, Rodríguez-Urrego D, Rodríguez-Urrego L. Assessment of solar and wind energy potential in La Guajira, Colombia: Current statusand future prospects. Sustain Energy Technol Assess. 2019;36(February):100531.10.1016/j.seta.2019.100531Search in Google Scholar
[14] Duc Luong N. A critical review on potential and current status of wind energy in Vietnam. Renew Sustain Energy Rev. 2015;43:440–8.10.1016/j.rser.2014.11.060Search in Google Scholar
[15] Deep S, Sarkar A, Ghawat M, Rajak MK. Estimation of the wind energy potential for coastal locations in India using the Weibull model. Renew Energy. 2020;161:319–39.10.1016/j.renene.2020.07.054Search in Google Scholar
[16] Guarienti JA, Kaufmann Almeida A, Menegati Neto A, de Oliveira Ferreira AR, Ottonelli JP, Kaufmann de Almeida I. Performance analysis of numerical methods for determining Weibull distribution parameters applied to wind speed in Mato Grosso do SulBrazil. Sustain Energy Technol Assess. January, 2020;42:100854.10.1016/j.seta.2020.100854Search in Google Scholar
[17] Kazimierczuk AH. Wind energy in Kenya: a status and policy framework review. Renew Sustain Energy Rev. 2019;107:434–45.10.1016/j.rser.2018.12.061Search in Google Scholar
[18] Chingulpitak S, Wongwises S. Critical review of the current status of wind energy in Thailand. Renew Sustain Energy Rev. 2014;31:312–8.10.1016/j.rser.2013.11.038Search in Google Scholar
[19] Khare V, Nema S, Baredar P. Status of solar wind renewable energy in India. Renew Sustain Energy Rev. 2013;27:1–10.10.1016/j.rser.2013.06.018Search in Google Scholar
[20] Oh KY, Nam W, Ryu MS, Kim JY, Epureanu BI. A review of foundations of offshore wind energy convertors: current status and future perspectives. Renew Sustain Energy Rev. 2018;88(February):16–36.10.1016/j.rser.2018.02.005Search in Google Scholar
[21] Güler Ö. Wind energy status in electrical energy production of Turkey. Renew Sustain Energy Rev. 2009;13(2):473–8.10.1016/j.rser.2007.03.015Search in Google Scholar
[22] Pishgar-Komleh SH, Keyhani A, Sefeedpari P. Wind speed and power density analysis based on Weibull and Rayleigh distributions (a case study: Firouzkooh county of Iran). Renew Sustain Energy Rev. 2015;42:313–22.10.1016/j.rser.2014.10.028Search in Google Scholar
[23] Safari B, Gasore J. A statistical investigation of wind characteristics and wind energy potential based on the Weibull and Rayleigh models in Rwanda. Renew Energy. 2010;35(12):2874–80.10.1016/j.renene.2010.04.032Search in Google Scholar
[24] Ali S, Lee SM, Jang CM. Statistical analysis of wind characteristics using Weibull and Rayleigh distributions in Deokjeok-do Island – Incheon, South Korea. Renew Energy. 2018;123:652–63.10.1016/j.renene.2018.02.087Search in Google Scholar
[25] Bidaoui H, El Abbassi I, El Bouardi A, Darcherif A. Wind speed data analysis using Weibull and Rayleigh distribution functions, case study: five cities Northern Morocco. Procedia Manuf. 2019;32:786–93.10.1016/j.promfg.2019.02.286Search in Google Scholar
[26] Azad K, Rasul M, Halder P, Sutariya J. Assessment of wind energy prospect by weibull distribution for prospective wind sites in Australia. Energy Procedia. 2019;160(2018):348–55.10.1016/j.egypro.2019.02.167Search in Google Scholar
[27] Katinas V, Marčiukaitis M, Gecevičius G, Markevičius A. Statistical analysis of wind characteristics based on Weibull methods for estimation of power generation in Lithuania. Renew Energy. 2017;113:190–201.10.1016/j.renene.2017.05.071Search in Google Scholar
[28] Azad AK, Rasul MG, Islam R, Shishir IR. Analysis of wind energy prospect for power generation by three Weibull distribution methods. Energy Procedia. 2015;75:722–7.10.1016/j.egypro.2015.07.499Search in Google Scholar
[29] Ouahabi MH, Elkhachine H, Benabdelouahab F, Khamlichi A. Comparative study of five different methods of adjustment by the Weibull model to determine the most accurate method of analyzing annual variations of wind energy in Tetouan – Morocco. Procedia Manuf. 2020;46(2019):698–707.10.1016/j.promfg.2020.03.099Search in Google Scholar
[30] IRENA. Renewables Readiness Assessment in the United Republic of Tanzania; 2017.Search in Google Scholar
[31] REPP. Project Summary; 2020. p. 426.Search in Google Scholar
[32] Ndetto EL, Matzarakis A. Basic analysis of climate and urban bioclimate of Dar es Salaam, Tanzania. Theor Appl Climatol. 2013;114(1–2):213–26.10.1007/s00704-012-0828-2Search in Google Scholar
[33] Arslan T, Bulut YM, Altin Yavuz A. Comparative study of numerical methods for determining Weibull parameters for wind energy potential. Renew Sustain Energy Rev. 2014;40:820–5.10.1016/j.rser.2014.08.009Search in Google Scholar
[34] Werapun W, Tirawanichakul Y, Waewsak J. Comparative study of five methods to estimate Weibull parameters for wind speed on Phangan Island, Thailand. Energy Procedia. 2015;9:976–81.10.1016/j.egypro.2015.11.596Search in Google Scholar
[35] Celik AN. Weibull representative compressed wind speed data for energy and performance calculations of wind energy systems. Energy Convers Manag. 2003;44(19):3057–72.10.1016/S0196-8904(03)00075-XSearch in Google Scholar
[36] Lee JK, Lee KH, Il Kim S, Yook D, Ahn S. Weibull parameter calculation and estimation of wind speeds for the return period: a case study in the Kori and Wolsong NPP areas. Ann Nucl Energy. 2017;108:406–12.10.1016/j.anucene.2017.04.040Search in Google Scholar
[37] Justus CG, Hargraves WR, Mikhail A, Graber D. Method of estimating wind speed frequency distributions. J Appl Meteorol. 1978 Mar;17(3):350–3.10.1175/1520-0450(1978)017<0350:MFEWSF>2.0.CO;2Search in Google Scholar
[38] Mohammadi K, Alavi O, Mostafaeipour A, Goudarzi N, Jalilvand M. Assessing different parameters estimation methods of Weibull distribution to compute wind power density. Energy Convers Manag. 2016;108:322–35.10.1016/j.enconman.2015.11.015Search in Google Scholar
[39] Islam MR, Saidur R, Rahim NA. Assessment of wind energy potentiality at Kudat and Labuan, Malaysia using Weibull distribution function. Energy. 2011;36(2):985–92.10.1016/j.energy.2010.12.011Search in Google Scholar
[40] Wang L, Yuan J, Cholette ME, Fu Y, Zhou Y, Tan AC. Comparative study of discretization method and Monte Carlo method for wind farm layout optimization under Weibull distribution. J Wind Eng Ind Aerodyn. 2018;180(May):148–55.10.1016/j.jweia.2018.07.021Search in Google Scholar
[41] Soulouknga MH, Doka SY, Revanna N, Djongyang N, Kofane TC. Analysis of wind speed data and wind energy potential in Faya-Largeau, Chad, using Weibull distribution. Renew Energy. 2018;121:1–8.10.1016/j.renene.2018.01.002Search in Google Scholar
[42] Mostafaeipour A, Jadidi M, Mohammadi K, Sedaghat A. An analysis of wind energy potential and economic evaluation in Zahedan, Iran. Renew Sustain Energy Rev. 2014;30:641–50.10.1016/j.rser.2013.11.016Search in Google Scholar
[43] Mahmood FH, Resen AK, Khamees AB. Wind characteristic analysis based on Weibull distribution of Al-Salman site, Iraq. Energy Rep. 2020;6(September):79–87.10.1016/j.egyr.2019.10.021Search in Google Scholar
[44] Ouahabi MH, Elkhachine H, Benabdelouahab F, Khamlichi A. Comparative study of five different methods of adjustment by the Weibull model to determine the most accurate method of analyzing annual variations of wind energy in Tetouan – Morocco. Procedia Manuf. 2020;46(2019):698–707.10.1016/j.promfg.2020.03.099Search in Google Scholar
[45] Salah MM, Abo-khalil AG, Praveen RP. Wind speed characteristics and energy potential for selected sites in Saudi Arabia. J King Saud Univ – Eng Sci. 2019;33(2):1–9.10.1016/j.jksues.2019.12.006Search in Google Scholar
[46] Oyedepo SO, Adaramola MS, Paul SS. Analysis of wind speed data and wind energy potential in three selected locations in South-East Nigeria. Int J Energy Env Eng. 2012;3(1):1–11.10.1201/b18529-3Search in Google Scholar
[47] Mahmood FH, Resen AK, Khamees AB. Wind characteristic analysis based on Weibull distribution of Al-Salman site, Iraq. Energy Rep. 2020;6(September 2019):79–87.10.1016/j.egyr.2019.10.021Search in Google Scholar
[48] Costa Rocha PA, de Sousa RC, de Andrade CF, da Silva MEV. Comparison of seven numerical methods for determining Weibull parameters for wind energy generation in the northeast region of Brazil. Appl Energy. 2012;89(1):395–400.10.1016/j.apenergy.2011.08.003Search in Google Scholar
[49] Saleh H, Abou El-Azm Aly A, Abdel-Hady S. Assessment of different methods used to estimate Weibull distribution parameters for wind speed in Zafarana wind farm, Suez Gulf, Egypt. Energy. 2012;44(1):710–9.10.1016/j.energy.2012.05.021Search in Google Scholar
[50] Kapen PT, Gouajio MJ, Yemélé D. Analysis and efficient comparison of ten numerical methods in estimating Weibull parameters for wind energy potential: application to the city of Bafoussam, Cameroon. Renew Energy. 2020;159:1188–98.10.1016/j.renene.2020.05.185Search in Google Scholar
[51] Khalid Saeed M, Salam A, Rehman AU, Abid Saeed M. Comparison of six different methods of Weibull distribution for wind power assessment: a case study for a site in the Northern region of Pakistan. Sustain Energy Technol Assess. 2019;36:100541.10.1016/j.seta.2019.100541Search in Google Scholar
© 2021 Enock Michael et al., published by De Gruyter
This work is licensed under the Creative Commons Attribution 4.0 International License.
Articles in the same Issue
- Regular Articles
- Electrochemical studies of the synergistic combination effect of thymus mastichina and illicium verum essential oil extracts on the corrosion inhibition of low carbon steel in dilute acid solution
- Adoption of Business Intelligence to Support Cost Accounting Based Financial Systems — Case Study of XYZ Company
- Techno-Economic Feasibility Analysis of a Hybrid Renewable Energy Supply Options for University Buildings in Saudi Arabia
- Optimized design of a semimetal gasket operating in flange-bolted joints
- Behavior of non-reinforced and reinforced green mortar with fibers
- Field measurement of contact forces on rollers for a large diameter pipe conveyor
- Development of Smartphone-Controlled Hand and Arm Exoskeleton for Persons with Disability
- Investigation of saturation flow rate using video camera at signalized intersections in Jordan
- The features of Ni2MnIn polycrystalline Heusler alloy thin films formation by pulsed laser deposition
- Selection of a workpiece clamping system for computer-aided subtractive manufacturing of geometrically complex medical models
- Development of Solar-Powered Water Pump with 3D Printed Impeller
- Identifying Innovative Reliable Criteria Governing the Selection of Infrastructures Construction Project Delivery Systems
- Kinetics of Carbothermal Reduction Process of Different Size Phosphate Rocks
- Plastic forming processes of transverse non-homogeneous composite metallic sheets
- Accelerated aging of WPCs Based on Polypropylene and Birch plywood Sanding Dust
- Effect of water flow and depth on fatigue crack growth rate of underwater wet welded low carbon steel SS400
- Non-invasive attempts to extinguish flames with the use of high-power acoustic extinguisher
- Filament wound composite fatigue mechanisms investigated with full field DIC strain monitoring
- Structural Timber In Compartment Fires – The Timber Charring and Heat Storage Model
- Technical and economic aspects of starting a selected power unit at low ambient temperatures
- Car braking effectiveness after adaptation for drivers with motor dysfunctions
- Adaptation to driver-assistance systems depending on experience
- A SIMULINK implementation of a vector shift relay with distributed synchronous generator for engineering classes
- Evaluation of measurement uncertainty in a static tensile test
- Errors in documenting the subsoil and their impact on the investment implementation: Case study
- Comparison between two calculation methods for designing a stand-alone PV system according to Mosul city basemap
- Reduction of transport-related air pollution. A case study based on the impact of the COVID-19 pandemic on the level of NOx emissions in the city of Krakow
- Driver intervention performance assessment as a key aspect of L3–L4 automated vehicles deployment
- A new method for solving quadratic fractional programming problem in neutrosophic environment
- Effect of fish scales on fabrication of polyester composite material reinforcements
- Impact of the operation of LNG trucks on the environment
- The effectiveness of the AEB system in the context of the safety of vulnerable road users
- Errors in controlling cars cause tragic accidents involving motorcyclists
- Deformation of designed steel plates: An optimisation of the side hull structure using the finite element approach
- Thermal-strength analysis of a cross-flow heat exchanger and its design improvement
- Effect of thermal collector configuration on the photovoltaic heat transfer performance with 3D CFD modeling
- Experimental identification of the subjective reception of external stimuli during wheelchair driving
- Failure analysis of motorcycle shock breakers
- Experimental analysis of nonlinear characteristics of absorbers with wire rope isolators
- Experimental tests of the antiresonance vibratory mill of a sectional movement trajectory
- Experimental and theoretical investigation of CVT rubber belt vibrations
- Is the cubic parabola really the best railway transition curve?
- Transport properties of the new vibratory conveyor at operations in the resonance zone
- Assessment of resistance to permanent deformations of asphalt mixes of low air void content
- COVID-19 lockdown impact on CERN seismic station ambient noise levels
- Review Articles
- FMEA method in operational reliability of forest harvesters
- Examination of preferences in the field of mobility of the city of Pila in terms of services provided by the Municipal Transport Company in Pila
- Enhancement stability and color fastness of natural dye: A review
- Special Issue: ICE-SEAM 2019 - Part II
- Lane Departure Warning Estimation Using Yaw Acceleration
- Analysis of EMG Signals during Stance and Swing Phases for Controlling Magnetorheological Brake applications
- Sensor Number Optimization Using Neural Network for Ankle Foot Orthosis Equipped with Magnetorheological Brake
- Special Issue: Recent Advances in Civil Engineering - Part II
- Comparison of STM’s reliability system on the example of selected element
- Technical analysis of the renovation works of the wooden palace floors
- Special Issue: TRANSPORT 2020
- Simulation assessment of the half-power bandwidth method in testing shock absorbers
- Predictive analysis of the impact of the time of day on road accidents in Poland
- User’s determination of a proper method for quantifying fuel consumption of a passenger car with compression ignition engine in specific operation conditions
- Analysis and assessment of defectiveness of regulations for the yellow signal at the intersection
- Streamlining possibility of transport-supply logistics when using chosen Operations Research techniques
- Permissible distance – safety system of vehicles in use
- Study of the population in terms of knowledge about the distance between vehicles in motion
- UAVs in rail damage image diagnostics supported by deep-learning networks
- Exhaust emissions of buses LNG and Diesel in RDE tests
- Measurements of urban traffic parameters before and after road reconstruction
- The use of deep recurrent neural networks to predict performance of photovoltaic system for charging electric vehicles
- Analysis of dangers in the operation of city buses at the intersections
- Psychological factors of the transfer of control in an automated vehicle
- Testing and evaluation of cold-start emissions from a gasoline engine in RDE test at two different ambient temperatures
- Age and experience in driving a vehicle and psychomotor skills in the context of automation
- Consumption of gasoline in vehicles equipped with an LPG retrofit system in real driving conditions
- Laboratory studies of the influence of the working position of the passenger vehicle air suspension on the vibration comfort of children transported in the child restraint system
- Route optimization for city cleaning vehicle
- Efficiency of electric vehicle interior heating systems at low ambient temperatures
- Model-based imputation of sound level data at thoroughfare using computational intelligence
- Research on the combustion process in the Fiat 1.3 Multijet engine fueled with rapeseed methyl esters
- Overview of the method and state of hydrogenization of road transport in the world and the resulting development prospects in Poland
- Tribological characteristics of polymer materials used for slide bearings
- Car reliability analysis based on periodic technical tests
- Special Issue: Terotechnology 2019 - Part II
- DOE Application for Analysis of Tribological Properties of the Al2O3/IF-WS2 Surface Layers
- The effect of the impurities spaces on the quality of structural steel working at variable loads
- Prediction of the parameters and the hot open die elongation forging process on an 80 MN hydraulic press
- Special Issue: AEVEC 2020
- Vocational Student's Attitude and Response Towards Experiential Learning in Mechanical Engineering
- Virtual Laboratory to Support a Practical Learning of Micro Power Generation in Indonesian Vocational High Schools
- The impacts of mediating the work environment on the mode choice in work trips
- Utilization of K-nearest neighbor algorithm for classification of white blood cells in AML M4, M5, and M7
- Car braking effectiveness after adaptation for drivers with motor dysfunctions
- Case study: Vocational student’s knowledge and awareness level toward renewable energy in Indonesia
- Contribution of collaborative skill toward construction drawing skill for developing vocational course
- Special Issue: Annual Engineering and Vocational Education Conference - Part II
- Vocational teachers’ perspective toward Technological Pedagogical Vocational Knowledge
- Special Issue: ICIMECE 2020 - Part I
- Profile of system and product certification as quality infrastructure in Indonesia
- Prediction Model of Magnetorheological (MR) Fluid Damper Hysteresis Loop using Extreme Learning Machine Algorithm
- A review on the fused deposition modeling (FDM) 3D printing: Filament processing, materials, and printing parameters
- Facile rheological route method for LiFePO4/C cathode material production
- Mosque design strategy for energy and water saving
- Epoxy resins thermosetting for mechanical engineering
- Estimating the potential of wind energy resources using Weibull parameters: A case study of the coastline region of Dar es Salaam, Tanzania
- Special Issue: CIRMARE 2020
- New trends in visual inspection of buildings and structures: Study for the use of drones
- Special Issue: ISERT 2021
- Alleviate the contending issues in network operating system courses: Psychomotor and troubleshooting skill development with Raspberry Pi
- Special Issue: Actual Trends in Logistics and Industrial Engineering - Part II
- The Physical Internet: A means towards achieving global logistics sustainability
- Special Issue: Modern Scientific Problems in Civil Engineering - Part I
- Construction work cost and duration analysis with the use of agent-based modelling and simulation
- Corrosion rate measurement for steel sheets of a fuel tank shell being in service
- The influence of external environment on workers on scaffolding illustrated by UTCI
- Allocation of risk factors for geodetic tasks in construction schedules
- Pedestrian fatality risk as a function of tram impact speed
- Technological and organizational problems in the construction of the radiation shielding concrete and suggestions to solve: A case study
- Finite element analysis of train speed effect on dynamic response of steel bridge
- New approach to analysis of railway track dynamics – Rail head vibrations
- Special Issue: Trends in Logistics and Production for the 21st Century - Part I
- Design of production lines and logistic flows in production
- The planning process of transport tasks for autonomous vans
- Modeling of the two shuttle box system within the internal logistics system using simulation software
- Implementation of the logistics train in the intralogistics system: A case study
- Assessment of investment in electric buses: A case study of a public transport company
- Assessment of a robot base production using CAM programming for the FANUC control system
- Proposal for the flow of material and adjustments to the storage system of an external service provider
- The use of numerical analysis of the injection process to select the material for the injection molding
- Economic aspect of combined transport
- Solution of a production process with the application of simulation: A case study
- Speedometer reliability in regard to road traffic sustainability
- Design and construction of a scanning stand for the PU mini-acoustic sensor
- Utilization of intelligent vehicle units for train set dispatching
- Special Issue: ICRTEEC - 2021 - Part I
- LVRT enhancement of DFIG-driven wind system using feed-forward neuro-sliding mode control
- Special Issue: Automation in Finland 2021 - Part I
- Prediction of future paths of mobile objects using path library
- Model predictive control for a multiple injection combustion model
- Model-based on-board post-injection control development for marine diesel engine
- Intelligent temporal analysis of coronavirus statistical data