
Examination of preferences in the field of mobility of the city of Pila in terms of services provided by the Municipal Transport Company in Pila
-
Piotr Gorzelanczyk


Abstract
The aim of the article is to learn about the mobility preferences of the inhabitants of the city of Pila in terms of services provided by the Municipal Transport Company in Pila (MTC). The research aims to improve the quality of services provided by MTC. The article characterizes the concept of urban transport and mobility, and then proposes a mobility model that takes into account the preferences of residents when choosing a means of transport.
This model was analyzed in the form of a questionnaire survey. In which, inter alia, o user data (sex, age, place of residence), information on the mobility structure, travel organization, selection criteria of the analyzed means of transport, i.e. public transport (e.g. cost, time, comfort, safety, punctuality and frequency of travel). Based on the research, it can be concluded that the inhabitants of Pila choose public transport because they do not have a driving license, they download information about the timetable from the Internet, buses in Pila are punctual, comfortable, safe, and drivers and ticket inspectors are usually polite, buses should run more often, they are incorrectly synchronized, a new bus line should be open and the ticket machine is easy to use. In addition, the residents of Pila do not know what the Dynamic Passenger Information System is, but they would like to use the mobile application showing the actual time of arrival of the bus.
1 Introduction
The city is a highly complex system consisting of subsystems that perform different tasks, overlapping and comple menting each other. Their coordination is particularly decisive so that the failure of one does not have a negative impact on other tasks. The position of the urban transport subsystem is a priority because a properly managed and organized system is an important condition for the proper development and functioning of cities. It is public transport that unites all available areas of city utility.
The progress of urbanization processes, the continuous increase in the participation of the urban population, the modeling of large-scale urban complexes, which are of major importance for social and economic life, outlines the increasing requirements for transport systems. The efficiency of urban transport is transforming into a growing challenge as a consequence of the creation of agglomerations, the expansion of urban areas, development intensity and the increase in the number of inhabitants. It is associated with limited areas that could serve as a transport target. Today’s expectations of mobility are mainly associated with ensuring ease of movement, traffic safety, the principle of sustainable development and environmental protection. One of the requirements to create such a logistics system is to promote public transport through activities that increase the value of services in the context of comparison with individual transport.
The concept of urban public transport means public transport, which is organized by the municipal government under the Act of 16 December 2010 on public collective transport [1]. This transport is based on the provision of mass-available transport services, and its task is to meet the social demand for movement within the city. Due to its functions, it is the most important factor determining not only the economic development of the urbanized area, but first and foremost the improvement of the quality of life of the inhabitants. The concept of the value of services for a public transport client should be understood as the assessed and felt level of satisfaction with utility, which mainly results from the costs incurred, which should be competitive for other relocation alternatives [2, 3].
2 Characteristics of mobility and urban transport
In economically developed countries, the vast majority of the population lives in cities. The conditioning of the correct functionality of most cities, starting from those inhabited by tens of thousands of people, is the efficient functioning of a properly managed and organized urban transport system, which includes collective and individual transport. Both of these systems should be treated complementarily and substitution with the determination of the rational scope of their activities.
Collective transport plays a special role in the urban transport system, both from an economic and social point of view. It constitutes a specific field of management, characterized by a specific way of satisfying transport needs and exploitation in a spatially limited urbanized area, based on one system of means of transport belonging to various branches of this field.
Pursuant to the Act on Public Collective Transport and Road Transport, in relation to the definition of the concept of urban transport, various terms are used, such as: collective transport, municipal transport, municipal public transport, municipal transport, local public transport [1, 4]
An important argument in favor of public transport is the environmental friendliness of means of transport. Currently, an increasing group of people choose public communication, if thus contributing to greater environmental protection. The European Union introduces increasingly stringent emission limits in the form of EURO series standards. The EURO 6 standard has been in force since 2014, which aims to reduce the carcinogenic emissions of nitrogen oxides and introduces an obligation to have a system diagnosis of vehicle systems. There is also an EEV (Enhanced Environmentally friendly Vehicle) standard, introduced since 1999. A technological “race” is observed between propulsion unit manufacturers in reducing emissions of harmful substances. Alternative replacements for internal combustion engines are [5, 6, 7]:
CNG: compressed natural gas,
hydrogen drive,
hybrid drive: by combining an electric and internal combustion engine.
Mobility is defined differently by the authors of the publication. Szołtysek treats [8] mobility as a daily, routine movement and activities resulting from the reorganization of his personal life, which may include a change of residence or workplace. We can identify her with the movement and all activity of people carried out by means of transport outside their place of residence [9, 10]. Whereas Menes [11], presents mobility as mobility associated with the daily movements of residents, usually to work or school.
According to the Treaty on the Functioning of the European Union [12] and the resulting his transport policy, mobility understood as an element of human activity depends on the person carrying out the journey, the person managing the infrastructure and other users of the transport system related to this mobility [13, 14]. The concept of sustainable development is closely related to the issue of mobility, including economic, environmental and social issues [15, 16, 17, 18].
Sustainable development, as a multidimensional problem, is currently of interest to economists, as well as, among others environmentalists who, through their activities, try to operationalize this issue mainly for the needs of their own fields. Environmental protection should play an increasingly important role in the development of transport.
According to the author of the publication, mobility is the daily routine movement of residents related to their existence. And this wording was adopted later in the article.
3 Characteristics of the Municipal Transport Company in Pila
Pila is a city in northwestern Poland, in the Wielkopolska Province, Pilski County. Most of them are forests, parks and lakes. It belongs to a city with a well-developed technical infrastructure. Pila is located near national roads no. 10 and 11 and provincial roads no. 179, 180 and 188. It crosses the road and railroads that lead from the coast to the south, to Poznań, Gorzów and even Germany, and from Szczecin and Świnoujście to Bydgoszcz, Toruń and Warsaw. The location of Pila against the background of Poland is shown in Figure 1 [19].
![Figure 1 Location of the city of Pila on the map of Poland [20]](/document/doi/10.1515/eng-2021-0020/asset/graphic/j_eng-2021-0020_fig_001.jpg)
Location of the city of Pila on the map of Poland [20]
The history of Pila urban transport dates back to the 1920s, when the first 3 lines operated. During World War II, the city was so damaged that it was not reopened until July 1, 1957. By the decision of the Provincial National Council in Poznań, the Municipal Transport Plant was established at the Municipal Enterprise of Economy in Pila. Initially, it was located at 10 Kujawska Street. Currently, it is located at Łączna 4. On December 29, 2000, Municipal Transport Company (MTC) as officially established in the transformation results.
On January 30, 2019, MTC rolling stock in Pila had 47 buses. There are three main brands that MTC purchases the most. It is: Solaris, Neoplan and Mercedes. The table below presents the entire fleet of MTC in Pila as at 30.01.2019 [21].
MTC is the only carrier in the city of Pila that specializes in public transport. No other transport company has ever tried to appear on the Pila market, which would result in competitiveness on the domestic market. Over the past few years, many technical innovations have been introduced into Pila communication, including ticket vending machines, Pilska City Card or currently implemented Dynamic Passenger Information System, which, among others will inform passengers at stops about the actual arrival time of the bus. This is a great step towards the development of public transport in Pila and will make it easier for many passengers to move around Pila. Pila public transport is developing along with technological progress: older buses are replaced with new models, including hybrid and electric ones, which will take care of our environment. At the same time, the bus depot has been modernized and many bus bays are being rebuilt. All these activities are aimed at improving the level of services provided by MTC
The study proposed changes that could occur in Pila MTC based on the opinion and level of customer satisfaction with this company obtained in surveys. In publications [22, 23], the authors analyzed the costs of maintaining the MTC transport fleet and proposed their optimization.
4 Generalized mobility model
Taking into account the objectives of transport activities and the preferences of residents, we can assume that we can define the mobility model of city users using the following elements [24]:
Rolling stock MTC [21]
| Bus type | Adapted to people with disabilities | Date of production | Date of purchase | The number of the bus | The number of items |
|---|---|---|---|---|---|
| Jelcz 120M | No | 2000 | 2000 | 363,364, 365 | 3 |
| Mercedes Citaro | Yes | 1998, 2000, 2003, 2004 | 2012, 2013, 2014 | 406-411 | 6 |
| Neoplan N4016 | Yes | 1998 | 1998 | 354, 355, 359 | 3 |
| Neoplan N4411 | Yes | 2002,2003 | 2010 | 396-401 | 6 |
| Solaris Urbino 10 | Yes | 2003, 2011 | 2004, 2011 | 372-374,404 | 4 |
| Solaris Urbino 12 | Yes | 2005-2007, 2009, 2010, 2011, 2016, 2017 | 2005-2007, 2009, 2010, 2011, 2016, 2017 | 377-380, 382-395, 402-403, 412-416 | 25 |
| Solaris Urbino 12 Hybryd | Yes | 2017 | 2017 | 420-425 | 6 |
| The number of all buses The share of buses adapted for the disabled in the fleet The average age of the operated bus fleet |
53 93% 9 years |
||||
user bases - BU,
mobility structures - SM,
choice of means of transport – ST,
a base of characteristics of elements of the mobility structure – BM,
travel arrangements – OP,
residents’ preferences – PM.
Taking into account the above elements of mobility, we can present the mobility model -MM in the form of an equation:
In the above model, the set of users takes the form:
where:
U – is the number of users of the studied mobility. However, the user was described by vector:
where:
p(u) – user gender,
gw(u) – the user’s age group,
mz(u) – user residence.
City user gender: assumed (p (u) = 1) for a woman and (p (u) = 2) for a man, while the set of age group numbers:
determines the age of the user. In this case, it was assumed: gw (u) = 1 - up to 18 years, gw (u) = 2 - 18 ÷ 25 years, gw (u) = 3 - 26 ÷ 35 years, gw (u) = 4 - 36 ÷ 45 years, gw (u) = 5 - 46 ÷ 55 years, gw (u) = 6 - 56 ÷ 65 years, gw (u) = 7 - over 66 years.
where:
GW – determines the number of all age groups surveyed, in this case equal 6.
Then the residents were divided according to their place of residence mz (u). For example (mz (u) = 1) - it specifies a city below 10 thous. residents, (mz (u) = 2) - determines the town of 10 ÷ 50 thousand residents, etc. In this case the formula takes the form:
where:
MZ – determines the number of all residences equal 6.
The next element considered is the user base, which takes the form of the following vector:
The structure of mobility of residents in the model of mobility of city users has been presented in the form of:
where:
PM – is the mobility point,
PT – collection of transport connections.
The places of activity of city users (e.g. place of residence, workplace or school) were taken as the mobility point, i.e. the starting and ending point of travel. These also include intermediate points (e.g. stations, stops, parking lots, etc.) known as intermediate points. Each component included in the residents’ mobility structure contains characteristics specific to transport activities, such as waiting time at the stop, parking cost, etc.
Another of the mobility components discussed is the choice of the means of transport, which we can present in the form:
where:
cp – travel time,
kp – the cost of travel,
kd – travel comfort (in this case the traveler can count on, among others, rest, eating a meal, comfortable seating),
bst – travel safety,
dst – availability of means of transport (we can include here extensive point infrastructure, e.g. bus and railway stations, passenger terminal, number of connections per day),
wb – luggage size,
pst - punctuality of the means of transport,
zi – source of information on the timetable,
opki – assessment of drivers’ work,
opko – evaluation of the controllers’ work,
ck – travel frequency,
sy – synchronization with other means of transport,
ob – ticket machine service,
am – the ability to use the mobile application for timetables.
The last of the considered mobility elements is the base of characteristics of elements of the mobility structure defined in the form:
where:
ZCPM – referred to as the set of characteristics described at mobility points,
ZCPT – referred to as the set of characteristics described on transport connections.
The next of the discussed elements is the organization of the travels of the OP. The model assumes two variants of travel organization:
where:
OP=1 – means a one-step variant,
OP=2 – means the three-stage variant.
A one-stage journey is very rare, only if someone travels on foot. We can describe it in the form of:
where:
pp – is the starting point of the trip,
pk – is the end point of the journey.
Most often, the three-stage journey consists of the following elements: walking, e.g. reaching the stop, public transport, walking to the destination. We can describe this kind of travel in the form of a vector:
where:
n1, n2 – waypoint number.
Taking into account the mobility model of residents together with their preferences, presented in the formula (1.1), research on the preferences of residents began.
5 Study of residents’ preferences
5.1 Purpose and scope of research
The aim of the study is to find out about the mobility preferences of the inhabitants of the city of Pila in terms of services provided by the MTC. The aim of the study is to improve the quality of services provided by MTC. The assessment of mobility preferences of the residents of the city of Pila was conducted using a survey. The main concept of the study was the opinion and suggesting possible changes in the functioning of the company. Several important questions were asked that allowed the most to determine the level of satisfaction with MTC services. The questions were short and did not require complicated answers. The survey was arranged so that it was filled by as many people as possible with the least amount of time.
5.2 Research methodology
The research was conducted in the form of surveys. At the beginning a pilot study was carried out, on the basis of which the question sheet was corrected. Then the survey was conducted at MTC stops and buses to find out the opinions of people using public transport. The survey consisted of 17 closed questions that asked, among others about sex, age. Questions also concerned the satisfaction of transport needs, assessment of public transport. At the end of the study, each of the respondents had the opportunity to propose directions of change.
Research on the mobility of residents of the city of Pila in the aspect of services provided by the MTC was conducted in the period from October to December 2018. in the city of Pila. 408 people living in the city took part in the study. They were people who use the services provided by the MTC in Pila and willingly expressed their opinion about this company or the services they provide.
The study aimed to find out the total level of satisfaction with the services provided by MTC and to implement possible changes in the objectives of eliminating the reservations that bus passengers have. Eager people took part in the study.
5.3 Research object
In the survey group, 408 people included 275 women (67.4%) and 133 men (32.6%). The dominant group (as much as 54.4% of respondents) who took part in the survey are people in the 18 ÷ 25 age range. It is these customers who most often use public transport to reach school, college or other place. This is due to the fact that at this age they are not able to move individual communication. It may also be surprising that over a quarter of respondents
using MTC were aged 26-35. A relatively low percentage of respondents were elderly. This is due to the fact that they did not want to participate in the tests carried out on buses. However, around noon, it can be seen that often this age group most often uses public transport. The results are presented in the Figure 2.
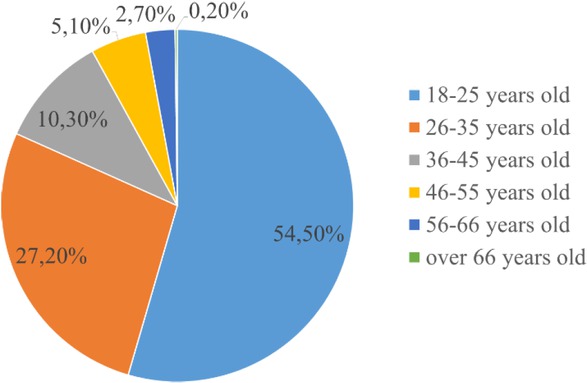
Age of passengers
5.4 Findings
People express a desire to move at a certain time and at a certain distance. This is related to the implementation of specific goals (each has a different purpose of movement). Usually it is commuting to school / work or shopping. The results are presented in Figure 3.
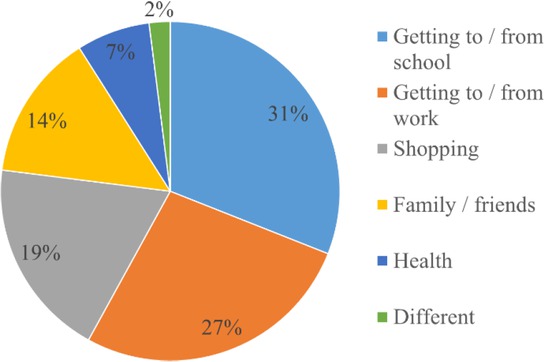
Purpose of the respondents’ journey
The result of the survey showed, among others, how often MTC clients in Pila use communication services and which bus route that satisfies their transport needs is most often used.
The results are quite surprising, as over 1/3 of respondents use MTC services only once a week. It would seem that the largest percentage should be customers who use very often public transport. Thus, it can be seen that customers are people who occasionally use public transport. The results are presented in the Figure 4.
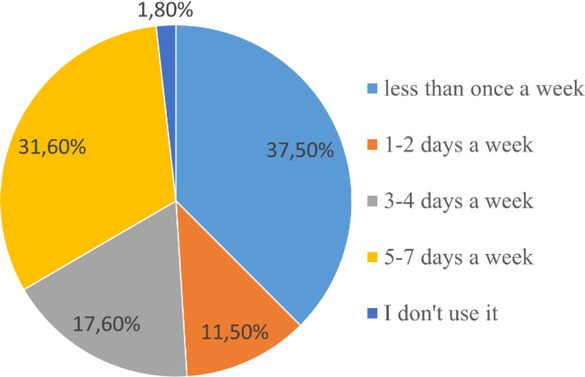
Frequency of using MTC services in Pila
The next question concerned the bus route that most respondents ride. Most often, residents of Pila use lines 1, 3 and 5, because they pass through the entire city along with the center and they connect large residential areas, including with Pila schools. The results are presented in the Figure 5.
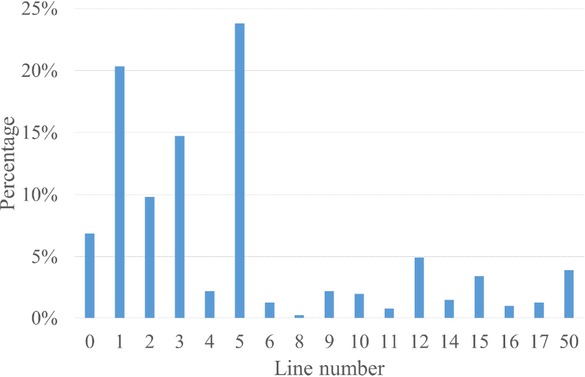
The most popular bus route
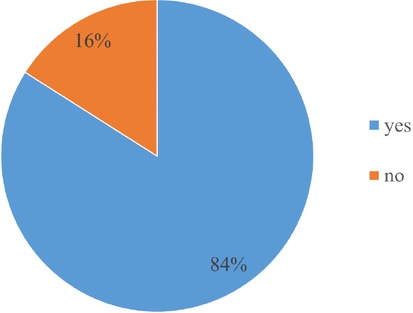
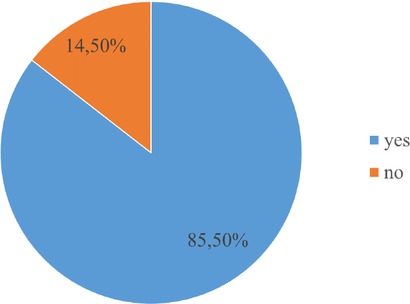
The next question was whether the residents use one or more bus lines to get to their destination. It turned out that 84% of respondents use only one bus line, without changing connections, to reach the selected destination. In most cases, it is a three-stage journey, consisting of the following elements: getting to the stop, journey by public transport, journey on foot to the destination. We can describe it with the vector shown in formula 12. This result is not surprising because Pila is a medium-sized city with
well-organized bus lines. Figure 6 shows the answer to this question.
Changes in public transport
The main reason why the respondents choose MTC is obviously the lack of a car or driving license, students are a large group, besides buying season tickets you can count on big discounts, because the prices of season tickets are more favorable than single tickets, so the price for one the ride is definitely lower. A large share, as much as 30.6%, is another reason. One can only guess that this may be due to e.g. failure of your own vehicle or the need to quickly change place. The results are presented in the Figure 7.
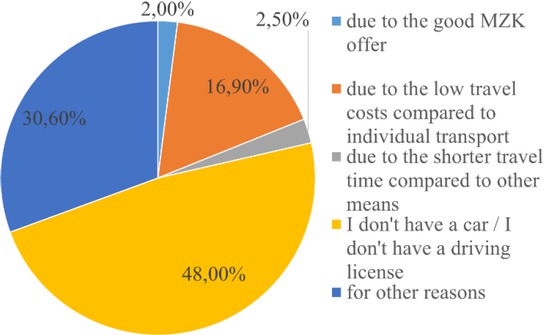
Reason for choosing MTC
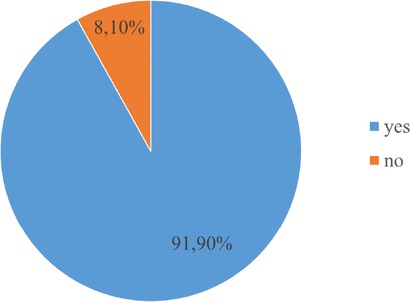
We live in the 21st century, so in the age of the Internet almost 92% of respondents check the bus timetable on the Internet. Occasionally, respondents check it at the bus stop, and the MTC Customer Service Office and newspaper printed timetables are virtually no longer used. The results are presented in the Figure 8.
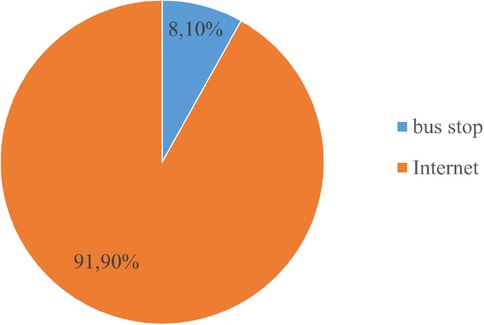
Source of obtaining information about bus timetables
A very important element in the functioning of the company is adapting to the requirements of its customers. To improve the company’s operation, the level of satisfaction with the services provided by MTC and their employees was examined. This will eliminate all errors that occur in everyday situations.
A very large proportion of respondents (64.5%) are satisfied with the punctuality of buses, indicating that they arrive on time. 17.4% said the buses were late. However, with such frequent busses, a margin of error may occur, which is why MTC introduced a time tolerance of +/− 2min in the timetable. The results are presented in the Figure 9.
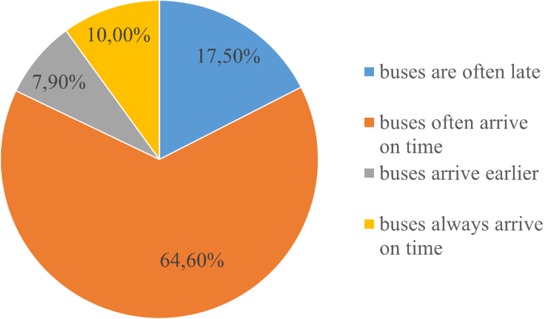
Satisfaction with the punctuality of MTC buses
Over 51% of respondents are satisfied with the comfort and safety of Pila buses. It is interesting that as much as 31.3% of respondents assess MTC in this category on average. However, MTC is changing its rolling stock to a new one, therefore the standard of vehicles and comfort are increased. In addition, the vehicles are equipped with a camera system, so that in the event of "incidents" the offender cannot feel unpunished. The results are presented in the Figure 10.
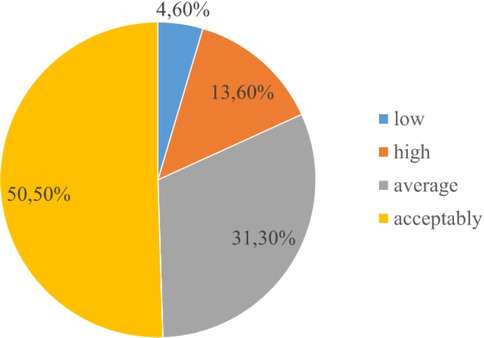
Assessment of safety and comfort of travel in Pila buses
The vast majority of respondents are satisfied with the work of Pila bus drivers, who are always happy to help in any situation, while nearly 15% of respondents are not satisfied with the work of MTC drivers. The results are presented in the Figure 11.
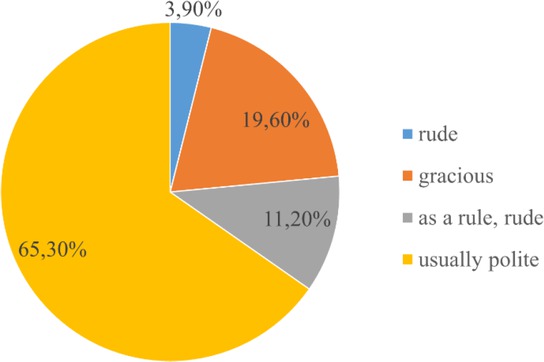
Assessment of drivers’ work
Over half of the respondents are satisfied with the work of Pila bus controllers. Unfortunately, almost the second is not satisfied with the work of MTC controllers. The results are presented in the Figure 12.
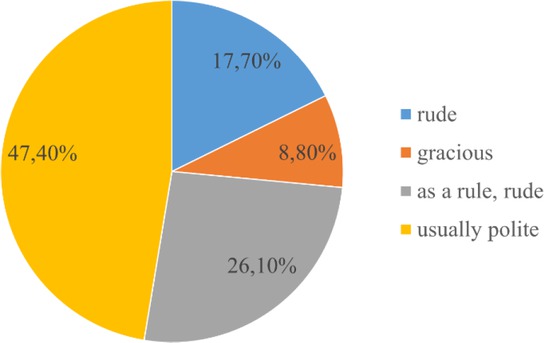
Assessment of controllers’ work
According to almost 60% of respondents, Pila buses should run more often. Some referred to running to suburban housing estates such as Gładyszewo or separate towns like Dolaszewo, where buses run sporadically. 1 in 10 people have no opinion on this topic. The results are presented in the Figure 13.
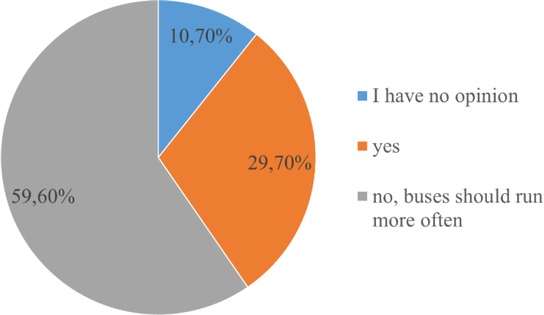
Frequency of buses
42.6% of respondents are not satisfied with synchronizing buses for further bus travel. The waiting time for the next bus is too long to continue using public transport. As many as 36% of respondents have no opinion on this issue, which may mean that they usually use only one bus route, without changing. The results are presented in the Figure 14.
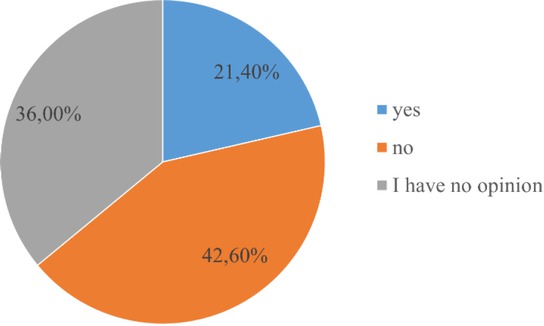
Appropriate bus synchronization
Almost ¾ of respondents are for opening a new line. The most frequently answered answer was the opening of not a new direction, but the creation of a night line, since the last buses finish their work before 11pm. The results are presented in the Figure 15.
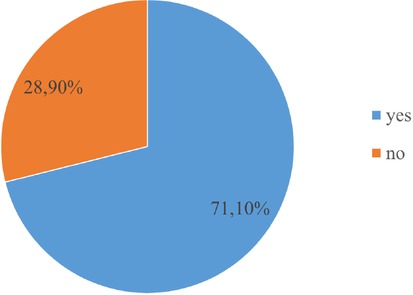
Opening of a new bus route
The assessment of the Pi ticket machine is very divergent, as a large number of respondents complain about the lack of Internet connection when paying by card for the ticket. In addition to this difficulty, the Pila ticket machine is intuitive and 1/3 of respondents evaluate it on a maximum of 10 levels. The results are presented in the Figure 16.
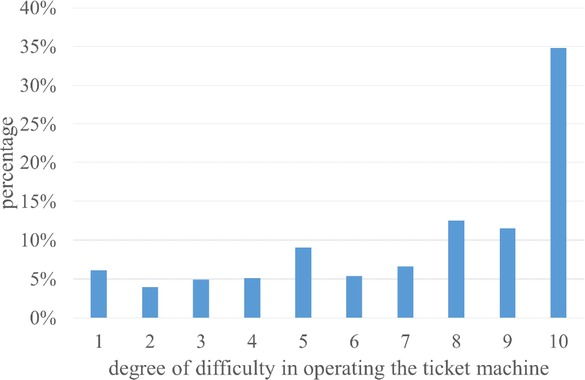
Assessment of the difficulty of operating a ticket machine (1-difficult, 10-easy)
39.5% of respondents are for the introduction of the Dynamic Passenger Information System, which will make it easier for them to move around by public transport, while more than half of the respondents do not know what this system is and what benefits are associated with it. The results are presented in the Figure 17.
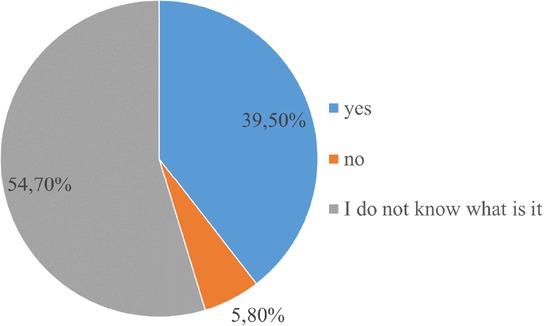
Introduction of a Dynamic Passenger Information System
Almost all respondents are for introducing a mobile application showing the actual arrival time of the bus. This would facilitate travel by public transport due to the fact that almost anyone could easily use such an application on their smartphone. The results are presented in the Figure 18.
Introduction of a mobile application showing the actual arrival time of the bus
Almost all respondents are for introducing information boards at the stops about the real time of bus arrival. This would make it easier to make a decision when choos
ing an alternative line in a specific direction. The results are presented in the Figure 19.
Introduction of boards informing about the real time of bus arrival
According to respondents, the biggest problem for MTC is the lack of buses after 11pm. An additional downside is the lack of information about how far the bus is from the bus stop. Currently, in the city of Pila, the Dynamic Passenger Information System is being introduced, which will significantly eliminate this problem.
MTC is constantly trying to modernize its rolling stock. Some old buses are still running, with the average age of buses it’s 8 years (as of 30/01/2019). MTC plans to buy another new buses, including hybrid and electric ones, in the years 2020-2021. After the last replacement of the rolling stock, currently the Pila transport company is introducing the Dynamic Passenger Information System, which allows passengers to obtain current information on bus routes. Many qualified professional drivers work at MTC Pila, who often achieve high places in competitions both on the national and international arena. Not every driver is able to complete such difficult tasks properly. At the same time, Pilski MTC is well perceived by customers as a carrier, because every respondent spoke well about this company.
6 Summary
The article presents the importance of urban transport in the entire aspect of city functioning. The conducted research has shown that the inhabitants of the city of Pila have little knowledge of the functioning and investments currently being implemented by MZK. This may be due to the fact that every year fewer and fewer people use public transport in Pila. This is also confirmed by the results of the research, where only 30% of respondents use public transport every day. In addition, based on the survey, it can be concluded that the residents of Pila choose public transport because they do not have a driving license, they mainly need to travel on lines that connect the opposite ends of the city and at the same time passing through the city center, information on the timetable is downloaded from the Internet, buses in Pila are punctual, comfortable, safe and drivers and ticket inspectors are usually polite. Buses in the analyzed city should run more frequently, they are badly synchronized, it often happens that two buses are going in one direction at the same time. According to the respondents, a new night bus line should be opened so that employees who finish work after 23:00 and young people from discos have a way to return home. The ticket machines on each bus are easy to use. In addition, the inhabitants of Pila do not know what the Dynamic Passenger Information System is, but they would like to use the mobile application and information boards at stops showing the actual time of arrival of the bus and current weather data.
The study was carried out in cooperation with MTC in Pila, and the obtained data was thoroughly analyzed by the company. On this basis,MZK plans to introduce a number of new solutions, which include e.g. the night line on weekends, which is demanded by customers, and to modify timetables to make them more convenient for travelers. It can be said that MTC is mainly chosen by residents who have no other alternative. Not everyone can afford traveling by car every day. Maybe if there were another competitive company competing for the client with MTC, standards, and above all ticket prices would be more favorable for users.
To sum up, it can be said that MTC goes with the times and tries to reach customers in every age range. Living in the 21st century and the age of smartphones, the ideal solution would be to introduce a phone application that would show the same information that passengers see at the bus stop. Additionally, thanks to the Dynamic Passenger Information System, they could also use this driver. They would have information about where the other bus is currently located. This would make it easier for passengers who use more than one line to travel (the issue of interchanges or ideal bus synchronization).
References
[1] Act on public collective transport of 16 December 2010. Dz. Of Laws of 2011 No. 5, item 13.Suche in Google Scholar
[2] Kłos-Adamkiewicz Z., Załoga E. Urban public transport. Shaping the value of services for passengers in the light of the challenges of a new mobility culture. Warsaw: BEL Studio, 2017.Suche in Google Scholar
[3] Dydkowski G. Integration of urban transport. Katowice: University of Economics Publisher, 2009Suche in Google Scholar
[4] The Road Transport Act of September 6, 2001. Dz. Of Laws 2001 No. 125, item 1371Suche in Google Scholar
[5] Wyszomirski O. City transport. Economics and organization. Gdańsk: University of Gdańsk Publishing House, 2010.Suche in Google Scholar
[6] Szołtysek J. Basics of urban logistics. 2nd edition. Katowice: Publisher of the University of Economics in Katowice, 2007.Suche in Google Scholar
[7] Brzustewicz P. Sustainable solutions in urban transport - directions of development. Acta Universitatis Nicolai Copernici. Management XL -413. Toruń 2013.Suche in Google Scholar
[8] Szołtysek J., Creating mobility of city dwellers. Wolters Kulwer, Warsaw 2011.Suche in Google Scholar
[9] Załoga E., Dudek E., Selected problems of European society mobility. Scientific Notebooks of the University of Szczecin, Problems of Transport and Logistics from 9, Szczecin 2009, pp. 99-109.Suche in Google Scholar
[10] Flejterski S., Panasiuk A., Perenc J., Rosa G., Contemporary economics of services. PWN Scientific Publisher, Warsaw 2008.Suche in Google Scholar
[11] Menes E., Socio-economic aspects of the development of individual motorization in Poland. Communication Review, 01/2001.Suche in Google Scholar
[12] Official Journal EN European Union, C 326/49 of 26.10.201210.1007/978-1-349-59541-9_6Suche in Google Scholar
[13] Kruszyna M., Traffic engineering and shaping mobility. Communication Review 11-12 / 2010, pp. 52-53.Suche in Google Scholar
[14] Kruszyna M., Railway station as a mobility node. Communication Review 10/2012, pp. 34-37.Suche in Google Scholar
[15] Borys T., Measurement of sustainable development of transport, in: Ecological problems of sustainable development, edited by Kiełczewski D., Dobrzańska B., Wydawnictwo Wyższa Szkoła Ekonomiczna in Białystok, Białystok 2009.Suche in Google Scholar
[16] Litman T., Developing Indicators for Comprehensive and Sustainable Transport Planning, Transportation Research Record: Journal of the Transportation Research Board, Vol. 2017/2007, Transportation Research Board of the National Academics,Washington 2007.10.3141/2017-02Suche in Google Scholar
[17] Chamier-Gliszczyński N. Sustainable urban mobility as part of the transport plan Koszalin University of Technology, Logistics 4/2015Suche in Google Scholar
[18] Banister, D. The sustainable mobility paradigm. Transport Policy. 2008, T. 15, No. 2, pp. 73-80.10.1016/j.tranpol.2007.10.005Suche in Google Scholar
[19] Infrastruktura Piły- https://www.powiat.pila.pl/opowiecie/informacje/infrastruktura [access 2.08.2020].Suche in Google Scholar
[20] Maps google https://www.google.pl/maps/@52.1782658,21.6247279,7.44z [dostęp: 12.01.2020].Suche in Google Scholar
[21] History of MTC. http://www.mzk.pila.pl/historia-mzk.html (accessed December 28, 2018)Suche in Google Scholar
[22] Gorzelańczyk P., Koczorowski A. Cost analysis of the transport fleet maintenance on the example of the Municipal Transport Company, Buses. Technology, Exploitation, Transport Systems, 6/2018Suche in Google Scholar
[23] Gorzelańczyk P., Koczorowski A. Optimization of transport fleet maintenance costs on the example of the Municipal Transport Company, Buses. Technology, Exploitation, Transport Systems, 6/2018Suche in Google Scholar
[24] Chamier-Gliszczyński N. A model of mobility of city users for the needs of transport activities. Urban and regional transport 06/2016Suche in Google Scholar
© 2021 P. Gorzelanczyk, published by De Gruyter
This work is licensed under the Creative Commons Attribution 4.0 International License.
Artikel in diesem Heft
- Regular Articles
- Electrochemical studies of the synergistic combination effect of thymus mastichina and illicium verum essential oil extracts on the corrosion inhibition of low carbon steel in dilute acid solution
- Adoption of Business Intelligence to Support Cost Accounting Based Financial Systems — Case Study of XYZ Company
- Techno-Economic Feasibility Analysis of a Hybrid Renewable Energy Supply Options for University Buildings in Saudi Arabia
- Optimized design of a semimetal gasket operating in flange-bolted joints
- Behavior of non-reinforced and reinforced green mortar with fibers
- Field measurement of contact forces on rollers for a large diameter pipe conveyor
- Development of Smartphone-Controlled Hand and Arm Exoskeleton for Persons with Disability
- Investigation of saturation flow rate using video camera at signalized intersections in Jordan
- The features of Ni2MnIn polycrystalline Heusler alloy thin films formation by pulsed laser deposition
- Selection of a workpiece clamping system for computer-aided subtractive manufacturing of geometrically complex medical models
- Development of Solar-Powered Water Pump with 3D Printed Impeller
- Identifying Innovative Reliable Criteria Governing the Selection of Infrastructures Construction Project Delivery Systems
- Kinetics of Carbothermal Reduction Process of Different Size Phosphate Rocks
- Plastic forming processes of transverse non-homogeneous composite metallic sheets
- Accelerated aging of WPCs Based on Polypropylene and Birch plywood Sanding Dust
- Effect of water flow and depth on fatigue crack growth rate of underwater wet welded low carbon steel SS400
- Non-invasive attempts to extinguish flames with the use of high-power acoustic extinguisher
- Filament wound composite fatigue mechanisms investigated with full field DIC strain monitoring
- Structural Timber In Compartment Fires – The Timber Charring and Heat Storage Model
- Technical and economic aspects of starting a selected power unit at low ambient temperatures
- Car braking effectiveness after adaptation for drivers with motor dysfunctions
- Adaptation to driver-assistance systems depending on experience
- A SIMULINK implementation of a vector shift relay with distributed synchronous generator for engineering classes
- Evaluation of measurement uncertainty in a static tensile test
- Errors in documenting the subsoil and their impact on the investment implementation: Case study
- Comparison between two calculation methods for designing a stand-alone PV system according to Mosul city basemap
- Reduction of transport-related air pollution. A case study based on the impact of the COVID-19 pandemic on the level of NOx emissions in the city of Krakow
- Driver intervention performance assessment as a key aspect of L3–L4 automated vehicles deployment
- A new method for solving quadratic fractional programming problem in neutrosophic environment
- Effect of fish scales on fabrication of polyester composite material reinforcements
- Impact of the operation of LNG trucks on the environment
- The effectiveness of the AEB system in the context of the safety of vulnerable road users
- Errors in controlling cars cause tragic accidents involving motorcyclists
- Deformation of designed steel plates: An optimisation of the side hull structure using the finite element approach
- Thermal-strength analysis of a cross-flow heat exchanger and its design improvement
- Effect of thermal collector configuration on the photovoltaic heat transfer performance with 3D CFD modeling
- Experimental identification of the subjective reception of external stimuli during wheelchair driving
- Failure analysis of motorcycle shock breakers
- Experimental analysis of nonlinear characteristics of absorbers with wire rope isolators
- Experimental tests of the antiresonance vibratory mill of a sectional movement trajectory
- Experimental and theoretical investigation of CVT rubber belt vibrations
- Is the cubic parabola really the best railway transition curve?
- Transport properties of the new vibratory conveyor at operations in the resonance zone
- Assessment of resistance to permanent deformations of asphalt mixes of low air void content
- COVID-19 lockdown impact on CERN seismic station ambient noise levels
- Review Articles
- FMEA method in operational reliability of forest harvesters
- Examination of preferences in the field of mobility of the city of Pila in terms of services provided by the Municipal Transport Company in Pila
- Enhancement stability and color fastness of natural dye: A review
- Special Issue: ICE-SEAM 2019 - Part II
- Lane Departure Warning Estimation Using Yaw Acceleration
- Analysis of EMG Signals during Stance and Swing Phases for Controlling Magnetorheological Brake applications
- Sensor Number Optimization Using Neural Network for Ankle Foot Orthosis Equipped with Magnetorheological Brake
- Special Issue: Recent Advances in Civil Engineering - Part II
- Comparison of STM’s reliability system on the example of selected element
- Technical analysis of the renovation works of the wooden palace floors
- Special Issue: TRANSPORT 2020
- Simulation assessment of the half-power bandwidth method in testing shock absorbers
- Predictive analysis of the impact of the time of day on road accidents in Poland
- User’s determination of a proper method for quantifying fuel consumption of a passenger car with compression ignition engine in specific operation conditions
- Analysis and assessment of defectiveness of regulations for the yellow signal at the intersection
- Streamlining possibility of transport-supply logistics when using chosen Operations Research techniques
- Permissible distance – safety system of vehicles in use
- Study of the population in terms of knowledge about the distance between vehicles in motion
- UAVs in rail damage image diagnostics supported by deep-learning networks
- Exhaust emissions of buses LNG and Diesel in RDE tests
- Measurements of urban traffic parameters before and after road reconstruction
- The use of deep recurrent neural networks to predict performance of photovoltaic system for charging electric vehicles
- Analysis of dangers in the operation of city buses at the intersections
- Psychological factors of the transfer of control in an automated vehicle
- Testing and evaluation of cold-start emissions from a gasoline engine in RDE test at two different ambient temperatures
- Age and experience in driving a vehicle and psychomotor skills in the context of automation
- Consumption of gasoline in vehicles equipped with an LPG retrofit system in real driving conditions
- Laboratory studies of the influence of the working position of the passenger vehicle air suspension on the vibration comfort of children transported in the child restraint system
- Route optimization for city cleaning vehicle
- Efficiency of electric vehicle interior heating systems at low ambient temperatures
- Model-based imputation of sound level data at thoroughfare using computational intelligence
- Research on the combustion process in the Fiat 1.3 Multijet engine fueled with rapeseed methyl esters
- Overview of the method and state of hydrogenization of road transport in the world and the resulting development prospects in Poland
- Tribological characteristics of polymer materials used for slide bearings
- Car reliability analysis based on periodic technical tests
- Special Issue: Terotechnology 2019 - Part II
- DOE Application for Analysis of Tribological Properties of the Al2O3/IF-WS2 Surface Layers
- The effect of the impurities spaces on the quality of structural steel working at variable loads
- Prediction of the parameters and the hot open die elongation forging process on an 80 MN hydraulic press
- Special Issue: AEVEC 2020
- Vocational Student's Attitude and Response Towards Experiential Learning in Mechanical Engineering
- Virtual Laboratory to Support a Practical Learning of Micro Power Generation in Indonesian Vocational High Schools
- The impacts of mediating the work environment on the mode choice in work trips
- Utilization of K-nearest neighbor algorithm for classification of white blood cells in AML M4, M5, and M7
- Car braking effectiveness after adaptation for drivers with motor dysfunctions
- Case study: Vocational student’s knowledge and awareness level toward renewable energy in Indonesia
- Contribution of collaborative skill toward construction drawing skill for developing vocational course
- Special Issue: Annual Engineering and Vocational Education Conference - Part II
- Vocational teachers’ perspective toward Technological Pedagogical Vocational Knowledge
- Special Issue: ICIMECE 2020 - Part I
- Profile of system and product certification as quality infrastructure in Indonesia
- Prediction Model of Magnetorheological (MR) Fluid Damper Hysteresis Loop using Extreme Learning Machine Algorithm
- A review on the fused deposition modeling (FDM) 3D printing: Filament processing, materials, and printing parameters
- Facile rheological route method for LiFePO4/C cathode material production
- Mosque design strategy for energy and water saving
- Epoxy resins thermosetting for mechanical engineering
- Estimating the potential of wind energy resources using Weibull parameters: A case study of the coastline region of Dar es Salaam, Tanzania
- Special Issue: CIRMARE 2020
- New trends in visual inspection of buildings and structures: Study for the use of drones
- Special Issue: ISERT 2021
- Alleviate the contending issues in network operating system courses: Psychomotor and troubleshooting skill development with Raspberry Pi
- Special Issue: Actual Trends in Logistics and Industrial Engineering - Part II
- The Physical Internet: A means towards achieving global logistics sustainability
- Special Issue: Modern Scientific Problems in Civil Engineering - Part I
- Construction work cost and duration analysis with the use of agent-based modelling and simulation
- Corrosion rate measurement for steel sheets of a fuel tank shell being in service
- The influence of external environment on workers on scaffolding illustrated by UTCI
- Allocation of risk factors for geodetic tasks in construction schedules
- Pedestrian fatality risk as a function of tram impact speed
- Technological and organizational problems in the construction of the radiation shielding concrete and suggestions to solve: A case study
- Finite element analysis of train speed effect on dynamic response of steel bridge
- New approach to analysis of railway track dynamics – Rail head vibrations
- Special Issue: Trends in Logistics and Production for the 21st Century - Part I
- Design of production lines and logistic flows in production
- The planning process of transport tasks for autonomous vans
- Modeling of the two shuttle box system within the internal logistics system using simulation software
- Implementation of the logistics train in the intralogistics system: A case study
- Assessment of investment in electric buses: A case study of a public transport company
- Assessment of a robot base production using CAM programming for the FANUC control system
- Proposal for the flow of material and adjustments to the storage system of an external service provider
- The use of numerical analysis of the injection process to select the material for the injection molding
- Economic aspect of combined transport
- Solution of a production process with the application of simulation: A case study
- Speedometer reliability in regard to road traffic sustainability
- Design and construction of a scanning stand for the PU mini-acoustic sensor
- Utilization of intelligent vehicle units for train set dispatching
- Special Issue: ICRTEEC - 2021 - Part I
- LVRT enhancement of DFIG-driven wind system using feed-forward neuro-sliding mode control
- Special Issue: Automation in Finland 2021 - Part I
- Prediction of future paths of mobile objects using path library
- Model predictive control for a multiple injection combustion model
- Model-based on-board post-injection control development for marine diesel engine
- Intelligent temporal analysis of coronavirus statistical data