Infrared spectroscopy for ageing assessment of insulating oils via dielectric loss factor and interfacial tension
-
Yi-Hua Qian
 ,
Zhi Li
,
Zhi Li

Abstract
Along with the increase in demand for electricity, dependability requirements for the power supply system also increase. Transformers are the backbone of the electrical system; thus, they must function reliably and safely. In this study, a method based on Fourier-transform infrared spectroscopy technology is proposed for assessing the ageing level of insulating oils. Copper-catalysed thermal ageing is applied to four distinct insulating oils at a temperature of
1 Introduction
As the power industry has expanded, it has become more crucial than ever to transmit power supply systems safely. The transformer is the key component of the electrical power system, which serves as the foundation of the power system and defines the stability of the system. It is also one of the most expensive and accident-prone equipment of the power system. However, electrical and thermal strains that are present continuously during a transformer’s operation on the insulating system [1] will raise transformer’s safety risk and result in irreversible harm. Online monitoring of the insulation system has consequently become a popular area of study for academics. The reliability of the insulation of the transformer is related to the reliable operation of the power transformer. According to Zhou et al. [2], the safety and service life of the transformer are directly correlated with the operational quality and ageing of the insulating oil. Barkas et al. also mention that as the transformer insulation ages, the transformer itself also ages [3]. Therefore, evaluating the insulating oil’s state is quite important. In particular, it indicates both the overall condition of the transformer and the oil quality of the transformer [4–7].
The extensive use of modern analytical techniques has made insulating oil testing simpler [8,9]. Infrared spectroscopy is one of the most frequently used detection strategies. The literature [10] compares popular techniques for determining the composition of structural families and has demonstrated that the infrared analysis detection approach is more accurate than conventional detection techniques. Infrared spectroscopy has the advantages of accurate detection, full functionality, low cost, and non-destructive properties [11]. These techniques have been used to study the physicochemical characteristics of insulating oils, the additive cation exchange capacity, and the ageing markers in mineral insulating fluids, lubricants, and oils [12–17].
Infrared spectroscopy has recently become widely used by academics to examine insulating oils and evaluate the condition of transformers. A technique to determine the amount of antioxidants present in insulating oils using near infrared (NIR) spectroscopy was proposed by Leong et al. [18]. Trnka et al. [19] studied the ageing process of insulating oils and described their thermal ageing degradation products using Fourier-transform infrared spectroscopy (FT-IR), a typical method for insulating oil testing [20,21] because NIR is an unconventional spectroscopic technique. By examining the relationship between the dielectric loss factor, interfacial tension, acid value, and the technical method for evaluating the ageing process of insulating oil based on FT-IR technology, Qian et al. [22] presented the early detection of transformer health and invisible problems. The peak area ratio of the infrared ageing characteristic peaks based on FT-IR technology was compared to the acid value of samples of insulating oil by Wang et al. [23]. However, it has not been extensively investigated how interfacial tension, dielectric loss factor, and the ageing process of insulating oils interact.
In order to create a sensor for real-time monitoring of insulating oil degradation, this article uses the FT-IR technique to investigate changes in the characteristic functional groups of ageing products and analyse the correlation between the ageing breakdown products (carbonyl, aldehyde, carboxyl, etc.) and the infrared spectra of those indicators (dielectric loss factor, interfacial tension, etc.).
2 Materials and methods
2.1 Main raw materials
For this test, four different types of insulating oil were selected: three of them are base oil No. 7, base oil No. 10, base oil No. 25, and the fourth is a finished oil with a minimum cold commissioning temperature of
2.2 Specimen preparation
The four aged insulating oils were vacuum-degassed, and the kraft insulating paper was dried and dehydrated. The four insulating oils were weighed separately, and each sample was 320 g. To prevent the influence of gas and moisture during the weighing process, the insulating oil samples were again vacuum-degassed and then placed in mill-mouth reagent bottles. The base oil No. 7 and base oil No. 10 were mixed with DBPC at 0.3% by mass and placed on an ultrasonic shaker for 3 h and kept at a constant temperature of
Depending on the amount of insulating oil weighed, 40 g of copper wire was weighed and made into a spiral; the insulating paper was cut to 8 cm

Test flow chart.
The colour and transparency of the insulating oil can visually reflect the quality of the oil. Traditionally, the colour of insulating oil is generally determined using the American Society for Testing and Materials (ASTM) D 1500 standard and is indicated by a colour index (CI) from a scale. Unaged insulating oil is clear and odourless, but as it ages, the transparency of the oil decreases and the smell becomes pungent [24]. The colour of the insulating oil changes from left to right as the ageing time increases, as shown in Figure 2.

Ageing insulating oil colour change.
2.3 Selection of ageing temperature
Yang et al. [25] found that the number of equipment with a transformer life of 11–15 years was more than twice that of 6–10 years, so it can be concluded that the life of general insulating oil is 11–15 years. According to Montsinger’s law, the reduction in estimated life can be calculated by the
2.4 Insulation oil performance index tests and methods
In order to measure and record the initial insulating oil sample family composition as well as the DBPC content of the insulating oil, the initial samples of the four different types of insulating oil were collected. The insulating oil was then scanned in the infrared, and the infrared spectra of the infrared liquid pools of 0.1 and 1 mm thickness were recorded, which are shown in Table 1.
Initial insulating oil sample test parameters
| Insulating oil sample markings | Insulating oil sample composition | Content in insulating oil (%) |
|---|---|---|
| No. 1 | Cycloalkyl | 0.32 |
| No. 2 | Cycloalkyl | 0.32 |
| No. 2 | Cycloalkyl | 0.27 |
| No. 2 | Non-cycloalkyl | 0.02 |
The dielectric loss factor and interfacial tension of the ageing oil were tested. The measurements were taken two times, and the average value was calculated. The measurement method reference standards are shown in Table 2. The parameters selected for measurement were referred to the literature and the standard Guo Biao/Tui Jian 7595-2007 [27] quality of insulating oil in operation.
Measurement reference standards
| Parameter name | Reference standards |
|---|---|
| Dielectric loss factor | IEC 60247 [28] measurement of dielectric loss factor of liquid insulating materials |
| Interfacial tension | ISO 6295 [29] determination of oil-to-water interfacial tension of petroleum products (circular method) |
2.5 Testing of the dielectric loss factor
Referring to international electrotechnical commission (IEC) 60247 [28] to the determination of the dielectric loss factor, the electrode cups and electrodes were first cleaned with petroleum ether and later with deionised water. Then, they were dried and assembled the inside of the electrode cup is washed twice with a sample of the insulating oil to be tested and filled with about 50 mL of the test oil. A customised mode that allows the simultaneous determination of dielectric loss and volume resistivity was selected. The indicator can then be measured at
2.6 Testing of interfacial tension
Referring to international organization for standardization (ISO) 6295 [29] to the determination of the interfacial tension, the platinum ring and the sample cup were kept clean. The sample cup was filled with deionised water to the middle scale, and the tension value of the water to be tested was selected. Then, the lifting table was raised until the platinum ring was submerged in the sample cup by 5–6 mm. Using the burette, a sample of oil was taken and the oil was dropped along the wall of the cup until the height of the sample reached the top mark of the cup. Finally, the sample was selected to test the water–oil interfacial tension, and the data were recorded.
2.7 Infrared test methods
The infrared test analysis was carried out in a removable liquid cell (Model: HARRICK HPL-C-13) with a potassium bromide window sheet +1 mm, measuring the infrared wavelength range from 4,000 to 600
2.8 Correlation analysis
For the aged oil samples, the dielectric loss factor and interfacial tension were tested and recorded as two conventional ageing indicators. The infrared full spectra of all new and aged insulating oils were recorded to find the characteristic peaks and their corresponding functional groups during the ageing process. The correlation coefficients between the peak area ratios of the ageing peaks and the conventional ageing indicators were calculated and fitted to the regression curves. The correlation between the peak area ratio of each ageing peak and the conventional ageing index was analysed. As this study was only designed to find the correlation between the two variables, it is sufficient to express with the Pearson correlation coefficient [31], and no further regression analysis was required for variable relationships with Pearson correlation coefficients
3 Results
3.1 FT-IR results for base oil No. 1
The FT-IR method in this article does not assess the ageing state directly on the basis of colour. Therefore, the study in this article is based on a baseline correction. Determination of the ageing degree of the insulating oil is based on the ageing colour and transparency of the insulating oil; a total of 21 ageing samples with different ageing degrees were taken for oil No. 1. The ageing times were 168, 336, 504, 672, 864, 1,008, 1,176, 1,344, 1,512, and 1,680 h. The samples to be tested were injected into the liquid pool, and the scanning wave number range was set to 4,000–600
Figure 3 shows the infrared spectra of the ageing insulating oil sample of oil No. 1 in the 4,000–600

The upper image is infrared full spectrum of insulating oil No. 1, and the lower image is local magnification of the 1,600–1,800

The upper image is infrared full spectrum of insulating oil No. 2, the lower image is local magnification of the 1,550–1,800

The upper image is infrared full spectrum of insulating oil No. 3, the lower image is local magnification of the 1,600–1,800

The upper image is infrared full spectrum of insulating oil No. 4, the lower image is local magnification of the 1,500–1,900
The results show that the absorption peak signal is extremely strong in the 3,500–2,500
3.2 FT-IR results for base oil No. 2
A total of 19 ageing samples of oil No. 2 were taken. The ageing times were 168, 336, 504, 672, 864, 1,008, 1,176, 1,344, and 1,680 h, respectively. Infrared spectroscopy of the base oil No. 2 was carried out according to the method in Section 3.1.
Figure 4 shows the infrared spectra of the ageing insulating oil sample of oil No. 2 in the 4,000–600
The results show that after ageing to 1,176 h, the insulating oil of No. 2 samples shows a gradual increase in absorption peak intensity with ageing time at 1,775, 1,697, 1,682, 1,660, 1,648, and 1,599
3.3 FT-IR results for base oil No. 3
A total of nine samples were aged for oil No. 3. The ageing times were 168, 242, 336, 700, 840, 1,176, and 1,344 h, respectively. Infrared spectroscopy of base oil No. 3 was also carried out according to the procedure in Section 3.1.
Figure 5 shows the infrared spectra of the ageing insulating oil sample of oil No. 3 in the 4,000–600
According to the results shown in Figure 5, it is found that the infrared absorption peaks at 1,775, 1,697, 1,683, 1,660, 1,648, and 1,606
3.4 FT-IR results for base oil No. 4
A total of 15 samples were aged for insulating oil No. 4. The ageing times were 168, 336, 504, 840, 1,020, 1,080, and 1,250 h, respectively. Infrared spectroscopy of base insulating oil No. 4 was also carried out according to the method in Section 3.1.
Figure 6 shows the infrared spectra of the ageing insulating oil sample of oil No. 4 in the 4,000–600
Comparing all the aforementioned data, it can be found that the ageing peaks of insulating oil No. 1, No. 2, and No. 3 with DBPC added are basically the same, with the ageing product peaks located at 1,775, 1,697, and 1,660
3.5 Results of correlation analysis
3.5.1 Selection of reference peaks
In order to reduce the error due to the influence of layer thickness, the absorption peak in the infrared spectrum of the aged insulating oil samples, which basically did not change with ageing time, is chosen as the reference peak in the correlation analysis. The infrared absorption peak at 3,165

Absorption peak at 3,165
3.5.2 Base oil No. 1 correlation analysis results
There were 19 samples of aged insulating oil. Two samples of unaged insulating oil were used: one without DBPC and the other containing 0.3% DBPC. There were 21 samples of insulating oil in total. To conduct a correlation analysis, the data were loaded into SPSS program. The dependent variables
Fitting results for the dielectric loss factor of base oil No. 1
| Parameters | Linear equation | Equation of the two degree | Equation of the third degree | |
|---|---|---|---|---|
| Dielectric loss factor against | Significance | 0 | 0 | 0.001 |
| 1,775/3,165
|
|
0.516 | 0.594 | 0.597 |
| Dielectric loss factor against | Significance | 0 | 0.002 | 0.006 |
| 1,697/3,165
|
|
0.508 | 0.509 | 0.509 |
| Dielectric loss factor against | Significance | 0 | 0.001 | 0.002 |
| 1,660/3,165
|
|
0.559 | 0.566 | 0.580 |
| Dielectric loss factor against | Significance | 0.001 | 0.002 | 0.007 |
| 1,599/3,165
|
|
0.457 | 0.497 | 0.502 |
Fitting results for the interfacial tension of base oil No. 1
| Parameters | Linear equation | Equation of the two degree | Equation of the third degree | |
|---|---|---|---|---|
| Interfacial tension against | Significance | 0 | 0 | 0 |
| 1,775/3,165
|
|
0.744 | 0.819 | 0.861 |
| Interfacial tension against | Significance | 0 | 0 | 0 |
| 1,697/3,165
|
|
0.738 | 0.762 | 0.764 |
| Interfacial tension against | Significance | 0 | 0 | 0 |
| 1,660/3,165
|
|
0.855 | 0.863 | 0.912 |
| Interfacial tension against | Significance | 0 | 0 | 0 |
| 1,599/3,165
|
|
0.724 | 0.763 | 0.780 |
The fitting curve of the dielectric loss factor and interfacial tension against the peak area ratios of 1,775/3,165, 1,697/3,165, 1,660/3,165, and 1,599/3,165

Fitting curve for dielectric loss factor against peak area ratio of base insulating oil No. 1: (a) fitting curve graph of dielectric loss factor against 1,775/3,165

Fitting curve for interfacial tension against peak area ratio of base insulating oil No. 1: (a) Fitting curve graph of interfacial tension against 1,775/3,165
The aforementioned data show that the goodness-of-fit of the fitting curves for the dielectric loss factor of oil No. 1 and the peak area ratios of the peaks at 1,775, 1,697, 1,660, and 1,599
3.5.3 Base oil No. 2 correlation analysis results
There were 17 samples of ageing insulating oil and 2 samples of unaged insulating oil with and without 0.3% DBPC added, respectively. There were 19 samples of insulating oil in total. The analysis method was the same as that used in Section of 3.4.2. The results are shown in Tables 5 and 6.
Fitting results for the dielectric loss factor of base oil No. 2
| Parameters | Linear equation | Equation of two degree | Equation of the third degree | |
|---|---|---|---|---|
| Dielectric loss factor against | Significance | 0 | 0.001 | 0.002 |
| 1,775/3,165
|
|
0.550 | 0.557 | 0.627 |
| Dielectric loss factor against | Significance | 0 | 0 | 0 |
| 1,697/3,165
|
|
0.658 | 0.663 | 0.819 |
| Dielectric loss factor against | Significance | 0 | 0 | 0 |
| 1,660/3,165
|
|
0.697 | 0.703 | 0.837 |
| Dielectric loss factor against | Significance | 0.002 | 0.002 | 0.002 |
| 1,599/3,165
|
|
0.456 | 0.456 | 0.456 |
Fitting results for the dielectric loss factor of base oil No. 2
| Parameters | Linear equation | Equation of two degree | Equation of the third degree | |
|---|---|---|---|---|
| Interfacial tension against | Significance | 0.002 | 0.001 | 0.002 |
| 1,775/3,165
|
|
0.425 | 0.607 | 0.607 |
| Interfacial tension against | Significance | 0 | 0 | 0.001 |
| 1,697/3,165
|
|
0.553 | 0.641 | 0.641 |
| Interfacial tension against | Significance | 0 | 0 | 0 |
| 1,660/3,165
|
|
0.649 | 0.782 | 0.832 |
The fitting curve of the dielectric loss factor and interfacial tension against the peak area ratios of 1,775/3,165, 1,697/3,165, 1,660/3,165, 1648/3,165, and 1,599/3,165

Fitting curve for dielectric loss factor against peak area ratio of base insulating oil No. 2: (a) fitting curve graph of dielectric loss factor against 1,775/3,165
Fitting curve for interfacial tension against peak area ratio of base insulating oil No. 2: (a) fitting curve graph of interfacial tension against 1,775/3,165
The best model for each group is as follows: the best goodness-of-fit of the fitted curve for the dielectric loss factor and the peak area ratio of 1,697/3,165 and 1,660/3,165
However, the goodness-of-fit of the optimal models for the interfacial tension to 1,775/3,165 and 1,697/3,165
3.5.4 Base oil No. 3 correlation analysis results
There were eight samples of ageing insulating oil and one sample of unaged insulating oil. The total number of insulating oil samples was 9. The method is the same as in Section of 3.4.2. The results of goodness-of-fit and significance are shown in Table 7.
Fitting results for the interfacial tension of base oil No. 3
| Parameters | Linear equation | Equation of two degree | Equation of the third degree | |
|---|---|---|---|---|
| Interfacial tension against | Significance | 0.003 | 0.014 | 0.048 |
| 1,775/3,165
|
|
0.733 | 0.759 | 0.769 |
| Interfacial tension against | Significance | 0.002 | 0.012 | 0.046 |
| 1,697/3,165
|
|
0.770 | 0.772 | 0.773 |
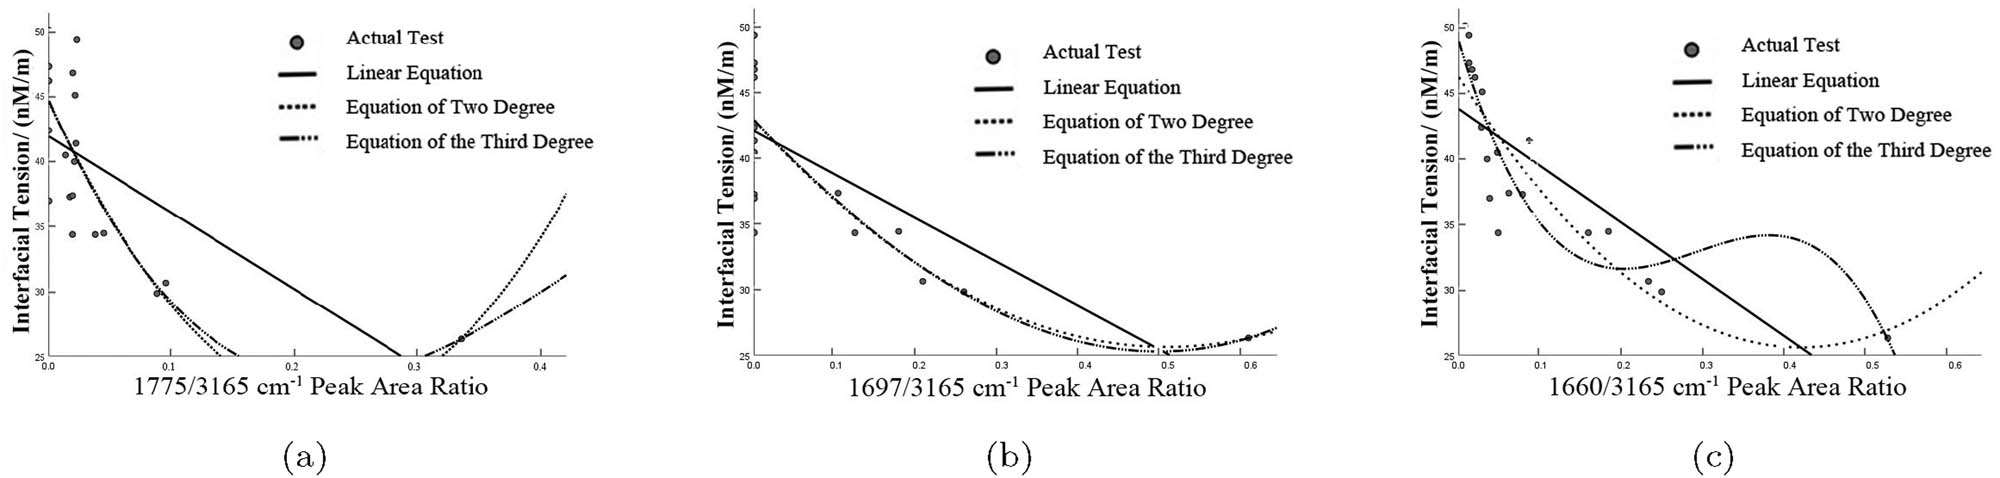
It is shown that the best goodness-of-fit for the interfacial tension to 1,697/3,165

Fitting curve for interfacial tension against peak area ratio of base insulating oil No. 3 (a) Fitting curve graph of interfacial tension against 1,697/3,165
3.5.5 Base oil No. 4 correlation analysis results
There were 14 samples of aged insulating oil and 1 sample of unaged insulating oil. The total number of insulating oil samples of insulating oil No. 4 was 15. The method is the same as Section of 3.4.2, and the results are shown in Tables 8 and 9.
Fitting results for the dielectric loss factor of base oil No. 4
| Parameters | Linear equation | Equation of two degree | Equation of the third degree | |
|---|---|---|---|---|
| Dielectric loss factor against | Significance | 0 | 0 | 0 |
| 1,775/3,165
|
|
0.740 | 0.876 | 0.883 |
| Dielectric loss factor against | Significance | 0 | 0 | 0 |
| 1,697/3,165
|
|
0.691 | 0.769 | 0.856 |
| Dielectric loss factor against | Significance | 0 | 0 | 0 |
| 1,660/3,165
|
|
0.763 | 0.882 | 0.964 |
Fitting results for the interfacial tension of base oil No. 4
| Parameters | Linear equation | Equation of the two degree | Equation of the third degree | |
|---|---|---|---|---|
| Interfacial tension against | Significance | 0 | 0 | 0 |
| 1,775/3,165
|
|
0.787 | 0.886 | 0.942 |
| Interfacial tension against | Significance | 0 | 0 | 0 |
| 1,697/3,165
|
|
0.864 | 0.933 | 0.943 |
| Interfacial tension against | Significance | 0 | 0 | 0 |
| 1,660/3,165
|
|
0.819 | 0.914 | 0.940 |
The fitting curve of the dielectric loss factor and interfacial tension against the peak area ratios of 1,788/3,165, 1,720/3,165, and 1,644/3,165

Fitting curve for dielectric loss factor against peak area ratio of base insulating oil No. 4 (a) fitting curve graph of dielectric loss factor against 1,788/3,165

Fitting curve for interfacial tension against peak area ratio of base insulating oil No. 4 (a) fitting curve graph of interfacial tension against 1,788/3,165
4 Discussion
4.1 Analysis of infrared spectral results
Calemma et al. [33] and Castro et al. [34] showed that the stretching vibrations of the carbonyl groups of ketones, acids, lipids, and aldehydes are all located between 1,850–1,660
4.2 Analysis of correlation results
The peak area ratio of the ageing peak to the reference peak, together with the dielectric loss factor and interfacial tension of the insulating oil sample, was investigated, and the following results were discovered:
The correlation between the dielectric loss factor and the peak area ratios of the 1,775
The correlation between the dielectric loss factor and the peak area ratio of the 1,697 and 1,660
The goodness-of-fit values between the peak area ratio of the 1,697 and 1,660
The correlation between the dielectric loss factor of insulating oil No. 4 and the peak area ratio of 1,644/3,165
5 Conclusion
In summary, the following conclusions can be drawn from this study.
In terms of ageing time order, the characteristic peaks of the four insulating oil samples are 1,660, 1,697, 1,775, and 1,599
The ageing peak of carboxylic acids (C═O) stretching vibration is appeared at 1,697
The correlation between the dielectric loss factors of the four insulating oils and the ageing absorption peaks in the IR wavelength range 1,700 to 1,660
In this article, an innovative method for the evaluation of insulating oil age and latent transformer faults is established by in situ FT-IR. At the same time, a sensor for real-time tracking of the insulation oil age process is developed with much higher accuracy. At the same time, the relationship between the degree of ageing of the insulating oil and the dielectric loss factor and interfacial tension is investigated in greater depth. This method can quickly test the ageing degree of insulating oil and provide a feasible way for online monitoring of transformers and can effectively improve the safety and reliability of transformer operation.
-
Funding information: The research was funded by the China Southern Power Grid Co., Ltd. (Grant Number: GDKJXM20210086).
-
Author contributions: All authors have accepted responsibility for the entire content of this manuscript and approved its submission.
-
Conflict of interest: The authors state no conflict of interest.
References
[1] Pradhan MK, Ramu TS. On the estimation of elapsed life of oil-immersed power transformers. IEEE Trans Power Delivery. 2005;20:1962–9. 10.1109/TPWRD.2005.848663Search in Google Scholar
[2] Zhou C, Jiang S, Yin J, Cai S, Chen Y. Study on the change of acid value of transformer oil during thermal ageing. Insulation Materials. 2015;48:46–48+54. Search in Google Scholar
[3] Barkas DA, Chronis I, Psomopoulos C. Failure mapping and critical measurements for the operating condition assessment of power transformers. Energy Reports. 2022;8:527–47. 10.1016/j.egyr.2022.07.028Search in Google Scholar
[4] Alshehawy AM, Mansour D-EA, Ghali M, Rezk A. Evaluating the impact of ageing in field transformer oil using optical spectroscopy techniques. In: Proceedings of the IEEE 19th International Conference on Dielectric Liquids (ICDL), Manchester, England, 2017 Jun 25–29. 2017. 10.1109/ICDL.2017.8124626Search in Google Scholar
[5] Kohtoh M, Kaneko S, Okabe S, Amimoto T. Aging effect on electrical characteristics of insulating oil in field transformer. IEEE Trans Dielectrics Electr Insulation. 2009;16:1698–706. 10.1109/TDEI.2009.5361592Search in Google Scholar
[6] Zhang BQ, Ma YL, Guan R, Bai ST, Li J, Hu WT. Performance optimization of ANN method for oil chromatography fault diagnosis of oil-filled electrical equipment. Guangdong Electric Power, 2021;34(6):39–47. Search in Google Scholar
[7] Baird PJ, Herman H, Stevens GC, Jarman PN. Non-destructive measurement of the degradation of transformer insulating paper. IEEE Trans Dielectrics Electr Insulation. 2006;13:309–18. 10.1109/TDEI.2006.1624275Search in Google Scholar
[8] Bustamante S, Manana M, Arroyo A, Castro P, Laso A, Martinez R. Dissolved gas analysis equipment for online monitoring of transformer oil: a review. Sensors. 2019;19:4057. 10.3390/s19194057Search in Google Scholar PubMed PubMed Central
[9] Li J, Zhang Q, Wang K, Wang J, Zhou T, Zhang Y. Optimal dissolved gas ratios selected by genetic algorithm for power transformer fault diagnosis based on support vector machine. IEEE Trans Dielectrics Electr Insulation. 2016;23:1198–206. 10.1109/TDEI.2015.005277Search in Google Scholar
[10] Feng L, Meng Y. Experimental study of DL/T 929-2005 “Infrared spectroscopic determination of structural family composition of insulating oils and lubricating oils”. Power Standardization Technol Economy. 2006;1:8–11. Search in Google Scholar
[11] Zhang X, Wang J, Gao Y, Jiao L. Design of a miniature infrared spectrum detection system based on quantum cascade laser. In: Proceedings of the International Conference on Optoelectronic Materials and Devices (ICOMD), Guangzhou, Peoples R China, 2022 Dec 10–12, 2021. 10.1117/12.2628509Search in Google Scholar
[12] Hadjadj Y, Fofana I, Jalbert J, Insulating oil decaying assessment by FTIR and UV-Vis spectrophotometry measurements. In: Proceedings of the IEEE Annual Report Conference on Electrical Insulation and Dielectric Phenomena (CEIDP), Shenzhen, Peoples R China; 2013 Oct 20–23, 2013. p. 1310–3. 10.1109/CEIDP.2013.6748297Search in Google Scholar
[13] Winterfield C, van de Voort FR. Automated acid and base number determination of mineral-based lubricants by Fourier transform infrared spectroscopy: commercial laboratory evaluation. Jala. 2014;19:577–86. 10.1177/2211068214551825Search in Google Scholar PubMed
[14] Meng X, Li L, Ye Q, van de Voort F. Fourier transform infrared (FTIR) spectroscopy as a utilitarian tool for the routine determination of acidity in ester-based oils. J Agricult Food Chem. 2015;63:8333–8. 10.1021/acs.jafc.5b02738Search in Google Scholar PubMed
[15] Zhang J, Ke Y, Ma X, Ma R, He J, Zhang X. Application of modern analytical techniques in transformer oil performance testing. Insulation Materials. 2017;50:15–21. Search in Google Scholar
[16] Hironmay D, Javin N, MunMoonSun N, Superdao J, Dipankar S. Transformer oil quality diagnostic using spectroscopy techniques - a review. ADBU J Electr Electron Eng. 2019;3:43–50. Search in Google Scholar
[17] Zhu X, Zhong C, Zhe J. Lubricating oil conditioning sensors for online machine health monitoring - A review. Tribol Int. 2017;109:473–84. 10.1016/j.triboint.2017.01.015Search in Google Scholar
[18] Leong YS, Ker PJ, Hasnul MH, Khamis MA, Hannan MA, Jamaludin MZ, Looe HM, Portable device for transformer oil inhibitor content analysis using near-infrared spectroscopy wavelength. In: Proceedings of the IEEE-Industry-Applications-Society Annual Meeting, Electr Network, 2020 Oct 10–16, 2020. 10.1109/IAS44978.2020.9334762Search in Google Scholar
[19] Trnka P, Hornak J, Prosr P, Michal O, Wang F. Various ageing processes in a paper-natural ester insulation system in the presence of copper and moisture. IEEE Access. 2010;8:61989–98. 10.1109/ACCESS.2020.2983907Search in Google Scholar
[20] Testing and determination of specific additives in mineral insulating oils. 2015; TS EN 60666-2015. Search in Google Scholar
[21] Chen W. IEC publication 590 (1977) Determination of aromatic hydrocarbon content in new mineral insulating oils. Power capacitors and reactive power compensation. 1978. Search in Google Scholar
[22] Qian Y, Zhao Y, Wang Q. Application of infrared spectroscopy in monitoring the ageing process of transformer oil. In: Proceedings of the 2022 7th Asia Conference on Power and Electrical Engineering (ACPEE); 2022. 10.1109/ACPEE53904.2022.9784028Search in Google Scholar
[23] Wang Y, Wang H, Qian Y, Wang Q. Study on the detection of acid value of insulating oil by infrared spectroscopy. Transformer. 2022;59:55–60. Search in Google Scholar
[24] Liang S. Research on anti-ageing transformer oil and its effect on thermal ageing of insulating paper. Chongqing: Doctoral dissertation of Chongqing University; 2009. Search in Google Scholar
[25] Yang T, Kou X, Zheng H, Chen S, Wang J, Hao J. Application of ternary hybrid insulating oil in old mineral insulating oil transformers at 35 kV in operation. Transformer. 2022;59:32–36. Search in Google Scholar
[26] ASTM D1500-12:2018, Standard Test Method for ASTM Color of Petroleum Products (ASTM Color Scale), American Section of the International Association for Testing Materials. Search in Google Scholar
[27] He L, Xiong C, Ma L, Li Z, Zhang X, Li H. Research on transformer life prediction method considering life differentiation phenomenon. Power Supply. 2022;39:93–100. Search in Google Scholar
[28] IEC 60247:2002, Insulating liquids - Measurement of Relative Permittivity, Dielectric Dissipation Factor (tan d) and d.c. Resistivity. Search in Google Scholar
[29] ISO 6295:1983, Petroleum Products - Mineral oils - Determination of Interfacial Tension of Oil Against Water - Ring Method. Search in Google Scholar
[30] ASTM E1252:2021, Standard Practice for General Techniques for Obtaining Infrared Spectra for Qualitative Analysis. Search in Google Scholar
[31] Peng H. Pearson correlation coefficient applied to medical signal correlation measurement. Electronics World. 2017;7:163. Search in Google Scholar
[32] Polansky R, Prosr P, Vik R, Moravcova D, Pihera J. Comparison of the mineral oil lifetime estimates obtained by differential scanning calorimetry, infrared spectroscopy, and dielectric dissipation factor measurements. Thermochimica Acta. 2017;647:86–93. 10.1016/j.tca.2016.12.002Search in Google Scholar
[33] Calemma V, Iwanski P, Nali M, Scotti R, Montanari L. Structural characterization of asphaltenes of different origins. Energy Fuels. 1995;9:225–30. 10.1021/ef00050a004Search in Google Scholar
[34] Castro LV, Vazquez F. Fractionation and characterization of Mexican crude oils. Energy Fuels. 2009;23:1603–9. 10.1021/ef8008508Search in Google Scholar
[35] Lievens C, Mourant D, He M, Gunawan R, Li X, Li C-Z. An FT-IR spectroscopic study of carbonyl functionalities in bio-oils. Fuel. 2011;90:3417–23. 10.1016/j.fuel.2011.06.001Search in Google Scholar
[36] US-ASTM D02. 96. Standard Practice for Condition Monitoring of Used Lubricants by Trend Analysis Using Fourier Transform Infrared (FT-IR) Spectrometry: ASTM E2412-2010[S]. Philadelphia: ASTM; 2010. Search in Google Scholar
© 2023 the author(s), published by De Gruyter
This work is licensed under the Creative Commons Attribution 4.0 International License.
Articles in the same Issue
- Regular Articles
- Dynamic properties of the attachment oscillator arising in the nanophysics
- Parametric simulation of stagnation point flow of motile microorganism hybrid nanofluid across a circular cylinder with sinusoidal radius
- Fractal-fractional advection–diffusion–reaction equations by Ritz approximation approach
- Behaviour and onset of low-dimensional chaos with a periodically varying loss in single-mode homogeneously broadened laser
- Ammonia gas-sensing behavior of uniform nanostructured PPy film prepared by simple-straightforward in situ chemical vapor oxidation
- Analysis of the working mechanism and detection sensitivity of a flash detector
- Flat and bent branes with inner structure in two-field mimetic gravity
- Heat transfer analysis of the MHD stagnation-point flow of third-grade fluid over a porous sheet with thermal radiation effect: An algorithmic approach
- Weighted survival functional entropy and its properties
- Bioconvection effect in the Carreau nanofluid with Cattaneo–Christov heat flux using stagnation point flow in the entropy generation: Micromachines level study
- Study on the impulse mechanism of optical films formed by laser plasma shock waves
- Analysis of sweeping jet and film composite cooling using the decoupled model
- Research on the influence of trapezoidal magnetization of bonded magnetic ring on cogging torque
- Tripartite entanglement and entanglement transfer in a hybrid cavity magnomechanical system
- Compounded Bell-G class of statistical models with applications to COVID-19 and actuarial data
- Degradation of Vibrio cholerae from drinking water by the underwater capillary discharge
- Multiple Lie symmetry solutions for effects of viscous on magnetohydrodynamic flow and heat transfer in non-Newtonian thin film
- Thermal characterization of heat source (sink) on hybridized (Cu–Ag/EG) nanofluid flow via solid stretchable sheet
- Optimizing condition monitoring of ball bearings: An integrated approach using decision tree and extreme learning machine for effective decision-making
- Study on the inter-porosity transfer rate and producing degree of matrix in fractured-porous gas reservoirs
- Interstellar radiation as a Maxwell field: Improved numerical scheme and application to the spectral energy density
- Numerical study of hybridized Williamson nanofluid flow with TC4 and Nichrome over an extending surface
- Controlling the physical field using the shape function technique
- Significance of heat and mass transport in peristaltic flow of Jeffrey material subject to chemical reaction and radiation phenomenon through a tapered channel
- Complex dynamics of a sub-quadratic Lorenz-like system
- Stability control in a helicoidal spin–orbit-coupled open Bose–Bose mixture
- Research on WPD and DBSCAN-L-ISOMAP for circuit fault feature extraction
- Simulation for formation process of atomic orbitals by the finite difference time domain method based on the eight-element Dirac equation
- A modified power-law model: Properties, estimation, and applications
- Bayesian and non-Bayesian estimation of dynamic cumulative residual Tsallis entropy for moment exponential distribution under progressive censored type II
- Computational analysis and biomechanical study of Oldroyd-B fluid with homogeneous and heterogeneous reactions through a vertical non-uniform channel
- Predictability of machine learning framework in cross-section data
- Chaotic characteristics and mixing performance of pseudoplastic fluids in a stirred tank
- Isomorphic shut form valuation for quantum field theory and biological population models
- Vibration sensitivity minimization of an ultra-stable optical reference cavity based on orthogonal experimental design
- Effect of dysprosium on the radiation-shielding features of SiO2–PbO–B2O3 glasses
- Asymptotic formulations of anti-plane problems in pre-stressed compressible elastic laminates
- A study on soliton, lump solutions to a generalized (3+1)-dimensional Hirota--Satsuma--Ito equation
- Tangential electrostatic field at metal surfaces
- Bioconvective gyrotactic microorganisms in third-grade nanofluid flow over a Riga surface with stratification: An approach to entropy minimization
- Infrared spectroscopy for ageing assessment of insulating oils via dielectric loss factor and interfacial tension
- Influence of cationic surfactants on the growth of gypsum crystals
- Study on instability mechanism of KCl/PHPA drilling waste fluid
- Analytical solutions of the extended Kadomtsev–Petviashvili equation in nonlinear media
- A novel compact highly sensitive non-invasive microwave antenna sensor for blood glucose monitoring
- Inspection of Couette and pressure-driven Poiseuille entropy-optimized dissipated flow in a suction/injection horizontal channel: Analytical solutions
- Conserved vectors and solutions of the two-dimensional potential KP equation
- The reciprocal linear effect, a new optical effect of the Sagnac type
- Optimal interatomic potentials using modified method of least squares: Optimal form of interatomic potentials
- The soliton solutions for stochastic Calogero–Bogoyavlenskii Schiff equation in plasma physics/fluid mechanics
- Research on absolute ranging technology of resampling phase comparison method based on FMCW
- Analysis of Cu and Zn contents in aluminum alloys by femtosecond laser-ablation spark-induced breakdown spectroscopy
- Nonsequential double ionization channels control of CO2 molecules with counter-rotating two-color circularly polarized laser field by laser wavelength
- Fractional-order modeling: Analysis of foam drainage and Fisher's equations
- Thermo-solutal Marangoni convective Darcy-Forchheimer bio-hybrid nanofluid flow over a permeable disk with activation energy: Analysis of interfacial nanolayer thickness
- Investigation on topology-optimized compressor piston by metal additive manufacturing technique: Analytical and numeric computational modeling using finite element analysis in ANSYS
- Breast cancer segmentation using a hybrid AttendSeg architecture combined with a gravitational clustering optimization algorithm using mathematical modelling
- On the localized and periodic solutions to the time-fractional Klein-Gordan equations: Optimal additive function method and new iterative method
- 3D thin-film nanofluid flow with heat transfer on an inclined disc by using HWCM
- Numerical study of static pressure on the sonochemistry characteristics of the gas bubble under acoustic excitation
- Optimal auxiliary function method for analyzing nonlinear system of coupled Schrödinger–KdV equation with Caputo operator
- Analysis of magnetized micropolar fluid subjected to generalized heat-mass transfer theories
- Does the Mott problem extend to Geiger counters?
- Stability analysis, phase plane analysis, and isolated soliton solution to the LGH equation in mathematical physics
- Effects of Joule heating and reaction mechanisms on couple stress fluid flow with peristalsis in the presence of a porous material through an inclined channel
- Bayesian and E-Bayesian estimation based on constant-stress partially accelerated life testing for inverted Topp–Leone distribution
- Dynamical and physical characteristics of soliton solutions to the (2+1)-dimensional Konopelchenko–Dubrovsky system
- Study of fractional variable order COVID-19 environmental transformation model
- Sisko nanofluid flow through exponential stretching sheet with swimming of motile gyrotactic microorganisms: An application to nanoengineering
- Influence of the regularization scheme in the QCD phase diagram in the PNJL model
- Fixed-point theory and numerical analysis of an epidemic model with fractional calculus: Exploring dynamical behavior
- Computational analysis of reconstructing current and sag of three-phase overhead line based on the TMR sensor array
- Investigation of tripled sine-Gordon equation: Localized modes in multi-stacked long Josephson junctions
- High-sensitivity on-chip temperature sensor based on cascaded microring resonators
- Pathological study on uncertain numbers and proposed solutions for discrete fuzzy fractional order calculus
- Bifurcation, chaotic behavior, and traveling wave solution of stochastic coupled Konno–Oono equation with multiplicative noise in the Stratonovich sense
- Thermal radiation and heat generation on three-dimensional Casson fluid motion via porous stretching surface with variable thermal conductivity
- Numerical simulation and analysis of Airy's-type equation
- A homotopy perturbation method with Elzaki transformation for solving the fractional Biswas–Milovic model
- Heat transfer performance of magnetohydrodynamic multiphase nanofluid flow of Cu–Al2O3/H2O over a stretching cylinder
- ΛCDM and the principle of equivalence
- Axisymmetric stagnation-point flow of non-Newtonian nanomaterial and heat transport over a lubricated surface: Hybrid homotopy analysis method simulations
- HAM simulation for bioconvective magnetohydrodynamic flow of Walters-B fluid containing nanoparticles and microorganisms past a stretching sheet with velocity slip and convective conditions
- Coupled heat and mass transfer mathematical study for lubricated non-Newtonian nanomaterial conveying oblique stagnation point flow: A comparison of viscous and viscoelastic nanofluid model
- Power Topp–Leone exponential negative family of distributions with numerical illustrations to engineering and biological data
- Extracting solitary solutions of the nonlinear Kaup–Kupershmidt (KK) equation by analytical method
- A case study on the environmental and economic impact of photovoltaic systems in wastewater treatment plants
- Application of IoT network for marine wildlife surveillance
- Non-similar modeling and numerical simulations of microploar hybrid nanofluid adjacent to isothermal sphere
- Joint optimization of two-dimensional warranty period and maintenance strategy considering availability and cost constraints
- Numerical investigation of the flow characteristics involving dissipation and slip effects in a convectively nanofluid within a porous medium
- Spectral uncertainty analysis of grassland and its camouflage materials based on land-based hyperspectral images
- Application of low-altitude wind shear recognition algorithm and laser wind radar in aviation meteorological services
- Investigation of different structures of screw extruders on the flow in direct ink writing SiC slurry based on LBM
- Harmonic current suppression method of virtual DC motor based on fuzzy sliding mode
- Micropolar flow and heat transfer within a permeable channel using the successive linearization method
- Different lump k-soliton solutions to (2+1)-dimensional KdV system using Hirota binary Bell polynomials
- Investigation of nanomaterials in flow of non-Newtonian liquid toward a stretchable surface
- Weak beat frequency extraction method for photon Doppler signal with low signal-to-noise ratio
- Electrokinetic energy conversion of nanofluids in porous microtubes with Green’s function
- Examining the role of activation energy and convective boundary conditions in nanofluid behavior of Couette-Poiseuille flow
- Review Article
- Effects of stretching on phase transformation of PVDF and its copolymers: A review
- Special Issue on Transport phenomena and thermal analysis in micro/nano-scale structure surfaces - Part IV
- Prediction and monitoring model for farmland environmental system using soil sensor and neural network algorithm
- Special Issue on Advanced Topics on the Modelling and Assessment of Complicated Physical Phenomena - Part III
- Some standard and nonstandard finite difference schemes for a reaction–diffusion–chemotaxis model
- Special Issue on Advanced Energy Materials - Part II
- Rapid productivity prediction method for frac hits affected wells based on gas reservoir numerical simulation and probability method
- Special Issue on Novel Numerical and Analytical Techniques for Fractional Nonlinear Schrodinger Type - Part III
- Adomian decomposition method for solution of fourteenth order boundary value problems
- New soliton solutions of modified (3+1)-D Wazwaz–Benjamin–Bona–Mahony and (2+1)-D cubic Klein–Gordon equations using first integral method
- On traveling wave solutions to Manakov model with variable coefficients
- Rational approximation for solving Fredholm integro-differential equations by new algorithm
- Special Issue on Predicting pattern alterations in nature - Part I
- Modeling the monkeypox infection using the Mittag–Leffler kernel
- Spectral analysis of variable-order multi-terms fractional differential equations
- Special Issue on Nanomaterial utilization and structural optimization - Part I
- Heat treatment and tensile test of 3D-printed parts manufactured at different build orientations