
Psychological factors of the transfer of control in an automated vehicle
-
Ewa Odachowska
 ,
Monika Ucińska
,
Monika Ucińska

Abstract
In accordance with the requirements of the NHTSA guidelines on Level 3 automation, the comfortable control transition times is about 40 seconds. The data obtained so far are consistent with the assumption that the situation is better when drivers receive a warning about critical events than when they have to take over control unexpectedly. How these variables are shaped in the presence of distractors and what influences psychological factors have on these aspects remains unknown. For this purpose, a research experiment was developed in which control was taken over when the driver was additionally forced to perform the indicated activity (e.g. by looking away from the road), or when road conditions made it impossible to focus on the road. Psychological (temperament) and psychomotor variables (reaction time, hand–eye coordination) were controlled. The study was conducted on active road traffic participant drivers (N=95). Not only the time of taking control was analyzed, but also the way that may have a significant impact on road safety. The results revealed a significant influence of distractors on the manner control is taken over. In the conditions without distractors, the subjects were more likely to take over control than to cause automatic braking.
1 Introduction
The progressive development of the automotive industry towards vehicle automation sets new requirements for drivers alike. At present, it is not possible to pass the full control over to the vehicle as a fully automated vehicle fitted with technologies enabling the system to perform all driving functions without any human intervention is not yet allowed to operate in road traffic. In NHTSA automation level 3 – 4 vehicles, i.e. where partial automation is present, drivers are obliged to react appropriately when the system reports such a necessity, i.e. in situations that go beyond the capabilities CAV technology. The driver's ability to take over control after the period of automated driving depends on the transition request conditions. The control transition may be expected by the driver, for instance, in a situation where the automated system is deactivated before leaving the freeway. It may also be unexpected, for instance, in the case of a critical road incident at a time that would normally be the period of automated driving (i.e. other vehicle stopped on the lane, road accident, crosswalk). It is preferable when drivers expect the necessity to take over control of the vehicle compared to when they are suddenly forced to take it. The unexpected need to take over control under time pressure is a heavy burden to the driver [18].
Critical road incidents are a major problem for drivers. In such situations, it is noted that drivers exhibit worse driving parameters (i.e. longer reaction times, collisions or accidents) in partial automation conditions than they do in manual driving conditions [2, 14]. Such drivers abuse the brake pedal more often, look into the rear-view mirrors less often, have problems with maintaining a constant speed and lane position [6, 7]. They also keep shorter minimum distances from the preceding vehicle. Drivers’ coping mechanisms are much poorer at vehicle control transition. In unexpected critical situations, especially when the drivers have a high level of trust in the system [15].
Moreover, secondary tasks performed during driving have an impact on drivers’ behavior during control transition as well. Such operations are responsible for the deterioration of the ability to supervise automation [4,5,6, 12, 16, 20]. According to the available studies, it may be concluded that operations requiring visual attention, thus causing distraction from the road, and operations requiring special involvement, such as the cognitive ones, are particularly harmful. Auditory tasks cause less distraction [17]. Moreover, weather conditions, the road situation, and traffic volume have an equally important influence on the driver's behavior during the transition, and they may modify the secondary task influence [1, 8, 16, 19]. However, there are still studies in which the influence of cognitive load, i.e. the secondary task influence on the control transition time, has not been observed [11].
Driver experience and adaptation to the automation system also influences driver control. Drivers with little experience in driving in automation mode tend to be more cautious, i.e., they do not transit control to the system or continuously monitor the system operation and take over manual control even before the system starts to react to a critical situation [9, 10]. There is no clear consensus on how much time it takes for the driver to notice that the system is unable to cope with the situation and that they need to replace the automation and take over control of the vehicle. Studies suggest that they need about 15 seconds to resume control of the vehicle and up to 40 seconds to stabilize it [13]. In the experiment by Merat et al. [13], when the driver was attentive and the need to take over control was predictable and expected, it took on average 10 seconds to regain proper control of the vehicle. In this situation, the drivers’ position in the lane was also more stable. When the drivers were less attentive, it took about 35–40 seconds to resume control. This means that the response time is almost 3–4 times longer under conditions of distraction.
The question of how these variables look in the situation of distractors is still valid. The deficit of this type of exploration studies makes it still impossible to answer many research questions related to this topic. Elements concerning psychological factors connected with the driver's taking control of an automated vehicle certainly needed to be clarified. For this purpose, a study was designed to check the impact of limited driver situational awareness on the control transition operation in the event of turning off the automated driving system. Also selected psychophysical factors related to the driver's responses were considered.
2 Methodology
The research purposes consisting of the analysis of psychological parameters related to vehicle control transition were achieved during an experimental study. The study was designed with the use of a high-class AS1200-6 driving simulator, which is used in psychological driver testing, enabling the measurement of driving parameters, selected psychological factors relevant to the process of control transition (reaction time, eye-hand coordination, temperament).
The manner of driving, the moment of control transition, and driver behavior were analyzed using data from the AS1200-6 Driving Simulator. Reaction time and psychomotor parameters in the form of eye-hand coordination were evaluated using testing equipment such as the Vienna Testing System (WTS), Reaction Time Meter (MCR) and visual-motor tester (AK). Temperament was evaluated using Temperament Questionnaire PTS by Strelau and Zawadzki (1998).
The experimental scheme study involved 95 subjects (47 women and 48 men), the average age was (M = 35.05). Participation required a suitable passenger car driving license (cat. B in Poland) and active road traffic participation for at least six months. Recruiting was outsourced, and participants were paid for their participation in the study.
The study was individual. Each participant of the study before the test drives proceeded to the adaptation on the simulator. The adaptation study was conducted on a freeway section with three lanes per direction. In the first part of the adaptation, the participants learned how to drive with the automatic control system. In the second part, the subjects drove in a convoy behind another vehicle. Their task was to maintain an appropriate distance of about 35m from the preceding vehicle, performing acceleration and deceleration maneuvers, without overtaking.
Adaptation was followed by the appropriate research part consisting of two stages. The first one analyzed the psychological parameters (reaction time with choice – RT/S3 WST; simple and complex reaction time – MCR, eye-hand coordination – AK; temperament – PTS), while the second one included an experiment using a driving simulator.
The experimental drive scenario was designed in three variants (one variant in neutral conditions, and two variants with distractors). Subjects were randomly assigned to 3 groups, each of them driving a different type of scenario: (1) none distraction to the driver's attention; (2) a fog-type distractor, (3) a distractor as a SURT task to be performed (SURT is a task where participant need to find the largest circle out of several circles appearing on the tablet screen).
Each drive took place on a freeway section with three lanes per direction. There was little road traffic, and the person under examination was instructed to drive in the middle lane while maintaining a speed of approx. 100 km/h (about 62 mph). After several seconds, a message was displayed on the screen, telling the subject to activate the automated driving mode (using the appropriate console button). After switching it on, the subject was asked to remove their leg from the pedals and hands from the steering wheel. The subject could change the vehicle speed by pressing console buttons. After reaching the required scenario place (accident, blocking traffic), the subject received another message to take over control of the vehicle.
In variant without a distractor (1), after arriving at the incident scene, the subject was informed about the need to take over control of the vehicle (audible and visual information on control transition was displayed on the projector screen). Control transition took place in three ways: (a) change of the lane by the driver (remaining in an automated driving mode), (b) pressing one of the pedals (braking, accelerating), (c) in case of no response from the subject (or as a result of too slow or delayed response), the vehicle performed the braking maneuver itself.
After passing the obstacle (danger), a message asking to activate the automated driving mode again was displayed. The situation was repeated 3 times.
In variant (2), the driver drove in conditions of limited visibility (fog) from the beginning, and the operations were the same as in variant 1 (to take over control 3 times after reaching the obstacle).
In variant (3), the driver drove in good road conditions. While driving in automated mode, the SURT task was switched on, and it was performed on a tablet by the subject.
3 Analysis result
The analysis included variables from psychological research and an experiment conducted on a driving simulator. The RT/S3 Test – Reaction Time Test, which is part of the Vienna Testing System, was used to test the following: average reaction time, average motor time, response dispersion time rate, motor dispersion time rate, correct responses, missed responses, incomplete responses, and wrong responses. The reaction parameters meter (MCR Test) was used to differentiate correct, wrong, missed responses. The average reaction time and the range (deviation) of reaction times were also evaluated. Under the eye-hand coordination test, the following were measured: average reaction time, correct responses, wrong responses, missed responses. The last task was to fill in the Temperament Questionnaire PTS. It was used to determine the following parameters: Force of the Stimulation Process (SPP), Force of the Inhibition Process (SPH), and Mobility of Nervous Impulses (RPP).
When analyzing data from the driving simulator, it was important to determine how different experimental conditions affected the control transition, whether the time was also affected by the test, and whether there was a visible learning effect, and how individual variables were related to the response time to the control transition call under different conditions.
The experiment registered the following indicators of direct driver behavior and traffic parameters such as:
average and standard deviations for the take over reaction time (i.e. until taking control or changing the lane or braking before the road incident);
method of taking control;
automatic driving modes (if the subject drove in such a mode, or took over control).
In the first stage of the analysis, the differences in the Take Over reaction time were determined depending on the type of distractor and test. For this purpose, the analysis of variance with repeated measurements in the 3 (test 1, 2, 3) × 3 (a type of distractor: none, fog, SURT) scheme was carried out. The results of the analysis demonstrated that the testing effect was significant: F(2.81) = 50.07, p < .001, eta2p = .38 – this means that the subjects had different response times from one test to another. Post-hoc tests (of the least significant differences) revealed that each of the tests was different from the others, p < .001, which means that the subjects achieved the shortest times of taking over control in the last, third test, while the longest reaction times were those in test 1.
Average test-dependent Take Over reaction time (incl. confidence intervals), N = 95.
| Test | M | SD | 95% CI | |
|---|---|---|---|---|
| LL | UL | |||
| 1 | 5,723 | ,320 | 5,086 | 6,361 |
| 2 | 3,836 | ,207 | 3,424 | 4,248 |
| 3 | 2,777 | ,128 | 2,523 | 3,031 |
Furthermore, the analysis of variance revealed a significant effect of the task variant on the trend level, F(2.81) = 2.89, p = .061, stage 2 = .067. Post-hoc analyses (without correction for multiple comparisons) demonstrated that, in the no-distractor drive variant and the fog drive variant, take over reaction time was significantly different, p = .019. Longer response times were recorded in the fog drive variant. Average variant-dependent reaction times are presented in Table 2. In other conditions, take over reaction times did not vary.
Average drive variant-dependent response times, N = 95.
| Distractor | M | SD | 95% CI | |
|---|---|---|---|---|
| LL | UL | |||
| none | 3.636 | .265 | 3.109 | 4.163 |
| fog | 4.541 | .270 | 4.005 | 5.078 |
| SURT | 4.159 | .275 | 3.613 | 4.705 |
The effect of interaction between the driving conditions and the test proved to be insignificant, F(4.81) = 0.53, p = .67, eta2p = .013. The achieved main test effect was not modified by the type of distractor. The subjects did better (they responded faster) in the last test than in the second and first tests, regardless of whether they drove without a distractor, in fog, or had to perform a SURT task. Average times for the tests depending on the variant of distractor are shown in the diagram below (Figure 1).
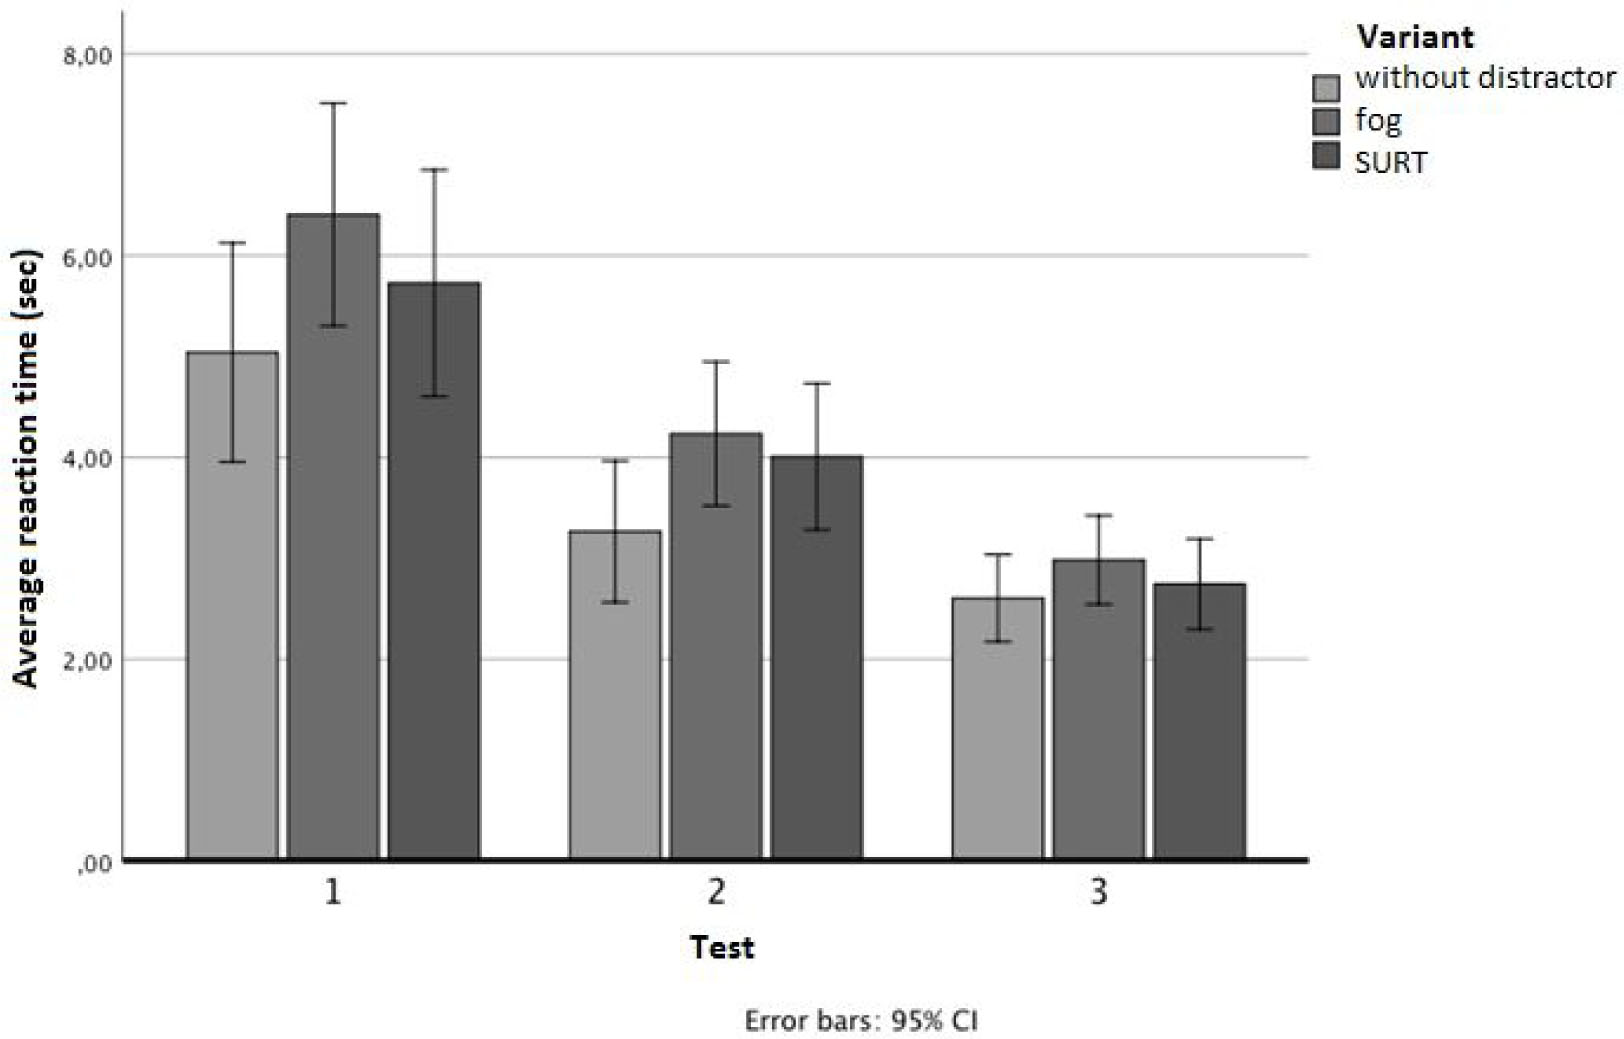
Average distractor variant-dependent test times, N = 95.
The tests also analyzed how drivers took control. In the beginning, the analyses were carried out to answer the question whether, in the course of the tests, the drives with different distractors differed in the manner they took control. The analyses were carried out using the multiple non-parametric H Kruskal-Wallis tests. In the course of the analyses, pairs of manners of executing control transition were compared to determine which of the two manners was more frequent. The results showed a significant influence of distractors on the manner control was taken over in test 3 when automatic braking and lane change were compared (H = 9.105, p = .011), in test 1 when automatic braking and frequency of control transition were compared (H = 9.34, p = .009 and in test 3 when lane change and control transition were compared (H = 7.63, p = .022). The distractor effect was significant at the statistical trend level in test 2, when automatic braking and control acquisition were compared (p = .09).
The post-hoc tests carried out using the Man-Whitney U test showed that conditions without distractors and with fog differed significantly in test 1 in terms of the share of automatic braking and control acquisition (U = 299, Z = −2.87, p = .004). While in conditions without distractors, the frequency of vehicle control transition was much more frequent (in 28 cases) than braking (2 cases), in conditions with fog, the frequency of automatic braking increased (11 vs. 18). The interpretation of the results for test 2 using post-hoc tests showed that conditions without distractors and with fog differentiated the test subjects’ responses in terms of the frequency of automatic braking and vehicle control (U = 319, Z = −2.18, p = .029). In conditions without distractors, the test subjects were more likely to take over control (26 times) than to achieve automatic braking (3). However, in conditions where they drove in fog, braking was more frequent (10), and thus the proportion of braking events and control (19) was more even. In the case of test 3, the post-hoc tests showed a difference in the proportion of the chosen response depending on the conditions (U = 161, Z = −2.69, p = .007). During the fog condition, the subjects did not change lanes but took control of the vehicle (0 vs. 19), while under good weather conditions, the lane change response was not so rare (8 vs. 17). Furthermore, the automatic braking to lane change rate ratio differed in test 3 and was distractor dependent (U = 25.00, Z = −3.00, p = .003); when without a distractor, this proportion was relatively balanced (5 – automatic braking vs. 8 – lane change); in fog conditions, all events ended in automatic braking (N = 10). The proportion of such events also differed between fog conditions and SURT (U = 35, Z = −2.06, p = .039), where automatic braking and lane change were similarly frequent in the latter ones (7 vs. 4 respectively).
In conclusion, under fog conditions, the test subjects were more likely to allow automatic braking or take over control of the vehicle, while under good weather conditions automatic braking was much less frequent. This pattern repeated itself during all three tests.
In the case of psychological variables, the analyses included the correlation between temperament (PTS) and psychomotor parameters in terms of response times, too. The analyses did not show the correlation between temperament and response times in tests 1 and 2, while the response time decreased with the increase in MRI (mobility of nervous processes) in test 3. However, as for the averaged response time rate, the correlations with temperament turned out to be irrelevant. Regression analyses using the Hayes PROCESSES macro did not show significant interactions between the type of distractor and PTS scales, so the temperament did not modulate the response time to a call for control transition under different conditions.
In the Reaction Time Test (WST), the average response time was positively correlated with the average response time to a call for control transition, r = .23, p = .029; the longer the average response time in the Reaction Time Test (WST), the longer the response time to a call for control transition. The remaining test indicators were not correlated with the response times to a call for control transition. Furthermore, models for each of the indicators of the continuous Reaction Time Test (WTS) were tested as a moderator of the effect of a condition on the response time to a call for control transition. Regression analysis by bootstrapping method showed no significant interactions between the distractor variant with the Reaction Time Test (WST) indicators.
Pearson's r correlation analysis showed no correlation between the MCR test indicators in simple responses and the reaction time to a call for control transition in any test. For complex responses, a positive correlation was observed between the reaction time in test 1 and the maximum reaction time, r = .22, p = .037, and the minimum response time, r = .21, p = .040. The higher the minimum and maximum reaction time in complex responses, the longer the reaction times to the call for control transition in test 1.
It should be noted, however, that, in the case of wrong or missed responses, the indicators for the vast majority of subjects were zero, so further analyses were not conducted for such variables. For the remaining variables (continuous variables), moderation analyses were then performed using regression with the PROCESS macro, testing whether the response times and the number of correct responses in the MCR test modify the average response time to a call for control transition under different test conditions. The results showed that none of the MCR test indicators modified the response time to a control call under the three conditions.
4 Results – discussion
Summarizing, the results of statistical analyzes showed that in conditions without distractors, the subjects took control more often, e.g. by changing lanes, than by automatic braking. However, in conditions with a fog distractor, automatic braking was more frequent. In such situations, drivers did not change lanes, while in good weather conditions, the lane change response was frequent. There are analyses showing that a difficult road situation, caused by e.g. weather conditions, may lead to a mental strain and the development of the so-called emotional swing, during which thoughtless behavior may occur [3]. In this case, the thoughtlessness resulting from a stressful situation could lead to making decisions that are not fully adequate.
Other analyses [13] have shown that the control transition time is almost 3–4 times longer under conditions of distraction. This has not been proven in this case. It turned out that the subjects differed in terms of response times between tests, but the shortest response times were achieved in the last test (with a distractor), while the longest response times were achieved in the first test (without a distractor). This is consistent with the analyses proving the lack of influence of cognitive load, i.e. the influence of the additional operation on the control transition time [11]. However, such results may be associated with the learning effect, which, in turn, is confirmed by the research on the shorter control transition time when the necessity of transition is predictable and expected [13]. According to earlier reports, the unforeseen need to take over control under time pressure is associated with a heavy strain on the driver [18].
The presented analyses also showed that the tendency to react in a certain manner is not related to temperament, but the influence of psychomotor abilities on the speed of responding to a call for control transition was noted. As assumed, it was found that the average driver response time is related to the speed of responding to a call for control transition. The longer the response time was observed for the driver, the more time they needed to take over control of the vehicle.
5 Conclusions
The conducted analyses lead to conclusions having a real impact on road safety. The results of this experiment confirm that the driver's experience and familiarity with automation have an impact on the control over autonomous systems. This is evidenced by the differences in the reaction times of drivers between individual trials and a noticeable learning effect. Therefore, it is extremely important to train and provide drivers with information on the systems their vehicles are equipped with. Having to take control under time pressure can put a lot of stress on the driver, especially in difficult weather conditions, in heavy traffic, or when the driver is concentrating on activities other than driving. In such situations, inadequate reactions can easily occur as a result of unreflectiveness. Drivers’ knowledge of the systems in the vehicle is essential for proper monitoring, understanding, and efficient error response.
This study did not show any impact of the secondary task on takeover time. However, it was shown that in conditions without distractors, the drivers more often took control, e.g. by changing lanes, than they led to automatic braking. In contrast, in conditions with a fog distractor, automatic braking occurred more often. More research is needed on this issue.
References
[1] Carsten O, Lai FCH, Barnard Y, Jamson AH, Merat N. Control task substitution in semi-automated driving: Does it matter what aspects are automated? Human Factors, 2012, 54, 747–76110.1177/0018720812460246Suche in Google Scholar PubMed
[2] Damböck D, Bengler K, Farid M, Tönert L. Übernahmezeiten beim hochautomatisierten Fahren. Tagung Fahrerassistenz. München, 2012, vol 15, pp 16.Suche in Google Scholar
[3] Doliński D, Odachowska E. Beware when danger on the road has passed. The state of relief impairs a driver's ability to avoid accidents. Accident Analysis & Prevention; Vol. 115, June 2018, Pages 73–7810.1016/j.aap.2018.03.007Suche in Google Scholar PubMed
[4] Eriksson A, Stanton NA. Take-over time in highly automated vehicles: non-critical transitions to and from manual control, Human Factors, 2017, DOI: 10.1177/0018720816685832Suche in Google Scholar PubMed
[5] Feldhütter A, Gold C, Schneider S, Bengler K. How the Duration of Automated Driving Influences Take-Over Performance and Gaze Behavior. Paper presented at the Arbeit in komplexen Systemen – Digital, vernetz, human?! 62. Kongress der Gesellschaft für Arbeitswissenschaft, 201610.1007/978-3-662-53305-5_22Suche in Google Scholar
[6] Gold C, Damböck D, Lorenz L, Bengler K. Take over!. How long does it take to get the driver back into the loop? Paper presented at the Proceedings of the Human Factors and Ergonomics Society Annual Meeting, 201310.1177/1541931213571433Suche in Google Scholar
[7] Gold C, Korber M, Lechner D, Bengler K. Taking Over Control From Highly Automated Vehicles in Complex Traffic Situations: The Role of Traffic Density. Hum Factors, 201610.1177/0018720816634226Suche in Google Scholar PubMed
[8] Jamson AH, Merat N, Carsten OMJ, Lai FCH. Behavioural changes in drivers experiencing highly-automated vehicle control in varying traffic conditions, Transportation Research Part C: Emerging Technologies, 116–125, 201310.1016/j.trc.2013.02.008Suche in Google Scholar
[9] Larsson AFL, Automation and the nature of driving. The effect of adaptive cruise control on drivers’ tactical driving decisions, thesis presented at the Lund University, 2013Suche in Google Scholar
[10] Larsson AFL, Kircher K, Hultgren JA. Learning from experience: Familiarity with ACC and responding to a cut-in situation in automated driving. Transportation Research Part F, 27 Part B, 229–237, 201410.1016/j.trf.2014.05.008Suche in Google Scholar
[11] Louw T, Merat N, Jamson H. Engaging with Highly Automated Driving: To be or Not to be in the Loop? Paper presented at the 8th International Driving Symposium on Human Factors in Driver Assessment, Training and Vehicle Design, At Salt Lake City, Utah, USA, 201510.17077/drivingassessment.1570Suche in Google Scholar
[12] Melcher V, Rauh S, Diederichs F. Widlroither H, Bauer W. Take-Over Requests for Automated Driving. Procedia Manufacturing, 2015, vol 3, pp 2867–287310.1016/j.promfg.2015.07.788Suche in Google Scholar
[13] Merat N, Jamson AH, Lai F, Daly M, Carsten O. Transition to manual: Driver behaviour when resuming control from a highly automated vehicle. Transportation Research Part F: Traffic Psychology and Behaviour, 2014, 26, 1–9.10.1016/j.trf.2014.09.005Suche in Google Scholar
[14] Naujoks F, Mai C, Nekum A. The effect of urgency of take-over requests during highly automated driving under distracted conditions. Paper presented at the 5th International Conference on Applied Human Factors and Ergonomics AHFE 2014, Krakow, PolandSuche in Google Scholar
[15] Payre W, Cestac J, Delhomme P. Fully Automated Driving: Impact of Trust and Practice on Manual Control Recovery. Hum Factors, 2016, vol 58, no 2, pp 229–241.10.1177/0018720815612319Suche in Google Scholar PubMed
[16] Radlmayr J, Gold C, Lorenz L, Farid M, Bengler K. How Traffic Situations and NonDriving Related Tasks Affect the Take-Over Quality in Highly Automated Driving. Proceedings of the Human Factors and Ergonomics Society Annual Meeting, 2014, vol 58, no 1, pp 2063–2067.10.1177/1541931214581434Suche in Google Scholar
[17] Spiessl W, Hussmann H. Assessing error recognition in automated driving, IET Intelligent Transport Systems, 2011, vol. 5, issue 2, 103–11110.1049/iet-its.2010.0102Suche in Google Scholar
[18] Vahidi A, Eskandarian A. Research advances in intelligent collision avoidance and adaptive cruise control. IEEE Transactions on Intelligent Transportation Systems, 2003, 4(3), 143–153.10.1109/TITS.2003.821292Suche in Google Scholar
[19] Vollrath M, Schleicher S, Gelau C. The influence of Cruise Control and Adaptive Cruise Control on driving behaviour – A driving simulator study, Accident Analysis & Prevention, 2011, 43, 1134–113910.1016/j.aap.2010.12.023Suche in Google Scholar PubMed
[20] Zeeb K, Buchner A, Schrauf M. What determines the take-over time? An integrated model approach of driver take-over after automated driving. Accident Analysis & Prevention, 2015, vol 78, pp 212–210.1016/j.aap.2015.02.023Suche in Google Scholar PubMed
© 2021 Ewa Odachowska et al., published by De Gruyter
This work is licensed under the Creative Commons Attribution 4.0 International License.
Artikel in diesem Heft
- Regular Articles
- Electrochemical studies of the synergistic combination effect of thymus mastichina and illicium verum essential oil extracts on the corrosion inhibition of low carbon steel in dilute acid solution
- Adoption of Business Intelligence to Support Cost Accounting Based Financial Systems — Case Study of XYZ Company
- Techno-Economic Feasibility Analysis of a Hybrid Renewable Energy Supply Options for University Buildings in Saudi Arabia
- Optimized design of a semimetal gasket operating in flange-bolted joints
- Behavior of non-reinforced and reinforced green mortar with fibers
- Field measurement of contact forces on rollers for a large diameter pipe conveyor
- Development of Smartphone-Controlled Hand and Arm Exoskeleton for Persons with Disability
- Investigation of saturation flow rate using video camera at signalized intersections in Jordan
- The features of Ni2MnIn polycrystalline Heusler alloy thin films formation by pulsed laser deposition
- Selection of a workpiece clamping system for computer-aided subtractive manufacturing of geometrically complex medical models
- Development of Solar-Powered Water Pump with 3D Printed Impeller
- Identifying Innovative Reliable Criteria Governing the Selection of Infrastructures Construction Project Delivery Systems
- Kinetics of Carbothermal Reduction Process of Different Size Phosphate Rocks
- Plastic forming processes of transverse non-homogeneous composite metallic sheets
- Accelerated aging of WPCs Based on Polypropylene and Birch plywood Sanding Dust
- Effect of water flow and depth on fatigue crack growth rate of underwater wet welded low carbon steel SS400
- Non-invasive attempts to extinguish flames with the use of high-power acoustic extinguisher
- Filament wound composite fatigue mechanisms investigated with full field DIC strain monitoring
- Structural Timber In Compartment Fires – The Timber Charring and Heat Storage Model
- Technical and economic aspects of starting a selected power unit at low ambient temperatures
- Car braking effectiveness after adaptation for drivers with motor dysfunctions
- Adaptation to driver-assistance systems depending on experience
- A SIMULINK implementation of a vector shift relay with distributed synchronous generator for engineering classes
- Evaluation of measurement uncertainty in a static tensile test
- Errors in documenting the subsoil and their impact on the investment implementation: Case study
- Comparison between two calculation methods for designing a stand-alone PV system according to Mosul city basemap
- Reduction of transport-related air pollution. A case study based on the impact of the COVID-19 pandemic on the level of NOx emissions in the city of Krakow
- Driver intervention performance assessment as a key aspect of L3–L4 automated vehicles deployment
- A new method for solving quadratic fractional programming problem in neutrosophic environment
- Effect of fish scales on fabrication of polyester composite material reinforcements
- Impact of the operation of LNG trucks on the environment
- The effectiveness of the AEB system in the context of the safety of vulnerable road users
- Errors in controlling cars cause tragic accidents involving motorcyclists
- Deformation of designed steel plates: An optimisation of the side hull structure using the finite element approach
- Thermal-strength analysis of a cross-flow heat exchanger and its design improvement
- Effect of thermal collector configuration on the photovoltaic heat transfer performance with 3D CFD modeling
- Experimental identification of the subjective reception of external stimuli during wheelchair driving
- Failure analysis of motorcycle shock breakers
- Experimental analysis of nonlinear characteristics of absorbers with wire rope isolators
- Experimental tests of the antiresonance vibratory mill of a sectional movement trajectory
- Experimental and theoretical investigation of CVT rubber belt vibrations
- Is the cubic parabola really the best railway transition curve?
- Transport properties of the new vibratory conveyor at operations in the resonance zone
- Assessment of resistance to permanent deformations of asphalt mixes of low air void content
- COVID-19 lockdown impact on CERN seismic station ambient noise levels
- Review Articles
- FMEA method in operational reliability of forest harvesters
- Examination of preferences in the field of mobility of the city of Pila in terms of services provided by the Municipal Transport Company in Pila
- Enhancement stability and color fastness of natural dye: A review
- Special Issue: ICE-SEAM 2019 - Part II
- Lane Departure Warning Estimation Using Yaw Acceleration
- Analysis of EMG Signals during Stance and Swing Phases for Controlling Magnetorheological Brake applications
- Sensor Number Optimization Using Neural Network for Ankle Foot Orthosis Equipped with Magnetorheological Brake
- Special Issue: Recent Advances in Civil Engineering - Part II
- Comparison of STM’s reliability system on the example of selected element
- Technical analysis of the renovation works of the wooden palace floors
- Special Issue: TRANSPORT 2020
- Simulation assessment of the half-power bandwidth method in testing shock absorbers
- Predictive analysis of the impact of the time of day on road accidents in Poland
- User’s determination of a proper method for quantifying fuel consumption of a passenger car with compression ignition engine in specific operation conditions
- Analysis and assessment of defectiveness of regulations for the yellow signal at the intersection
- Streamlining possibility of transport-supply logistics when using chosen Operations Research techniques
- Permissible distance – safety system of vehicles in use
- Study of the population in terms of knowledge about the distance between vehicles in motion
- UAVs in rail damage image diagnostics supported by deep-learning networks
- Exhaust emissions of buses LNG and Diesel in RDE tests
- Measurements of urban traffic parameters before and after road reconstruction
- The use of deep recurrent neural networks to predict performance of photovoltaic system for charging electric vehicles
- Analysis of dangers in the operation of city buses at the intersections
- Psychological factors of the transfer of control in an automated vehicle
- Testing and evaluation of cold-start emissions from a gasoline engine in RDE test at two different ambient temperatures
- Age and experience in driving a vehicle and psychomotor skills in the context of automation
- Consumption of gasoline in vehicles equipped with an LPG retrofit system in real driving conditions
- Laboratory studies of the influence of the working position of the passenger vehicle air suspension on the vibration comfort of children transported in the child restraint system
- Route optimization for city cleaning vehicle
- Efficiency of electric vehicle interior heating systems at low ambient temperatures
- Model-based imputation of sound level data at thoroughfare using computational intelligence
- Research on the combustion process in the Fiat 1.3 Multijet engine fueled with rapeseed methyl esters
- Overview of the method and state of hydrogenization of road transport in the world and the resulting development prospects in Poland
- Tribological characteristics of polymer materials used for slide bearings
- Car reliability analysis based on periodic technical tests
- Special Issue: Terotechnology 2019 - Part II
- DOE Application for Analysis of Tribological Properties of the Al2O3/IF-WS2 Surface Layers
- The effect of the impurities spaces on the quality of structural steel working at variable loads
- Prediction of the parameters and the hot open die elongation forging process on an 80 MN hydraulic press
- Special Issue: AEVEC 2020
- Vocational Student's Attitude and Response Towards Experiential Learning in Mechanical Engineering
- Virtual Laboratory to Support a Practical Learning of Micro Power Generation in Indonesian Vocational High Schools
- The impacts of mediating the work environment on the mode choice in work trips
- Utilization of K-nearest neighbor algorithm for classification of white blood cells in AML M4, M5, and M7
- Car braking effectiveness after adaptation for drivers with motor dysfunctions
- Case study: Vocational student’s knowledge and awareness level toward renewable energy in Indonesia
- Contribution of collaborative skill toward construction drawing skill for developing vocational course
- Special Issue: Annual Engineering and Vocational Education Conference - Part II
- Vocational teachers’ perspective toward Technological Pedagogical Vocational Knowledge
- Special Issue: ICIMECE 2020 - Part I
- Profile of system and product certification as quality infrastructure in Indonesia
- Prediction Model of Magnetorheological (MR) Fluid Damper Hysteresis Loop using Extreme Learning Machine Algorithm
- A review on the fused deposition modeling (FDM) 3D printing: Filament processing, materials, and printing parameters
- Facile rheological route method for LiFePO4/C cathode material production
- Mosque design strategy for energy and water saving
- Epoxy resins thermosetting for mechanical engineering
- Estimating the potential of wind energy resources using Weibull parameters: A case study of the coastline region of Dar es Salaam, Tanzania
- Special Issue: CIRMARE 2020
- New trends in visual inspection of buildings and structures: Study for the use of drones
- Special Issue: ISERT 2021
- Alleviate the contending issues in network operating system courses: Psychomotor and troubleshooting skill development with Raspberry Pi
- Special Issue: Actual Trends in Logistics and Industrial Engineering - Part II
- The Physical Internet: A means towards achieving global logistics sustainability
- Special Issue: Modern Scientific Problems in Civil Engineering - Part I
- Construction work cost and duration analysis with the use of agent-based modelling and simulation
- Corrosion rate measurement for steel sheets of a fuel tank shell being in service
- The influence of external environment on workers on scaffolding illustrated by UTCI
- Allocation of risk factors for geodetic tasks in construction schedules
- Pedestrian fatality risk as a function of tram impact speed
- Technological and organizational problems in the construction of the radiation shielding concrete and suggestions to solve: A case study
- Finite element analysis of train speed effect on dynamic response of steel bridge
- New approach to analysis of railway track dynamics – Rail head vibrations
- Special Issue: Trends in Logistics and Production for the 21st Century - Part I
- Design of production lines and logistic flows in production
- The planning process of transport tasks for autonomous vans
- Modeling of the two shuttle box system within the internal logistics system using simulation software
- Implementation of the logistics train in the intralogistics system: A case study
- Assessment of investment in electric buses: A case study of a public transport company
- Assessment of a robot base production using CAM programming for the FANUC control system
- Proposal for the flow of material and adjustments to the storage system of an external service provider
- The use of numerical analysis of the injection process to select the material for the injection molding
- Economic aspect of combined transport
- Solution of a production process with the application of simulation: A case study
- Speedometer reliability in regard to road traffic sustainability
- Design and construction of a scanning stand for the PU mini-acoustic sensor
- Utilization of intelligent vehicle units for train set dispatching
- Special Issue: ICRTEEC - 2021 - Part I
- LVRT enhancement of DFIG-driven wind system using feed-forward neuro-sliding mode control
- Special Issue: Automation in Finland 2021 - Part I
- Prediction of future paths of mobile objects using path library
- Model predictive control for a multiple injection combustion model
- Model-based on-board post-injection control development for marine diesel engine
- Intelligent temporal analysis of coronavirus statistical data