
Contribution of collaborative skill toward construction drawing skill for developing vocational course
-
Abdul Haris Setiawan
 ,
Ryo Takaoka
,
Ryo Takaoka

Abstract
This study aims to support developing research in designing a vocational lesson and learning model for civil engineering education study program by examining students’ collaborative skills toward construction drawing skills as a substantial skill in civil engineering. This study investigated student performance for proposing collaborative learning approaches to improve student skills as needed by industry. It is an ex-post-facto study using 130 samples from several vocational high schools in Indonesia with descriptive statistics and regression for the data analysis. The results show that the collaborative skill is in a fair category of 60.00 and the construction drawing skill is in a good category of 67.49 on a 100 scale. There is a significant and positive influence of collaborative skill (X) toward construction drawing skill (Y) with a linear regression model Ŷ = 31.443 + 1.952X. Furthermore, it presented a correlation coefficient of 0.644, a determination coefficient (R 2) of 0.415, and an adjusted R 2 of 0.410, where it can be concluded that the collaborative skill variable (X) as a predictor in the regression model includes the moderate category, which gives a 41% contribution in explaining the variants of the construction drawing skill (Y) as the dependent variable. It needs special attention to the specific behavioral details of the collaborative skill. The future work is needed to improve collaborative skills that emphasize prioritizing collaboration between peers and learning interdependence.
1 Introduction
After entering the post-cold war era, Indonesia lacks a significant external threat, having free access to the global markets and good internal stability to support its continuing national development programs [1]. Besides, the country is facing a transition period to be a knowledge economy, growth of competitiveness, and employee performance improvement, and there are significant barriers in the preparation of the prospective workforce by vocational education [2]. Significant obstacles in vocational education development are skills gaps between the student and the industrial demand [2,3,4]. In the past year, unemployment has decreased by 50,000 people, in line with the Open Unemployment Rate or in Indonesia Tingkat Pengangguran Terbuka (TPT), which fell to 5.01% in February 2019. Judging from the education level, TPT for Vocational High Schools or in Indonesia Sekolah Menengah Kejuruan (SMK) is still the highest among other education levels, amounting to 8.63% [5,6]. The low absorption of vocational school graduates to find jobs in industries indicates that vocational school graduates have not met industry demands [4,7]. An initial study exposed that SMK graduates’ employment rate was 70% in Daerah Istimewa Yogyakarta (DIY), Indonesia. This rate is still not enough, considering that the employment percentage should be at least 80% [7,8]. The industry still holds that vocational school graduates are not ready to work, and they still have to do initial training before doing their job as new employees. The government’s expectation for SMK to overcome unemployment is tremendous as the SMK’s vital role to be the leading supplier of labor to drive the nation’s economic growth.
Increasing economic development by giving more attention to vocational education in producing the potential human resources is an essential key point for stabilizing and developing the country [9,10]. The 2030 agenda of the United Nations Sustainable Development Goals (UN SDGs) is an urgent call for action by all countries, especially on goal number four in improving the education quality by ensuring inclusive, equitable quality education and promoting lifelong learning for everyone [11,12]. An urgent target of the UN SDGs on goal number four (UN SDG4) regarding quality education is the target number three, ensuring equal access for all women and men to affordable and quality technical, vocational, and tertiary education, including university [13]. Moreover, UN SDG4 needs to realize the target number four, substantially increasing youth and adults with relevant skills, including technical and vocational skills, employment, decent jobs, and entrepreneurship. Every country obliges to implement these targets to ensure stable economic development, foster tolerance between people, and contribute to more peaceful societies [14]. Therefore, the Indonesian government is addressing these challenges through empowering vocational education and striving to create relevant educational programs to answer and anticipate the demands of industrial needs [8]. In recent years, efforts to improve vocational education quality have been carried out in line with the presidential instructions to revitalize vocational education [15]. It is stated in presidential instruction number 9 in 2016 with four focus on revitalization, including revitalizing curriculum, educators and education personnel, cooperation, and graduates [16,17,18].
This study aims to contribute to the vocational education revitalization in the curriculum side by developing a vocational course with a series of initial studies as a foundation for the formation of learning according to stakeholder needs by considering the characteristics of current student skills. To obtain data on student characteristics, we investigated student skills. Investigations are carried out directly on students who are doing internships in the industry. One of the government learning programs for vocational education is the internship program known as Dual System Education or in Indonesia Pendidikan Sistem Ganda (PSG) through work experiences in the industry. Students get their actual practices in the workplaces through this program [19,20,21]. This program allows the student to gain practical knowledge directly in the industrial workplace. Besides, this study also investigates the students’ skills while they are working and doing job assignments.
As a part of development research to improve the student skill in construction drawing by designing a vocational course and learning model in the civil engineering education study program, this study proposed discovering the contribution of collaborative skills toward construction drawing skills for developing the vocational courses lesson and learning model. The study proposes a collaborative approach for designing a vocational learning model as an alternative solution to minimize the gap between industrial needs and current vocational student skills. A study revealed that students’ collaborative skills in several vocational schools were not in required level. Learners do not show accustomed to learning and working collaboratively and prefer to have individual competition rather than work with friends in a team to achieve mutual aims [7]. Also, it is necessary to reinforce collaboration as one of the twenty-first-century skills besides communication and critical thinking with a spirit of lifelong learning [22,23,24,25]. Conversely, working together in a team to finish jobs, advanced assignments, and complicated projects is an indispensable working method in the actual workplace. Many of the jobs are a series of interrelated projects that must be completed collaboratively. This study is essential for proposing collaborative learning approaches to improve student skills needed by the industry. In collaborative learning situations, learners work actively in purposeful ways. They do not simply take new information or ideas but design new projects with updated information and ideas. In the perspective of Islam as the majority religion in Indonesia, collaboration is encouraged in all aspects of human life. This Islamic obligation includes teaching and learning taxonomy, where collaborative skill is one of the fundamental skills that should be developed throughout the students’ learning experiences to gain the student skills in all aspects of learning outcomes [26,27,28]. Islam professes that everybody requires a good social relationship to live [29,30,31,32]. Muslims believe that God has established mutual rights for everyone, and to meet this requirement, collaboration and respecting mutual rights are the ideal architectural concepts. They are taught to keep united and collaborate to strengthen each other like a strong building structure. Collaborative activities immerse students in challenging duties or problems. Instead of being separate observers of problems and solutions, students become immediate practitioners [33]. Performing situations challenge students to practice and increase higher-order rationalizing and problem-solving abilities.
2 Research methods
2.1 Methods
As a part of the research study for identifying student characteristics in the specific indicator, this study concentrates on the statistical analysis, which aims to reveal the students’ detailed condition on the construction drawing and collaborative skills. The construction drawing skill is needed as a professional field of expertise in civil engineering education, and the collaborative skill is needed as workplace competency to face the actual workplace condition with many dynamic problems. To support the ongoing development study on designing a better lesson and learning model in a vocational education environment, a quantitative statistical approach is used with an ex-post-facto method, which is expected to cover the study’s aim in collecting authentic vocational students’ performance data from four different schools in Indonesia without any training to the research subjects. The assessors assessed the actual student skill, while the research subjects are kept in their original condition because of no training. The assessment was conducted directly, while the students had an internship program in the industry to ensure the research subject’s authentic performance. It is a scientific study on how a phenomenon influences a variable that requires theoretically grounded methods by examining social reality, which confirmed that the theory and observation are two inseparable things. While theories are needed to explain the natural and social phenomenon, observation is necessary for finding a theory [34,35,36]. We try to uncover the facts that already exist in each of the variables studied and observe the phenomena to find problems and offer possible solutions.
The study results were analyzed using descriptive statistics and continued with regression as the inferential statistics. The descriptive analysis is essential to illustrate the collaborative and construction drawing skills by presenting the means, frequency distributions, and histograms. It also categorizes the data for further discussion and designs better learning experiences to support the vocational lesson and learning model development. Meanwhile, regression analysis is needed to prove that collaborative skills contribute significantly to professional competence, especially construction drawing skills, where the improvement of collaborative skills is a solution offered by the ongoing development study as the primary related research.
2.2 Population, sample, and instrument
This study was conducted at several vocational high schools in three different provinces, Jawa Tengah, DIY, and Papua. The study population included 204 apprenticeship students from four state vocational high schools in Surakarta, Yogyakarta, Cilacap, and Sorong. This study used 130 samples by proportional random sampling from the total population. It randomly used samples from each vocational school that conducted an industrial internship program in the same proportion. It employed descriptive analysis and linear regression to analyze the data and examine the hypothesis. This study’s dependent variable is construction drawing skill (Y), i.e., a substantial civil engineering student skill. In contrast, the independent variable is the collaborative skill (X), i.e., an essential workplace competency for adapting to actual working problems and developing careers. Also, we propose the collaborative enhancement to be an alternative solution to improve student’s skills needed by industry in related ongoing development research on designing lesson and learning model for civil engineering education study program.
For discovering the student characteristics authentically, the assessment was carried out when the students were having industrial apprenticeships where student performance can be seen in real-time while working in the workplace and finishing assignments given by the industry. Besides, in industrial working practices, collaborative performance could be revealed when the learners worked in teamwork and socialized with colleagues. Moreover, to evaluate the student’s skills specifically, this study developed the assessment instrument by extracting the existing curriculum with references and discussing with teachers, lecturers, and involving practicians from the industry. The industries’ involvement is necessary. As the vocational school stakeholder, they use vocational school graduates and systematically identify the skills needed to carry out assignments in their specific field of expertise, solve problems, and face the industry’s dynamic challenges as an actual workplace for the students after graduation. The developed instrument for assessing student performance is described through indicators presented in Table 1.
Student skill assessment indicators
| Construction drawing skill indicators | |
|---|---|
| 1 | Preparing to draw and making work-time-schedule |
| 2 | Implementing the drawing process in the correct procedure |
| 3 | Complying with the rules of technical drawing |
| 4 | Mastering the drawing plan and construction detail drawing |
| 5 | Presenting the drawing project |
| Collaborative skill indicators | |
| 1 | Being an active problem solver, giving ideas, and likes discussion |
| 2 | Preparing to work with high expectations |
| 3 | Willing to work in a team with risks and problems |
| 4 | Prioritizing the team choices and expectations |
| 5 | Prioritizing collaboration over individual competition |
| 6 | Prioritizing team responsibilities and learning interdependence |
| 7 | Believing that peer discussion is also a source of learning |
| 8 | Giving the colleagues chance and opportunity |
| 9 | Building the spirit of lifelong learning |
| 10 | Fostering relationships and respect each other |
The construction drawing and collaborative skills indicators presented in Table 1 are used as a reference in formulating the assessment sheet used to assess the performance of apprentice students, which refer to the existing curriculum of 2013 [37,38,39] as the primary reference for the vocational curriculum of civil engineering construction drawing course with building construction competency skill. Simultaneously, the student competency is regarding The Minister of Education and Culture Regulation Number 22 of 2016 concerning the education process standard [40], which changed Regulation Number 65 of 2013. The assessment indicators also refer to The Indonesian National Work Competency Standards, wherein Indonesia known as Standar Kompetensi Kerja Nasional Indonesia (SKKNI) for architecture draughtsman [41] as the national standard of an architectural drawing for civil engineering in Indonesia. Simultaneously, this study proposes collaborative skill enhancement as we believe it helps students learn better and it is more manageable than beyond mere content and ideas. The collaborative mindset promotes a larger educational agenda that encompasses several intertwined rationales [33]. The adult learning principles help facilitate the positive transfer of training and include learning designed in realistic settings as the concept of Brown, Collins, and Duguid (1989) [42,43]. Moreover, the teacher realizes that vocational students are self-directed learners, have experiences to share, need motivation as an adult learner, and require project assignment as problem-centered learning for the learning process related to the proposal of Knowles, Holton III, and Swanson in Cochran and Brown 2016 and Wang 2009 [44,45].
The assessment sheet contains 39 statement items, including 29 construction drawing skill items and ten collaborative skill items. The 29 items of drawing skill were subindicator translated from five primary drawing skill indicators, presented in Table 1. The indicator of preparing to draw is determining the materials and tools needed and define work-time-schedule. The indicators of implementing the drawing process in the correct procedure are setting the drawing software (layers, folders, plot style settings), analyzing the drawing plan (drafts/sketches), and implementing the drawing process. The indicators of complying with the rules of technical drawing are the applying drawing layout, drawing the construction line, applying the letters in writing and symbols, applying drawing title block, drawing the construction shape, applying the drawing scale with the applicable rules, drawing symbols of the building materials according to the applicable rules in building planning, drawing construction details, and complete the drawing as requested in the building plan. The indicators of mastering the drawing plan and construction detail drawing are drawing a floor plan, drawing the building view by front-right-left-back-top, drawing section, drawing detailed foundation plan, drawing detailed roof structure, drawing plumbing and mechanical and electrical plan, drawing title block, and setting and implementing plotter printing. Simultaneously, the indicators of presenting the drawing project are presenting the drawing information verbally also in writing and explaining the arguments of the drawing concept. Furthermore, the collaborative skill indicators were expected to describe students’ performance when they worked and socialized with their working partners in the industries. The indicators are as follows: being an active problem solver, preparing to work with high expectations, working in a team with risks and problems, prioritizing the team choices, prioritizing collaboration over individual competition, prioritizing group responsibilities and learning interdependence, believing peer discussion is a source of learning, giving the team member opportunity to participate in the project, building the lifelong learning spirit, and fostering relationships and respect each other.
The research instrument for collecting variable data was an assessment sheet with rubrics that its validity and reliability examined before the implementation. It was tested by the Aiken V content validity test with the raters’ agreement index. Lecturers and industrial practitioners were included as the raters. The validity assumption of V ≥ 0.40 is considered valid [46,47]. The formula of V is presented in equation (1):
where raters agreement index = V and s = the score assigned by each rater minus the lowest score in the category used (s = r − lo, where r = score assigned by each rater and lo = the lowest score in the scoring category), n = the number of raters, and c = the number of scores that the rater can choose. The Aiken V examination result explicated that the content validity is 0.88. This value is higher than the V index of 0.40. Therefore, it can be defined that the evaluation instruments remain valid.
The assessment instrument’s reliability test was performed by the Interclass Correlation Coefficient (ICC) formula with a reliable assumption of more than 0.75 (ICC value ≥0.75) [48] (equation (2)).
where ICC coefficients = r, MSpeople refer to the mean square between people, MSresidual is the mean square within people residual, and dfpeople refer to the degree of freedom within the people. The instrument reliability test results by the IBM SPSS showed that the ICC reliability coefficient value of 0.858 meets the ICC reliability coefficient value, i.e., ≥0.75. Therefore, according to the assumption, it had met the ICC reliability coefficient value requirement above 0.75, so the assessment instrument sheet’s interpretation is confirmed as reliable.
2.3 Data analysis
The data analysis techniques used in this study are descriptive statistics and linear regression analysis. The descriptive analysis is to disclose the vocational student skill scores according to predetermined criteria. Then, the study employed the linear regression analysis to examine the contribution of collaborative skill (X) as independent variables toward construction drawing skill (Y) as the dependent variable. The descriptive statistics explain the investigation of construction drawing skills and collaborative skills in every aspect of indicators. For interpreting the result, this study used assessment criteria divided into four categories [49]. The assessment criteria are presented in Table 2.
Assessment criteria
| Grade value | Criteria |
|---|---|
| More than (Mi + 1.5 SDi) (>81.25) | Very good |
| Mi – (Mi + 1.5 SDi) (62.5–81.25) | Good |
| (Mi − 1.5 SDi) – <Mi (43.75 to <62.5) | Fair |
| Less than (Mi − 1.5 SDi) (<43.75) | Poor |
Mi is the ideal mean and SDi is the ideal standard deviation, where Mi = 1/2 (highest score + lowest score), with the highest score of 100 and the low score of 25. While the SDi = 1/6 (highest score + lowest score).
This study employed linear regression as the statistical analysis to determine the equation model for predicting the dependent variable’s values based on the independent variable’s level. The linear relationship model between the X and Y variables in the sample is expressed as equation (3) [50,51,52].
where Ŷ = the predictive value of variable Y, X = variable X, a = constant value, and b = the regression coefficient of Y on X.
Equation (3) shows Ŷ as the predictive value of Y if it a specific value of X is known, a is a constant value, and b is the regression coefficient of Y toward X. Furthermore, the level of accuracy of a regression line can be calculated using the size of the adjusted R 2. The higher the adjusted R 2 value, the stronger the regression model’s ability to explain actual conditions. In contrast, the smaller the adjusted R 2 value, the more incorrect the regression line represents the observed data [53,54].
Before examining the data by the regression test, the linear regression test requirements were carried out to ensure the accuracy of the data analysis results. This study examines the analysis requirements, including normality, linearity, autocorrelation, and homoscedasticity. The first analysis requirement was the normality test. It was carried out to ensure whether the data are normally distributed. The normality test was carried out by the Kolmogorov–Smirnov normality test. The assumption of the normally distributed data is if the Asymp. Sig. (two tailed) is more than 0.05 probability, the research data are declared as normally distributed. In contrast, if the value of Asymp. Sig. (two tailed) is less than 0.05 probability, then the research data are not normally distributed [50,51,54,55].
The second analysis requirement was to confirm if the two variables have a significant linear relationship. The linearity test was performed by using the ANOVA output table with two-way assumption. The first is comparing the value of Sig. on deviation from linearity with 0.05 probability. Suppose the value of Sig. on deviation from linearity is more than 0.05 probability, it means that there is a significant linear relationship between X and Y variables. In contrast, if Sig. on deviation from linearity is less than 0.05 probability, it means that there is no significant linear relationship between X and Y variables. The second way is by comparing the F-count with F-table, with an assumption of F-count less than the F-table with 0.05 probability, where the F-table was written in the Critical Value Table of F Distribution, which means that there is a significant linear relationship between X and Y variables [50,51,54,55].
This study performed an autocorrelation test as the third analysis requirement to confirm that the data are independent, and there is no autocorrelation in the residue by using the Durbin–Watson test. The assumption is by comparing d (or 4 − d, whichever is closer to zero) with d L and d U in table of significance points of d L, and d U: 5% [55]. If d < d L, it concludes that positive serial correlation is possible, and if d > d U, there is no serial correlation. (If 4 − d < d L, it concluded that negative serial correlation is possible, and if 4 − d > d U, there is no serial correlation). If the d (or 4 d) value lies between d L and d U, it means the test is inconclusive [50,51,54,55].
The fourth analysis requirement is the heteroscedasticity test, which is carried out to determine whether the absolute residual variation is the same. If only the heteroscedasticity test is not fulfilled, the assessment will no longer be efficient in small and large samples, and the coefficient estimation can be assumed less accurate [51]. The analysis used to detect the presence or absence of heteroscedasticity was the Spearman rank test. The assumption is if the value of Sig. (two tailed) is more than 0.05 probability, it means that there is no heteroscedasticity. Conversely, if the value of Sig. (two tailed) is less than 0.05 probability, it means that there is heteroscedasticity. Second, the assumption is that Spearman correlation coefficient arithmetic (r s count) of less than r s table with 0.05 probability in the Critical Value Table of Spearman Correlation Distribution, which means that heteroscedasticity does not occur [51,54,55].
The linear regression analysis was implemented in two ways. The first way is by comparing the value of Sig. with 0.05 probability (alpha = 0.05). The assumption is the value of Sig. less than 0.05 probability means the null hypothesis is rejected, and the alternative hypothesis is accepted. With an interpretation, there is a significant and positive effect of collaborative skills toward construction drawing skills; however, if the value of Sig. is more than 0.05 probability, it means that the null hypothesis is accepted, and the alternative hypothesis is rejected, with an interpretation that there is no significant positive effect of collaborative skills toward construction drawing skills. The second is by comparing the t-count with the t-table of 0.05 probability (two tailed) written in the Critical Value Table of the t Distribution [54]. The assumption is that if t-count is more than the t-table of 0.05 probability (two tailed), then it means that the null hypothesis is rejected and the alternative hypothesis is accepted, and there is a significant and positive effect of collaborative skills toward construction drawing skills. In contrast, if the t-count is less than the t-table of 0.05 probability (two tailed), it means that the null hypothesis is accepted, and the alternative hypothesis is rejected, and there is no significant positive effect of collaborative skills toward construction drawing skills [50,51,54,55].
3 Result
3.1 Descriptive statistics and test of analysis requirements
The assessment sheet consists of 39 statements, including 29 items for the construction drawing skills aspect and ten items for the collaborative skill aspect. The analysis examines these two aspects by descriptive statistics and regression. The analysis result of student construction drawing skills is 67.49 (good category) for the mean value on a scale of 100. Conversely, the student collaborative skill is 60.00 for the mean value on a scale of 100. The collaborative skill results are in a fair category.
The result of students’ skills assessment scores is shown in Figure 1 and the frequency distribution in Figure 2.
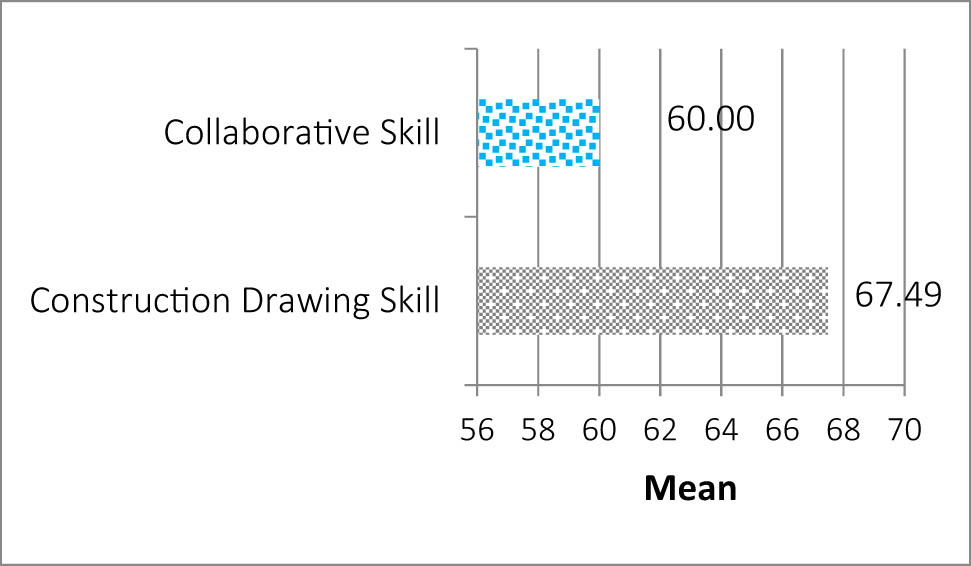
Students’ construction drawing skill and collaborative skill score.
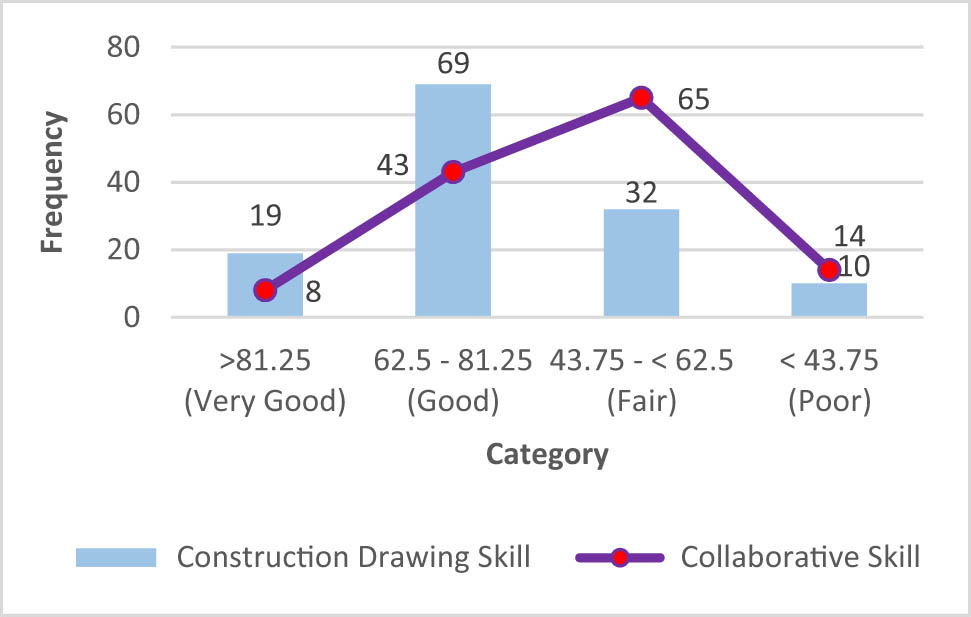
Frequency distribution of construction drawing skill and collaborative skill score.
Before the linear regression examination, the study conducted the four analysis requirement tests in the beginning. First, a normality test was conducted to discover the data normality condition by the Kolmogorov–Smirnov normality test. The normality assumption is that when the Asymp. Sig. (two-tailed) is more than 0.05 probability, then the data distribution is normal. On the contrary, if the value of Asymp. Sig. (two-tailed) is less than 0.05 probability, the data are not normally distributed [50,53,54,55]. According to Table 3, the value of Asymp. Sig. (two-tailed) is 0.093, i.e., more than 0.05, and hence, it can be concluded that the data distribution is normal. Thus, the requirements and assumptions for normality in using the linear regression test have been fulfilled. A summary of the normality tests is presented in Table 3.
The summary of normality test result
| Variable | Asymp. Sig. (two tailed) | Conclusion |
|---|---|---|
| X−Y | 0.093 | Normal |
After the normality test, the first analysis requirement examination was successfully conducted with an expected result, and then, the study conducted the second analysis requirement examination, i.e., the linearity test. The result was analyzed using two ways. The first way is by comparing the significance value with 0.05 probability. If the Sig.’s value of deviation from linearity is more than 0.05, then there is a significant linear relationship between the independent (X) and dependent (Y) variables. In contrast, if Sig.’s value on deviation from linearity is less than 0.05 probability, it means that there is no significant linear relationship between X and Y variables [50,51,55]. The second way is by comparing the F-count with F-table, with an assumption of F-count less than the F-table with 0.05 probability, where the F-table was written in the the Critical Value Table of F Distribution [54], which means that there is a significant linear relationship between X and Y variables. The summary of linearity test data is presented in Table 4.
The summary of linearity test
| df | F | Sig. | Conclusion | ||
|---|---|---|---|---|---|
| X−Y | Deviation from linearity | 23 | 1.193 | 0.268 | Linear |
| Within group | 105 |
According to Table 4, the linearity test, Sig.’s value on deviation from linearity is 0.268, more than 0.05 probability, which means that there is a significant linear relationship between collaborative skills (X) and construction drawing skills (Y). Second, the F-count is 1.193, less than the F-table of 1.63. The F-table is taken by searching from the F value in the Critical Value Table of F Distribution [54] guided by the df value of deviation from linearity of 23, df within group of 105, with a probability of 0.05, the F table is obtained 1.63. It means that there is a significant linear relationship between X and Y variables. Thus, the requirements and assumptions for linearity in using the linear regression test have been fulfilled.
After finishing the first and second analysis requirement tests, this study conducted an autocorrelation test using the Durbin–Watson test as the third requirement test to confirm the data independence without autocorrelation in the residue. The assumption is by comparing d (or 4 − d, whichever is closer to zero) with d L and d U in Table of Significance Points of d L and d U: 5%. If d < d L, it concludes that positive serial correlation is possible, and if d > d U, there is no serial correlation. (If 4 – d < d L, it is concluded that the negative serial correlation is possible, and if 4 − d > d U, there is no serial correlation.) If the d (or 4 d) value lies between d L and d U, it means that the test is inconclusive [50,51,54]. The summary of the data autocorrelation test is presented in Table 5.
The summary of autocorrelation test
| Durbin–Watson test (d) | 4 − d | d L | d U | k, n | Conclusion | |
|---|---|---|---|---|---|---|
| X−Y | 2.0007 | 1.993 | 1.692 | 1.726 | 1, 130 | No autocorrelation |
From Table 5, where critical values for probability level α is 0.05, d is Durbin–Watson value, which is represented as d L and d U, where L is lower and U is upper, and these are given for various numbers of observations n and k as the number of predictor variables [55]. According to the autocorrelation test, the value of d is 2.0007, which is more than d U of 1.726, which means that there is no serial correlation. Then, 4 − d is 1.993, which is more than d U of 1.726, which means that there is no serial correlation. So it can be concluded that the data are independent, and there is no autocorrelation in the residue. Thus, the requirements and assumptions for no autocorrelation in using the linear regression test have been fulfilled. After the first, second, and third analysis requirement tests were successfully implemented, the next activity was carrying out the fourth analysis requirement test, the heteroscedasticity test, which was conducted to determine whether the absolute residual variation is the same.
If heteroscedasticity is not fulfilled, the assessment will no longer be efficient in both small and large samples, and the coefficient estimation can be said to be less accurate [51]. The Spearman rank test was used to detect the presence or absence of heteroscedasticity. If the value of Sig. (two tailed) is more than 0.05 probability, then there is no heteroscedasticity. In contrast, if the value of Sig. (two tailed) is less than 0.05 probability, then there is heteroscedasticity. Second, if the Spearman correlation coefficient arithmetic (r s count) is less than r s table with 0.05 probability written in the Critical Value Table of Spearman Correlation Distribution, then heteroscedasticity does not occur [51,53,54,55]. A summary of the heteroscedasticity test is presented in Table 6.
The Summary of heteroscedasticity test
| Spearman’s rho | Sig. (two tailed) | Correlation coefficient (r s count) | df | r s table with 0.05 probability | Conclusion |
|---|---|---|---|---|---|
| Collaborative skill | 0.149 | 0.127 | 128 | 0.197 | No heteroscedasticity |
According to Table 6, the heteroscedasticity test showed that the value of Sig. (two tailed) is 0.149, which is more than 0.05 probability, which means that there is no heteroscedasticity. While r s count = 0.127, which is less than r s table values of 0.197, and this means that there is no heteroscedasticity. r s table is obtained by looking at r s table with 0.05 probability and df 128 in the Critical Value Table of Spearman Correlation Distribution [54], and it can be concluded that there is no heteroscedasticity. Thus, the analysis requirements and assumptions to use the linear regression of no heteroscedasticity have been fulfilled.
3.2 Data analysis result
The aim of this study is to provide accurate information about the characteristics of vocational students. The phenomena that occur in the research variables are analyzed to find the cause and effect of the problem to formulate proposals for the right solution to solve the problem. After completing the analysis requirement tests, the next step was to test the hypothesis using the regression analysis. Data analysis was aimed to examine the contribution of the independent variables of collaboration skill (X) toward the construction drawing skill (Y) as the dependent variable.
The regression analysis was employed in two ways. First, the value of Sig. is compared with 0.05 probability. If the value of Sig. is less than 0.05 probability, then it means that the null hypothesis is rejected, and the alternative hypothesis is accepted. Then, there is a significant and positive influence of collaborative skills toward construction drawing skills. On the contrary, if the value of Sig. is more than 0.05 probability, then it means the null hypothesis is accepted, and the alternative hypothesis is rejected, so it can be interpreted that there is no significant positive influence of collaborative skills toward construction drawing skills. The second way is by comparing the t-count with the t-table of 0.05 probability (two tailed) written in the Critical Value Table of the t Distribution [54]. If t-count is more than the t-table of 0.05 probability (two tailed), then the null hypothesis is rejected and the alternative hypothesis is accepted, and there is a significant and positive influence of collaborative skills toward construction drawing skills. In contrast, if the t-count is less than the t-table of 0.05 probability (two tailed), the null hypothesis is accepted, and the alternative hypothesis is rejected. The interpretation is that there is no significant positive influence on collaborative skills toward construction drawing skills [50,51,54,55]. The linear regression analysis result between the X and Y variables is presented in Table 7.
Summary of regression analysis
| R | R 2 | Adjusted R 2 | t-count | df | t-table | Sig. | |
|---|---|---|---|---|---|---|---|
| X−Y | 0.644 | 0.415 | 0.41 | 9.524 | 128 | 1.96 | 0.000 |
According to Table 7, the summary of regression analysis displays several analysis results, including the existing variables, the value of R, R 2, adjusted R 2, t-count, df, t-table, and Sig.’s value. This table explains that the correlation coefficient of collaborative skills (X) is r = 0.644 with a positive value from the analysis results. While Sig. ’s value = 0.000, less than 0.05 probability, it means that the null hypothesis is rejected and the alternative hypothesis is accepted. Thus, it can be interpreted that there is a significant and positive influence of collaborative skill toward construction drawing skill.
Furthermore, t-count of 9.524 is more than t-table of 1.96, where t-table obtained by searching from the t-table value in the Critical Value Table of t Distribution [54] with guided from the df value of 128 with 0.05 probability. The t-table is obtained 1.96, which means the null hypothesis is rejected and the alternative hypothesis is accepted. The interpretation is that there is a significant and positive influence of collaborative skills (X) toward construction drawing skills (Y). The coefficient of determination or the contribution (R 2) of collaborative skill variables (X) on the construction drawing skill variable (Y) is 41.50% (0.415). According to the regression analysis results, the interpretation is that collaborative skills (X) contribute 41.50% to the construction drawing skill (Y).
The coefficient of determination (R 2) value varies from zero to one. It means that the higher R 2 value indicates that the dependent variable (Y) variance can be explained by the independent variable (X) and vice versa. However, the higher R 2 value does not automatically describe the relationship between variables in the model, and primarily whenever other independent variables were added, the more independent variables were used and the more “noise” seen in the model. Therefore, to determine the predictor’s contribution to the regression model, this study used the adjusted R 2, where the value is not biased toward the number of predictors in the model. According to Duncan et al., in the linear regression model categorized by adjusted R 2 values, 0.70 is strong, 0.45 is moderate, and 0.25 is weak [53,54]. The greater the adjusted R 2 value, the better the predictor model explains the dependent variable’s variance. Based on the regression analysis, the adjusted R 2 value is 0.410. Therefore, it can be concluded that the regression model category is moderate, which means the collaborative skill as a predictor model can explain variants of construction drawing skill variable in the moderate category.
Based on the regression analysis results shown in Table 8, the constant value is 31.443 and the regression coefficient of Y on X is 1.952. In line with equation (3), the regression equation for the linear regression model becomes Ŷ = 31.443 + 1.952X. Furthermore, Table 8 clearly shows a significant and positive effect of collaborative skills (X) toward construction drawing skills (Y), which is proven by the results of Sig.’s value of 0.000, less than 0.05 probability, which means that there is a significant and positive effect of collaborative skills (X) toward construction drawing skills (Y). Then, the t-count is 9.524, more than the t-table of 1.96, which means that there is a significant and positive effect of collaborative skills toward construction drawing skills. Furthermore, the correlation coefficient is 0.644, the coefficient of determination (R 2) of collaborative skill variables (X) on the construction drawing skill variable (Y) is 0.415, and the adjusted R 2 of 0.41. Hence, it can be concluded that the collaborative skill variable (X) as a predictor in the regression model includes the moderate category [53], which gives a 41% contribution in explaining the variants of the construction drawing skill (Y) as the dependent variable.
Summary of regression analysis coefficients
| Model | Un standardized coefficients | Standardized coefficients | t | Sig. | |
|---|---|---|---|---|---|
| b | Std. error | Beta | |||
| 1 | |||||
| (constant) | 31.443 | 5.042 | 0.644 | 6.236 | 0.000 |
| Collaborative skill | 1.952 | 0.205 | 9.524 | 0.000 | |
4 Discussion
4.1 Summary of principal findings
The study has carried out a series of analyses, including descriptive and inferential statistics with regression analysis. Besides confirming the analysis requirements for regression by conducting several analysis requirement tests, this study also ensures the instrument feasibility by the validity and reliability test using Aiken V and Interclass Correlation Coefficient (ICC) for the instrument employed. From the descriptive statistics result, the study tried to show the investigation’s critical finding as valued information is needed to enhance the learning outcomes in a vocational environment. A fundamental finding of the descriptive analysis is presented in Table 9, the lowest students’ collaborative skills in three indicators. These indicators were the lowest among the all achieved scores that need further concerns. The first was prioritizing collaboration over individual competition, the second was prioritizing team responsibilities and learning interdependence, and the third was prioritizing the team choices and expectations.
Summary of three lowest collaborative skill indicators from descriptive analysis result
| Indicator number | Collaborative skill indicators | Mean | Category |
|---|---|---|---|
| 5 | Prioritizing collaboration over individual competition | 54.42 | Fair |
| 6 | Prioritizing team responsibilities and learning interdependence | 55.77 | Fair |
| 4 | Prioritizing the team choices and expectations | 56.15 | Fair |
Having implemented the descriptive analyses, examined the regression analysis requirements, and finished the linear regression analysis, then this study obtained the results and unveiled the hypothesis. The regression analysis test has given a value of Sig. = 0.000, less than 0.05 probability, and hence, the null hypothesis is rejected and the alternative hypothesis is accepted. So, there is a significant and positive influence of collaborative skill (X) toward construction drawing skill (Y). Moreover, the t-count = 9.524 is more than t-table = 1.96 (from the Critical Value Table of t Distribution [54] with referred the df = 128 of 0.05 probability). So, the null hypothesis is rejected, and the alternative hypothesis is accepted. It can be concluded that there is a significant and positive influence of collaborative skill (X) toward construction drawing skill (Y).
Furthermore, the analysis has presented a linear regression model Ŷ = 31.443 + 1.952X. It also exhibited a correlation coefficient of 0.644, a determination coefficient (R 2) of 0.415, and an adjusted R 2 of 0.410, which means that the independent variable collaborative skill (X) can explain the variants of the dependent variable, construction drawing skill (Y) with 41% contribution.
According to Duncan et al., the linear regression model is categorized by adjusted R 2 values, where 0.70 is strong, 0.45 is moderate, and 0.25 is weak [53]. In comparison, the collaborative skill adjusted R 2 value includes the moderate category. It reinforces us in our efforts to develop students’ collaborative mindset, whereby developing this collaborative mindset, students realize and have strong motivation to improve their collaborative skills. In line with Weinstein and Hume, every student plays an integral role in his individual learning experience to achieve learning goals [56,57]. Therefore, this study tries to make students aware of collaborative skills for their better future education. The learners’ awareness of their learning success and collaborative enhancement will increase the construction drawing skill. Statistically, the study has given the linear regression model with 41% contribution of collaborative skills toward construction drawing skill. The collaborative skill potential contribution in enhancing the learning outcome was also studied by Murphy and Alexander, where the collaborative learner tends to enjoy working in a group or teamwork cooperative learning to achieve a specific goal of learning together [58]. Besides, collaborative learners often minimize the learning problem and often break down tasks into specific roles assigned to members of the group [56]. Therefore, it gives a better advantage to vocational education when the students learn in the class, workshop, and workplace as industrial apprenticeships. Furthermore, collaborative skills are also indispensable skills in the world of work, and the industry’s need for collaborative skills is an absolute necessity. According to Jerald and Laux et al., employers’ expectations for employees in the workplace are adapting to change, using critical thinking skills, and collaborating professionally [59]. Collaborative work is more productive because many works are becoming too heterogeneous for one person to achieve ultimately [60]. The industry is the center of productions, a gathering place for work in teams produces many products, goods, or services that are impossible to work individually but collaboratively.
4.2 Unique phenomenon of collaborative skills in Indonesia
The frequency distribution of collaborative skill and construction drawing skill scores illustrated in Figure 2 shows that 65 students obtained the fair category of collaborative skill, 43 students obtained the good category, eight students obtained the very good category, and 14 obtained the poor category. The regression analysis reveals that the collaborative skill (X) has a significant and positive influence on construction drawing skill (Y), with a 41% contribution. According to the analysis and discussion, it is possible to improve the contribution by giving special attention to the students’ specific behavioral details related to the collaborative skill indicators and managing students’ collaborative mindset. The resulting statistical figures should be discussed in detail by tracing each indicator of the skills studied. Also, the collaborative skill indicator items have specific behavioral details that need to be explicitly observed.
In case of collaborative skill indicator items, there are details of specific skills and behaviors that need to be observed rigorously. From the fundamental finding described in Table 9, it is clear that the lowest score needs further follow up. The first lowest score of prioritizing collaboration over individual competition plays a vital role in collaborative skills, where a collaborative student is supposed to be a collaborative minded, not an individualist one. In this case, the study has shown the vital indicator of prioritizing collaboration over the individual competition to be the lowest one. Therefore, the future work will be specially designed to encourage students to gain this low indicator score. At the same time, the different conditions of each student are also needed to be considered seriously. It is in line with the different school conditions and the area where the school is located. The personal conditions of the students and their families are also vary. The customs and the culture of each area have different conditions and characteristics. These differences could lead to different habits, motivations, and behaviors, thus making the characteristics skills different.
From the analysis discoveries, each research zone presented different data of students’ collaborative skills. As described in Table 10, each research zone gives different data. The lowest score between each zone is different from one another. For example, the first lowest score of Yogyakarta is prioritizing team responsibilities and learning interdependence. While in Surakarta, the first lowest score is prioritizing the team choices and expectations. On the other hand, in Cilacap and Sorong, there is a typical condition in the first lowest score of prioritizing collaboration over individual competition, even though the second and third positions are different in the indicators.
Lowest collaborative skill indicators for each zone from descriptive analysis result
| Indicator number | Collaborative skill indicators | Research zone |
|---|---|---|
| 6 | Prioritizing team responsibilities and learning interdependence | Yogyakarta (DIY) |
| 5 | Prioritizing collaboration over individual competition | |
| 4 | Prioritizing the team choices and expectations | |
| 4 | Prioritizing the team choices and expectations | Surakarta (Central Java) |
| 5 | Prioritizing collaboration over individual competition | |
| 1 | Being an active problem solver, giving ideas, and likes discussion | |
| 5 | Prioritizing collaboration over individual competition | Cilacap (Central Java) |
| 7 | Believing that peer discussion is also a source of learning | |
| 6 | Prioritizing team responsibilities and learning interdependence | |
| 5 | Prioritizing collaboration over individual competition | Sorong (Papua) |
| 6 | Prioritizing team responsibilities and learning interdependence | |
| 4 | Prioritizing the team choices and expectations |
Indonesia has extreme cultural diversity, where there are many tribes/ethnic groups, religions, and beliefs in its territory. Each tribe has its original language and culture. Indonesia is an island country with approximately 9 million km2, located between two oceans and two continents with 17,500 islands with a coastline of about 95,181 km [61]. Every island in Indonesia has its original tribe. Islands like Kalimantan and Papua have tens or even hundreds of tribes who live there.
This high social heterogeneity requires different and more rigorous treatments than other countries with more homogeneous conditions. For example, Japan has low heterogeneity. Japanese society tends to be relatively homogeneous, and society’s character that obeys the rules causes this condition to be well preserved. This condition generally provides excellent opportunities for students in Japan to have high collaborative skills easily. Students in Japan are educated from an early age with an educational pattern that prioritizes togetherness and does not overly emphasize individual competition. This Japanese culture of togetherness provides support for students to learn together in achieving community goals. In Japan, the government delivers the holistic education system effectively. Teachers are skilled and take good care of all the students, where students participate and learn collaboratively, parents contribute extra learning after school, and there are learning support by communities. Thus, all parts of the educational system working together cohesively [62].
Table 11 speaks about the OECD Programme for International Student Assessment (PISA) 2015 [63]. Across OECD countries, 8% of students are top performers in collaborative problem solving, meaning that they can maintain an awareness of group dynamics, ensure team members act following their agreed-upon roles, and resolve disagreements and conflicts while identifying efficient pathways and monitoring progress toward a solution. Students in Japan were the second higher in collaborative problem solving than students in all other countries, after students in Singapore as the first position. Students in the United States were at the 13th and those in Thailand were at the 44th position, while students in Indonesia were still not included in the assessment.
Summary of students’ collaborative problem-solving program for international student assessment (PISA)
| Rank | Country | Students’ collaborative problem solving (mean score) | ||
|---|---|---|---|---|
| All students | Boys | Girls | ||
| 2 | Japan (East Asia) | 552 | 539 | 565 |
| 13 | United States | 520 | 507 | 533 |
| 44 | Thailand (Southeast Asia) | 436 | 416 | 451 |
| — | Indonesia (Southeast Asia) | — | — | — |
Source: OECD, PISA 2015 [63].
In the United States, collaborative lesson research focused on implementing the new learning standards piloted at 15 urban schools improved teaching and learning within the team and improved teaching and learning more broadly [64]. The study by Ku et al. in the United States shows that the learners believe that working in a group improves the quality of work because each step of the learning process is verified and corrected by group members, and the learners were able to discuss and understand each other perspective of the reading materials and what is needed to complete the assignment [65]. So far, there is no much data on Indonesian students’ collaborative assessments carried out internationally by independent institutions, which can be a definite reference. Therefore, this study is expected to become an authentic reference for designing a vocational lesson and learning strategy following students’ actual condition.
4.3 Students’ skill achievement characteristics
It is necessary to observe the students’ behaviors. Learners automatically form their skills by implementing the learning experiences they had in the class and interacting with the peers in a dynamic environment. The observation began by analyzing the descriptive statistics from the students’ performance related to the collaborative skill and construction drawing skill. The frequency distribution analysis of the mean score of the collaborative skill and construction drawing skill that refers to the assessment criteria in Table 2 can be grouped into four criteria conditions as shown in Figure 3.
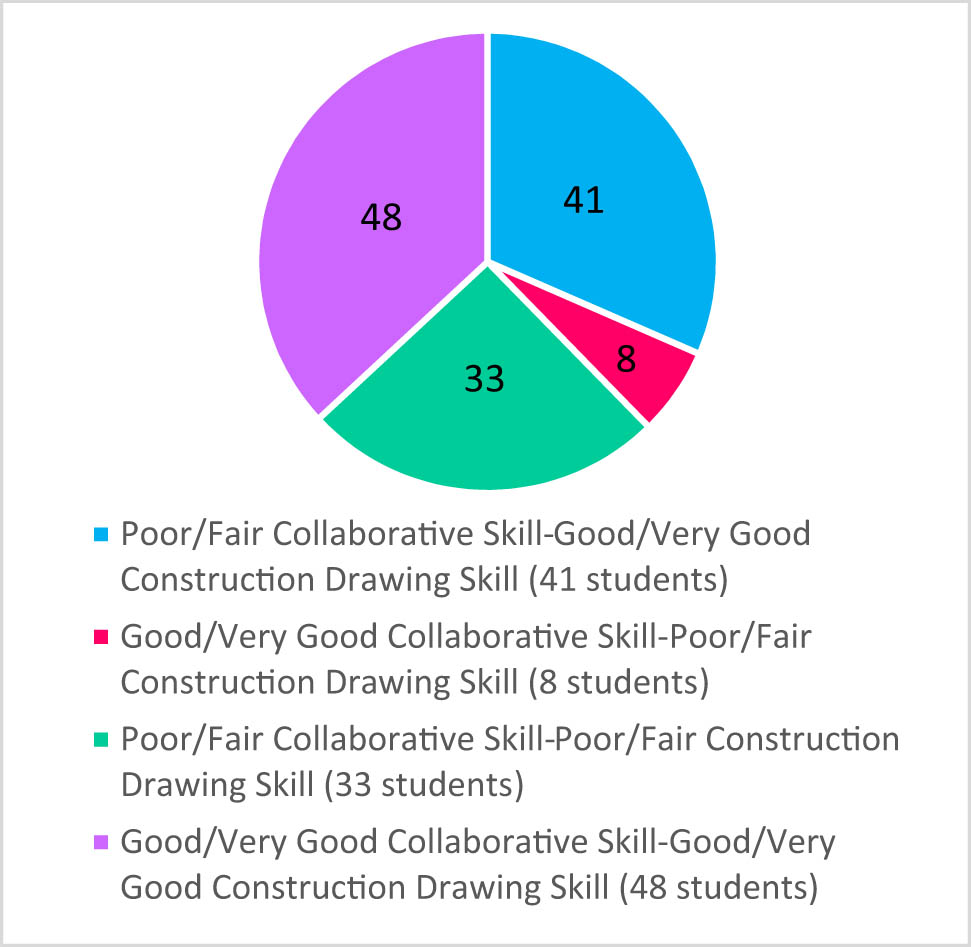
Students’ skill characteristics related to the level of collaborative skill and construction drawing skill criteria.
According to Figure 3, students’ characteristics related to the collaborative skill and construction drawing skill could be observed by comparing each students’ skill characteristics in the four-level category as follows:
The student with poor/fair collaborative skill – good/very good construction drawing skill.
The student with good/very good collaborative skill – poor/fair construction drawing skill.
The student with poor/fair collaborative skill – poor/fair construction drawing skill.
The student with good/very good collaborative skill – good/very good construction drawing skill.
Figure 3 shows that there are 41 students with poor/fair collaborative skill – good/very good construction drawing skill, eight students with good/very good collaborative skill – poor/fair construction drawing skill, 33 students with poor/fair collaborative skill – poor/fair construction drawing skill, and 48 students with good/very good collaborative skill – good/very good construction drawing skill. Figure 3 shows that more than one-third of students got a non-linear score. There are 49 students from the total samples of 130, including 41 students with poor/fair collaborative skills scores, on the other hand, getting good/very good construction drawing skills scores, and eight students with good/very good collaborative skills and at the same time getting poor/fair construction drawing skills.
It seems like a paradox for the hypothesis, which claimed a significant and positive influence of collaborative skill (X) toward construction drawing skill (Y). However, it is a fact that the regression analysis test has given a value of Sig. = 0.000, less than 0.05 probability, which means the null hypothesis is rejected, and the alternative hypothesis is accepted. Moreover, the t-count = 9.524, which is more than t-table = 1.96 (from the Critical Value Table of t Distribution [54] with referred the df = 128 of 0.05 probability). So, it is emphasized that the null hypothesis is rejected, and the alternative hypothesis is accepted. It can be concluded that there is a significant and positive influence of collaborative skill (X) toward construction drawing skill (Y). Conversely, the analysis has presented the adjusted R 2 of 0.410, which means that collaborative skill (X) contributes 41% to explain the dependent variable’s variants, construction drawing skill (Y). According to Duncan et al., it is in a moderate category. It is also a fact that there are 48 students with a linear score result, good/very good collaborative skill – good/very good construction drawing skill, and 33 students with poor/fair collaborative skill – poor/fair construction drawing skill.
Hence, the students’ skill condition is still good, where the collaborative skill (X) as a predictor contributes in a moderate category. There is a possibility to increase the skills systematically by designing a lesson and learning strategy following the students’ characteristics.
4.4 Students’ skill characteristics review
The research shows that almost one-third of the students have a high construction drawing skill score, but on the contrary, their collaborative skill is lower than their construction drawing skill score. Besides, there are 6% of the sample, eight students with a high collaborative skill score, and at the same time, they have a low construction drawing skill. These conditions practically need to be concerned and given special attention to reveal the phenomenon, propose solutions, and provide special training to get better learning outcomes for the students and a feasible lesson and learning model for the researcher to be designed. From an interview with the head of the vocational civil engineering education study program in Surakarta, some students were accustomed to have independent education, face various problems without others’ help, do all tasks individually, have self-responsibility, and live in an individualist family.
In line with the study by Popov et al., with the research of perceptions and experiences of university students in culturally diversified, students from an individualist cultural background resulted in a more negative perception of collaborative learning and students from an individualist cultural background achieved better learning outcomes than did students with a collaborative background, regardless of group composition [66]. These findings suggest that cultural background adds a vital dimension to collaborative learning, which requires educators and instructional designers to compose the learning environments to be responsive to the intercultural context. While Montgomery and Groat also align it with the comparative analysis research of the relationship between learning styles and student performance, where competitive learners often see all students in the class as working toward the same goal of learning. However, competitive learners want to become the first in achieving that goal more outstandingly than their peers [56,67]. This kind of education is usually meet in many families in Indonesia. According to an interview in a group discussion with 13 vocational teachers and lecturers, many parents encourage their children to get high grades at school, and even they prefer their children to be considered the smartest student in the class. They assume that class is the stage of the championship. On the contrary, some students who live with a collaborative family are accustomed to cooperating, helping each other, and caring for the environment. While the result of descriptive analysis of students’ skill achievement characteristics in Figure 3 shows the following percentage of the students achievement:
31.54% students with low collaborative skill and high construction drawing skill.
6.15% students with high collaborative skill and low construction drawing skill.
25.38% students with low collaborative skill and low construction drawing skill.
36.92% students with high collaborative skill and high construction drawing skill.
From those four characteristics, it can be classified into two groups:
Linear score group, which can be interpreted as the collaborative group, 25.38 and 36.92% = 62.31%.
Non-linear score group, which can be interpreted as the non-collaborative group, 31.54 and 6.15% = 37.69%.
The aforementioned classification shows a more considerable percentage of students in the collaborative group than the noncollaborative group, 62.31:37.69%. It is indicated that most of the student accepts the collaborative approach, and while at the regression result, it stated that there is a significant and positive contribution of collaborative skill toward construction drawing skill. Furthermore, regarding the research finding, the designing lesson and learning model will consider observing the students’ perception and satisfaction with the proposed collaborative lesson and learning model to adapt the student needs, primarily to accommodate the students’ demand from the noncollaborative group. Besides, innovative learning strategies and media will give relevant support to student’s needs based on their learning interests [68,69,70,71].
The adaptation for the noncollaborative group is expected to be a friendly solution for heterogeneous students in Indonesia. Islam, the majority religion in Indonesia, encourages collaboration with teamwork, democracy, and leadership in all aspects of life. The concept of shura, a part of Islamic teaching, is considered a significant attribute for successful leadership and managerial in a collaborative teamwork [28,72,73,74]. Moreover, the collaborative mindset belief that one person’s success depends on the group’s success referred to a collaborative setting as a positive interdependence [75,76]. Empowering students through developing a collaborative mindset is the right alternative solution. It is recommended to prepare a lesson and learning strategy following the students’ characteristics to improve collaborative skills that emphasize prioritizing collaboration between peers and learning interdependence, strengthening, and developing the students’ collaborative mindset to optimize the collaborative skills to gain essential civil engineering competencies, especially construction drawing skills.
5 Conclusion and future work
After obtaining the results and discussion, the null hypothesis (H 0) is rejected, and the alternative hypothesis (H a) is accepted. There is a significant and positive influence of collaborative skill (X) toward construction drawing skill (Y). Besides, the analysis has presented a linear regression model Ŷ = 31.443 + 1.952X. It also exhibited a correlation coefficient of 0.644, a coefficient of determination (R 2) of 0.415, and an adjusted R 2 of 0.410, where it can be concluded that the collaborative skill variable (X) as a predictor in the regression model includes the moderate category, which gives a 41% contribution in explaining the variants of the construction drawing skill (Y) as the dependent variable. The descriptive analysis results showed the collaborative skill is in a fair category of 60.00, and the construction drawing skill is in a good category of 67.49 on a 100 scale.
Conversely, however, the collaborative skill (X) has a significant and positive influence on construction drawing skill (Y), with a 41% contribution. According to the discussion, it is possible to be improved by giving special attention to the students’ specific behavioral details related to the collaborative skill indicators and managing students’ collaborative mindset.
Students’ various customs and cultures offer different characteristics, which lead to different motivations, habits, and behaviors, thus making different collaborative mindsets that build different collaborative skills and construction drawing skills.
Indonesia has an extraordinary cultural diversity with various social heterogeneity that requires different trainings to develop a better collaborative mindset. Regarding the research finding of students’ skill achievement characteristics, the designing lesson and learning model will consider observing the students’ perception and satisfaction of the proposed collaborative lesson and learning model to accommodate the noncollaborative students’ demand.
The future work is preparing a lesson and learning model to improve the collaborative mindset that emphasizes prioritizing collaboration between peers and learning interdependence.
The lesson and learning model will be designed to strengthen and develop the students’ collaborative mindset to optimize collaborative skills and gain construction drawing skills. Besides increasing the construction drawing skills, collaborative skill is also indispensable for survival and work properly in the industry.
Acknowledgment
We gratefully acknowledge Yamaguchi University, Universitas Sebelas Maret, and The Ministry of Education and Culture Republic of Indonesia for all the support. We also gratefully thank all the Lecturers and Teachers of vocational education institutions and industries involved in this research, without which the paper could not have been finished.
-
Conflict of interest: Authors state no conflict of interest.
-
Data availability statement: The data that support the findings of this study are available from the corresponding author, but restrictions apply to the availability of these data, so not publicly available. However, data are available upon reasonable request with permission of the research subjects and related institutions.
References
[1] Haseman JB . Indonesia. Asian security handbook: assessment of political-security issues in the Asia-Pacific region. Abingdon-on-Thames: Taylor and Francis; 2019. p. 159–65.10.4324/9781315285092-15Search in Google Scholar
[2] UNESCO-UNEVOC. World TVET database Indonesia [Internet]. Bonn, Germany: UNESCO-UNEVOC International Centre for TVET; 2013. Available from: http://www.unevoc.unesco.org/wtdb/worldtvetdatabase_blz_en.pdf Search in Google Scholar
[3] Setiawan AH . The contribution of the vocational teachers professional competence toward vocational high schools performance. The 3rd UPI International Conference on TVET. Bandung, Indonesia: Atlantis Press; 2015. p. 1–6.10.2991/ictvet-14.2015.1Search in Google Scholar
[4] Setiawan AH , Takaoka R . Designing PBL steps in vocational course based on students’ readiness and teachers’ discussion. Journal of Physics: Conference Series [Internet]. Yogyakarta, Indonesia: IOP Publishing Ltd; 2020. p. 1–9. Available from: https://iopscience.iop.org/article/10.1088/1742-6596/1456/1/012045/pdf 10.1088/1742-6596/1456/1/012045Search in Google Scholar
[5] Badan Pusat Statistik. Februari 2019: Open unemployment rate/Tingkat pengangguran terbuka (TPT) sebesar 5,01 persen [Internet]. 2019-05-06; 2019. Available from: https://www.bps.go.id/pressrelease/2019/05/06/1564/februari-2019 Search in Google Scholar
[6] Iswara MA , Gorbiano MI. Unemployment numbers fall to 6.82 million. The Jakarta Post [Internet]; 2019 May 7. p. 1. Available from: https://www.thejakartapost.com/news/2019/05/07/unemployment-numbers-fall-to-6-82-million.html Search in Google Scholar
[7] Setiawan AH , Takaoka R , Trianingsih L . Investigation of vocational students’ skills for determining learning experiences on CAD construction drawing course. IEEE International Conference on Engineering, Technology and Education, TALE [Internet]. Takamatsu: IEEE; 2020. p. 637–42. Available from: https://ieeexplore.ieee.org/document/9368338 10.1109/TALE48869.2020.9368338Search in Google Scholar
[8] Triyono MB , Trianingsih L , Nurhadi D . Students’ employability skills for construction drawing engineering in Indonesia. World Trans Eng Technol Educ. 2018;16(1):29–35.Search in Google Scholar
[9] Pavlova M . TVET as an important factor in country’s economic development. Springerplus [Internet]. 2014;3(Supplement 1):1–2. Available from: https://springerplus.springeropen.com/track/pdf/10.1186/2193-1801-3-S1-K3.pdf 10.1186/2193-1801-3-S1-K3Search in Google Scholar PubMed PubMed Central
[10] Bates R . Improving human resources for health planning in developing economies. Hum Resour Dev Int [Internet]. 2014;17(1):88–97. Available from: https://www.lsu.edu/chse/slhrd/research/Bates/BatesImprovinghrhplanning2014.pdf 10.1080/13678868.2013.857509Search in Google Scholar
[11] United Nation. Transforming our world: the 2030 agenda for sustainable development [Internet]. Resolution adopted by the General Assembly on 25 September 2015; 2015. Available from: https://www8.cao.go.jp/cstp/gaiyo/yusikisha/20160630/sanko1.pdf Search in Google Scholar
[12] Gigliotti M , Schmidt-Traub G , Bastianoni S . The sustainable development goals. Encyclopedia of ecology. 2nd ed. Amsterdam, The Netherlands: Elsevier Inc; 2018. p. 426–31.10.1016/B978-0-12-409548-9.10986-8Search in Google Scholar
[13] Global Education Monitoring Report Team. Global education monitoring report, 2020: inclusion and education: all means all [Internet]. Book; 2020. Available from: https://www.gcedclearinghouse.org/sites/default/files/resources/200213eng.pdf Search in Google Scholar
[14] UNESCO. Strategy for technical and vocational education and training (2016–2021) [Internet]. Bonn, Germany: UNESCO-UNEVOC International Centre for TVET; 2016. Available from: https://unevoc.unesco.org/up/2015eForum_UNESCO_TVET_Strategy.pdf Search in Google Scholar
[15] President of Republic of Indonesia. Presidential instruction number 9 year 2016 concerning revitalization of vocational high schools [Internet]. 9 Indonesia; 2016. p. 1–7. Available from: https://kemdikbud.go.id/main/files/download/e451d9ec3a04121 Search in Google Scholar
[16] Ditpsmk. Four focuses on vocational revitalization/empat fokus revitalisasi SMK [Internet]. psmk.kemdikbud.go.id; 2017 [cited 2020 Jun 12]. p. 1. Available from: https://www.kemdikbud.go.id/main/blog/2017/05/empat-fokus-revitalisasi-smk Search in Google Scholar
[17] Kamdi W. Revitalization of vocational schools: boosting national excellence/Revitalisasi SMK: mendongkrak unggulan nasional [Internet]. DitPSMK Direktorat Jenderal Pendidikan Dasar dan Menengah Kementerian Pendidikan dan Kebudayaan; 2017 [cited 2017 Sep 11]. p. 1. Available from: http://smk.kemdikbud.go.id/konten/2637/revitalisasi-smk-mendongkrak-unggulan-nasional Search in Google Scholar
[18] Khurniawan AW , Erda G . Improving the quality of vocational education through sustainable revitalization. Vocat Educ Policy [Internet]. 2019;1(19):1–14. Available from: https://www.researchgate.net/publication/338101654_Peningkatan_Mutu_Pendidikan_SMK_Melalui_Revitalisasi_Berkelanjutan Search in Google Scholar
[19] Direktorat Jenderal Manajemen Pendidikan Dasar dan Menengah. Implementation of internship/Pelaksanaan praktik kerja industri (prakerin) [Internet]. 1st ed. Jakarta; 2008. p. 1–9. Available from: https://www.academia.edu/5247952 Search in Google Scholar
[20] Djojonegoro W . Human resource development through vocational high school/Pengembangan sumberdaya manusia melalui SMK [Internet]. Jakarta: Jayakarta Agung; 1998. p. 1–178. https://catalogue.nla.gov.au/Record/3473058 Search in Google Scholar
[21] Amin NF , Latif AA , Arsat M , Suhairom N , Jumaat NF , Ismail ME . The implementation of the internship as a coursework in teaching and learning vocational education. J Tech Educ Train [Internet]. 2020;12(1 Special Issue):82–90. Available from: http://www.myjurnal.my/filebank/published_article/95413/9.pdf Search in Google Scholar
[22] Zambrano RJ , Kirschner F , Sweller J , Kirschner PA . Effects of prior knowledge on collaborative and individual learning. Learn Instr [Internet]. 2019 Oct 1;63(1):1–8. Available from: https://www.sciencedirect.com/science/article/pii/S0959475218306340 10.1016/j.learninstruc.2019.05.011Search in Google Scholar
[23] Sharma K , Olsen JK , Aleven V , Rummel N . Measuring causality between collaborative and individual gaze metrics for collaborative problem-solving with intelligent tutoring systems. J Comput Assist Learn [Internet]. 2021 Feb 1;37(1):51–68. Available from: https://onlinelibrary.wiley.com/doi/epdf/10.1111/jcal.12467?src=getftr 10.1111/jcal.12467Search in Google Scholar
[24] Schut T . The promise of education and its paradox in rural flores. East Indonesia. Focaal [Internet]. 2019;2019(83):85–97. Available from: https://www.berghahnjournals.com/view/journals/focaal/2019/83/fcl830109.xml 10.3167/fcl.2019.830109Search in Google Scholar
[25] Setiawan AH . Guided demonstration model on CAD learning with video media/model demonstrasi terbimbing pada pembelajaran CAD dengan media video. Prosiding Seminar Nasional UNS Vocational Day [Internet]. Surakarta: UNS; 2018. p. 540–52. Available from: https://jurnal.uns.ac.id/uvd/article/view/16226/0 Search in Google Scholar
[26] Carey P . Civilization on loan: the making of an upstart polity: mataram and its successors, 1600–1830. Mod Asian Stud [Internet]. 1997;31(3):711–34. 10.1017/s0026749x00017121.Search in Google Scholar
[27] Whyte SA . Advancing shūrā: a social agent for democratization. Islam Christ Relations [Internet]. 2019 Jul 3;30(3):345–62. 10.1080/09596410.2019.1641375.Search in Google Scholar
[28] Vasinayanuwatana T , Teo TW , Ketsing J . Shura-infused STEM professional learning community in an Islamic School in Thailand. Cult Stud Sci Educ [Internet]. 2021 Mar 1;16(1):109–39. 10.1007/s11422-020-09990-8.Search in Google Scholar
[29] Pickthall William M . The meaning of the glorious quran [Internet]. Later Prin. Chicago: Kazi Publications; 1996. p. 464. Available from: https://www.researchgate.net/publication/265623009 Search in Google Scholar
[30] Yusuf Ali A . The meaning of Holy Qur’an [Internet]. 11th ed. Beltsville USA: Amana Publications; 2006; p. 1–1759. Available from: https://quranyusufali.com/ Search in Google Scholar
[31] Irajpour A , Ghaljaei F , Alavi M . Concept of collaboration from the Islamic perspective: the view points for health providers. J Relig Health [Internet]. 2015 Oct 25;54(5):1800–9. 10.1007/s10943-014-9942-z.Search in Google Scholar PubMed
[32] Abbas D , Tan C . Transformational Islamic leadership: a case study from Singapore. Glob Perspect Teach Learn Paths Islam Educ [Internet]. 2019;1(August):76–91. Available from: https://www.researchgate.net/publication/335219176 10.4018/978-1-5225-8528-2.ch005Search in Google Scholar
[33] Smith L , Macgregor JT . What is collaborative learning ? Goodsell A, Maher M, Tinto V, Smith BL, MacGregor J, editors. Assessment [Internet]. 1992;117(5):10–30. Available from: https://www.researchgate.net/publication/242282475 Search in Google Scholar
[34] Krieger N . Methods for the scientific study of discrimination and health: an ecosocial approach. Am J Public Health [Internet]. 2012;102(5):936–45. 10.2105/AJPH.2011.300544.Search in Google Scholar PubMed PubMed Central
[35] Acar-Ciftci Y . Bridging knowledge and action in the workplace: an evaluation on internship learning outcomes of child development associate degree program students. J Educ Learn [Internet]. 2020 May 28;9(3):174–86. 10.5539/jel.v9n3p174.Search in Google Scholar
[36] Hartono T . Conceptions of theory and reality from a methodological perspective/Konsepsi teori dan realitas perspektif metodologi. J An-Nida [Internet]. 2015;40(1):60–8. Available from: http://ejournal.uin-suska.ac.id/index.php/Anida/article/view/1495 Search in Google Scholar
[37] Dikdasmen Directorate General Ministry of Education Republic of Indonesia. Appendix of vocational high school curriculum structure/struktur kurikulum sekolah menengah kejuruan [Internet]. 130/D/KEP/KR/2017 Indonesia; 2017. p. 1–301. Available from: https://blog.paperplane-tm.site/2020/01/struktur-kurikulum-2013-smk-tahun-2020.html Search in Google Scholar
[38] Dirjen Dikdasmen Ministry of Education. Directorate general regulation number 7 year 2018 concerning vocational high school curriculum structure/Struktur kurikulum sekolah menengah kejuruan [Internet]. 07/D.D5/KK/2018 Indonesia; 2018. p. 1–307. Available from: http://103.40.55.195/dokkur Search in Google Scholar
[39] Ministry of Education and Culture of Republic of Indonesia. Regulation of the minister of education and culture of the republic of Indonesia number 21 of 2016 concerning content standards for primary and secondary education [Internet]. Indonesia; 2016. p. 1–4. Available from: http://repositori.kemdikbud.go.id/4791/1/Permendikbud_Tahun2016_Nomor021.pdf Search in Google Scholar
[40] Ministry of Education and Culture of Republic of Indonesia. Regulation of the minister of education and culture of the republic of Indonesia number 22 of 2016 concerning standards of process [Internet]. 22 Indonesia; 2016. p. 1–3. Available from: http://repositori.kemdikbud.go.id/4790/ Search in Google Scholar
[41] Public Works Department of Republic of Indonesia. Architecture droughtsman, Indonesian national work competency standards [Internet]. Jakarta: Public Works Department of Republic of Indonesia; 2006. p. 1–50. Available from: http://sibima.pu.go.id/pluginfile.php/32255/mod_resource/content/1/SKKNI-2006-JuruGambar Arsitektur.pdf Search in Google Scholar
[42] Jane. Strategies to develop skills for positive training transfer. Adult High Educ Alliance. 2018;1(1988):93–9.Search in Google Scholar
[43] Curry DH , Caplan P , Knuppel J . Transfer of training and adult learning (TOTAL). J Contin Soc Work Educ [Internet]. 1994;6(1):8–14. Available from: https://www.researchgate.net/publication/253820781 Search in Google Scholar
[44] Cochran C , Brown S . Andragogy and the adult learner. In: Flores KA , Kirstein KD , Schieber CE , Olswang SG , editors. Supporting the success of adult and online students: proven practices in higher education [Internet]. CreateSpace Independent Publishing Platform; 2016. p. 73–84. Available from: https://repository.cityu.edu/handle/20.500.11803/585. Search in Google Scholar
[45] Wang VX . Andragogy and pedagogy in learning theories. Encyclopedia of human resources information systems; 2011. p. 42–7. Available from: https://dx.doi.org/10.4018/978-1-59904-883-3.ch007. 10.4018/978-1-59904-883-3.ch007Search in Google Scholar
[46] Aiken LR . Content validity and reliability of single items or questionnaires. Educ Psychol Meas [Internet]. 1980;40(4):955–9. 10.1177/001316448004000419.Search in Google Scholar
[47] Aiken LR . Three coefficients for analyzing the reliability and validity of ratings. Educ Psychol Meas [Internet]. 1985;45(1):131–42. Available from: https://sci-hub.st/https://doi.org/10.1177%2F0013164485451012 10.1177/0013164485451012Search in Google Scholar
[48] Shrout PE , Fleiss JL . Intraclass correlations: uses in assessing rater reliability. Psychol Bull [Internet]. 1979;86(2):420–8. 10.1037/0033-2909.86.2.420.Search in Google Scholar
[49] Hadi S . Statistics 2nd edition/Statistik jilid 2 [Internet]. 2nd ed. Yogyakarta, Indonesia: Andi Offset; 2006. p. 1–291. Available from: http://library.fip.uny.ac.id/opac/index.php?p=show_detail&id=1028 Search in Google Scholar
[50] Budiyono. Statistics for research/Statistika untuk penelitian [Internet]. 2nd ed. Suyono, editor. Surakarta: UNS Press; 2016. p. 1–339. Available from: http://library.fis.uny.ac.id/opac/index.php?p=show_detail&id=1294 Search in Google Scholar
[51] Sudarmanto RG . Multiple linear regression analysis with SPSS/analisis regresi linear ganda dengan SPSS [Internet]. Vol. 1. Graha Ilmu; 2005. Available from: https://docplayer.info/44148007-Analisis-regresi-linear-ganda-dengan-spss.html Search in Google Scholar
[52] Alexopoulos EC . Introduction to multivariate regression analysis. Hippokratia [Internet]. 2010;14(1):23–8. Available from: https://www.ncbi.nlm.nih.gov/pmc/articles/PMC3049417/pdf/hippokratia-14-23.pdf Search in Google Scholar
[53] Duncan GM , Berry WD , Feldman S . Multiple regression in practice. J Mark Res [Internet]. 1986;23(3):309–10. 10.2307/3151494.Search in Google Scholar
[54] Latan H . Statistical data analysis application for social sciences with IBM SPSS [Internet]. 1st ed. Bandung: Alfabeta; 2014. p. 1–440. Available from: https://cvalfabeta.com/product/aplikasi-analisis-data-statistik-untuk-ilmu-sosial-sains-dengan-ibm-spss/ Search in Google Scholar
[55] Draper NR , Smith H . Applied regression analysis [Internet]. Applied regression analysis. New Jersey: Wiley; 2014. p. 1–716. 10.1002/9781118625590.Search in Google Scholar
[56] Ma VJ , Ma X . A comparative analysis of the relationship between learning styles and mathematics performance. Int J STEM Educ [Internet]. 2014;1(1):1–13. 10.1186/2196-7822-1-3.Search in Google Scholar
[57] Weinstein CE , Hume LM . Study strategies for lifelong learning. Psychology in the classroom. Lexington: American Psychological Association; 1998. p. 1–94.10.1037/10296-000Search in Google Scholar
[58] Murphy PK , Alexander PA . Contextualizing learner-centered principles for teachers and teaching. The keys to effective schools: educational reform as continuous improvement [Internet]. 2nd ed. Corwin Press, Inc; 2007. p. 13–32. 10.4135/9781483329512.n2.Search in Google Scholar
[59] Jerald CD . Defining a 21st century education. Cent Public Educ. 2009;1(July):1–82.Search in Google Scholar
[60] Laux D , Luse A , Mennecke BE . Collaboration, connectedness, and community: an examination of the factors influencing student persistence in virtual communities. Comput Human Behav [Internet]. 2016;57(1):452–64. 10.1016/j.chb.2015.12.046.Search in Google Scholar
[61] Kusmana C , Hikmat A . The biodiversity of flora in Indonesia/Keanekaragaman hayati flora di Indonesia. J Nat Resour Environ Manag [Internet]. 2015;5(2):187–98. 10.19081/jpsl.5.2.187.Search in Google Scholar
[62] OECD. Education policy in Japan: building bridges towards 2030 [Internet]. Reviews of national policies for education. Paris: OECD; 2018. p. 1–4. Available from: https://www.oecd.org/education/Japan-BB2030-Highlights.pdf Search in Google Scholar
[63] OECD. PISA 2015 results in focus [Internet]. Vol. 1. Result in focus. Paris; 2018. p. 1–32. Available from: https://www.oecd.org/pisa/pisa-2015-results-in-focus.pdf Search in Google Scholar
[64] Takahashi A , McDougal T . Collaborative lesson research: maximizing the impact of lesson study. ZDM Math Educ [Internet]. 2016;48(4):513–26. Available from: https://link.springer.com/content/pdf/10.1007%2Fs11858-015-0752-x.pdf 10.1007/s11858-015-0752-xSearch in Google Scholar
[65] Ku HY , Tseng HW , Akarasriworn C . Collaboration factors, teamwork satisfaction, and student attitudes toward online collaborative learning. Comput Human Behav [Internet]. 2013;29(3):922–9. 10.1016/j.chb.2012.12.019.Search in Google Scholar
[66] Popov V , Noroozi O , Barrett JB , Biemans HJA , Teasley SD , Slof B , et al. Perceptions and experiences of, and outcomes for, university students in culturally diversified dyads in a computer-supported collaborative learning environment. Comput Human Behav [Internet]. 2014;32(1):186–200. 10.1016/j.chb.2013.12.008.Search in Google Scholar
[67] Montgomery S , Groat L . Student learning styles and their implications for teaching [Internet]. Occasional paper. Vol. 10. Ann Arbor: The University of Michigan; 1998. p. 1–8. Available from: https://web.uri.edu/teach/files/Student-Learning-Styles-and-Their-Implications-for-Teaching.pdf Search in Google Scholar
[68] Seechaliao T . Instructional strategies to support creativity and innovation in education. J Educ Learn [Internet]. 2017 Jul 9;6(4):201–8. 10.5539/jel.v6n4p201.Search in Google Scholar
[69] Song Y . How to flip the classroom in school students’ mathematics learning: bridging in- and out-of-class activities via innovative strategies. Technol Pedagog Educ [Internet]. 2020 May 26;29(3):327–45. 10.1080/1475939X.2020.1749721.Search in Google Scholar
[70] Setiawan AH . Development of CAD learning media/Pengembangan media pembelajaran CAD sebagai penunjang perkuliahan pendidikan teknik bangunan dan pembelajaran SMK jurusan bangunan. J Ilm Pendidik Tek dan Kejuru [Internet]. 2013;6(1):1–5. 10.20961/jiptek.v6i1.12504.Search in Google Scholar
[71] Setiawan AH . Implementing the STAD based on instructional media to draw buildings/Penerapan metode STAD berbasis media video pembelajaran menggambar bangunan gedung pada sekolah kejuruan. Prosiding Seminar Nasional UNS Vocational Day [Internet]. Surakarta: UNS; 2016. p. 355–63. Available from: https://jurnal.uns.ac.id/uvd/article/view/6864 Search in Google Scholar
[72] Taqi-ud-Din Al-Hilali M , Muhsin Khan M . Interpretation of the meaning of The Noble Qur’an [Internet]. Revised. Riyadh: Darussalam; 2011. p. 1–1189. Available from: https://onlineislamicbook.com/noble-quran-medium-size-8-7-x-6-0-x-1-8-inch/ Search in Google Scholar
[73] Abdullah F , Azmin AK , Salleh NH . Developing graduates’ collaboration skill based on Islamic perspective through integrated multi-disciplinary course in the built environment. Int J Soc Sci Humanit [Internet]. 2014;4(2):117–21. Available from: http://www.ijssh.org/papers/330-A00020.pdf 10.7763/IJSSH.2014.V4.330Search in Google Scholar
[74] Zain NRBM , Zulkarnain IFB , Hassan PDR . Shari’ah corporate governance structure of malaysian Islamic banking and finance: the traces of shura. J Islam Bank Financ [Internet]. 2015;3(1):26–34. Available from: http://jibfnet.com/journals/jibf/Vol_3_No_1_June_2015/3.pdf 10.15640/jibf.v3n1a3Search in Google Scholar
[75] Laal M . Positive interdependence in collaborative learning. Procedia Soc Behav Sci [Internet]. 2013;93(1):1433–7. 10.1016/j.sbspro.2013.10.058.Search in Google Scholar
[76] Laal M , Laal M . Collaborative learning: what is it? Procedia Soc Behav Sci [Internet]. 2012;31(1):491–5. 10.1016/j.sbspro.2011.12.092.Search in Google Scholar
© 2021 Abdul Haris Setiawan et al., published by De Gruyter
This work is licensed under the Creative Commons Attribution 4.0 International License.
Articles in the same Issue
- Regular Articles
- Electrochemical studies of the synergistic combination effect of thymus mastichina and illicium verum essential oil extracts on the corrosion inhibition of low carbon steel in dilute acid solution
- Adoption of Business Intelligence to Support Cost Accounting Based Financial Systems — Case Study of XYZ Company
- Techno-Economic Feasibility Analysis of a Hybrid Renewable Energy Supply Options for University Buildings in Saudi Arabia
- Optimized design of a semimetal gasket operating in flange-bolted joints
- Behavior of non-reinforced and reinforced green mortar with fibers
- Field measurement of contact forces on rollers for a large diameter pipe conveyor
- Development of Smartphone-Controlled Hand and Arm Exoskeleton for Persons with Disability
- Investigation of saturation flow rate using video camera at signalized intersections in Jordan
- The features of Ni2MnIn polycrystalline Heusler alloy thin films formation by pulsed laser deposition
- Selection of a workpiece clamping system for computer-aided subtractive manufacturing of geometrically complex medical models
- Development of Solar-Powered Water Pump with 3D Printed Impeller
- Identifying Innovative Reliable Criteria Governing the Selection of Infrastructures Construction Project Delivery Systems
- Kinetics of Carbothermal Reduction Process of Different Size Phosphate Rocks
- Plastic forming processes of transverse non-homogeneous composite metallic sheets
- Accelerated aging of WPCs Based on Polypropylene and Birch plywood Sanding Dust
- Effect of water flow and depth on fatigue crack growth rate of underwater wet welded low carbon steel SS400
- Non-invasive attempts to extinguish flames with the use of high-power acoustic extinguisher
- Filament wound composite fatigue mechanisms investigated with full field DIC strain monitoring
- Structural Timber In Compartment Fires – The Timber Charring and Heat Storage Model
- Technical and economic aspects of starting a selected power unit at low ambient temperatures
- Car braking effectiveness after adaptation for drivers with motor dysfunctions
- Adaptation to driver-assistance systems depending on experience
- A SIMULINK implementation of a vector shift relay with distributed synchronous generator for engineering classes
- Evaluation of measurement uncertainty in a static tensile test
- Errors in documenting the subsoil and their impact on the investment implementation: Case study
- Comparison between two calculation methods for designing a stand-alone PV system according to Mosul city basemap
- Reduction of transport-related air pollution. A case study based on the impact of the COVID-19 pandemic on the level of NOx emissions in the city of Krakow
- Driver intervention performance assessment as a key aspect of L3–L4 automated vehicles deployment
- A new method for solving quadratic fractional programming problem in neutrosophic environment
- Effect of fish scales on fabrication of polyester composite material reinforcements
- Impact of the operation of LNG trucks on the environment
- The effectiveness of the AEB system in the context of the safety of vulnerable road users
- Errors in controlling cars cause tragic accidents involving motorcyclists
- Deformation of designed steel plates: An optimisation of the side hull structure using the finite element approach
- Thermal-strength analysis of a cross-flow heat exchanger and its design improvement
- Effect of thermal collector configuration on the photovoltaic heat transfer performance with 3D CFD modeling
- Experimental identification of the subjective reception of external stimuli during wheelchair driving
- Failure analysis of motorcycle shock breakers
- Experimental analysis of nonlinear characteristics of absorbers with wire rope isolators
- Experimental tests of the antiresonance vibratory mill of a sectional movement trajectory
- Experimental and theoretical investigation of CVT rubber belt vibrations
- Is the cubic parabola really the best railway transition curve?
- Transport properties of the new vibratory conveyor at operations in the resonance zone
- Assessment of resistance to permanent deformations of asphalt mixes of low air void content
- COVID-19 lockdown impact on CERN seismic station ambient noise levels
- Review Articles
- FMEA method in operational reliability of forest harvesters
- Examination of preferences in the field of mobility of the city of Pila in terms of services provided by the Municipal Transport Company in Pila
- Enhancement stability and color fastness of natural dye: A review
- Special Issue: ICE-SEAM 2019 - Part II
- Lane Departure Warning Estimation Using Yaw Acceleration
- Analysis of EMG Signals during Stance and Swing Phases for Controlling Magnetorheological Brake applications
- Sensor Number Optimization Using Neural Network for Ankle Foot Orthosis Equipped with Magnetorheological Brake
- Special Issue: Recent Advances in Civil Engineering - Part II
- Comparison of STM’s reliability system on the example of selected element
- Technical analysis of the renovation works of the wooden palace floors
- Special Issue: TRANSPORT 2020
- Simulation assessment of the half-power bandwidth method in testing shock absorbers
- Predictive analysis of the impact of the time of day on road accidents in Poland
- User’s determination of a proper method for quantifying fuel consumption of a passenger car with compression ignition engine in specific operation conditions
- Analysis and assessment of defectiveness of regulations for the yellow signal at the intersection
- Streamlining possibility of transport-supply logistics when using chosen Operations Research techniques
- Permissible distance – safety system of vehicles in use
- Study of the population in terms of knowledge about the distance between vehicles in motion
- UAVs in rail damage image diagnostics supported by deep-learning networks
- Exhaust emissions of buses LNG and Diesel in RDE tests
- Measurements of urban traffic parameters before and after road reconstruction
- The use of deep recurrent neural networks to predict performance of photovoltaic system for charging electric vehicles
- Analysis of dangers in the operation of city buses at the intersections
- Psychological factors of the transfer of control in an automated vehicle
- Testing and evaluation of cold-start emissions from a gasoline engine in RDE test at two different ambient temperatures
- Age and experience in driving a vehicle and psychomotor skills in the context of automation
- Consumption of gasoline in vehicles equipped with an LPG retrofit system in real driving conditions
- Laboratory studies of the influence of the working position of the passenger vehicle air suspension on the vibration comfort of children transported in the child restraint system
- Route optimization for city cleaning vehicle
- Efficiency of electric vehicle interior heating systems at low ambient temperatures
- Model-based imputation of sound level data at thoroughfare using computational intelligence
- Research on the combustion process in the Fiat 1.3 Multijet engine fueled with rapeseed methyl esters
- Overview of the method and state of hydrogenization of road transport in the world and the resulting development prospects in Poland
- Tribological characteristics of polymer materials used for slide bearings
- Car reliability analysis based on periodic technical tests
- Special Issue: Terotechnology 2019 - Part II
- DOE Application for Analysis of Tribological Properties of the Al2O3/IF-WS2 Surface Layers
- The effect of the impurities spaces on the quality of structural steel working at variable loads
- Prediction of the parameters and the hot open die elongation forging process on an 80 MN hydraulic press
- Special Issue: AEVEC 2020
- Vocational Student's Attitude and Response Towards Experiential Learning in Mechanical Engineering
- Virtual Laboratory to Support a Practical Learning of Micro Power Generation in Indonesian Vocational High Schools
- The impacts of mediating the work environment on the mode choice in work trips
- Utilization of K-nearest neighbor algorithm for classification of white blood cells in AML M4, M5, and M7
- Car braking effectiveness after adaptation for drivers with motor dysfunctions
- Case study: Vocational student’s knowledge and awareness level toward renewable energy in Indonesia
- Contribution of collaborative skill toward construction drawing skill for developing vocational course
- Special Issue: Annual Engineering and Vocational Education Conference - Part II
- Vocational teachers’ perspective toward Technological Pedagogical Vocational Knowledge
- Special Issue: ICIMECE 2020 - Part I
- Profile of system and product certification as quality infrastructure in Indonesia
- Prediction Model of Magnetorheological (MR) Fluid Damper Hysteresis Loop using Extreme Learning Machine Algorithm
- A review on the fused deposition modeling (FDM) 3D printing: Filament processing, materials, and printing parameters
- Facile rheological route method for LiFePO4/C cathode material production
- Mosque design strategy for energy and water saving
- Epoxy resins thermosetting for mechanical engineering
- Estimating the potential of wind energy resources using Weibull parameters: A case study of the coastline region of Dar es Salaam, Tanzania
- Special Issue: CIRMARE 2020
- New trends in visual inspection of buildings and structures: Study for the use of drones
- Special Issue: ISERT 2021
- Alleviate the contending issues in network operating system courses: Psychomotor and troubleshooting skill development with Raspberry Pi
- Special Issue: Actual Trends in Logistics and Industrial Engineering - Part II
- The Physical Internet: A means towards achieving global logistics sustainability
- Special Issue: Modern Scientific Problems in Civil Engineering - Part I
- Construction work cost and duration analysis with the use of agent-based modelling and simulation
- Corrosion rate measurement for steel sheets of a fuel tank shell being in service
- The influence of external environment on workers on scaffolding illustrated by UTCI
- Allocation of risk factors for geodetic tasks in construction schedules
- Pedestrian fatality risk as a function of tram impact speed
- Technological and organizational problems in the construction of the radiation shielding concrete and suggestions to solve: A case study
- Finite element analysis of train speed effect on dynamic response of steel bridge
- New approach to analysis of railway track dynamics – Rail head vibrations
- Special Issue: Trends in Logistics and Production for the 21st Century - Part I
- Design of production lines and logistic flows in production
- The planning process of transport tasks for autonomous vans
- Modeling of the two shuttle box system within the internal logistics system using simulation software
- Implementation of the logistics train in the intralogistics system: A case study
- Assessment of investment in electric buses: A case study of a public transport company
- Assessment of a robot base production using CAM programming for the FANUC control system
- Proposal for the flow of material and adjustments to the storage system of an external service provider
- The use of numerical analysis of the injection process to select the material for the injection molding
- Economic aspect of combined transport
- Solution of a production process with the application of simulation: A case study
- Speedometer reliability in regard to road traffic sustainability
- Design and construction of a scanning stand for the PU mini-acoustic sensor
- Utilization of intelligent vehicle units for train set dispatching
- Special Issue: ICRTEEC - 2021 - Part I
- LVRT enhancement of DFIG-driven wind system using feed-forward neuro-sliding mode control
- Special Issue: Automation in Finland 2021 - Part I
- Prediction of future paths of mobile objects using path library
- Model predictive control for a multiple injection combustion model
- Model-based on-board post-injection control development for marine diesel engine
- Intelligent temporal analysis of coronavirus statistical data