On the Capability of Logarithmic-Power Model for Prediction of Hot Deformation Behavior of Alloy 800H at High Strain Rates
-
E. Shafiei

 and
A. Soltani Tehrani
and
A. Soltani Tehrani

Abstract
In this study, the logarithmic-power model has been used to predict hot deformation behavior of alloy 800H at high temperatures. This is for the first time that the logarithmic-power model is examined to model the flow stress curves with negligible flow softening at high strain rates. To this end, flow stress curves of alloy 800H obtained at deformation temperatures from 850°C to 1050°C and at strain rates of 5 and 10 S−1 were employed. The Johnson–Cook model and Shafiei constitutive equation were also used to prove the accuracy of the logarithmic-power model in prediction of flow stress curves of alloy 800H. Evaluation of mean error of flow stress at different deformation conditions showed that the logarithmic-power model can give a more precise estimation of flow stress curves than Johnson–Cook model. Furthermore, it was found out that the accuracy of the Logarithmic-power model and Shafiei constitutive equation was roughly the same in terms of maximum errors obtained in prediction of flow stress curves. Accordingly, it can be concluded that the logarithmic-power model can be employed as a comprehensive model for a wide range of deformation conditions.
Introduction
Since the computer simulation of metal-forming processes is used increasingly in the industry, an accurate flow stress estimation is the preliminary requirement [1]. This is especially the case for hot forming processes, which are usually more complicated in terms of occurrence of restoration mechanisms such as dynamic recrystallization (DRX) and dynamic recovery (DRV). The understanding of these phenomena can help one characterizing the hot deformation behavior of the metals and alloys. Considerable researches have been carried out to present constitutive equations for prediction of flow stress curves at high temperatures. However, most of the presented models developed to study material behavior at low strain rates (low Zener–Holloman parameters) are more appropriate for laboratory studies and consequently do not represent the material behavior at industrially relevant strain rates (higher than 1 S−1) [2, 3, 4, 5, 6, 7]. Considering the importance of flow stress estimation in products’ dimensional accuracy, it is inevitable to propose or modify a constitutive equation to predict material’s behavior at high strain rates.
Recently, the authors of the present study have presented a novel constitutive equation (known as logarithmic-power model) for prediction of stress–strain curves with significant softening at low strain rates [8]. Moreover, this model has the capability to predict critical strain for initiation of DRX, transient strain associated with maximum softening rate in Meta-DRX, and peak strain simultaneously. Accordingly, it could be deduced that the logarithmic-power model can be employed as a comprehensive model for a wide range of deformation conditions with different predominant restoration mechanisms provided that this model gets approved for the high strain rate conditions.
To this end, our aim is to examine the ability of logarithmic-power model for prediction of stress–strain curves of alloy 800H at industrial deformation conditions.
Mathematical modeling
For metals with DRV, the flow stress curves increase with strain in the initial stage of deformation and reach constant values in consequence of attaining the balance between work hardening and DRV (saturation stress, σs). In addition, it is expected that at high strain rates, the concurrent deformation weakens the effect of softening on flow stress curves. Accordingly, the peak point becomes blur, and consequently, the flow stress curve is similar to the case of DRV. The derivative of the DRV stress–strain curve is positive, and then, phenomenologically the slope of stress–strain curve approaches zero.
The following nonlinear estimation of strain hardening rate vs. strain was taken into account to obtain logarithmic-power model:
where b and c are constants. For DRV-type stress–strain curves, using the boundary condition Ɵ=0 at Ɛ=Ɛs, eq. (1) can be rewritten in the following form:
where constant A equals to
where a and b are constants. Since constants a and b are stress variants, their values should be obtained at different temperatures and strain rates utilizing a least square fit of flow data.
Results and discussion
In the present study, published stress–strain curves obtained from hot compression tests of alloy 800H at various deformation conditions were employed [9]. The curves were sampled at varying strain intervals (more frequently at locations of higher curvature) directly on the published stress–strain curves. Chemical composition of the hot compression specimens of alloy 800H is presented in Table 1.
Chemical compositions (wt%) for the alloy of this study.
| Element | C | Mn | Si | Ni | Cr | Al | Ti | Cu | N | Fe |
|---|---|---|---|---|---|---|---|---|---|---|
| Wt% | 0.068 | 0.08 | 0.31 | 30.5 | 20.2 | 0.36 | 0.34 | 0.02 | 0.013 | Bal. |
Stress–strain curves of alloy 800H obtained at various deformation temperatures from 850°C to 1050°C and at constant strain rate of 5 and 10 S−1 were presented in Figure 1. It is notable to mention that the effect of adiabatic heating during high strain rate deformation has been taken into account, and consequently, the corrected flow stress curves were applied to verify the logarithmic-power model.
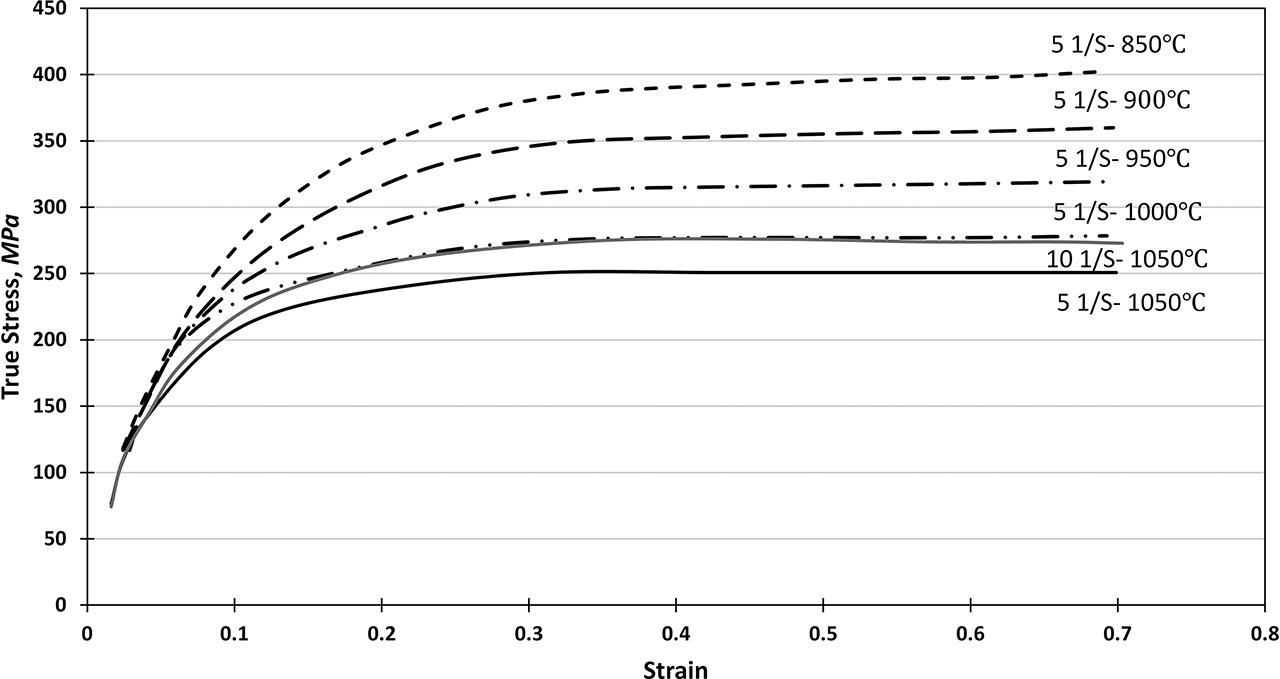
Flow stress curves of alloy 800H at different deformation conditions.
All flow stress curves exhibit a rapid initial increase to a saturation stress as a result of attaining the balance between strain hardening and predominant restoration mechanisms. The drop in flow stress with increasing deformation temperature may be attributed to the increase in the rate of restoration mechanisms and simultaneously decrease in the strain hardening rate, Figure 1. However, the increase in the flow stress with strain rate can be ascribed to the decrease in the time for restoration mechanisms to occur and subsequent increase in the work hardening rate.
The stepping stone to construct the flow stress curves using logarithmic-power model is to establish the dependence of the parameters a and b on temperature and strain rate for alloy 800H. In this regard, Figures 2 and 3 show the variations of these two constants with absolute temperature and strain rate, respectively. It is obvious that both constants of a and b vary linearly with absolute temperature. Linearity of these changes makes the interpolation of these constants possible at any intermediate temperatures. However, more data points are needed to establish a mathematical relation for the variations of constants a and b with strain rate for the alloy of this study. Also, it is obvious that both constants decrease with increasing deformation temperature and decreasing strain rate. As a result, it may be deduced that any factor resulting in Zener–Holloman parameter increase would also lead to these two constants’ increase.

Dependency of logarithmic-power model constants on absolute temperature.

Dependency of logarithmic-power model constants on strain rate.
As shown in Figures 4 and 5, the stress–strain curves predicted using logarithmic-power model are in a good agreement with experimentally measured ones for the alloy of this study. As it could be seen, at strain rates lower than 0.6, the logarithmic-power model predictions have a good accuracy although, at strain rates greater than 0.6 (

Comparison between predicted and experimentally measured flow stress curves obtained at different deformation temperatures and constant strain rate of 5 S–1.

Comparison between predicted and experimentally measured flow stress curves obtained at different strain rates of 5 S−1 and 10 S−1 and at constant temperature of 1,050°C.

Predicted flow stress versus experimentally measured ones at different deformation conditions.
To draw a comparison between the predictions of logarithmic-power model with previous models pertaining modeling of flow stress curves, Johnson–Cook model [10], as one of the most cited models in this field, was used. The full form of Johnson–Cook model can be expressed as follows:
where A is yield stress of the material under reference deformation conditions (MPa), B is strain hardening constant (MPa), n is strain hardening coefficient, and m is thermal softening coefficient. In this experiment, the reference temperature Tr and strain rate
The procedures used to obtain the constants of eq. (8) can be found in full detail in Ref. [8]. The mean error in prediction of flow stress for both logarithmic-power and Johnson–Cook models was calculated to evaluate the accuracy of the predictions. Accordingly, Figures 7 and 8 show the predictions of these two models and their corresponding mean error analysis compared with experimental flow stress curves at different deformation conditions. As can be seen, at low strains in which the strain hardening rate is high, the logarithmic-power function give a more precise estimation of flow stress curves for both deformation conditions. However, at strains greater than 0.6, the Johnson–Cook model is relatively more accurate. The reason behind the decrease in the accuracy of the logarithmic-power model at higher strains can be attributed to its initial assumptions for estimation of strain hardening rate variations with strain. Accordingly, Figure 9 shows the variations of strain hardening rate versus strain at different deformation conditions obtained using first derivative of eq. (3). As shown, the strain hardening rate decreases with strain down to a minimum point representing the onset of steady state region of flow stress curves, followed by a gradual increase to a maximum point. This increase in strain hardening rate is responsible for a decrease in the accuracy of the predictions at higher strains. The maximum error of Johnson–Cook model is about 48 % obtained at low strains, while the maximum error associated with the predictions of logarithmic-power model is about 11 %. Hence, it could be concluded that the logarithmic-power model has a good ability to predict flow stress curves at high strain rates with negligible softening although this model was presented to predict stress–strain curves with extended softening at low strain rates.

Comparison between the predictions of logarithmic-power model and Johnson–Cook model at temperature of 850°C and strain rate of 5 S−1: (A) flow stress curves and (B) mean error in prediction of flow stress.

Comparison between the predictions of logarithmic-power model and Johnson–Cook model at temperature of 1050°C and strain rate of 10 S−1: (A) flow stress curves and (B) mean error in prediction of flow stress.

Variations of strain hardening rate versus strain at different deformation conditions obtained using logarithmic-power model.
Recently, Shafiei [5] has proposed a constitutive equation based on linear estimation of strain hardening rate versus stress curves to predict stress–strain curves of alloy 800H at high temperatures and strain rates. Accordingly, it was concluded that, in comparison with the results obtained using Johnson–Cook model, Shafiei constitutive equation can give a more precise estimation of flow stress curves at different deformation conditions for alloy 800H. According to Shafiei constitutive equation, stress–strain curves can be modeled using the following expression:
where
Accordingly, the flow stress curves predicted using the logarithmic-power model and Shafiei constitutive equation for deformation temperature of 850°C and strain rate of 5 S−1 were shown in Figure 10(a). As can be seen, both models underestimate the flow stress at very low strains, and consequently, maximum error in prediction of flow stress curves was obtained at this region for both models (11 % for logarithmic-power model and 10.2 % for Shafiei constitutive equation). Consequently, it is obvious that both models can provide a roughly the same estimation of flow stress curves in terms of maximum error values. In addition, considering the average error values for both models, Shafiei constitutive equation can give a somewhat more precise prediction of flow stress curves, Figure 10(b). On this basis, it can be concluded that, although Shafiei constitutive equation can provide a slightly better estimation of stress–strain curves than the logarithmic-power model for the alloy of this study, it can only be employed to predict the flow stress curves with negligible softening due to its linear estimation of strain hardening plots, and consequently, it is not appropriate to be used for a wide range of deformation conditions at which significant flow softening may occur.

Comparison between the predictions of logarithmic-power model and Shafiei constitutive equation at temperature of 850°C and strain rate of 5 S−1: (A) flow stress curves and (B) mean error in prediction of flow stress.
Conclusions
It was found out that the logarithmic-power model can also provide a precise estimation of flow stress curves at high strain rates with negligible flow softening.
The reason behind the decrease in the accuracy of the logarithmic-power model at higher strains can be attributed to its initial assumptions for estimation of strain hardening rate variations with strain.
In comparison with Johnson–Cook model, the logarithmic-power model can give a more accurate estimation of flow stress curves at the studied deformation conditions.
The error analysis showed that Shafiei constitutive equation provides a slightly better estimation of flow stress curves than logarithmic-power model; however, its application is limited to the conditions with negligible flow softening.
References
[1] H. Mirzadeh, Mech. Mater., 85 (2015) 66–79.10.1016/j.mechmat.2015.02.014Search in Google Scholar
[2] E. Shafiei and R. Ebrahimi, ISIJ Int., 52 (2012) 569–573.10.2355/isijinternational.52.569Search in Google Scholar
[3] A. Akbari, H. Mirzadeh and J.M. Cabrera, Mater. Des., 77 (2015) 126–131.10.1016/j.matdes.2015.04.005Search in Google Scholar
[4] E. Shafiei, N. Goodarzi, K. Dehghani and A. Soltani Tehrani, Can Metall. Q, 56 (2017) 104–112.10.1080/00084433.2016.1273567Search in Google Scholar
[5] E. Shafiei, J. Nuclear Mater., 473 (2016) 1–5.10.1016/j.jnucmat.2016.02.005Search in Google Scholar
[6] E. Shafiei and R. Ebrahimi, J. Eng. Mater. Tech., 135 (2013) 011006–4.10.1115/1.4023186Search in Google Scholar
[7] C.M. Cepeda- Jimenez, O.A. Ruano, M. Carsi and F. Cerreno, Mater. Sci. Eng. A., 552 (2012) 530–539.10.1016/j.msea.2012.05.082Search in Google Scholar
[8] E. Shafiei and K. Dehghani, J Mater. Eng. Perform., 25 (2016) 4024–4035.10.1007/s11665-016-2228-8Search in Google Scholar
[9] Y. Cao, H. Di, J. Zhang and Y. Yang, J. Nucl Mater., 456 (2015) 133–141.10.1016/j.jnucmat.2014.09.030Search in Google Scholar
[10] G.R. Johnson and W.H. Cook, Eng. Fract. Mech., 21 (1985) 31–48.10.1016/0013-7944(85)90052-9Search in Google Scholar
© 2019 Walter de Gruyter GmbH, Berlin/Boston
This work is licensed under the Creative Commons Attribution 4.0 Public License.
Articles in the same Issue
- Frontmatter
- Review Article
- Research on the Influence of Furnace Structure on Copper Cooling Stave Life
- Influence of High Temperature Oxidation on Hydrogen Absorption and Degradation of Zircaloy-2 and Zr 700 Alloys
- Correlation between Travel Speed, Microstructure, Mechanical Properties and Wear Characteristics of Ni-Based Hardfaced Deposits over 316LN Austenitic Stainless Steel
- Factors Influencing Gas Generation Behaviours of Lump Coal Used in COREX Gasifier
- Experiment Research on Pulverized Coal Combustion in the Tuyere of Oxygen Blast Furnace
- Phosphate Capacities of CaO–FeO–SiO2–Al2O3/Na2O/TiO2 Slags
- Microstructure and Interface Bonding Strength of WC-10Ni/NiCrBSi Composite Coating by Vacuum Brazing
- Refill Friction Stir Spot Welding of Dissimilar 6061/7075 Aluminum Alloy
- Solvothermal Synthesis and Magnetic Properties of Monodisperse Ni0.5Zn0.5Fe2O4 Hollow Nanospheres
- On the Capability of Logarithmic-Power Model for Prediction of Hot Deformation Behavior of Alloy 800H at High Strain Rates
- 3D Heat Conductivity Model of Mold Based on Node Temperature Inheritance
- 3D Microstructure and Micromechanical Properties of Minerals in Vanadium-Titanium Sinter
- Effect of Martensite Structure and Carbide Precipitates on Mechanical Properties of Cr-Mo Alloy Steel with Different Cooling Rate
- The Interaction between Erosion Particle and Gas Stream in High Temperature Gas Burner Rig for Thermal Barrier Coatings
- Permittivity Study of a CuCl Residue at 13–450 °C and Elucidation of the Microwave Intensification Mechanism for Its Dechlorination
- Study on Carbothermal Reduction of Titania in Molten Iron
- The Sequence of the Phase Growth during Diffusion in Ti-Based Systems
- Growth Kinetics of CoB–Co2B Layers Using the Powder-Pack Boriding Process Assisted by a Direct Current Field
- High-Temperature Flow Behaviour and Constitutive Equations for a TC17 Titanium Alloy
- Research on Three-Roll Screw Rolling Process for Ti6Al4V Titanium Alloy Bar
- Continuous Cooling Transformation of Undeformed and Deformed High Strength Crack-Arrest Steel Plates for Large Container Ships
- Formation Mechanism and Influence Factors of the Sticker between Solidified Shell and Mold in Continuous Casting of Steel
- Casting Defects in Transition Layer of Cu/Al Composite Castings Prepared Using Pouring Aluminum Method and Their Formation Mechanism
- Effect of Current on Segregation and Inclusions Characteristics of Dual Alloy Ingot Processed by Electroslag Remelting
- Investigation of Growth Kinetics of Fe2B Layers on AISI 1518 Steel by the Integral Method
- Microstructural Evolution and Phase Transformation on the X-Y Surface of Inconel 718 Ni-Based Alloys Fabricated by Selective Laser Melting under Different Heat Treatment
- Characterization of Mn-Doped Co3O4 Thin Films Prepared by Sol Gel-Based Dip-Coating Process
- Deposition Characteristics of Multitrack Overlayby Plasma Transferred Arc Welding on SS316Lwith Co-Cr Based Alloy – Influence ofProcess Parameters
- Elastic Moduli and Elastic Constants of Alloy AuCuSi With FCC Structure Under Pressure
- Effect of Cl on Softening and Melting Behaviors of BF Burden
- Effect of MgO Injection on Smelting in a Blast Furnace
- Structural Characteristics and Hydration Kinetics of Oxidized Steel Slag in a CaO-FeO-SiO2-MgO System
- Optimization of Microwave-Assisted Oxidation Roasting of Oxide–Sulphide Zinc Ore with Addition of Manganese Dioxide Using Response Surface Methodology
- Hydraulic Study of Bubble Migration in Liquid Titanium Alloy Melt during Vertical Centrifugal Casting Process
- Investigation on Double Wire Metal Inert Gas Welding of A7N01-T4 Aluminum Alloy in High-Speed Welding
- Oxidation Behaviour of Welded ASTM-SA210 GrA1 Boiler Tube Steels under Cyclic Conditions at 900°C in Air
- Study on the Evolution of Damage Degradation at Different Temperatures and Strain Rates for Ti-6Al-4V Alloy
- Pack-Boriding of Pure Iron with Powder Mixtures Containing ZrB2
- Evolution of Interfacial Features of MnO-SiO2 Type Inclusions/Steel Matrix during Isothermal Heating at Low Temperatures
- Effect of MgO/Al2O3 Ratio on Viscosity of Blast Furnace Primary Slag
- The Microstructure and Property of the Heat Affected zone in C-Mn Steel Treated by Rare Earth
- Microwave-Assisted Molten-Salt Facile Synthesis of Chromium Carbide (Cr3C2) Coatings on the Diamond Particles
- Effects of B on the Hot Ductility of Fe-36Ni Invar Alloy
- Impurity Distribution after Solidification of Hypereutectic Al-Si Melts and Eutectic Al-Si Melt
- Induced Electro-Deposition of High Melting-Point Phases on MgO–C Refractory in CaO–Al2O3–SiO2 – (MgO) Slag at 1773 K
- Microstructure and Mechanical Properties of 14Cr-ODS Steels with Zr Addition
- A Review of Boron-Rich Silicon Borides Basedon Thermodynamic Stability and Transport Properties of High-Temperature Thermoelectric Materials
- Siliceous Manganese Ore from Eastern India:A Potential Resource for Ferrosilicon-Manganese Production
- A Strain-Compensated Constitutive Model for Describing the Hot Compressive Deformation Behaviors of an Aged Inconel 718 Superalloy
- Surface Alloys of 0.45 C Carbon Steel Produced by High Current Pulsed Electron Beam
- Deformation Behavior and Processing Map during Isothermal Hot Compression of 49MnVS3 Non-Quenched and Tempered Steel
- A Constitutive Equation for Predicting Elevated Temperature Flow Behavior of BFe10-1-2 Cupronickel Alloy through Double Multiple Nonlinear Regression
- Oxidation Behavior of Ferritic Steel T22 Exposed to Supercritical Water
- A Multi Scale Strategy for Simulation of Microstructural Evolutions in Friction Stir Welding of Duplex Titanium Alloy
- Partition Behavior of Alloying Elements in Nickel-Based Alloys and Their Activity Interaction Parameters and Infinite Dilution Activity Coefficients
- Influence of Heating on Tensile Physical-Mechanical Properties of Granite
- Comparison of Al-Zn-Mg Alloy P-MIG Welded Joints Filled with Different Wires
- Microstructure and Mechanical Properties of Thick Plate Friction Stir Welds for 6082-T6 Aluminum Alloy
- Research Article
- Kinetics of oxide scale growth on a (Ti, Mo)5Si3 based oxidation resistant Mo-Ti-Si alloy at 900-1300∘C
- Calorimetric study on Bi-Cu-Sn alloys
- Mineralogical Phase of Slag and Its Effect on Dephosphorization during Converter Steelmaking Using Slag-Remaining Technology
- Controllability of joint integrity and mechanical properties of friction stir welded 6061-T6 aluminum and AZ31B magnesium alloys based on stationary shoulder
- Cellular Automaton Modeling of Phase Transformation of U-Nb Alloys during Solidification and Consequent Cooling Process
- The effect of MgTiO3Adding on Inclusion Characteristics
- Cutting performance of a functionally graded cemented carbide tool prepared by microwave heating and nitriding sintering
- Creep behaviour and life assessment of a cast nickel – base superalloy MAR – M247
- Failure mechanism and acoustic emission signal characteristics of coatings under the condition of impact indentation
- Reducing Surface Cracks and Improving Cleanliness of H-Beam Blanks in Continuous Casting — Improving continuous casting of H-beam blanks
- Rhodium influence on the microstructure and oxidation behaviour of aluminide coatings deposited on pure nickel and nickel based superalloy
- The effect of Nb content on precipitates, microstructure and texture of grain oriented silicon steel
- Effect of Arc Power on the Wear and High-temperature Oxidation Resistances of Plasma-Sprayed Fe-based Amorphous Coatings
- Short Communication
- Novel Combined Feeding Approach to Produce Quality Al6061 Composites for Heat Sinks
- Research Article
- Micromorphology change and microstructure of Cu-P based amorphous filler during heating process
- Controlling residual stress and distortion of friction stir welding joint by external stationary shoulder
- Research on the ingot shrinkage in the electroslag remelting withdrawal process for 9Cr3Mo roller
- Production of Mo2NiB2 Based Hard Alloys by Self-Propagating High-Temperature Synthesis
- The Morphology Analysis of Plasma-Sprayed Cast Iron Splats at Different Substrate Temperatures via Fractal Dimension and Circularity Methods
- A Comparative Study on Johnson–Cook, Modified Johnson–Cook, Modified Zerilli–Armstrong and Arrhenius-Type Constitutive Models to Predict Hot Deformation Behavior of TA2
- Dynamic absorption efficiency of paracetamol powder in microwave drying
- Preparation and Properties of Blast Furnace Slag Glass Ceramics Containing Cr2O3
- Influence of unburned pulverized coal on gasification reaction of coke in blast furnace
- Effect of PWHT Conditions on Toughness and Creep Rupture Strength in Modified 9Cr-1Mo Steel Welds
- Role of B2O3 on structure and shear-thinning property in CaO–SiO2–Na2O-based mold fluxes
- Effect of Acid Slag Treatment on the Inclusions in GCr15 Bearing Steel
- Recovery of Iron and Zinc from Blast Furnace Dust Using Iron-Bath Reduction
- Phase Analysis and Microstructural Investigations of Ce2Zr2O7 for High-Temperature Coatings on Ni-Base Superalloy Substrates
- Combustion Characteristics and Kinetics Study of Pulverized Coal and Semi-Coke
- Mechanical and Electrochemical Characterization of Supersolidus Sintered Austenitic Stainless Steel (316 L)
- Synthesis and characterization of Cu doped chromium oxide (Cr2O3) thin films
- Ladle Nozzle Clogging during casting of Silicon-Steel
- Thermodynamics and Industrial Trial on Increasing the Carbon Content at the BOF Endpoint to Produce Ultra-Low Carbon IF Steel by BOF-RH-CSP Process
- Research Article
- Effect of Boundary Conditions on Residual Stresses and Distortion in 316 Stainless Steel Butt Welded Plate
- Numerical Analysis on Effect of Additional Gas Injection on Characteristics around Raceway in Melter Gasifier
- Variation on thermal damage rate of granite specimen with thermal cycle treatment
- Effects of Fluoride and Sulphate Mineralizers on the Properties of Reconstructed Steel Slag
- Effect of Basicity on Precipitation of Spinel Crystals in a CaO-SiO2-MgO-Cr2O3-FeO System
- Review Article
- Exploitation of Mold Flux for the Ti-bearing Welding Wire Steel ER80-G
- Research Article
- Furnace heat prediction and control model and its application to large blast furnace
- Effects of Different Solid Solution Temperatures on Microstructure and Mechanical Properties of the AA7075 Alloy After T6 Heat Treatment
- Study of the Viscosity of a La2O3-SiO2-FeO Slag System
- Tensile Deformation and Work Hardening Behaviour of AISI 431 Martensitic Stainless Steel at Elevated Temperatures
- The Effectiveness of Reinforcement and Processing on Mechanical Properties, Wear Behavior and Damping Response of Aluminum Matrix Composites