Deformation Behavior and Processing Map during Isothermal Hot Compression of 49MnVS3 Non-Quenched and Tempered Steel
-
Qingjuan Wang
 ,
Jiamin Shi
,
Jiamin Shi

Abstract
The deformation behavior of 49MnVS3 non-quenched and tempered steel was studied using isothermal compression tests at the temperature range of 750–1000 °C and the strain rate range of 0.1–50 s−1 on a Gleeble-3500 thermal mechanical simulator. The results indicated that the flow stress increases significantly with decreasing temperature and increasing strain rate. Under the whole deformation conditions, the dependence of flow stress on deformation temperature and strain rate was analyzed by hyperbolic sine equation. Besides, the hot deformation activation energy and stress exponent were calculated to be 323.56 kJ/mol and 6.99, respectively. In addition, the processing map based on dynamic material model was established, and the optimum processing condition of the 49MnVS3 non-quenched and tempered steel can be determined to be at the temperature range of 809–850 °C and strain rate of 36.6 s−1–50 s−1.
Introduction
As an energy-efficient steel, non-quenched and tempered steel combines forging and heat treatment into one process, which is not required for quenching and heat treatment [1]. Till now, non-quenched and tempered steel has been extensively employed in numerous fields such as automobile, agricultural machinery, machine tool and engineering machinery forging, shafts and bolts [2, 3, 4]. Non-quenched steel was first introduced in the 1970s and the German Thyssen steel company successfully developed the first generation of 49MnVS3 non-quenched and tempered steel [5]. So far, the steel has replaced the 50Mn, 40Cr and a series of quenched and tempered steel, which has been used in the manufacture of automobile crankshaft forging [6]. However, compared with quenched and tempered steel, non-quenched and tempered steel has relatively poor toughness, especially for medium carbon steel. Although higher carbon content makes the strength better, it remains more challenging to obtain better toughness than low carbon steel when the carbon content is high. Studies have already shown that the intragranular ferrite can effectively refine the ferrite grains, which is an efficient way to improve the toughness of non-quenched and tempered steel [7, 8, 9]. In the forging process, the deformation resistance and microstructure of the material would occur some complicated changes under different deformation conditions, such as strain, strain rate, deformation temperature and deformation degree. To control the forming process, it is essential to study the thermal deformation behavior and processing of non-quenched and tempered steel under different hot working conditions so as to determine the optimum process parameters.
Constitutive equation can be used to describe the relationship between flow stress, strain, strain rate and deformation temperature during material deformation. Thus, the constitutive equation is the basic data that can predict the flow behaviors of material [10]. So far, the processing maps based on the dynamic materials model (DMM) have already been successfully used to study the deformation behavior of various metals and their alloys, such as aluminum alloy, copper alloy, magnesium alloy, titanium alloy, stainless steel and nickel base alloy [11, 12, 13, 14, 15, 16]. Processing maps can evaluate the processability of the material and optimize the process parameters of material. The safe and hazardous areas of the plastic working of the material can be obtained by processing map, thereby obtaining the optimized thermal parameters of the material. Therefore, the proposed study aimed to study the high temperature deformation behavior of 49MnVS3 non-quenched and tempered steel. As a result, isothermal hot compression tests were performed in the temperature range of 750–1000 °C and the strain rate of 0.1–50 s−1. Then, the constitutive equation and processing map of 49MnVS3 non-quenched and tempered steel were developed to optimize the process parameters.
Experimental procedure
The material used in this investigation was hot rolling 49MnVS3 non-quenched and tempered steel with a diameter of 39.24 mm. Table 1 presents the chemical composition (mass %) and the initial microstructure is shown in Figure 1, from which, it can be seen that the microstructure of the 49MnVS3 non-quenched and tempered steel consists of distributed uniformly reticular and massive ferrite and pearlite. Cylindrical compression specimens of 49MnVS3 non-quenched and tempered steel were 10 mm in diameter and 15 mm in height. Isothermal compression experiments at a constant strain were carried out on Gleeble-3500 thermal mechanical simulator. To ensure a homogenous temperature distribution throughout the specimen, each specimen was heated up to 1150 °C with a heating rate of 5 °C/s and held for 5 min prior to deformation. Then, the specimens were cooled down to 750, 800, 850, 900, 950, and 1000 °C at a cooling rate of 5 °C/s and held for 30 s to eliminate the temperature gradient. Afterwards, the specimens were compressed to 0.9 strain with the strain rate of 0.1, 1, 10, and 50 s−1, followed by quenching in water so as to preserve the deformed microstructure. The deformed specimens were axially sectioned and prepared by standard metallographic techniques to observe the microstructure.

The original microstructure of the 49MnVS3 non-quenched and tempered steel.
Chemical composition of 49MnVS3 non-quenched and tempered steel.
| Type of steel | C | Si | Mn | P | S | Cr | Ni | Mo | Cu | Al |
|---|---|---|---|---|---|---|---|---|---|---|
| 49MnVS3 | 0.50 | 0.26 | 0.83 | 0.010 | 0.047 | 0.08 | 0.04 | 0.02 | 0.06 | 0.024 |
Results and discussion
Flow stress behavior
Figure 2 shows the typical true stress-strain curves of 49MnVS3 non-quenched and tempered steel obtained at different deformation temperatures and strain rates, presenting that the flow stress decreases significantly with the increasing temperature and the strain rate decreases, which indicates that the flow stress is sensitive with the deformation temperature and strain rate. The reason is that the average kinetic energy of the atoms increases significantly and the high temperature critical slip shear stress decreases rapidly, causing that the obstruction of dislocation movement decreases with increasing temperature [17]. In addition, at higher temperatures and lower strain rates, the reduction of the dislocation density counteracts the hardening caused by deformation, consequently reducing the flow stress of the 49MnVS3 non-quenched and tempered steel.

True stress-strain curves of 49MnVS3 non-quenched and tempered steel obtained under different deformation conditions: (a) 800 °C; (b) 1000 °C; (c) 0.1 s−1; (d) 10 s−1.
According to Figure 2 (a), at the lower temperature (800 °C), the stress-strain curves at each strain rate have no obvious peak stress. Similarly, at the higher strain rate (10 s−1), the stress-strain curves at each deformation temperature have the same characteristics, as shown in Figure 2 (d). The flow stress increases monotonously with the increase of strain under certain deformation conditions, and the rate of increase of flow stress decreases with the increase of strain, showing that the experimental steel softens to the main dynamic response at higher strain rates. The flow stress rapidly reaches the peak stress at the beginning of the stress - strain curves due to the work hardening. The work hardening in the initial stage relates to the formation of poorly developed subgrain boundaries and the increase of dislocation density [18, 19]. In the latter stage of compression, the driving force caused by the material deformation is sufficient to complete the thermal deformation such as dynamic recovery and dynamic recrystallization. Thus, the material softens. When the softening behavior is stronger than the work hardening, the stress curve decreases. When the softening and work hardening tend to balance, the curve shows a gentle state.
In addition, oscillatory flow curves are observed particularly at strain rate of 50 s−1. Besides, similar phenomenon has also been reported in the GH3535 superalloy [20], IC396LZR alloy [21] and Ni3Al-based superalloy [22]. The main reason may be that under the high strain rate, the heat generated during the metal deformation can not be quickly released, resulting in a large amount of deformation heat accumulating, which creates favorable conditions for the flow softening. While the flow softening and deformation hardening process alternated and the response to the stress-strain curve showed an oscillating shape [21].
The effect of deformation parameters on the peak flow stress for 49MnVS3 non-quenched and tempered steel are shown in Figure 3, showing that the peak stress decreases with the increase of the deformation temperature and the decrease of strain rate. The overall decrease at lower strain rates has no obvious difference with that at high strain rates.

Peak stress in the isothermal compression of 49MnVS3 non-quenched and tempered steel at different deformation conditions.
The softening of flow stress can be described by the difference between the peak stress and the steady-state stress [23]:
Where σp is the peak stress and σs is the steady-state stress (use σ0.9 as σs).
According to eq. (1), the flow softening curves can be obtained, as shown in Figure 4, which presents that when the strain rate is above 10 s−1, Δσ of the single-phase region (below Ac3) is higher than that of the two-phase region. Strain rate exerts a great influence on the softening. Δσ at the 50 s−1 strain rate is significantly higher than that the other strain rates in the single-phase region (below Tα). While in the single-phase region (above Tα), Δσ at 0.1 s−1 strain rate is slightly higher than that at other strain rates. In general, the adiabatic effect and microstructure evolution are the main reasons of flow softening [24]. As shown in Figure 4, when the temperature is higher than the austenite single-phase region (Tα), the flow softening stress at a specific strain rate with increasing temperature remained stable. Additionally, the effect of temperature on Δσ also reflects changes in the microstructure of the alloy, such as grain size, volume and composition of the phase, and the number of dislocations [17].

Flow softening of 49MnVS3 non-quenched and tempered steel with increasing temperature for various strain rates.
Constitutive equation
The high temperature deformation behavior of the material is represented by the Zener-Hollomon parameter (Z), which correlates the strain rate, the deformation temperature and the activation energy by the following expression [25]:
where
The Arrhenius equation is extensively used to describe the relationship between flow stress, strain rate and temperature [26]
in which,
Where σ is the instantaneous stress at different strain, A and α are material constants, n is a constant related to the strain rate. Through combining eq. (3) and (4), the following relationship can be acquired:
According to eq. (5), the following equation can be obtained:
The value of α can be determined using
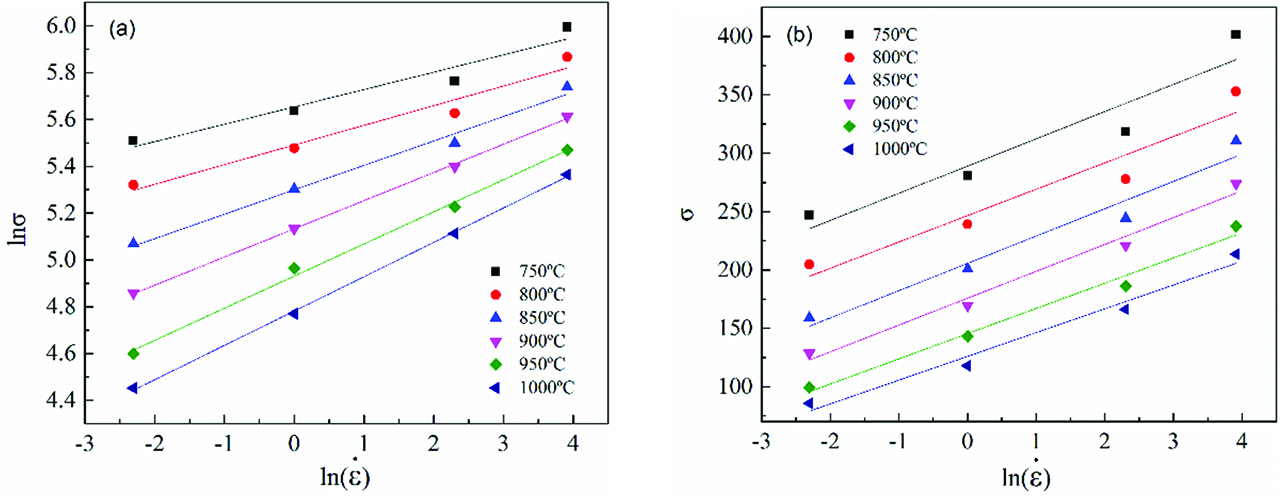
The value evaluation of (a)
![Figure 6: The linear relationships of (a) lnsinhασ\ln \left[ {\sinh \left( {\alpha \sigma } \right)} \right] and lnε˙\ln \dot \varepsilon (b) lnsinhασ\ln \left[ {\sinh \left( {\alpha \sigma } \right)} \right] and 1000/T.](/document/doi/10.1515/htmp-2018-0042/asset/graphic/j_htmp-2018-0042_fig_006.jpg)
The linear relationships of (a)
Figure 7 illustrates the relationship between the peak stress and the Zener-Hollomon parameter for 49MnVS3 non-quenched and tempered steel. Z parameter increases consistently with the increase of peak stress. Figure 7 shows that the correlation coefficient for the linear regression is 0.991, which indicates the high accuracy of eq. (7) for describing the hot deformation behavior of 49MnVS3 non-quenched and tempered steel.
![Figure 7: Relationship between lnZ\ln Z and lnsinhασ\ln \left[ {\sinh \left( {\alpha \sigma } \right)} \right].](/document/doi/10.1515/htmp-2018-0042/asset/graphic/j_htmp-2018-0042_fig_007.jpg)
Relationship between
Processing map
Processing map based on DMM is widely used for optimizing the hot working processing parameters, which is obtained by superposition of a power dissipation map and an instability map. The stable and unstable regions during plastic deformation can be easily obtained using the processing map.
The DMM regards the hot working piece in the plastic deformation process as an energy dissipation system, and the total power P absorbed in the system consists two complementary parts [28, 29]:
where G represents the power dissipated by plastic work, most of which is converted to viscoplastic heat, and a small amount of the remaining power is stored in a lattice defect [30]. J denotes the energy consumed by the dynamic microstructure evolution. The stress and strain rate of the hot working workpiece have the following power function at the plastic deformation:
where K is a constant and m is the strain rate sensitivity factor, which is calculated by:
The power ratio for microstructural evolution during hot deformation can be expressed by the efficiency of power dissipation (η), which is defined as [28, 29]:
The variation of η with the deformation temperature and strain rate constitutes the power dissipation map. In the process of plastic deformation, all kinds of damage or metallurgical changes dissipate power. Therefore, the power dissipation map can be used to analyze the deformation mechanism in different regions by metallographic observation.
The interior processing performance of the material depends on the power consumed through processing the unstable energy. Prasad [28, 31] and Krishna [32] applied the principle of maximum entropy generation to the theory of large plastic rheology to obtain the criterion of rheological instability zone. The criteria for instability are as following:
where
Then, the processing map of 49MnVS3 non-quenched and tempered steel is obtained by superposing the instability map on the power dissipation map. Figure 8 presents the processing map for 49MnVS3 non-quenched and tempered steel at strain of 0.9. The contour numbers in the figure indicate percent efficiency of power dissipation (η), and the gray areas represent the flow instability region during deformation. The higher value of η does not necessarily indicate that the processing conditions are more adapted to processing [33]. Figure 8 shows that this non-quenched and tempered steel exhibits two different instability regions: (I) the first region is at the range from 0.1 s−1 to 1.9 s−1 lower strain rates and within the range from 750 °C to 887 °C lower deformation temperatures; (II) the second region locates in the deformation temperatures from 909 °C to 984 °C and the strain rates from 0.13 s−1 to 2.2 s−1. Accordingly, it is necessary to stay away from these regions.

Processing map of 49MnVS3 non-quenched and tempered steel at strain of 0.9.
Microstructural observations
To investigate the mechanism of microscopic deformation and verify the reliability of sample deformation under specific processing parameters, microstructures of typical deformation are characterized and analyzed.
Figure 9 shows the microstructure of 49MnVS3 non-quenched and tempered steel at the 750 °C, 0.1 s−1 and 850 °C, 0.1 s−1, corresponding to the instability zone in Figure 8. Figure 9 (a) shows that the ferrite is distributed at the pearlite boundary. The pearlite is coarse, and ferrite is massive and precipitates along grain boundaries, which is mainly because at lower deformation temperature, the deformation is insufficient to cause the austenite undergoing dynamic recrystallization (DRX) before the phase transition and thus the grain cannot be refined. Moreover, the small deformation leads to less distortion in the grains, which cannot provide the location of the ferrite nucleation in the process of phase transformation. As a result, the ferrite is mainly concentrated in the distortion of the grain boundary. From Figure 9 (b), it can be observed that part of the ferrite is coarse and unevenly distributed. This is the fact that some of the ferrite in the deformed structure is not completely austenitized, which is detrimental to controlling the ferrite content. These features indicate that 49MnVS3 non-quenched and tempered steel has a poor workability at the lower temperature and lower strain rate.

Microstructures of 49MnVS3 non-quenched and tempered steel deformed at the strain rate of 0.1 s−1 and temperature of (a) 750 °C and (b) 850 °C.
Generally, dynamic recrystallization occurs in the region of η > 0.3 [34, 35]. Based on Figure 8, at a high strain rate, the maximum of η is 0.28. Therefore, it is considered that no dynamic recrystallization occurs in this region. In most cases, the non-quenched and tempered steel after rolling is the most widely used with large amount of application. Rolling of the non-recrystallized zone is usually performed below the termination temperature of recrystallization [36]. In the austenite non-recrystallization zone rolling, the process of austenite into ferrite makes ferrite and pearlite grain size refined. Grain refinement can improve the strength and toughness of the metal material [37].
Figure 10 shows the microstructure of 49MnVS3 non-quenched and tempered steel at temperature of 850 °C with the strain rate of 50 s−1, presenting that the ferrite is refined and uniformly distributed. The steel is in the austenite single phase region, which also locates in the non-austenite dynamic recrystallization zone. The austenite grain will not be excessively small and thus the grain boundary will not increase. Therefore, to obtain homogeneous and fine microstructures, the optimum process region from the processing map is the deformation temperature range of 809 °C to 850 °C and strain rate range of 36.6 s−1 to 50 s−1.

Microstructures of 49MnVS3 non-quenched and tempered steel at temperature of 850 °C and strain rate of 50 s−1.
Conclusions
To conclude, hot deformation behavior of 49MnVS3 non-quenched and tempered steel was analyzed by constitutive equations and processing map in this study. The main results could be summarized as follows:
The flow stress increases significantly with the decrease of temperature and increase of strain rate. Meanwhile, when the strain rate is above 10 s−1, the flow stress curves reveal higher flow softening in the single-phase region (below Ac3) than that in the two-phase region.
The relationship between flow stress and Zener Hall parameters was successfully analyzed by the hyperbolic sine function over the entire deformation condition. Thus, the apparent activation energy (Q), and the material constants of A and n were determined to be 323.56 kJ/mol,
The processing map was established for the 49MnVS3 non-quenched and tempered steel, and the distribution of power dissipation values η were verified by microstructural observation. To obtain fine and homogeneous microstructures, the optimal process region from the processing map was temperature ranging from 809 to 850 °C and strain rate ranging from 36.6 s−1 to 50 s−1.
Acknowledgements
The authors gratefully acknowledge the financial support received from the National Natural Science Foundation of China (U1760201) and the National Key R&D Project (2017YFB0306200).
References
[1] X. Li, X.X. Li, M.Y. Li and X.C. Wu, Adv. Mater. Res., 634 (2013) 2843–2848.10.4028/www.scientific.net/AMR.634-638.2843Search in Google Scholar
[2] M.L. Li, F.M. Wang, C.R. Li, Z.B. Yang, Q.Y. Meng and S.F. Tao, Int. J. Miner. Metall. Mater., 22 (2015) 589–597.10.1007/s12613-015-1111-1Search in Google Scholar
[3] Y.J. Xia, F.M. Wang, J.L. Wang and G.Z. Li, Int. J. Miner. Metall. Mater., 18 (2011) 562–569.10.1007/s12613-011-0478-xSearch in Google Scholar
[4] Z.B. Yang, F.M. Wang, S. Wang and B. Song, Steel Res. Int., 79 (2008) 390–395.10.1002/srin.200806143Search in Google Scholar
[5] D.I.S. Engineer, D.I.B. Huchtemann and D.I.V. Schüler, Steel Res. Int., 58 (1987) 369–376.10.1002/srin.198700233Search in Google Scholar
[6] B. Zhou, Y. Shen, L. Tan, H.X. Yang, W.Q. Cao and Y.Z. Bao, Phys. Procedia., 50 (2013) 25–31.10.1016/j.phpro.2013.11.006Search in Google Scholar
[7] G. Dini, V.M. Monir and A. Shafyei, Isij Int., 46 (2006) 89–92.10.2355/isijinternational.46.89Search in Google Scholar
[8] M.T. Ma, H.Y. Yang, H.S. Mei and H.Z. Lu, Adv. Mater. Res., 509 (2012) 75–81.10.4028/www.scientific.net/AMR.509.75Search in Google Scholar
[9] T.H. Man, P. Gao, Y.G. He, Z.L. Zhan, L. Tan and Y.Z. Bao, Adv. Mater. Res., 936 (2014) 1179–1183.10.4028/www.scientific.net/AMR.936.1179Search in Google Scholar
[10] H. Shi, A.J. Mclaren, C.M. Sellars, R. Shahani and R. Bolingbroke, Mater. Sci. Technol., 13 (1997) 210–216.10.1179/mst.1997.13.3.210Search in Google Scholar
[11] Y.J. Guo, L. Deng, X.Y. Wang, J.S. Jin and W.W. Zhou, Adv. Mater. Res., 815 (2013) 37–42.10.4028/www.scientific.net/AMR.815.37Search in Google Scholar
[12] J. Cai, K.S. Wang and W. Wang, Rare Metal Mat. Eng., 45 (2016) 2549–2554.10.1016/S1875-5372(17)30032-2Search in Google Scholar
[13] H.M. Liao, M. Zeng, S.Y. Long and H.X. Cao, Mater. Sci. Forum, 686 (2011) 168–175.10.4028/www.scientific.net/MSF.686.168Search in Google Scholar
[14] Y.H. Yang, D. Liu, G.J. Gao and J.G. Wang, Adv. Mater. Res., 904 (2014) 262–268.10.4028/www.scientific.net/AMR.904.262Search in Google Scholar
[15] W. He, J. Liu, S. Sun, H. Chen and H. Guo, Mater. Res. Innov., 15 (2015) 245–248.Search in Google Scholar
[16] Y. Kong, P. Chang, Q. Li, L. Xie and S. Zhu, J. Alloys Compd., 622 (2015) 738–744.10.1016/j.jallcom.2014.10.118Search in Google Scholar
[17] W. Peng, W. Zeng, Q. Wang, Q. Zhao and H. Yu, Mater. Sci. Eng. A, 593 (2014) 16–23.10.1016/j.msea.2013.07.086Search in Google Scholar
[18] D. Cai, L. Xiong, W. Liu, G. Sun and M. Yao, Mater. Charact., 58 (2007) 941–946.10.1016/j.matchar.2006.09.004Search in Google Scholar
[19] Z.X. Shi, X.F. Yan, C.H. Duan, J.G. Song, M.H. Zhao and J. Wang, J. Iron Steel Res. Int., 24 (2017) 625–633.10.1016/S1006-706X(17)30094-8Search in Google Scholar
[20] Y.Q. Ji, S.D. Qu and W.X. Han, Trans. Nonferrous Met. Soc. China, 25 (2015) 88–94.10.1016/S1003-6326(15)63582-8Search in Google Scholar
[21] Y.V.R.K. Prasad, S. Sasidhara and V.K. Sikka, Intermet., 8 (2000) 987–995.10.1016/S0966-9795(00)00048-0Search in Google Scholar
[22] Y.T. Wu, Y.C. Liu, C. Li, X. Xia and Y.P. Huang, J. Alloys Compd., 712 (2017) 687–695.10.1016/j.jallcom.2017.04.116Search in Google Scholar
[23] B.H. Lee, N.S. Reddy, J.T. Yeom and C.S. Lee, J. Mater. Process. Technol., 187 (2007) 766–769.10.1016/j.jmatprotec.2006.11.053Search in Google Scholar
[24] M. Jackson, N.G. Jones, D. Dye and R.J. Dashwood, Mater. Sci. Eng. A, 501 (2009) 248–254.10.1016/j.msea.2008.09.071Search in Google Scholar
[25] K. Wu, G. Liu, B. Hu, F. Li, Y. Zhang, Y. Tao and J. Liu, Mater. Charact., 61 (2010) 330–340.10.1016/j.matchar.2009.12.013Search in Google Scholar
[26] K. Wu, G.Q. Liu, B.F. Hu, C.Y. Wang, Y.W. Zhang, Y. Tao and J.T. Liu, Mater. Sci. Eng. A, 528 (2011) 4620–4629.10.1016/j.msea.2011.02.051Search in Google Scholar
[27] Y.F. Chen, X.D. Peng, H.B. Xu, H.D. Jiang and G.H. Guan, Strength Mater., 46 (2014) 198–207.10.1007/s11223-014-9536-8Search in Google Scholar
[28] Y.V.R.K. Prasad and K.P. Rao, Mater. Sci. Eng. A., 487 (2008) 316–327.10.1016/j.msea.2007.10.038Search in Google Scholar
[29] C. Zhang, L. Zhang, W. Shen, M. Li and S. Gu, J. Mater. Eng. Perform., 24 (2015) 149–157.10.1007/s11665-014-1310-3Search in Google Scholar
[30] S. Huang, L. Wang, X.T. Lian, B.J. Zhang and G.P. Zhao, Acta Metal. Sin., 27 (2014) 198–204.10.1007/s40195-014-0037-3Search in Google Scholar
[31] Y.V.R.K. Prasad and T. Seshacharyulu, Mater. Sci. Eng. A., 243 (1998) 82–88.10.1016/S0921-5093(97)00782-XSearch in Google Scholar
[32] V.G. Krishna, Y.V.R.K. Prasad, N.C. Birla and G.S. Rao, J. Mater. Process. Technol., 71 (1997) 377–383.10.1016/S0924-0136(97)00102-7Search in Google Scholar
[33] Y.C. Lin, L.T. Li, Y.C. Xia and Y.Q. Jiang, J. Alloys Compd., 550 (2013) 438–445.10.1016/j.jallcom.2012.10.114Search in Google Scholar
[34] J.L. Zhang, H.Z. Guo and H.Q. Liang, Rare Met., 35 (2016) 118–126.10.1007/s12598-015-0646-7Search in Google Scholar
[35] Z.X. Shi, X.F. Yan and C.H. Duan, J. Alloys Compd., 652 (2011) 30–38.10.1016/j.jallcom.2015.08.118Search in Google Scholar
[36] A.H. Nobari and S. Serajzadeh, Appl. Therm. Eng., 31 (2011) 487–492.10.1016/j.applthermaleng.2010.10.003Search in Google Scholar
[37] H.L. Yi, Z.Y. Liu, G.D. Wang and D. Wu, J. Iron Steel Res. Int., 17 (2010) 54–58.10.1016/S1006-706X(10)60197-5Search in Google Scholar
© 2019 Walter de Gruyter GmbH, Berlin/Boston
This work is licensed under the Creative Commons Attribution 4.0 Public License.
Articles in the same Issue
- Frontmatter
- Review Article
- Research on the Influence of Furnace Structure on Copper Cooling Stave Life
- Influence of High Temperature Oxidation on Hydrogen Absorption and Degradation of Zircaloy-2 and Zr 700 Alloys
- Correlation between Travel Speed, Microstructure, Mechanical Properties and Wear Characteristics of Ni-Based Hardfaced Deposits over 316LN Austenitic Stainless Steel
- Factors Influencing Gas Generation Behaviours of Lump Coal Used in COREX Gasifier
- Experiment Research on Pulverized Coal Combustion in the Tuyere of Oxygen Blast Furnace
- Phosphate Capacities of CaO–FeO–SiO2–Al2O3/Na2O/TiO2 Slags
- Microstructure and Interface Bonding Strength of WC-10Ni/NiCrBSi Composite Coating by Vacuum Brazing
- Refill Friction Stir Spot Welding of Dissimilar 6061/7075 Aluminum Alloy
- Solvothermal Synthesis and Magnetic Properties of Monodisperse Ni0.5Zn0.5Fe2O4 Hollow Nanospheres
- On the Capability of Logarithmic-Power Model for Prediction of Hot Deformation Behavior of Alloy 800H at High Strain Rates
- 3D Heat Conductivity Model of Mold Based on Node Temperature Inheritance
- 3D Microstructure and Micromechanical Properties of Minerals in Vanadium-Titanium Sinter
- Effect of Martensite Structure and Carbide Precipitates on Mechanical Properties of Cr-Mo Alloy Steel with Different Cooling Rate
- The Interaction between Erosion Particle and Gas Stream in High Temperature Gas Burner Rig for Thermal Barrier Coatings
- Permittivity Study of a CuCl Residue at 13–450 °C and Elucidation of the Microwave Intensification Mechanism for Its Dechlorination
- Study on Carbothermal Reduction of Titania in Molten Iron
- The Sequence of the Phase Growth during Diffusion in Ti-Based Systems
- Growth Kinetics of CoB–Co2B Layers Using the Powder-Pack Boriding Process Assisted by a Direct Current Field
- High-Temperature Flow Behaviour and Constitutive Equations for a TC17 Titanium Alloy
- Research on Three-Roll Screw Rolling Process for Ti6Al4V Titanium Alloy Bar
- Continuous Cooling Transformation of Undeformed and Deformed High Strength Crack-Arrest Steel Plates for Large Container Ships
- Formation Mechanism and Influence Factors of the Sticker between Solidified Shell and Mold in Continuous Casting of Steel
- Casting Defects in Transition Layer of Cu/Al Composite Castings Prepared Using Pouring Aluminum Method and Their Formation Mechanism
- Effect of Current on Segregation and Inclusions Characteristics of Dual Alloy Ingot Processed by Electroslag Remelting
- Investigation of Growth Kinetics of Fe2B Layers on AISI 1518 Steel by the Integral Method
- Microstructural Evolution and Phase Transformation on the X-Y Surface of Inconel 718 Ni-Based Alloys Fabricated by Selective Laser Melting under Different Heat Treatment
- Characterization of Mn-Doped Co3O4 Thin Films Prepared by Sol Gel-Based Dip-Coating Process
- Deposition Characteristics of Multitrack Overlayby Plasma Transferred Arc Welding on SS316Lwith Co-Cr Based Alloy – Influence ofProcess Parameters
- Elastic Moduli and Elastic Constants of Alloy AuCuSi With FCC Structure Under Pressure
- Effect of Cl on Softening and Melting Behaviors of BF Burden
- Effect of MgO Injection on Smelting in a Blast Furnace
- Structural Characteristics and Hydration Kinetics of Oxidized Steel Slag in a CaO-FeO-SiO2-MgO System
- Optimization of Microwave-Assisted Oxidation Roasting of Oxide–Sulphide Zinc Ore with Addition of Manganese Dioxide Using Response Surface Methodology
- Hydraulic Study of Bubble Migration in Liquid Titanium Alloy Melt during Vertical Centrifugal Casting Process
- Investigation on Double Wire Metal Inert Gas Welding of A7N01-T4 Aluminum Alloy in High-Speed Welding
- Oxidation Behaviour of Welded ASTM-SA210 GrA1 Boiler Tube Steels under Cyclic Conditions at 900°C in Air
- Study on the Evolution of Damage Degradation at Different Temperatures and Strain Rates for Ti-6Al-4V Alloy
- Pack-Boriding of Pure Iron with Powder Mixtures Containing ZrB2
- Evolution of Interfacial Features of MnO-SiO2 Type Inclusions/Steel Matrix during Isothermal Heating at Low Temperatures
- Effect of MgO/Al2O3 Ratio on Viscosity of Blast Furnace Primary Slag
- The Microstructure and Property of the Heat Affected zone in C-Mn Steel Treated by Rare Earth
- Microwave-Assisted Molten-Salt Facile Synthesis of Chromium Carbide (Cr3C2) Coatings on the Diamond Particles
- Effects of B on the Hot Ductility of Fe-36Ni Invar Alloy
- Impurity Distribution after Solidification of Hypereutectic Al-Si Melts and Eutectic Al-Si Melt
- Induced Electro-Deposition of High Melting-Point Phases on MgO–C Refractory in CaO–Al2O3–SiO2 – (MgO) Slag at 1773 K
- Microstructure and Mechanical Properties of 14Cr-ODS Steels with Zr Addition
- A Review of Boron-Rich Silicon Borides Basedon Thermodynamic Stability and Transport Properties of High-Temperature Thermoelectric Materials
- Siliceous Manganese Ore from Eastern India:A Potential Resource for Ferrosilicon-Manganese Production
- A Strain-Compensated Constitutive Model for Describing the Hot Compressive Deformation Behaviors of an Aged Inconel 718 Superalloy
- Surface Alloys of 0.45 C Carbon Steel Produced by High Current Pulsed Electron Beam
- Deformation Behavior and Processing Map during Isothermal Hot Compression of 49MnVS3 Non-Quenched and Tempered Steel
- A Constitutive Equation for Predicting Elevated Temperature Flow Behavior of BFe10-1-2 Cupronickel Alloy through Double Multiple Nonlinear Regression
- Oxidation Behavior of Ferritic Steel T22 Exposed to Supercritical Water
- A Multi Scale Strategy for Simulation of Microstructural Evolutions in Friction Stir Welding of Duplex Titanium Alloy
- Partition Behavior of Alloying Elements in Nickel-Based Alloys and Their Activity Interaction Parameters and Infinite Dilution Activity Coefficients
- Influence of Heating on Tensile Physical-Mechanical Properties of Granite
- Comparison of Al-Zn-Mg Alloy P-MIG Welded Joints Filled with Different Wires
- Microstructure and Mechanical Properties of Thick Plate Friction Stir Welds for 6082-T6 Aluminum Alloy
- Research Article
- Kinetics of oxide scale growth on a (Ti, Mo)5Si3 based oxidation resistant Mo-Ti-Si alloy at 900-1300∘C
- Calorimetric study on Bi-Cu-Sn alloys
- Mineralogical Phase of Slag and Its Effect on Dephosphorization during Converter Steelmaking Using Slag-Remaining Technology
- Controllability of joint integrity and mechanical properties of friction stir welded 6061-T6 aluminum and AZ31B magnesium alloys based on stationary shoulder
- Cellular Automaton Modeling of Phase Transformation of U-Nb Alloys during Solidification and Consequent Cooling Process
- The effect of MgTiO3Adding on Inclusion Characteristics
- Cutting performance of a functionally graded cemented carbide tool prepared by microwave heating and nitriding sintering
- Creep behaviour and life assessment of a cast nickel – base superalloy MAR – M247
- Failure mechanism and acoustic emission signal characteristics of coatings under the condition of impact indentation
- Reducing Surface Cracks and Improving Cleanliness of H-Beam Blanks in Continuous Casting — Improving continuous casting of H-beam blanks
- Rhodium influence on the microstructure and oxidation behaviour of aluminide coatings deposited on pure nickel and nickel based superalloy
- The effect of Nb content on precipitates, microstructure and texture of grain oriented silicon steel
- Effect of Arc Power on the Wear and High-temperature Oxidation Resistances of Plasma-Sprayed Fe-based Amorphous Coatings
- Short Communication
- Novel Combined Feeding Approach to Produce Quality Al6061 Composites for Heat Sinks
- Research Article
- Micromorphology change and microstructure of Cu-P based amorphous filler during heating process
- Controlling residual stress and distortion of friction stir welding joint by external stationary shoulder
- Research on the ingot shrinkage in the electroslag remelting withdrawal process for 9Cr3Mo roller
- Production of Mo2NiB2 Based Hard Alloys by Self-Propagating High-Temperature Synthesis
- The Morphology Analysis of Plasma-Sprayed Cast Iron Splats at Different Substrate Temperatures via Fractal Dimension and Circularity Methods
- A Comparative Study on Johnson–Cook, Modified Johnson–Cook, Modified Zerilli–Armstrong and Arrhenius-Type Constitutive Models to Predict Hot Deformation Behavior of TA2
- Dynamic absorption efficiency of paracetamol powder in microwave drying
- Preparation and Properties of Blast Furnace Slag Glass Ceramics Containing Cr2O3
- Influence of unburned pulverized coal on gasification reaction of coke in blast furnace
- Effect of PWHT Conditions on Toughness and Creep Rupture Strength in Modified 9Cr-1Mo Steel Welds
- Role of B2O3 on structure and shear-thinning property in CaO–SiO2–Na2O-based mold fluxes
- Effect of Acid Slag Treatment on the Inclusions in GCr15 Bearing Steel
- Recovery of Iron and Zinc from Blast Furnace Dust Using Iron-Bath Reduction
- Phase Analysis and Microstructural Investigations of Ce2Zr2O7 for High-Temperature Coatings on Ni-Base Superalloy Substrates
- Combustion Characteristics and Kinetics Study of Pulverized Coal and Semi-Coke
- Mechanical and Electrochemical Characterization of Supersolidus Sintered Austenitic Stainless Steel (316 L)
- Synthesis and characterization of Cu doped chromium oxide (Cr2O3) thin films
- Ladle Nozzle Clogging during casting of Silicon-Steel
- Thermodynamics and Industrial Trial on Increasing the Carbon Content at the BOF Endpoint to Produce Ultra-Low Carbon IF Steel by BOF-RH-CSP Process
- Research Article
- Effect of Boundary Conditions on Residual Stresses and Distortion in 316 Stainless Steel Butt Welded Plate
- Numerical Analysis on Effect of Additional Gas Injection on Characteristics around Raceway in Melter Gasifier
- Variation on thermal damage rate of granite specimen with thermal cycle treatment
- Effects of Fluoride and Sulphate Mineralizers on the Properties of Reconstructed Steel Slag
- Effect of Basicity on Precipitation of Spinel Crystals in a CaO-SiO2-MgO-Cr2O3-FeO System
- Review Article
- Exploitation of Mold Flux for the Ti-bearing Welding Wire Steel ER80-G
- Research Article
- Furnace heat prediction and control model and its application to large blast furnace
- Effects of Different Solid Solution Temperatures on Microstructure and Mechanical Properties of the AA7075 Alloy After T6 Heat Treatment
- Study of the Viscosity of a La2O3-SiO2-FeO Slag System
- Tensile Deformation and Work Hardening Behaviour of AISI 431 Martensitic Stainless Steel at Elevated Temperatures
- The Effectiveness of Reinforcement and Processing on Mechanical Properties, Wear Behavior and Damping Response of Aluminum Matrix Composites