3D Heat Conductivity Model of Mold Based on Node Temperature Inheritance
-
 ,
,

Abstract
A novel 3D conductive heat transfer model was developed based on node temperature inheritance. Heat transfer of the mold and billet could be analyzed synchronously. In the model, heat transfer in the copper wall was in a steady state, whereas heat transfer in the billet was in a transient state. The temperature distribution indicated that the maximum temperature on the copper wall reached approximately 30 mm below the meniscus. The results were in better agreement with industrially measured data than those of traditional 2D heat transfer models. The model was applied to study the effect of water scale on heat transfer of a billet mold. When the scale thickness increased from 0 to 0.5 mm, the maximum temperature on the copper wall increased from 174 °C to 364 °C, which will lead to mold deformation and peeling of the coating. In addition, the shell thickness slightly decreased with increasing scale thickness.
Introduction
The cooling water quality of the mold is a critical factor in the process of continuous casting (CC). If the water quality is poor, the scale is easily precipitated and adheres to the surface of the mold wall [1]. The scale provides additional thermal resistance that reduces the mold heat flux, resulting in an increase of the copper wall temperature. A higher mold wall temperature will lead to mold distortion and coating exfoliation. In addition, the scale is usually unevenly distributed, which triggers irregular mold heat transfer and results in uneven shell solidification. Therefore, the scale on the mold wall is closely associated with the billet surface quality and even molten steel breakout [1, 2]. However, published studies on this issue are limited.
In the CC process, heat transfer and solidification of the billet are performed at the same time as heat transfer of the copper wall. Some traditional models have been used to independently calculate the temperature of the copper wall and billet, which is physically defective and will lead to deviation between the calculated results of the copper wall temperature and the actual production results. To analyze the heat transfer behavior of the copper wall and billet synchronously, two types of models have been developed in previous studies: a 2D model and 3D model. For the 2D model [3, 4], the slice of the solidifying billet shell and mold wall moves downward at a certain casting speed to simulate the CC process. However, in actual production, the copper wall is fixed (neglecting mold oscillation) and does not move downward with the billet or slab. For the 3D model, in most studies, the heat transfer behavior was analyzed by coupling the flow field and temperature field. In 2007, Shamsi et al. built a 3D mathematical model to simulate the heat transfer of the mold and slab based on considerations of fluid flow, heat transfer, and solidification [5]. In 2010, Tian et al. built a 3D model that coupled fluid flow, heat transfer, and macroscopic solidification in a thin slab [6]. In 2016, Zhang et al. built a 3D model that coupled fluid flow, heat transfer, and solidification to simulate a beam blank mold [7]. However, 3D thermal conductivity models for simultaneous analysis of temperature in the copper wall and billet/slab have seldom been reported.
In the present work, a novel 3D thermal conductivity numerical model was developed. The model was built based on node temperature inheritance (NTI), with the heat transfer behaviors of the mold and billet analyzed synchronously. The developed 3D model was validated using industrially measured mold temperatures and compared with a traditional 2D mold heat transfer model. Finally, the model was applied to the study of the effect of copper wall scale on the heat transfer behaviors in the billet mold.
Model description
Mathematical model for thermal conductivity
According to the characteristics of the solidification of molten steel and the heat transfer in the mold, combined with previous research experience [5, 6, 7, 8, 9, 10, 11, 12], the following simplifications and assumptions were made:
The effective thermal conductivity coefficient is equivalent to the heat transfer in the solid–liquid phase and the molten steel pool. Then, the heat transfer in the billet can be simplified to be a thermal conductivity process.
Convection, radiation, and other heat transfer behaviors in the area between the copper wall and shell are simplified as an equivalent thermal resistance. Then, the heat transfer between the shell and mold can be simplified to be a thermal conductivity process.
The CC process in the mold is in a stable state.
The effect of mold oscillation on heat transfer is negligible.
The heat transfer coefficient between mold wall and cooling water is kept constant. The heat transfer from the billet to the cooling water through the copper mold wall is governed by the following partial differential equation (PDE) for heat conduction:
(1)For comparison with the 3D model, a traditional 2D nonsteady heat conduction model of the mold was established, for which the mold heat conduction in the longitudinal direction was neglected:
(2)
Here, T is the temperature, K; ρ is the density, kg· m−3; τ is time, s; c is the specific heat capacity, J· kg−1· K−1; both k and λ are thermal conductivity, W· m−1· K−1; and G is the internal heat source, W· m−3.
Entity model
The model simulates a quarter of a 150×150 mm2 billet and mold. Figure 1 shows 3D discrete grids of the whole mold and billet shell. There are 11,356 meshes in the mold and 45,528 meshes in the shell, and the mesh near the shell surface is finer than that of the interior of the shell. Once the numeric model was built, many mesh patterns for the mold and shell were used to perform initial calculations; then, a suitable mesh pattern was found, and a grid-free solution could be obtained. The mathematical model was solved using a commercial code (ANSYS 14.0 software with SOLID 70 element).

Three-dimensional finite-element model: (a) whole model, (b) mold model, and (c) billet model.
For comparison, a 2D transient model based on the traditional method was established, for which the longitudinal heat transfer in the mold was ignored, and simulations for the billet and mold were run simultaneously. The 2D model also simulated a quarter of a 150×150 mm2 billet and mold. The mathematical model was also solved using a commercial code (ANSYS 14.0 software with SOLID 55 element). Figure 2 shows the 2D discrete grids of the whole mold and billet shell. There were 96 meshes in mold and 550 meshes in the billet, and the meshes near the shell surface were finer than the interior ones.

2D finite-element model.
Boundary conditions
The relevant boundary conditions are as follows:
The top and bottom of the mold were considered to be adiabatic, and heat loss on the top surface of molten steel was ignored.
On the symmetrical surface of the billet and mold wall, the Neumann boundary condition was adopted, and the heat flux was 0.
The convective heat transfer coefficient (hw, W· m−2· K−1) between the mold and cooling water was calculated using the following equation [13]:
(3)
where λ is the thermal conductivity of the cooling water, W· m−2· K−1; D is the equivalent diameter of the cooling water, m; ρ is the density of the cooling water, kg· m−3;
(4)In the copper wall area with scale, the thermal contact resistance between the scale and mold wall was neglected. The comprehensive heat transfer coefficient (
where RW is the thermal contact resistance between the cooling water and scale surface, m2· K· W−1, and Rscale is the thermal resistance of the scale, m2· K· W−1.
(5) The heat conductivity of the scale is 2.2 W· m−1· K−1 [14]. With increasing distance from the meniscus, the thickness of the scale gradually decreased. At a water velocity of 10 m/s, the equivalent heat transfer coefficients between the mold and cooling water with different scale thickness were calculated using eq. (3) and eq. (4), and the results are presented in Figure 3. As observed in Figure 3, the heat transfer coefficient continuously increased with increased scale thickness. In the area without scale, the convection heat transfer coefficient was constant at 3.5×10⁴ W· m−2· K−1.

Heat transfer coefficient between copper surface and cooling water for different scale thicknesses.
(6) It is difficult to determine the exact thermal resistance for a specific technological condition. Therefore, in this paper, the distribution characteristics of the equivalent thermal resistance between the copper wall and shell were set in accordance with ref [15]. Because of the differences in the billet cross-section, steel grade, and mold slag and casting parameters, the resistance must be corrected. The average heat flow of the mold was determined using the temperature difference and flow rate of the cooling water in the actual production. By comparing the difference between the above heat flow and calculated heat flow, the equivalent thermal resistance parameters were corrected and calculated repeatedly.
Computational procedure for 3D-NTI method
During the CC process, the mold location is relatively constant (ignoring the mold oscillation), whereas the billet moves downward at a certain casting speed. As mentioned above, some traditional computational models ignore this significant feature. In the 3D-NTI model, the heat transfer behaviors of the mold and billet were analyzed synchronously. During the simulation, the heat transfer behaviors of the copper wall and billet were addressed in different ways. In the interior of the mold wall, the temperature was inherited by itself. In the billet, depending on the casting speed, the temperatures of all the nodes inherited the temperature of the upper corresponding nodes through a time step of heat conduction. Using the above procedures, the motion feature of the mold and billet in actual production could be simulated. Then, the iterative computation was started to obtain a steady state. The steady-state criterion was a difference between the temperatures of the nodes of the two iterations of less than 1 °C.
Afterward, the heat flows transferred from the shell and taken away by the cooling water were compared. If the difference between the above two heat flows was acceptable (<1 %), the calculation would be completed. Otherwise, the equivalent thermal resistance was corrected in equal proportion. Using a personal computer with a Core TM i7 CPU and 8 G memory capacity, the total operation of the current model takes approximately 20 h. The corresponding flowchart of the calculation process is presented in Figure 4. This model can easily solve the thermal conductivity problems of the mold for a square, round, or beam blank billet; conventional slab; and even a thin slab cast using a funnel-shaped mold [16].

Flowchart of NTI calculation process.
Production parameters
A typical mold was used to cast a 5330t billet, as shown in Figure 5. The scale outside the mold wall is clearly visible. The thickest area of the scale is near the meniscus and gradually decreases with decreasing height. There is less scale in the corner zone of the mold. With full consideration of the above features, the scale in the model was located at a distance from the meniscus of 0–300 mm and uniformly thinned along the casting direction. With decreasing height, the scale thickness was gradually reduced to 0 mm.

Industrial mold with scale.
The steel composition is shown in Table 1, and the operating conditions and parameters of the mold are presented in Table 2.
Q235 grade steel composition, mass%.
| C | Si | Mn | P | S |
|---|---|---|---|---|
| 0.15 | 0.15 | 0.42 | 0.013 | 0.018 |
Operating conditions and parameters of CC mold.
| Pouring temperature | 1,540οC (1813 K) |
|---|---|
| Liquidus temperature | 1,525οC (1798 K) |
| Normal casting speed | 2.50 m/min |
| Distance from meniscus to mold inlet | 80 mm |
| Thickness of scale near meniscus | 0 ~ 0.5 mm |
| Flow rate of cooling water | 10 m/s |
| Temperature of cooling water | 35οC(308 K) |
| Width of cooling water channel | 4 mm |
| Mold length | 900 mm |
| Mold thickness | 14 mm |
| Fillet radius | 8 mm |
| Distance between mold edge and seal groove | 10 mm |
| Seal groove width | 8 mm |
| Seal groove depth | 4 mm |
Results and discussion
Verification and comparison
To verify the accuracy of the 3D-NTI model, mold temperature fields at casting speeds of 1.20 and 2.50 m/min were analyzed. The temperature variations of the hot face of the mold at different casting speeds are shown in Figure 6. The industrialized measurement results [17, 18] of the center temperature of the hot face at casting speeds of 1.22 and 1.80 m· min−1 during productions of w[C] (mass, %)=0.14 and 0.60 grade steels are also marked in Figure 6. The calculated results at a casting speed of 1.20 m/min were in good agreement with the results industrially measured by Pinheiro [17]. Comparison of the red lines with the black dots reveals that there were slight deviations between the 2.50 m/min calculated results and Tao’s industrial data in some regions [18], which may be due to the different casting speed, carbon content, and mold slag. The highest temperature location of the copper wall was approximately 30 mm below the meniscus. In general, the temperature variation trend was consistent for the numerical analysis results and industrial measurement data.

Comparison between calculated temperature and industrially measured data on hot face of mold.
The temperature distributions of the hot face and cold face analyzed using the 3D-NTI model and traditional 2D model are presented in Figure 7. The results were calculated at a casting speed of 2.50 m/min, and there was no scale on the mold surface.

Distributions of longitudinal temperature of mold wall calculated using different models on (a) hot face and (b) cold face.
Significant differences in the copper wall temperature results for the 2D and 3D models were observed in the range of −70 mm to 600 mm below the meniscus.
From the 3D model analysis results, because the mold wall above the meniscus is not in contact with molten steel, there is a large temperature gradient in the vertical direction. However, the 2D model cannot determine the temperatures of the mold above the meniscus because of the limitations of its design mechanism.
The temperature distribution analyzed by the 2D model is obviously not consistent with the industrially measured data (presented in Figure 6). Based on industrial production experience, the most likely location of the copper wall deformation [19] and scale precipitation (shown in Figure 5) is 0–50 mm below the meniscus. However, for the 2D model, the maximum temperature occurs approximately 160 mm below the meniscus. These two positions are not consistent. This discrepancy is due to the main self-defect of the traditional 2D model. In the 2D model, the initial temperature of the mold wall is room temperature. Therefore, the formation of the maximum temperature in the mold wall must wait for the billet to run down for a certain distance. Therefore, the maximum temperature point in the 2D model will be lower than the actual position. In the 3D model, the highest temperature point is located 30 mm below the meniscus. When compared with the industrially measured data, the 3D-NHI model describes the actual production state of the mold more accurately than the 2D model.
In the area near the outlet of the mold, the temperature distributions by the two models are basically the same, which indicates that after a period of heat transfer, the effect of the temperature field on the upper mold wall is weakened. As the copper has excellent thermal conductivity, the heat transfer in the mold is mainly horizontal rather than vertical.
Mold temperature with different scale thickness
The half-softening temperature is usually used for comparison with the maximum temperature to predict the pattern of mold distortion. However, the half-softening temperature is greatly affected by the service time. As shown in ref. [2], upon increasing the service time from 100 to 500 h, the half-softening temperature of silver-free copper decreased from 267 °C to 185 °C (540 K to 458 K). In ref. [20], the researchers report that the recrystallization temperature of TP2 grade copper is approximately 200 °C (473 K).
Based on the established 3D-NHI model, the heat transfer characteristics of the mold at a casting speed of 2.50 m/min with a scale thickness (near the meniscus) of 0–0.5 mm were analyzed. The temperature variation of the mold surface in a typical area is shown in Figure 8. According to the results presented in Figure 8(a) and (b), scale deposition had a significant effect on the temperature field in the upper part of the mold. This effect caused slight thinning of the shell, as discussed later in this paper. It can also be observed in Figure 8 that in the lower part of the mold, the change of the copper wall temperature was not obvious for different scale thicknesses. Although the shell was thinned by the decrease of the upper heat transfer, because the heat conductivities were very high inside the copper wall and at the interface between the copper wall and cooling water, the increase of the heat flux could be easily carried away by cooling water; therefore, the copper wall temperature did not increase significantly. Therefore, the increase of the temperature of the lower part of the cold face of the copper wall was relatively small.

Longitudinal temperature variation of mold surface for different scale thicknesses on (a) hot face and (b) cold face.
On the hot face, when there was no scale on the mold, the maximum temperature of the mold wall was 174 °C (447 K). This temperature is much lower than the recrystallization temperature of the copper mold (TP2). Therefore, the mold will not deform plastically and can work stably for a long time. Upon increasing the scale thickness to 0.3 and 0.5 mm, the maximum temperature on the hot face of the mold increased to 308 °C (581 K) and 364 οC (637 K), respectively, which exceeded the recrystallization temperature of the phosphorus deoxidized copper.
In addition, as shown in Figure 8, the change in the scale thickness did not cause the highest temperature position to change. However, with increasing scale thickness, the high-temperature area of mold wall was gradually enlarged. The distributions of the high-temperature areas on the hot and cold faces of the mold with the scale thickness of the mold wall reaching 0.5 mm near the meniscus are presented separately in Figure 9. As shown in Figure 9(a), in the range of 10–220 mm below the meniscus, the temperature of the mold hot face was greater than 200 °C (473 K), which will lead to plastic deformation of the mold tube and aggravate stripping of the coating. It can be concluded that if the mold is working in this state for a long time, a series of billet quality issues will arise.
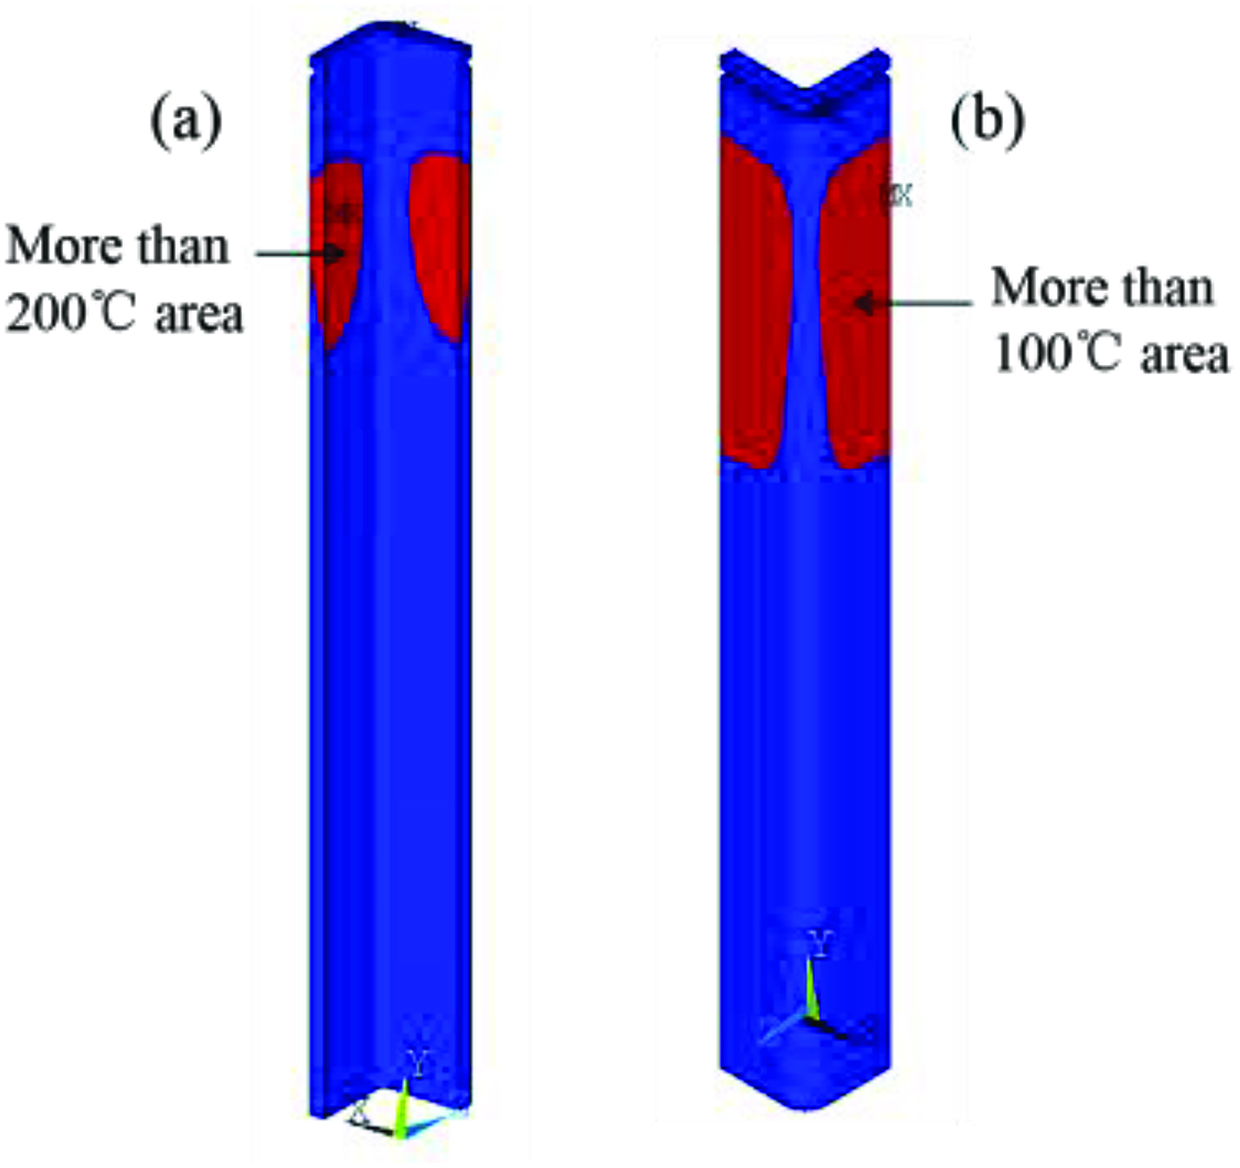
High-temperature regions of mold wall with 0.5-mm-thick scale on (a) hot face and (b) cold face.
On the cold face, it can be observed that the high-temperature region (higher than 100 °C) for the calculated results (in Figure 9(b)) is basically the same as the scale deposition area on the actual mold (in Figure 5). This finding indicates that the scale precipitation is closely related to the high temperature of the copper wall. Figure 8(b) shows that if there is no scale on the copper surface, the maximum temperature on the cold face of copper wall is 94 °C (372 K); thus, the cooling water will not boil in the mold cooling water channel. When the scale deposits on the mold, the temperature of the mold wall near the meniscus region will rise substantially. If a 0.1-mm-thick scale is present on the mold near meniscus, the highest temperature of the cold face of the mold will increase to 153 °C (426 K), and the cooling water may be boiling in this area. When the thickness of the scale reaches 0.3 mm or even 0.5 mm, the surface temperature of the copper wall will be even higher. The boiling of water intensifies the precipitation and adhesion of scale on the mold wall and increases the heat resistance for the heat transfer. Thus, the temperature of the mold wall will rise further, leading to a detrimental cycle.
Effect of scale thickness on billet solidification
Under the same conditions, the growth law of the shell thickness for different scale thicknesses was determined using the 3D model, as shown in Figure 10. At the mold outlet, upon increasing the scale thickness from 0 to 0.5 mm, the thickness of the shell in the surface center was reduced from 9.4 to 9.1 mm. In the corner of the billet, as there was no scale, little difference was observed in the shell thicknesses.

Solidification law of billet for different scale thickness (a) in the center of billet surface and (b) at the corner of billet.
Conclusions
Based on NTI, a novel 3D heat conduction model was established. The temperature fields of the mold and billet were analyzed synchronously, and the effect of the scale thickness on heat transfer was studied. The following conclusions were drawn:
The 3D-NTI model can more accurately describe the temperature distribution in the mold than the 2D model. The highest temperature of the mold wall is 30 mm below the meniscus.
The quality of the cooling water is critical for CC production because scale on copper will cause a sharp rise of the mold wall temperature. Upon increasing the scale thickness from 0 to 0.5 mm, a high-temperature area (>100°C) of the cold face of the mold wall appears and rapidly expands, which may cause boiling of the cooling water. In addition, the maximum temperature of the hot face of the mold increases from 174 °C to 364 °C (447 K to 673 K), which will lead to plastic deformation of the mold tube and aggravate stripping of the coating.
The shell thickness is slightly affected by the scale. Upon increasing the scale thickness from 0 to 0.5 mm, the shell thickness at the mold outlet is reduced by 0.3 mm.
Funding statement: We would like to acknowledge the financial support provided by the Hebei Provincial Department of Education (No. ZD2014012) and the Natural Science Foundation of Hebei (No. E2015209207).
References
[1] Z. Yan, S.S. Cheng and Z.J. Cheng, Ironmak. Steelmak., 41 (2014) 206–212.10.1179/1743281213Y.0000000121Search in Google Scholar
[2] I.V. Samarasekera and J.K. Brimacombe, Can. Metall. Quart., 18 (1979) 251–266.10.1179/cmq.1979.18.3.251Search in Google Scholar
[3] L. Tang, M. Yao, X. Wang and X. Zhang, Steel Res. Int., 83 (2012) 1203–1213.10.1002/srin.201200075Search in Google Scholar
[4] J. Song, Z.F. Cai, M.Y. Piao and J. Zhu, Iron Steel Res. Int., 21 (2014) 1–9.10.1016/S1006-706X(14)60112-6Search in Google Scholar
[5] M.R.R.I. Shamsi and S.K. Ajmani, S. K., ISIJ Int. 47 (2007) 433–442.10.2355/isijinternational.47.433Search in Google Scholar
[6] X.Y. Tian, F. Zou, B.W. Li and J.C. He, Metal. And Mater. Trans. B, 41 (2010) 112–120.10.1007/s11663-009-9314-3Search in Google Scholar
[7] L.L. Zhang, D.F. Chen, H.B. Chen, M.J. Long and X. Xie, Ironmak. Steelmak., 44 (2016) 193–201.10.1080/03019233.2016.1209881Search in Google Scholar
[8] P. Oksman, S. Yu, H. Kytonen and S. Louhenkilpi, Acta Polytech Hung, 11 (2014) 5–22.10.12700/APH.11.09.2014.09.1Search in Google Scholar
[9] J. Savage and W.H. Pritchard, J. Iron Steel Institute, 178 (1954) 268–277.Search in Google Scholar
[10] X. Liu and M. Zhu, Trans. Iron Steel Inst. Jap., 46 (2006) 1652–1659.10.2355/isijinternational.46.1652Search in Google Scholar
[11] H. Zhang, W. Wang, F. Ma and L. Zhou, Metal. Mater. Trans. B, 46 (2015) 2361–2373.10.1007/s11663-015-0413-zSearch in Google Scholar
[12] X. Wang, L. Kong, M. Yao, et al. Metal. Mater. Trans. B, 48 (2016) 1–10.10.1007/s11663-016-0778-7Search in Google Scholar
[13] W.Y. Mok, Y. Tae-Jung, O.K. Hwan, P. Joong, J. Choi and Y. Hee, ISIJ Int., 38 (1998) 53.10.2355/isijinternational.38.53Search in Google Scholar
[14] Z. Quan, Y. Chen and C. Ma, Chinese J Chem Eng, 16 (2008) 535–540.10.1016/S1004-9541(08)60117-2Search in Google Scholar
[15] X. Wang, L. Kong, F. Du, M. Yao and X. Zhang, ISIJ Int., 56 (2016) 803–811.10.2355/isijinternational.ISIJINT-2015-601Search in Google Scholar
[16] P. Xiao, Z. Wang and Z. Liu, Three-dimensional Analysis of the Steel Solidification and Heat Transfer inside a Funnel Mold. 7th International Conference on Modelling and Simulation of Metallurgical Processes in Steelmaking. Qingdao, China, (2017), 274.Search in Google Scholar
[17] C.A.M. Pinheiro, I.V. Samarasekera and J.K. Brimacomb, Ironmak. Steelmak., 27 (2013) 37–54.10.1179/030192300677363Search in Google Scholar
[18] H. Tao, H. Tang, C. Xii, S. Qiu and P. Zhao, Iron Steel, 39 (2004) 24–27.Search in Google Scholar
[19] C.A.M. Pinheiro, I.V. Samarasekera, J.K. Brimacomb and B.N. Walker, Ironmak. Steelmak., 27 (2013) 37–54.10.1179/030192300677363Search in Google Scholar
[20] J.X. Chen, Continuous Casting Steel Handbook, Metallurgical Industry Press, Beijing (1991) 465.Search in Google Scholar
© 2019 Walter de Gruyter GmbH, Berlin/Boston
This work is licensed under the Creative Commons Attribution 4.0 Public License.
Articles in the same Issue
- Frontmatter
- Review Article
- Research on the Influence of Furnace Structure on Copper Cooling Stave Life
- Influence of High Temperature Oxidation on Hydrogen Absorption and Degradation of Zircaloy-2 and Zr 700 Alloys
- Correlation between Travel Speed, Microstructure, Mechanical Properties and Wear Characteristics of Ni-Based Hardfaced Deposits over 316LN Austenitic Stainless Steel
- Factors Influencing Gas Generation Behaviours of Lump Coal Used in COREX Gasifier
- Experiment Research on Pulverized Coal Combustion in the Tuyere of Oxygen Blast Furnace
- Phosphate Capacities of CaO–FeO–SiO2–Al2O3/Na2O/TiO2 Slags
- Microstructure and Interface Bonding Strength of WC-10Ni/NiCrBSi Composite Coating by Vacuum Brazing
- Refill Friction Stir Spot Welding of Dissimilar 6061/7075 Aluminum Alloy
- Solvothermal Synthesis and Magnetic Properties of Monodisperse Ni0.5Zn0.5Fe2O4 Hollow Nanospheres
- On the Capability of Logarithmic-Power Model for Prediction of Hot Deformation Behavior of Alloy 800H at High Strain Rates
- 3D Heat Conductivity Model of Mold Based on Node Temperature Inheritance
- 3D Microstructure and Micromechanical Properties of Minerals in Vanadium-Titanium Sinter
- Effect of Martensite Structure and Carbide Precipitates on Mechanical Properties of Cr-Mo Alloy Steel with Different Cooling Rate
- The Interaction between Erosion Particle and Gas Stream in High Temperature Gas Burner Rig for Thermal Barrier Coatings
- Permittivity Study of a CuCl Residue at 13–450 °C and Elucidation of the Microwave Intensification Mechanism for Its Dechlorination
- Study on Carbothermal Reduction of Titania in Molten Iron
- The Sequence of the Phase Growth during Diffusion in Ti-Based Systems
- Growth Kinetics of CoB–Co2B Layers Using the Powder-Pack Boriding Process Assisted by a Direct Current Field
- High-Temperature Flow Behaviour and Constitutive Equations for a TC17 Titanium Alloy
- Research on Three-Roll Screw Rolling Process for Ti6Al4V Titanium Alloy Bar
- Continuous Cooling Transformation of Undeformed and Deformed High Strength Crack-Arrest Steel Plates for Large Container Ships
- Formation Mechanism and Influence Factors of the Sticker between Solidified Shell and Mold in Continuous Casting of Steel
- Casting Defects in Transition Layer of Cu/Al Composite Castings Prepared Using Pouring Aluminum Method and Their Formation Mechanism
- Effect of Current on Segregation and Inclusions Characteristics of Dual Alloy Ingot Processed by Electroslag Remelting
- Investigation of Growth Kinetics of Fe2B Layers on AISI 1518 Steel by the Integral Method
- Microstructural Evolution and Phase Transformation on the X-Y Surface of Inconel 718 Ni-Based Alloys Fabricated by Selective Laser Melting under Different Heat Treatment
- Characterization of Mn-Doped Co3O4 Thin Films Prepared by Sol Gel-Based Dip-Coating Process
- Deposition Characteristics of Multitrack Overlayby Plasma Transferred Arc Welding on SS316Lwith Co-Cr Based Alloy – Influence ofProcess Parameters
- Elastic Moduli and Elastic Constants of Alloy AuCuSi With FCC Structure Under Pressure
- Effect of Cl on Softening and Melting Behaviors of BF Burden
- Effect of MgO Injection on Smelting in a Blast Furnace
- Structural Characteristics and Hydration Kinetics of Oxidized Steel Slag in a CaO-FeO-SiO2-MgO System
- Optimization of Microwave-Assisted Oxidation Roasting of Oxide–Sulphide Zinc Ore with Addition of Manganese Dioxide Using Response Surface Methodology
- Hydraulic Study of Bubble Migration in Liquid Titanium Alloy Melt during Vertical Centrifugal Casting Process
- Investigation on Double Wire Metal Inert Gas Welding of A7N01-T4 Aluminum Alloy in High-Speed Welding
- Oxidation Behaviour of Welded ASTM-SA210 GrA1 Boiler Tube Steels under Cyclic Conditions at 900°C in Air
- Study on the Evolution of Damage Degradation at Different Temperatures and Strain Rates for Ti-6Al-4V Alloy
- Pack-Boriding of Pure Iron with Powder Mixtures Containing ZrB2
- Evolution of Interfacial Features of MnO-SiO2 Type Inclusions/Steel Matrix during Isothermal Heating at Low Temperatures
- Effect of MgO/Al2O3 Ratio on Viscosity of Blast Furnace Primary Slag
- The Microstructure and Property of the Heat Affected zone in C-Mn Steel Treated by Rare Earth
- Microwave-Assisted Molten-Salt Facile Synthesis of Chromium Carbide (Cr3C2) Coatings on the Diamond Particles
- Effects of B on the Hot Ductility of Fe-36Ni Invar Alloy
- Impurity Distribution after Solidification of Hypereutectic Al-Si Melts and Eutectic Al-Si Melt
- Induced Electro-Deposition of High Melting-Point Phases on MgO–C Refractory in CaO–Al2O3–SiO2 – (MgO) Slag at 1773 K
- Microstructure and Mechanical Properties of 14Cr-ODS Steels with Zr Addition
- A Review of Boron-Rich Silicon Borides Basedon Thermodynamic Stability and Transport Properties of High-Temperature Thermoelectric Materials
- Siliceous Manganese Ore from Eastern India:A Potential Resource for Ferrosilicon-Manganese Production
- A Strain-Compensated Constitutive Model for Describing the Hot Compressive Deformation Behaviors of an Aged Inconel 718 Superalloy
- Surface Alloys of 0.45 C Carbon Steel Produced by High Current Pulsed Electron Beam
- Deformation Behavior and Processing Map during Isothermal Hot Compression of 49MnVS3 Non-Quenched and Tempered Steel
- A Constitutive Equation for Predicting Elevated Temperature Flow Behavior of BFe10-1-2 Cupronickel Alloy through Double Multiple Nonlinear Regression
- Oxidation Behavior of Ferritic Steel T22 Exposed to Supercritical Water
- A Multi Scale Strategy for Simulation of Microstructural Evolutions in Friction Stir Welding of Duplex Titanium Alloy
- Partition Behavior of Alloying Elements in Nickel-Based Alloys and Their Activity Interaction Parameters and Infinite Dilution Activity Coefficients
- Influence of Heating on Tensile Physical-Mechanical Properties of Granite
- Comparison of Al-Zn-Mg Alloy P-MIG Welded Joints Filled with Different Wires
- Microstructure and Mechanical Properties of Thick Plate Friction Stir Welds for 6082-T6 Aluminum Alloy
- Research Article
- Kinetics of oxide scale growth on a (Ti, Mo)5Si3 based oxidation resistant Mo-Ti-Si alloy at 900-1300∘C
- Calorimetric study on Bi-Cu-Sn alloys
- Mineralogical Phase of Slag and Its Effect on Dephosphorization during Converter Steelmaking Using Slag-Remaining Technology
- Controllability of joint integrity and mechanical properties of friction stir welded 6061-T6 aluminum and AZ31B magnesium alloys based on stationary shoulder
- Cellular Automaton Modeling of Phase Transformation of U-Nb Alloys during Solidification and Consequent Cooling Process
- The effect of MgTiO3Adding on Inclusion Characteristics
- Cutting performance of a functionally graded cemented carbide tool prepared by microwave heating and nitriding sintering
- Creep behaviour and life assessment of a cast nickel – base superalloy MAR – M247
- Failure mechanism and acoustic emission signal characteristics of coatings under the condition of impact indentation
- Reducing Surface Cracks and Improving Cleanliness of H-Beam Blanks in Continuous Casting — Improving continuous casting of H-beam blanks
- Rhodium influence on the microstructure and oxidation behaviour of aluminide coatings deposited on pure nickel and nickel based superalloy
- The effect of Nb content on precipitates, microstructure and texture of grain oriented silicon steel
- Effect of Arc Power on the Wear and High-temperature Oxidation Resistances of Plasma-Sprayed Fe-based Amorphous Coatings
- Short Communication
- Novel Combined Feeding Approach to Produce Quality Al6061 Composites for Heat Sinks
- Research Article
- Micromorphology change and microstructure of Cu-P based amorphous filler during heating process
- Controlling residual stress and distortion of friction stir welding joint by external stationary shoulder
- Research on the ingot shrinkage in the electroslag remelting withdrawal process for 9Cr3Mo roller
- Production of Mo2NiB2 Based Hard Alloys by Self-Propagating High-Temperature Synthesis
- The Morphology Analysis of Plasma-Sprayed Cast Iron Splats at Different Substrate Temperatures via Fractal Dimension and Circularity Methods
- A Comparative Study on Johnson–Cook, Modified Johnson–Cook, Modified Zerilli–Armstrong and Arrhenius-Type Constitutive Models to Predict Hot Deformation Behavior of TA2
- Dynamic absorption efficiency of paracetamol powder in microwave drying
- Preparation and Properties of Blast Furnace Slag Glass Ceramics Containing Cr2O3
- Influence of unburned pulverized coal on gasification reaction of coke in blast furnace
- Effect of PWHT Conditions on Toughness and Creep Rupture Strength in Modified 9Cr-1Mo Steel Welds
- Role of B2O3 on structure and shear-thinning property in CaO–SiO2–Na2O-based mold fluxes
- Effect of Acid Slag Treatment on the Inclusions in GCr15 Bearing Steel
- Recovery of Iron and Zinc from Blast Furnace Dust Using Iron-Bath Reduction
- Phase Analysis and Microstructural Investigations of Ce2Zr2O7 for High-Temperature Coatings on Ni-Base Superalloy Substrates
- Combustion Characteristics and Kinetics Study of Pulverized Coal and Semi-Coke
- Mechanical and Electrochemical Characterization of Supersolidus Sintered Austenitic Stainless Steel (316 L)
- Synthesis and characterization of Cu doped chromium oxide (Cr2O3) thin films
- Ladle Nozzle Clogging during casting of Silicon-Steel
- Thermodynamics and Industrial Trial on Increasing the Carbon Content at the BOF Endpoint to Produce Ultra-Low Carbon IF Steel by BOF-RH-CSP Process
- Research Article
- Effect of Boundary Conditions on Residual Stresses and Distortion in 316 Stainless Steel Butt Welded Plate
- Numerical Analysis on Effect of Additional Gas Injection on Characteristics around Raceway in Melter Gasifier
- Variation on thermal damage rate of granite specimen with thermal cycle treatment
- Effects of Fluoride and Sulphate Mineralizers on the Properties of Reconstructed Steel Slag
- Effect of Basicity on Precipitation of Spinel Crystals in a CaO-SiO2-MgO-Cr2O3-FeO System
- Review Article
- Exploitation of Mold Flux for the Ti-bearing Welding Wire Steel ER80-G
- Research Article
- Furnace heat prediction and control model and its application to large blast furnace
- Effects of Different Solid Solution Temperatures on Microstructure and Mechanical Properties of the AA7075 Alloy After T6 Heat Treatment
- Study of the Viscosity of a La2O3-SiO2-FeO Slag System
- Tensile Deformation and Work Hardening Behaviour of AISI 431 Martensitic Stainless Steel at Elevated Temperatures
- The Effectiveness of Reinforcement and Processing on Mechanical Properties, Wear Behavior and Damping Response of Aluminum Matrix Composites