A Constitutive Equation for Predicting Elevated Temperature Flow Behavior of BFe10-1-2 Cupronickel Alloy through Double Multiple Nonlinear Regression
-
Jun Cai
 ,
Meng Wang
,
Meng Wang

Abstract
Constitutive analysis for elevated temperature flow behavior of BFe10-1-2 alloy was carried out by using experimental stress–strain data from isothermal hot compression tests on a Gleeble-3800 thermo-mechanical simulator, in a wide of temperature range of 1,023–1,273 K, and strain rate range of 0.001–10 s−1. A constitutive equation based on double multiple nonlinear regression (DMNR) was proposed considering the independent effects of strain, strain rate, temperature and their interrelation. The predicted flow stress data obtained from the developed equation based on DMNR was compared with the experimental data. Correlation coefficient (R), average absolute relative error (AARE) and relative errors were introduced to verify the validity of the developed constitutive equation. The results showed that the developed constitutive equation based on DMNR could predict flow stress of BFe10-1-2 alloy with good correlation and generalization.
Introduction
As a typical Cu–Ni alloy, BFe10-1-2 cupronickel alloy has been widely employed as cooling-condition material in shipping and seawater desalted industry due to its attractive combinations of characteristics in terms of excellent corrosion resistance and anti-fouling properties [1]. Nowadays, the main processing method of this kind alloy is semi-solid casting ingots and followed hot extrusion, which results in many problems, such as long process time, high energy consumption, low product yield and high cost [2, 3, 4, 5]. Hence, a thorough study on elevated temperature flow behavior of BFe10-1-2 cupronickel alloy is of vital importance to properly design the processing parameters. However, the high temperature deformation behavior of metals is a very complex process. The softening and hardening mechanisms are affected by processing parameters such as deformation temperature, strain rate and strain [6]. Nowadays, finite element method (FEM) has become a common tool to find out the optimum thermo-mechanical process parameters. Constitutive equation can represent the flow behavior of metal material, and is used as input to the FEM code for simulating the response of materials under the specified processing conditions [7]. Reliability of the outputs of these simulations depends primarily on the accuracy of prediction of the constitutive equation. Therefore, the reliability of simulation results is seriously influenced by the accuracy of the constitutive equation.
For the past few years, several empirical, semi-empirical, phenomenological and physically based constitutive models have been proposed. Among these constitutive models, the Johnson-Cook (JC) model, the Zerilli-Armstrong (ZA) model and the Arrhenius-type model are currently a part of commercial FEM software. The JC model has been widely employed owing to the fact that it requires less number of test data for evaluation of the material constants and can be used for many metal materials in a wide range of deformation temperatures and strain rates [8]. The ZA model considers coupled strain and temperature effects, and has been employed to analyze different face-centered cubic and body-centered cubic materials over various strain rates at the temperatures between room temperature and 0.6Tm (Tm is the melting point) [9]. The Arrhenius-type equation has been successfully used to describe the high temperature flow behavior of metal materials, such as martensitic steel [10], AZ61 Mg alloy [11] and aluminum matrix composites [12]. On the basis of the orthogonal experiment and variance analysis, Xiao [13] proposed a constitutive model to describe the elevated temperature flow behavior of TiNiNb alloy. However, this constitutive model ignores the combined effect of influence factors on flow stress, which may decrease the accuracy of the constitutive equation. Then, a double multiple nonlinear regression (DMNR) method with higher accuracy is proposed by Yuan [14] to predict the flow stress of Ti-6Al-4V alloy, and then was intruded by Hussain [15] to study thermo-mechanical processing of INCONEL 718 alloy. Thereafter, Li [16] proposed a modified DMNR constitutive equation to predict the flow stress of 1,060 pure aluminum with a good correlation and precision. Then this method was used by Cai [17] to analyze the flow behavior of BFe10-1-2 cupronickel alloy, and could give an accurate and precise estimate of the flow stress. However, modified DMNR constitutive model is very complex, and thereby the time required for evaluating these material constants of the constitutive equation is much longer than that of the other models. To sum up, an ideal constitutive equation should involve a reasonable number of material constants that can be calculated from limited experimental data, and can predict the flow behavior of the material with adequate accuracy and reliability over a wide processing range. The main purpose of this study is to find out the suitable constitutive equation to predict the elevated temperature flow behavior of BFe10-1-2 cupronickel alloy with considering the combined effect of strain, strain rate and deformation temperature. To achieve this objective, isothermal hot compression tests were performed in a wide range of temperatures (1,023, 1,073, 1,123, 1,173, 1,223 and 1,273 K) and strain rates of 0.001, 0.01, 0.1, 1 and 10 s−1. Finally, comparative analysis between calculated and actual results was conducted to verify the developed constitutive equation.
Experimental procedure
The chemical composition (wt. %) of BFe10-1-2 cupronickel alloy investigated in the present study is: Ni=10.80, Mn=2, Fe=1.38, Cu=bal. The original microstructure of as received BFe10-1-2 alloy is shown in Figure 1.

Microstructure of as received BFe10-1-2 cupronickel alloy.
The studied alloy is processed into cylindrical specimens with a height of 15 mm and a diameter of 10 mm for hot compression tests. In order to minimize the influence of friction, the flat ends of each specimen were recessed a depth of 0.1 mm groove to entrap the lubricant, as shown in Figure 2. The specimens prior to isothermal compression were heated to the test temperature at a rate of 1 °C/s and held for 3 min on the deformation conditions for the purpose of eliminating thermal gradients. Thereafter, isothermal compression experiments were carried out on a Gleeble-3800 thermo-simulation simulator in the strain rate range of 0.001–10 s−1 and the temperatures range of 1,023–1,273 K. According to the practical production, the compression ratio is selected as 55 %. Therefore, the true strain of specimen after deformation is about 0.8. After deformation, the specimens were cooled to room temperature in air. The true stress and strain data is acquired from load-stroke data by follows:
Typical appearance of the BFe10-1-2 cupronickel alloy specimens.
where
Results and discussion
Flow stress
Figure 3 illustrates the flow stress curves at the constant strain rate of 1,173 K (Figure 3(a)) and at a constant deformation temperature of 10 s−1 (Figure 3(b)). It can be seen that deformation temperature and strain rate have obvious influence on flow stress curves. The flow stress increases with the increase of strain rate, and decreases with the increase of deformation temperature. At the initial strain (lower than 0.05), the stress increases rapidly due to the continuous accumulation of dislocations. Then, a near steady-state region is achieved in which the flow stress is observed to remain nearly constant with further straining, which give the dynamic recovery (DRV) characteristics of the material.
Flow curves of BFe10-1-2 cupronickel alloy obtained at various deformation conditions (a) 1,073 K, (b) 10 s−1.
Double multivariate nonlinear regression
The high temperature flow behavior of BFe10-1-2 cupronickel alloy represented by the constitutive equation consisted with flow stress and influence parameters. Figure 4 gives the relationship between the flow stress and influence parameters. As can be seen from Figure 4, xi (i=1, 2, 3, …, n) are the test factors; hj (j=1, 2, 3, …, m) are the analysis factors; y is the objective function representing the flow stress which is set as, and y is a pan-function of xi and hj, y=F[h1, h2, …, hm]=f(x1, x2, …, xn); ωij and ωj are the converged weights, which represent the contribution of test factors xi to analysis factors hj and analysis factors hj to objective function y, respectively. The analysis factors hj are the function of test factors xi and can be obtained by converged weights ωij which represents the contribution of xi on hj. Therefore, the objective function y can be obtained from the contribution functions f[hj], and the converged weights ωj represent the contribution of functions f[hj] on the objective function y. Nonlinear regression based on the experimental data is employed to obtain the contribution function that defines the relationship between analysis factor hj and objective function y described as fj=f[hj] (a contribution function). The converged weights ωj can be calculated by using the multivariate nonlinear regression based on least square algorithm.
Relationship between the flow stress and influence parameters.
In order to acquire the constitutive equation for the elevated temperature deformation behavior of BFe10-1-2 cupronickel alloy, independent factors strain, strain rate and deformation temperature are defined as the test factors xi. The analysis factors are strain, strain rate, deformation temperature, the combined effect of strain and strain rate, the combined effect of strain and deformation temperature, and the combined effect of strain rate and deformation temperature, as shown in eq. (1).
After determination of all the analysis factors mentioned above, taking the mean flow stress values of each analysis factor, the contribution function fj can be acquired by using the nonlinear regression on the basis of the experimental data scatter plot, where:
After the determination of all the contribution function fj mentioned above, the constitutive equation based on the double multivariate nonlinear regression (DMNR) can be obtained. During high temperature deformation, constitutive equation of metal materials can be expressed as:
The effect of strain, strain rate and temperature on the flow stress can be expressed in another form as [13]:
where
Then, eq. (4) can be simplified as eq. (5):
where
Considering the converged weights ωj, the following expression can be derived:
Then eq. (7) can be rewritten as:
Based on DMNR, ωj and
As for BFe10-1-2 cupronickel alloy, the constitutive equation based on the DMNR is given by following formula:
The classification of the test factors and analysis factors according to independent factors and interactive factors, and levels of BFe10-1-2 cupronickel alloy are given in Table 1.
List of factors of BFe10-1-2 cupronickel alloy.
| Level | Single factor | Interactive factor | |||||
|---|---|---|---|---|---|---|---|
| 1 | 0.001 | 1,023 | 1,023–0.001 | ||||
| 2 | 1,073 | 1,073–0.001 | |||||
| 3 | 1,123 | 1,123–0.001 | |||||
| 4 | 1,173 | 1,173–0.001 | |||||
| 5 | 1,223 | 1,223–0.001 | |||||
| 6 | 1,273 | 1,273–0.001 | |||||
| 7 | 0.01 | 1,023 | 1,023–0.01 | ||||
| 8 | 1,073 | 1,073–0.01 | |||||
| 9 | 1,123 | 1,123–0.01 | |||||
| 10 | 1,173 | 1,173–0.01 | |||||
| 11 | 1,223 | 1,223–0.01 | |||||
| 12 | 1,273 | 1,273–0.01 | |||||
| 13 | 0.1 | 1,023 | 1,023–0.1 | ||||
| 14 | 1,073 | 1,073–0.1 | |||||
| 15 | 1,123 | 1,123–0.1 | |||||
| 16 | 1,173 | 1,173–0.1 | |||||
| 17 | 1,223 | 1,223–0.1 | |||||
| 18 | 1,273 | 1,273–0.1 | |||||
| 19 | 1 | 1,023 | 1,023–1 | ||||
| 20 | 1,073 | 1,073–1 | |||||
| 21 | 1,123 | 1,123–1 | |||||
| 22 | 1,173 | 1,173–1 | |||||
| 23 | 1223 | 1,223–1 | |||||
| 24 | 1273 | 1,273–1 | |||||
| 25 | 10 | 1023 | 1,023–10 | ||||
| 26 | 1073 | 1,073–10 | |||||
| 27 | 1123 | 1,123–10 | |||||
| 28 | 1173 | 1,173–10 | |||||
| 29 | 1223 | 1,223–10 | |||||
| 30 | 1273 | 1,273–10 | |||||
| … | |||||||
| 240 | 0.8 | 10 | 1273 | 0.8–10 | 1,273–10 | 0.8–1273 | |
Determination of the contribution functions fj
The mean flow stress values
In this research, the values of strain are selected in the range of 0.1–0.8 at an interval of 0.1, the strain rates are chosen as 0.001, 0.01, 0.1, 1 and 10 s−1, and temperatures are selected as 1,023–1,273 K at an interval of 50 K. Therefore, the values of
Figure 4 illustrates the relationship between
Relationship between
The contribution function
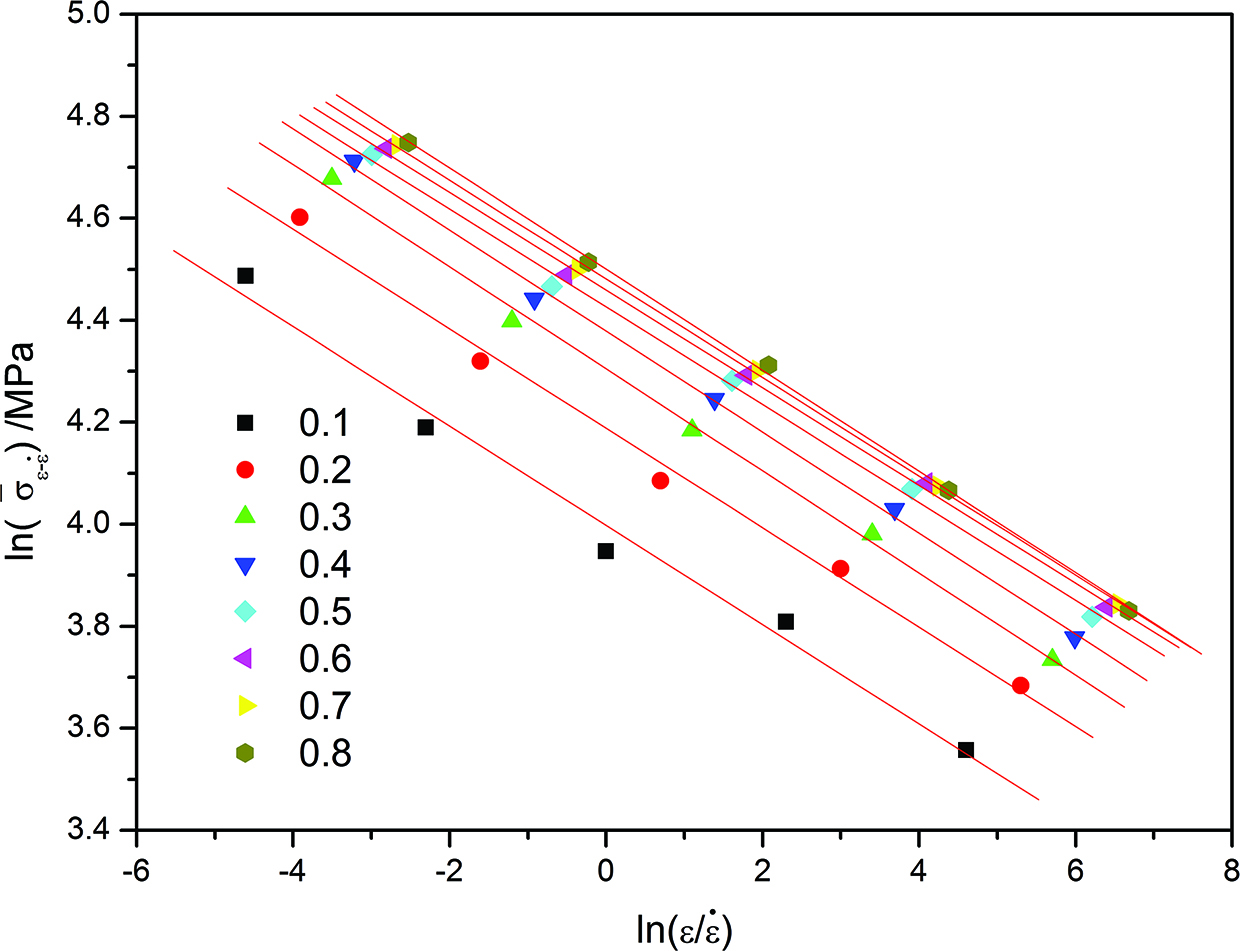
By taking the average flow stress at different strain rates (
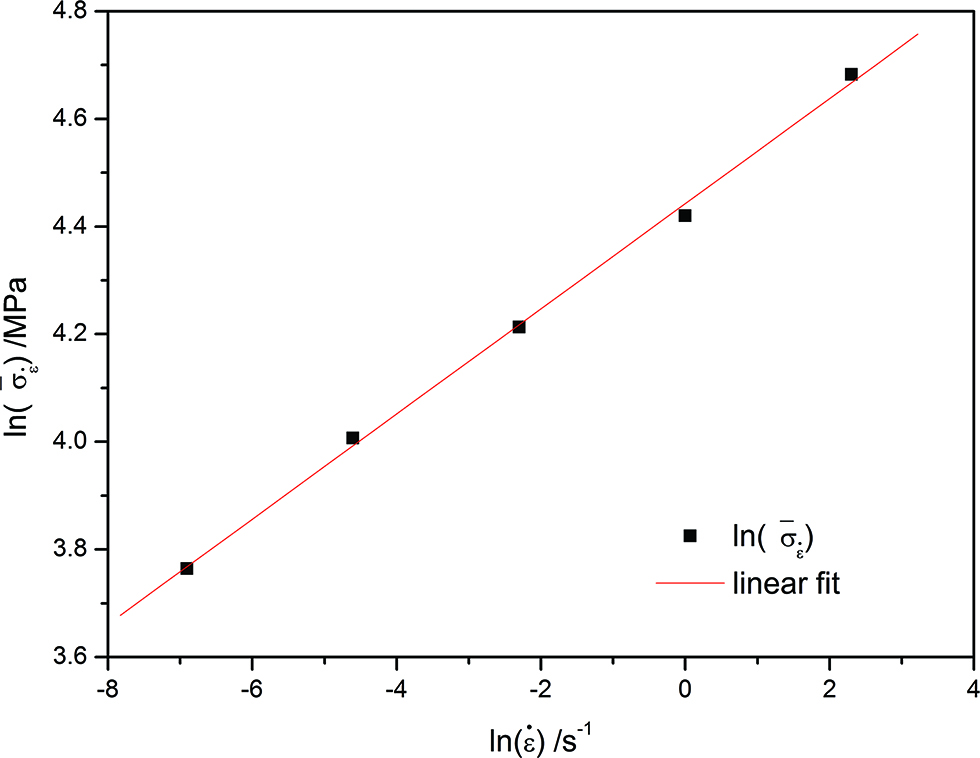
Relationship between
Thereafter, by taking exponentiation of both sides of eq. (14) and neglecting the constant coefficient, the contribution function
It can be found from eq. (15) that the mean value of strain rate sensitivity exponent m for BFe10-1-2 cupronickel alloy is 0.09768. Taking slopes between the adjacent two points of strain rate in Figure 6, the relationship between m and strain rate can be obtained, as illustrated in Figure 7. It should be noted that the maximum value of m is only 0.114. eq. (16) gives a simple function with a certain physical meaning [18]:
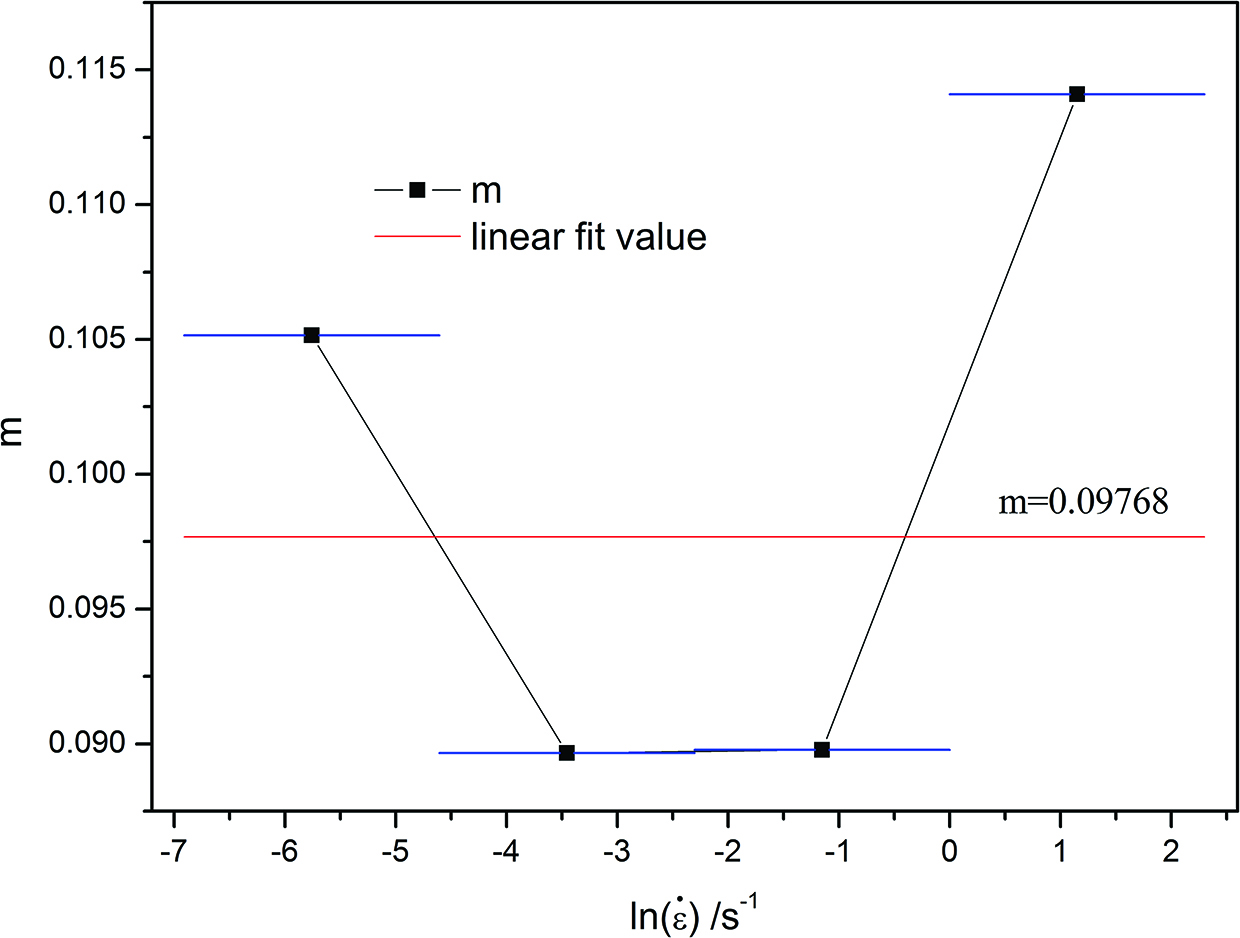
Relationship between m and
where A is a constant term, Qdm represents the activation energy for dislocation directional migration, and R is the universal gas constant (8.314 J·mol−1·K−1). It can be found from eq. (16) that m value maintains at a steady value of 0.2 under steady-state deformation undergoing DRV, and this value is in good agreement with the test results AZ31 [19] alloy (about 0.19). The values of m keep at a higher level over 0.3 during hot processing with DRX softening mechanism [18]. Therefore, the flow softening of BFe10-1-2 cupronickel alloy is led mainly by DRV and not by DRX. Figure 8 gives the metallographic structure of BFe10-1-2 alloy under the deformation condition of 1,023 K in 0.01 s−1 and 1,223 K in 0.1 s−1. It can be seen from figures that the grains after deformation tend to be elongated perpendicular to the compression direction, but no DRX grains can be observed.
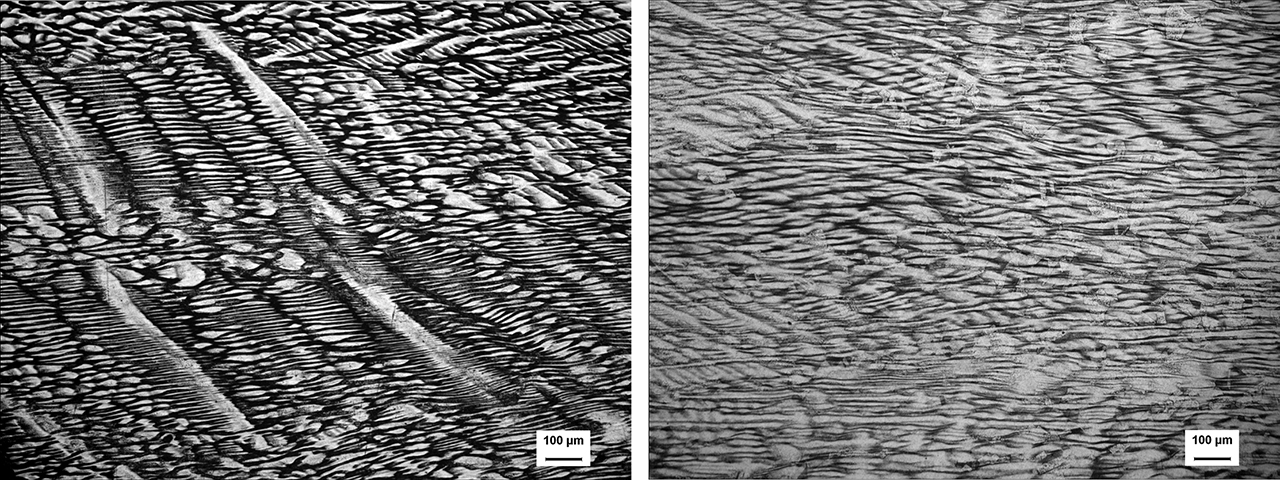
Metallographic structure of BFe10-1-2 alloy under the deformation condition of (a) 1,023 K 0.01 s−1, (b) 1,223 K 0.1 s−1.
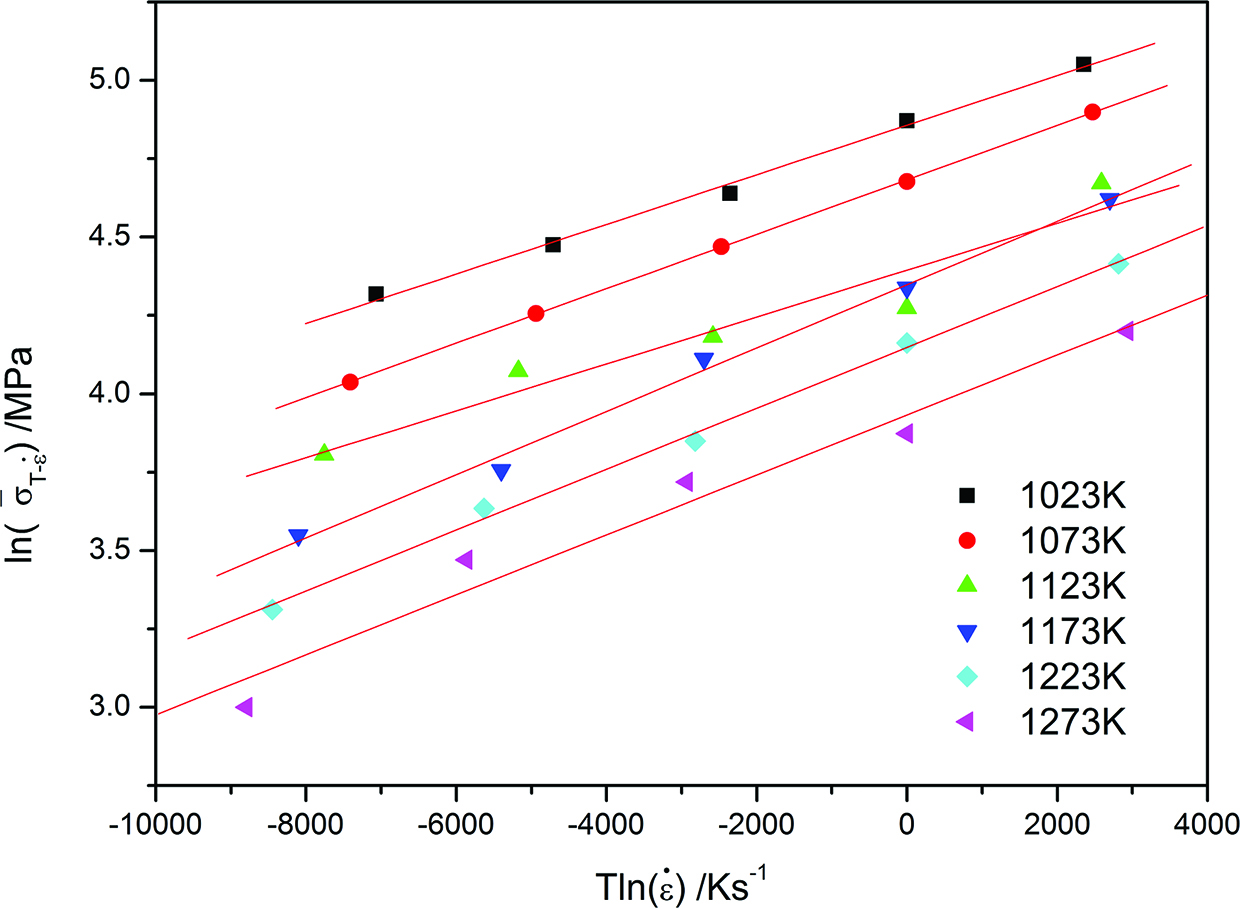
By taking the average flow stress at different temperatures (
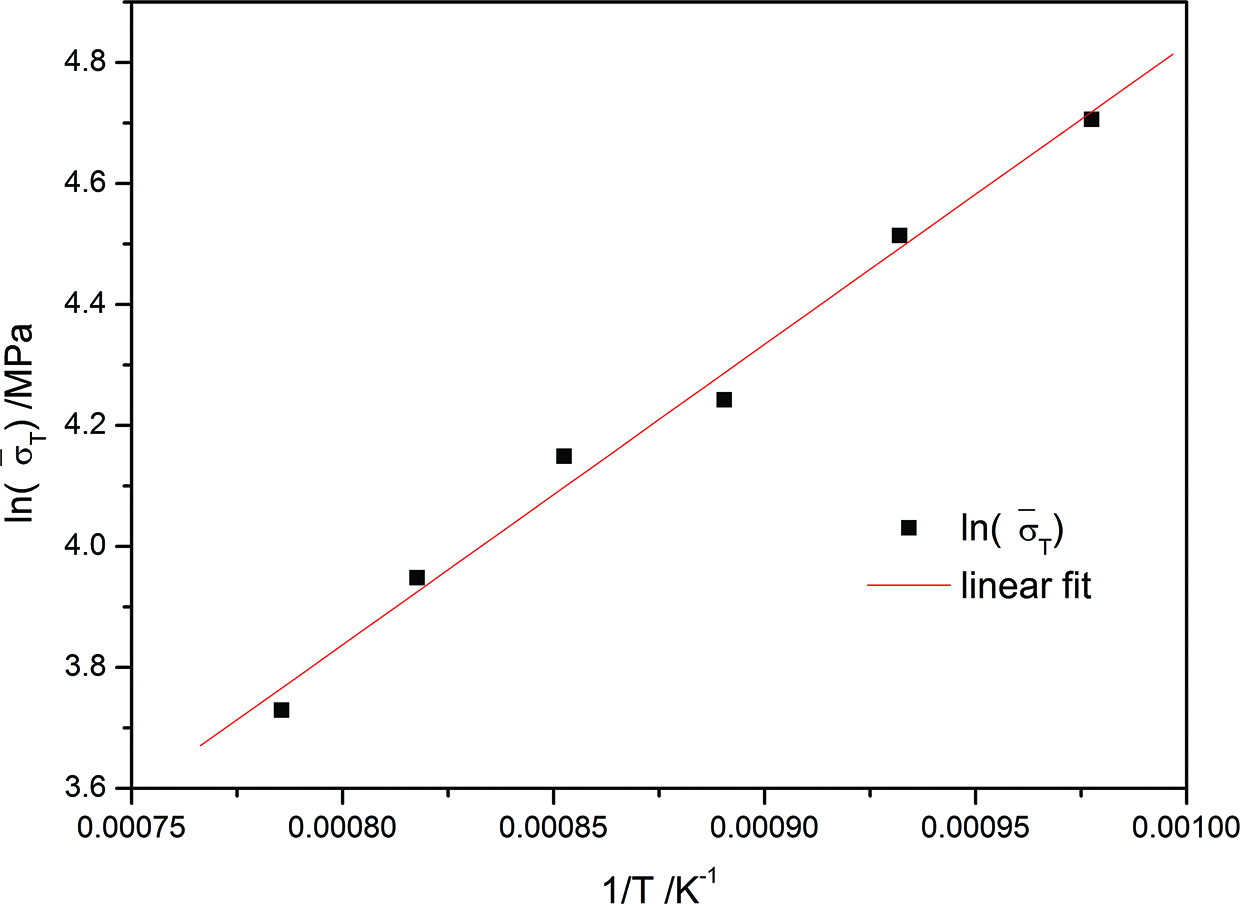
Relationship between
Then taking exponentiation of both sides of eq. (17) and neglecting the constant coefficient, the contribution function
And
Therefore, it can be found from eq. (18) that the average apparent activation energy Q for BFe10-1-2 cupronickel alloy is 422.58 kJ·mol−1, which is very close to the value of authors’ previous study (425.299 kJ·mol−1) [3].
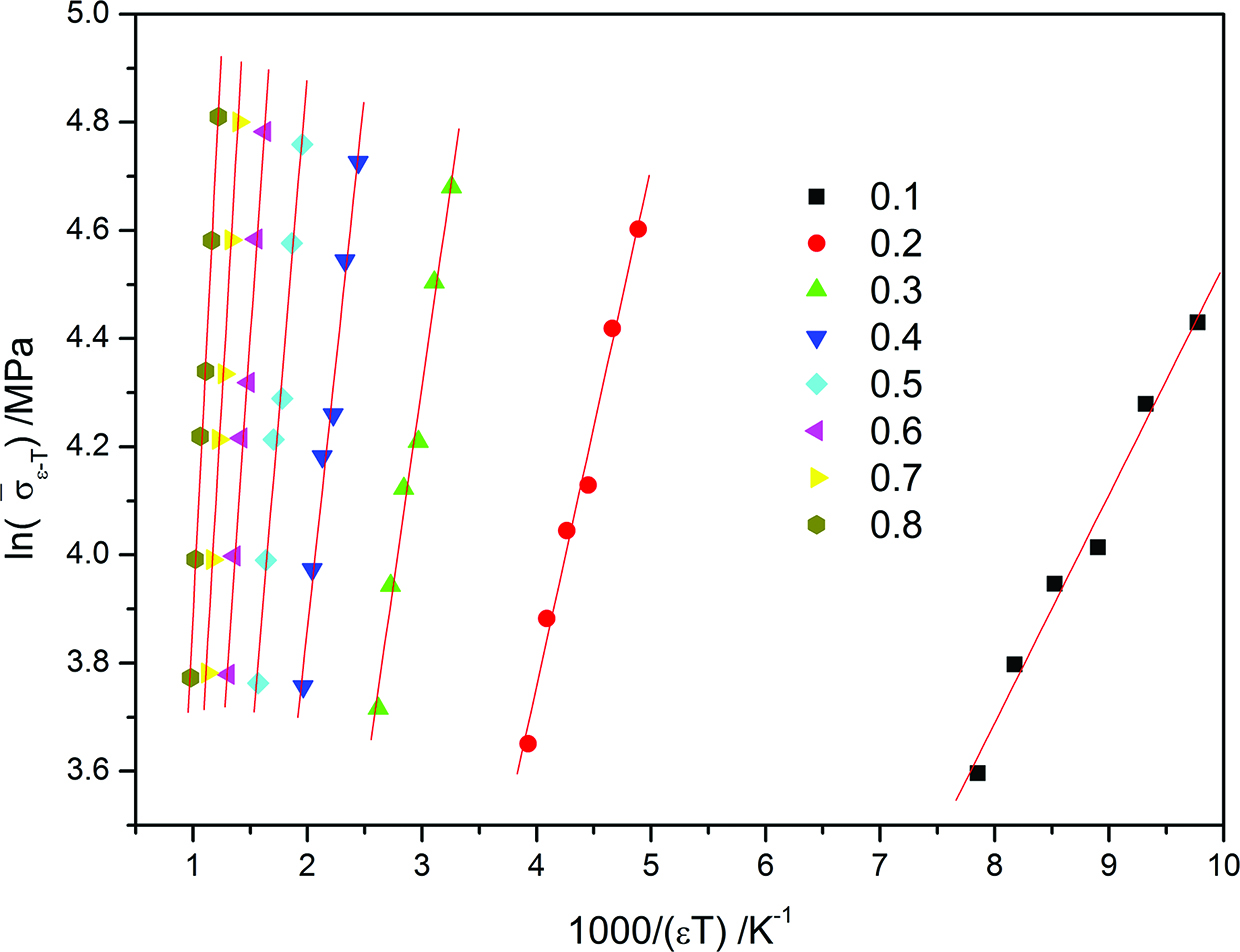
The relationship between the average flow stress
Relationship between
The relationship between
Relationship between
The relationship between
Relationship between
Then, it can be derived from eq. (18) that the variation of apparent activation energy Q with true strain as follows:
Table 2 gives the values of Q at different strain. It can be found that the values of Q obtained from eq. (22) and Ref [4] have little variation.
Determination of the converged weights ωj
In order to acquire the converged weights ωj, the logarithm on both sides of eq. (10) is taken:
Multivariate regression (MR) analysis is a highly flexible system for examining the relationship between the collection of independent variable and the dependent variable. Therefore, least-squares regression with the independent variables (
The values of converged weights obtained by multivariate linear regression.
| f0 | ω1 | ω2 | ω3 | ω4 | ω5 | ω6 |
|---|---|---|---|---|---|---|
| 0.3734 | 0.310 | −0.894 | 0.937 | −0.162 | 2.016 | 0.152 |
Therefore, the developed constitutive model based on DMNR for BFe10-1-2 cupronickel alloy during elevated temperature deformation can be summarized as:
Verification of constitutive equation
The comparisons between experimental flow stresses and predicted values by the developed constitutive equation are illustrated in Figure 13. It can be seen that the predicted flow stress data from the constitutive equation can track the experimental data of BFe10-1-2 cupronickel alloy throughout the entire temperature and strain rate range. Only under some deformation conditions (i. e. 1,123 K in 1 s−1, and 1,173 K in 10 s−1), an obvious variation between experimental and computed flow stress data can be observed.
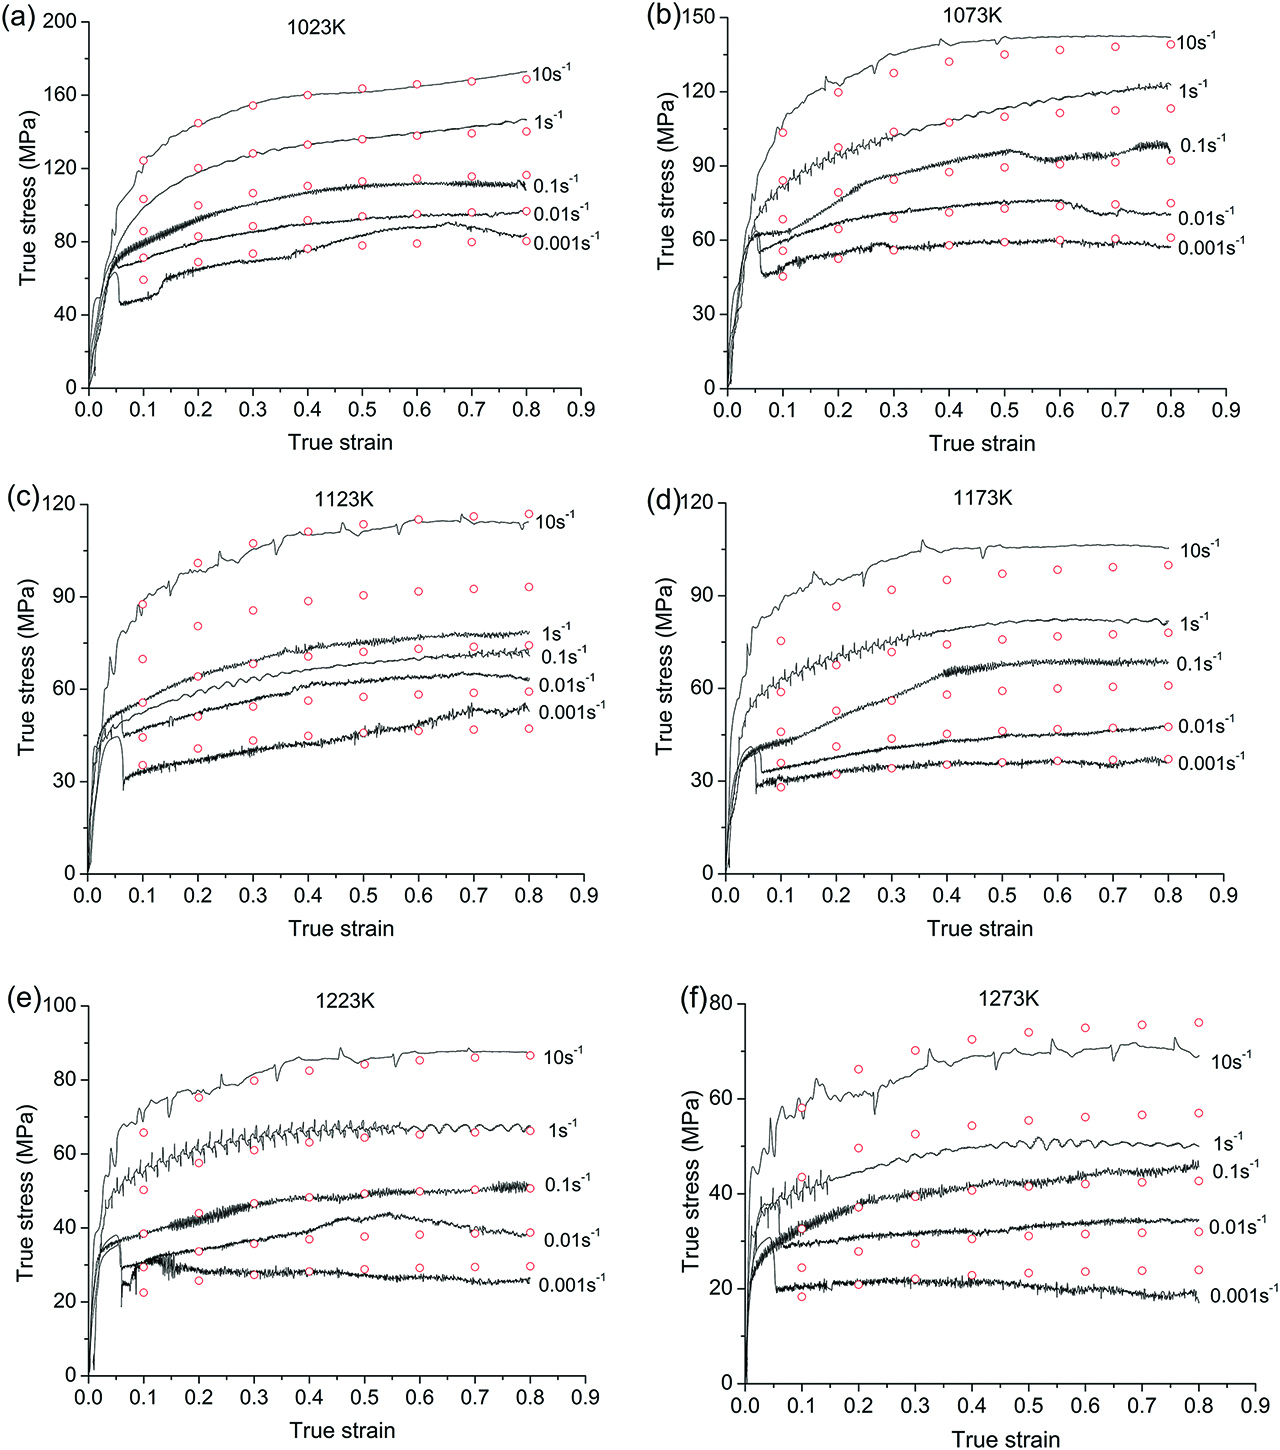
Comparison between the experimental and predicted flow stress at the temperature (a) 1,023 K, (b) 1,073 K, (c) 1,123 K, (d) 1,173 K, (e) 1,223 K and (f) 1,273 K.
Correlation coefficient R and average absolute relative error AARE are introduced to quantify the predictability of the developed constitutive equation. These are expressed as [20]:
where E is the experimental flow stress and P is the predicted flow stress calculated from the developed constitutive equation considering strain compensation.
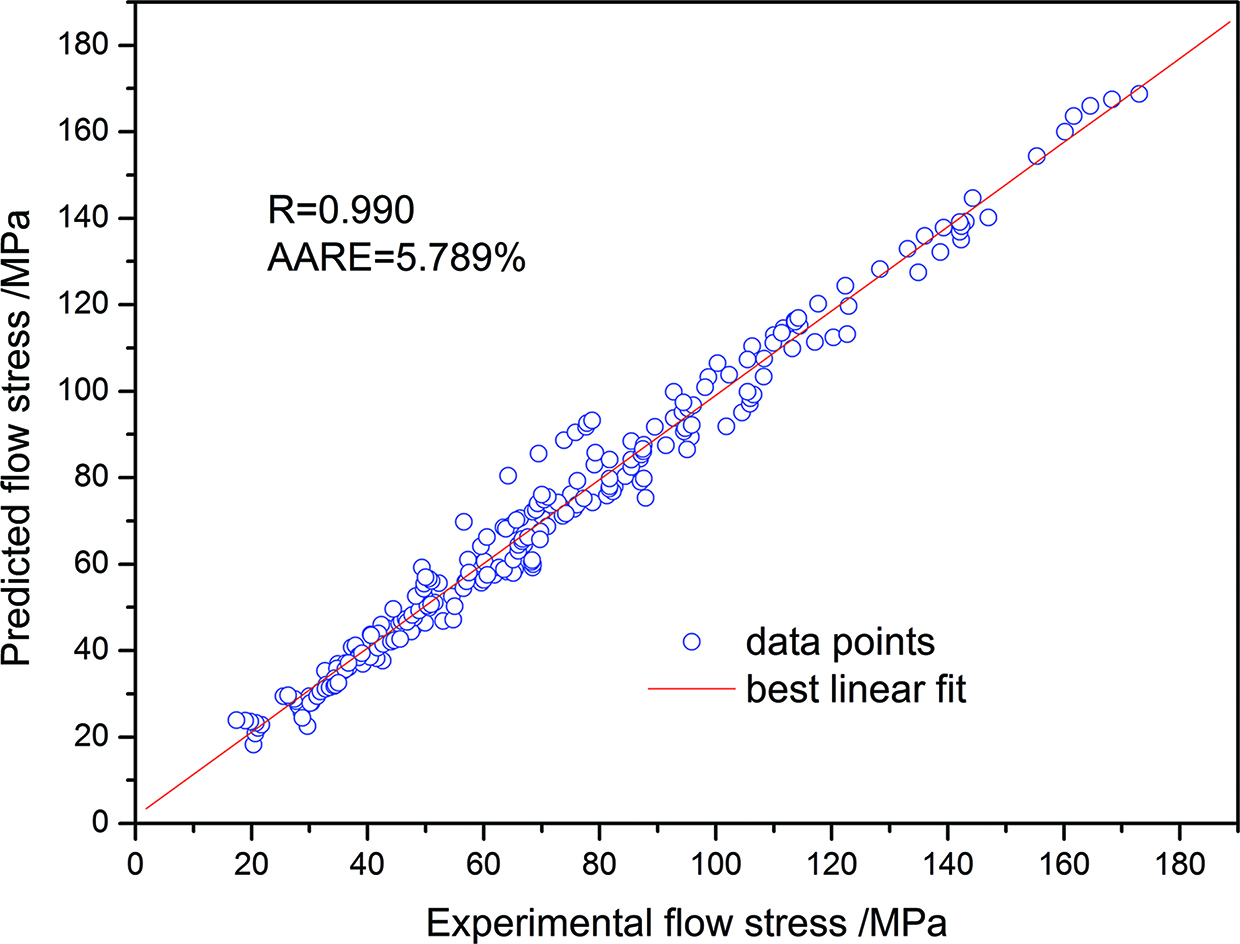
Correlation between the experimental and predicted flow stress data from the developed constitutive equation.
The variation between AARE and R with strain, strain rate and deformation temperature is given in Figure 15. It can be seen from Figure 15(a) there is a slight variation in R with strain (from 0.981 to 0.992). The maximum value of AARE (7.696 %) and minimum value of R (0.981) are all at the strain of 0.1. The AARE values at other strains are lower than 7 %, and the R values at other strains are all higher than 0.989. In Figure 15(b), it can be seen that the maximum value AARE is about 7.735 % (at the strain rate of 1 s−1), with the minimum value of R (0.971). In Figure 15(c), the maximum value of AARE and minimum value of R are all at the temperature of 1,123 K, whose values are 8.306 % and 0.971, respectively.
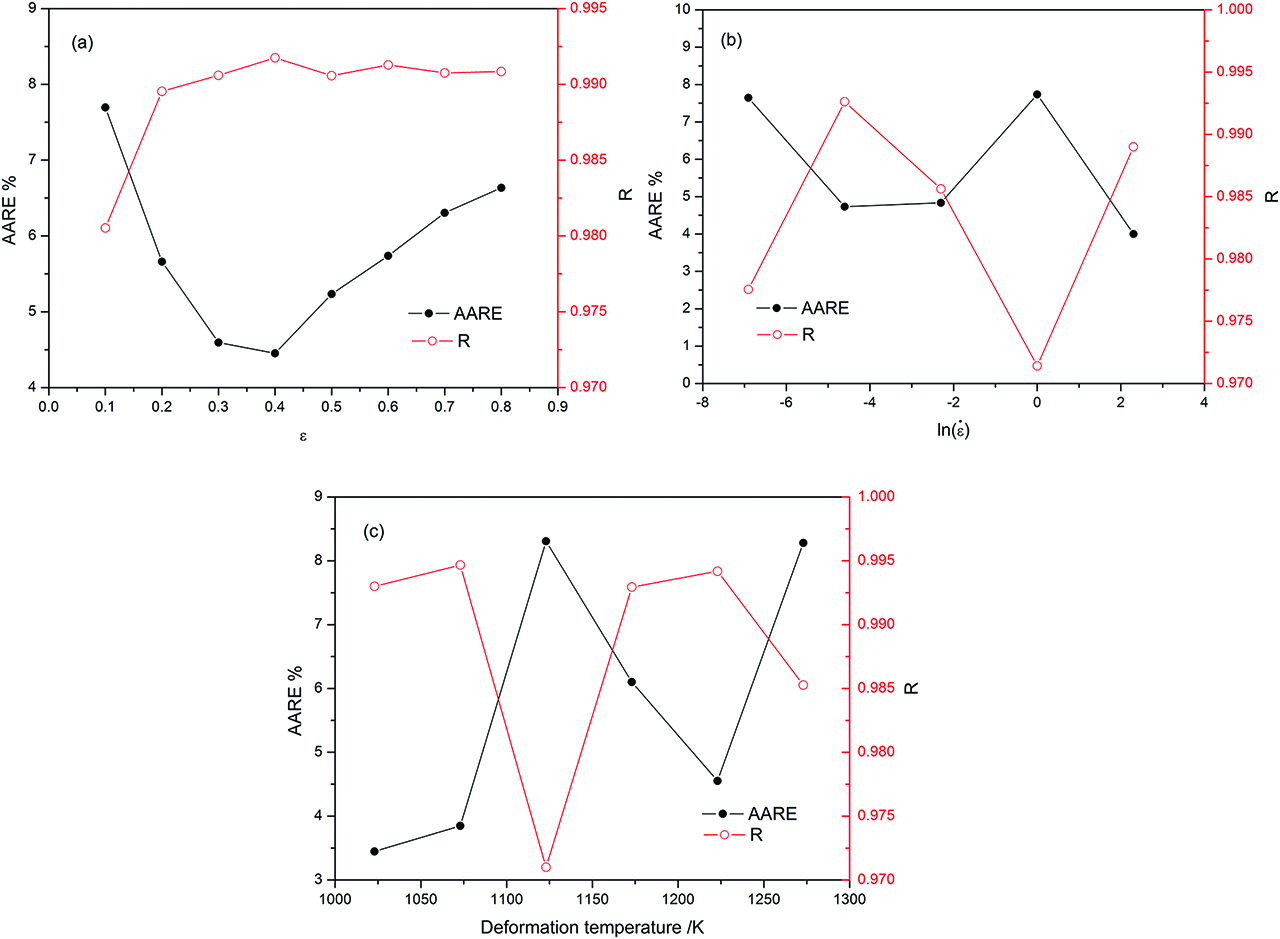
Variation between AARE and R with (a) strain, (b) strain rate and (c) deformation temperature.
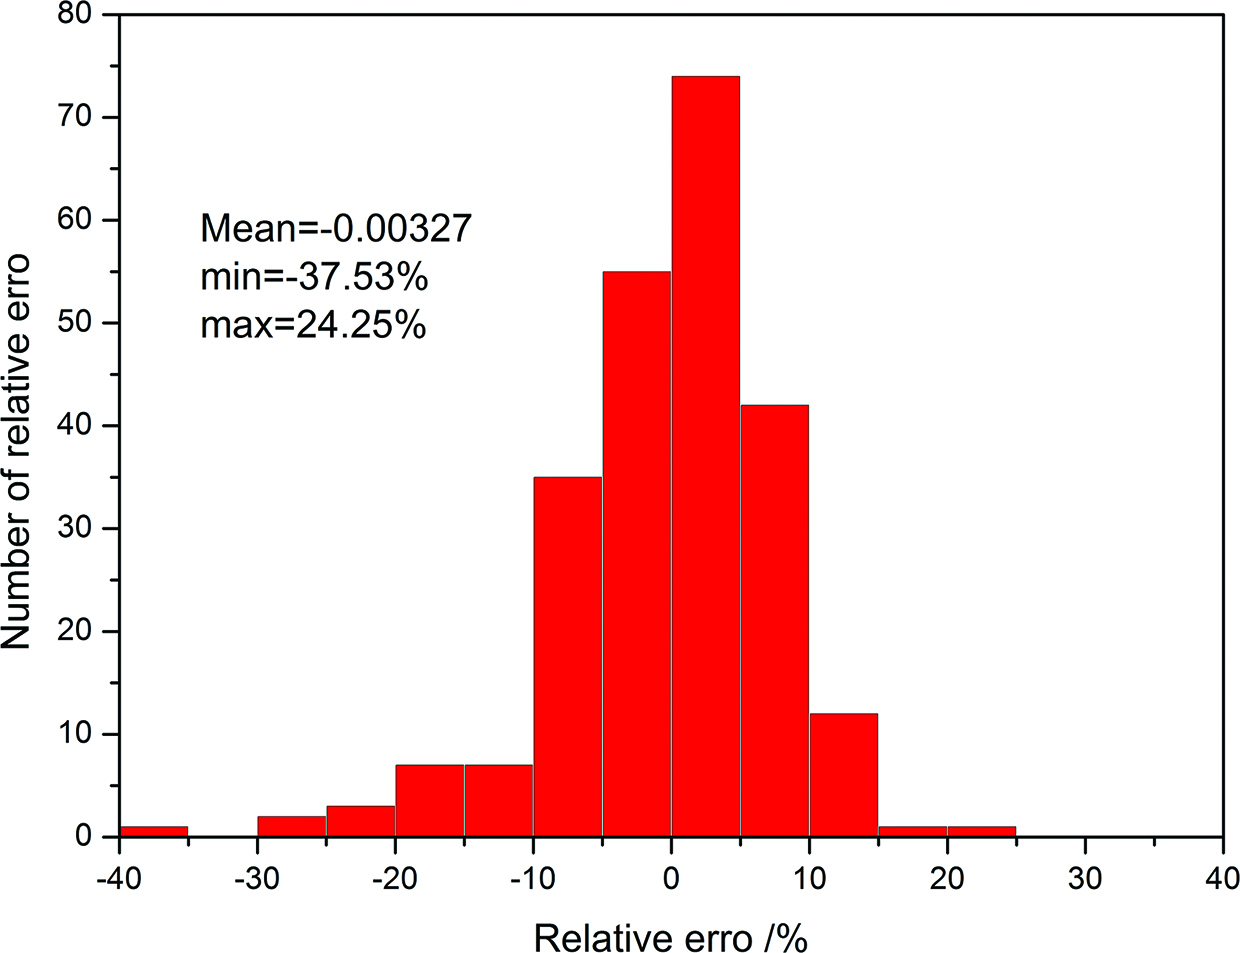
Moreover, the performance of constitutive equation based on DMNR is further investigated by statistical analysis of the relative error. The prediction is compared with the corresponding experimental data, and subsequently the relative error is expressed as [22]:
The results of relative error are represented graphically as a typical number versus error plot, as shown in Figure 16. As can be seen from Figure 16, the relative errors exhibit Gaussian distribution. The relative errors vary from −37.53 % to 24.25 %, and the mean value of the relative errors is only −0.00327. Therefore, on the basis of the analysis of R, AARE and relative error, the developed constitutive model based on DMNR can predict the elevated temperature flow behavior of BFe10-1-2 cupronickel alloy accurately.
Statistical analysis of the relative error.
Comparison with other constitutive models
The predictability of the proposed constitutive equation is further evaluated by comparing with the modified Johnson Cook (M-JC) and the modified Zerilli-Armstrong (M-ZA) models. The M-JC model is expressed as follows [23]:
where
Parameters of the M-JC model for BFe10-1-2 cupronickel alloy.
| Parameter | A1 | B1 | B2 | C1 | ||
|---|---|---|---|---|---|---|
| Value | 88.604 | 149.419 | −99.759 | 0.06877 | −0.00364 | 0.000178 |
The M-ZA model is expressed as follows [25]:
where
Parameters of the M-ZA model for BFe10-1-2 cupronickel alloy.
| Parameter | C1 | C1 | C2 | C4 | C5 | C6 | n |
|---|---|---|---|---|---|---|---|
| Value | 67.5 | 88.154 | 0.00315 | 0.00117 | 0.0768±0.0003 | 0.000189 ±0.000002 | 0.4836 |
The comparison between experimental flow stress and predicted data by the M-JC model are shown in Figure 17. The values of R for the M-JC and M-ZA models are 0.985 and 0.988 [1], respectively, which are all lower than that of the DMNR model. Meanwhile, the values of AARE the M-JC and M-ZA models are 6.57 % and 6.403 % [1] respectively, which are all higher than that of the DMNR model.
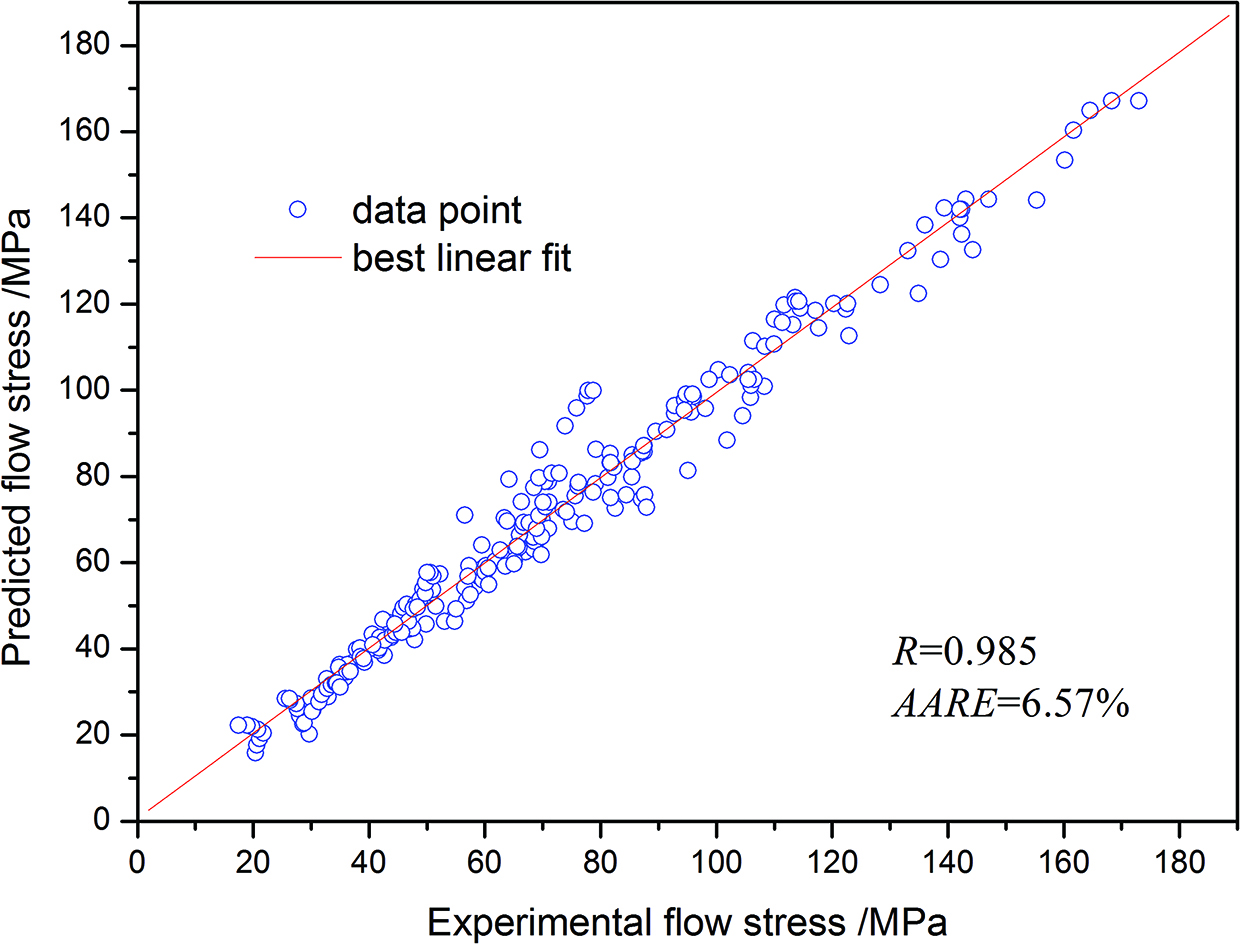
Correlation between the experimental and predicted flow stress data from the M-JC constitutive equation.
Conclusions
Isothermal compression tests were employed to investigate the elevated temperature flow behavior of BFe10-1-2 cupronickel alloy. Based on this study, following are the conclusions:
A constitutive equation based on DMNR was used to predicting the elevated temperature flow behavior of cupronickel alloy by taking into account the independent factors of processing parameters and the interaction factors between them.
The calculated results showed that the average strain rate sensitivity exponent m and average deformation activation energy Q of BFe10-1-2 cupronickel alloy are 0.09768 and 422.58 kJ mol−1, respectively. And the variation law of Q with strain was also obtained.
The accuracy of the developed constitutive equation was quantified in terms of R, AARE and relative errors. Meanwhile, the predictability of the modified parallel constitutive equation was comparable to that of the M-JC and M-ZA constitutive models. The results showed that the modified constitutive equation based on DMNR gave an accurate and precise estimate of the flow stress of BFe10-1-2 cupronickel alloy.
Acknowledgements
The authors gratefully acknowledge the financial support received from National Natural Science Foundation of China (U1760201), National Natural Science Foundation of China (51574192), Planned Scientific Research Project of Education Department of Shaanxi Provincial Government (15JS056), Pre-research Foundation of Jinchuan company-Xi’an University of Architecture and Technology (YY1501), Project of International Cooperation and Exchange of Shaanxi Provincial (2016KW-054)
References
[1] J. Cai, Y. Lei, K.S. Wang, X.L. Zhang, C.P. Miao and W.B. Li, J. Mater. Eng. Peform., 25 (2016) 1952–1963.10.1007/s11665-016-2005-8Search in Google Scholar
[2] Z.M. Yan, X.T. Li, K. Qi, Z.Q. Cao, X.L. Zhang and T.J. Li, Mater. Des., 30 (2011) 2072–2076.10.1016/j.matdes.2008.08.047Search in Google Scholar
[3] J. Cai, K.S. Wang, C.P. Miao, W.B. Li, W. Wang and J. Yang, Mater. Des., 65 (2015) 272–279.10.1016/j.matdes.2014.09.028Search in Google Scholar
[4] C.L. Gan, X.F. Liu, H.Y. Huang and J.X. Xie, Mater. Sci. Eng. A, 579 (2013) 202–208.10.1016/j.msea.2013.05.029Search in Google Scholar
[5] J. Mei, X.H. Liu, Y.B. Jiang, S. Chen and J.X. Xie, Int. J. Min. Met. Mater., 20 (2013) 748–758.10.1007/s12613-013-0793-5Search in Google Scholar
[6] A. He, G.L. Xie, H.L. Zhang and X.T. Wang, Mater. Des., 2014, 56 (2014) 122–127.10.1016/j.matdes.2013.10.080Search in Google Scholar
[7] K.P. Rao, Y.V.R.K. Prasad and K. Suresh, Mater. Des., 32 (2011) 2545–2553.10.1016/j.matdes.2011.01.050Search in Google Scholar
[8] Y.C. Lin and X.M. Chen, Mater. Des., 32 (2011) 1733–1759.10.1016/j.matdes.2010.11.048Search in Google Scholar
[9] W.S. Lee and C.Y. Liu, Metall. Mater. Trans. A., 2005, 36 (2005) 3175–3185.10.1007/s11661-005-0088-1Search in Google Scholar
[10] Y.H. Xiao and C. Guo, Mater. Sci. Eng. A, 528 (2011) 5081–5087.10.1016/j.msea.2011.03.050Search in Google Scholar
[11] C.H. Liao, H.Y. Wu, S. Lee, F.J. Zhu, H.C. Liu and C.T. Wu, Mater. Sci. Eng. A, 565 (2013) 1–8.10.1016/j.msea.2012.12.025Search in Google Scholar
[12] J.C. Shao, B.L. Xiao, Q.Z. Wang, Z.Y. Ma, Y. Liu and K. Yang, Mater. Sci. Eng. A, 527 (2010) 7865–7872.10.1016/j.msea.2010.08.080Search in Google Scholar
[13] M.L. Xiao, F.G. Li, W. Zhao and G.L. Yang, Mater. Des., 35 (2012) 184–193.10.1016/j.matdes.2011.09.044Search in Google Scholar
[14] Z.W. Yuan, F.G. Li, H.J. Qiao, M.L. Xiao, J. Cai and J. Li, Mater. Sci. Eng. A, 578 (2013) 260–270.10.1016/j.msea.2013.04.091Search in Google Scholar
[15] M.Z. Hussain, F.G. Li, J. Wang, Z.W. Yuan, P. Li, T. Wu and J. Mater, Eng. Peform., 24 (2015) 2744–2756.Search in Google Scholar
[16] P. Li, F.G. Li, J. Cao, X.K. Ma and J.H. Li, Trans. Nonferrous Met. Soc. China, 26 (2016) 1079–1095.10.1016/S1003-6326(16)64205-XSearch in Google Scholar
[17] J. Cai, K.S. Wang, J.M. Shi, W. Wang, Y.Y. Liu and H. Temp, Mater. Proc., 37 (2018) 75–87.10.1007/s00339-017-1488-ySearch in Google Scholar
[18] H.Q. Liang, Y. Nan, Y.Q. Ning, H. Li, J.L. Zhang, Z.F. Shi and H.Z. Guo, J. Alloy. Compd., 632 (2015) 478–485.10.1016/j.jallcom.2014.12.270Search in Google Scholar
[19] A. Galiyev, R. Kaibyshev and G. Gottstein, Acta. Mater., 49 (2001) 1199–1207.10.1016/S1359-6454(01)00020-9Search in Google Scholar
[20] S. Mandal, V. Rakesh, P.V. Sivaprasad, S. Venugopal and K.V. Kasiviswanathan, Mater. Sci. Eng. A, 500 (2009) 114–121.10.1016/j.msea.2008.09.019Search in Google Scholar
[21] D. Samantaray, S. Mandal and A.K. Bhaduri, Mater. Des., 31 (2010) 981–984.10.1016/j.matdes.2009.08.012Search in Google Scholar
[22] H.Y. Li, X.F. Wang, D.D. Wei, J.D. Hu and Y.H. Li, Mater. Sci. Eng. A, 536 (2012) 216–222.10.1016/j.msea.2011.12.108Search in Google Scholar
[23] Y.C. Lin, X.M. Chen and G. Liu, Mat. Sci. Eng. A, 527 (2010) 6980–6986.10.1016/j.msea.2010.07.061Search in Google Scholar
[24] Q. Zhang, Q. Cao and X. Zhang, J. Mater. Eng. Peform., 23 (2014) 4336–4341.10.1007/s11665-014-1236-9Search in Google Scholar
[25] D. Samantaray, S. Mandal, U. Borah, A.K. Bhaduri and P.V. Sivaprasad1, Mat. Sci. Eng. A, 526 (2009) 1–6.10.1016/j.msea.2009.08.009Search in Google Scholar
© 2019 Walter de Gruyter GmbH, Berlin/Boston
This work is licensed under the Creative Commons Attribution 4.0 Public License.
Articles in the same Issue
- Frontmatter
- Review Article
- Research on the Influence of Furnace Structure on Copper Cooling Stave Life
- Influence of High Temperature Oxidation on Hydrogen Absorption and Degradation of Zircaloy-2 and Zr 700 Alloys
- Correlation between Travel Speed, Microstructure, Mechanical Properties and Wear Characteristics of Ni-Based Hardfaced Deposits over 316LN Austenitic Stainless Steel
- Factors Influencing Gas Generation Behaviours of Lump Coal Used in COREX Gasifier
- Experiment Research on Pulverized Coal Combustion in the Tuyere of Oxygen Blast Furnace
- Phosphate Capacities of CaO–FeO–SiO2–Al2O3/Na2O/TiO2 Slags
- Microstructure and Interface Bonding Strength of WC-10Ni/NiCrBSi Composite Coating by Vacuum Brazing
- Refill Friction Stir Spot Welding of Dissimilar 6061/7075 Aluminum Alloy
- Solvothermal Synthesis and Magnetic Properties of Monodisperse Ni0.5Zn0.5Fe2O4 Hollow Nanospheres
- On the Capability of Logarithmic-Power Model for Prediction of Hot Deformation Behavior of Alloy 800H at High Strain Rates
- 3D Heat Conductivity Model of Mold Based on Node Temperature Inheritance
- 3D Microstructure and Micromechanical Properties of Minerals in Vanadium-Titanium Sinter
- Effect of Martensite Structure and Carbide Precipitates on Mechanical Properties of Cr-Mo Alloy Steel with Different Cooling Rate
- The Interaction between Erosion Particle and Gas Stream in High Temperature Gas Burner Rig for Thermal Barrier Coatings
- Permittivity Study of a CuCl Residue at 13–450 °C and Elucidation of the Microwave Intensification Mechanism for Its Dechlorination
- Study on Carbothermal Reduction of Titania in Molten Iron
- The Sequence of the Phase Growth during Diffusion in Ti-Based Systems
- Growth Kinetics of CoB–Co2B Layers Using the Powder-Pack Boriding Process Assisted by a Direct Current Field
- High-Temperature Flow Behaviour and Constitutive Equations for a TC17 Titanium Alloy
- Research on Three-Roll Screw Rolling Process for Ti6Al4V Titanium Alloy Bar
- Continuous Cooling Transformation of Undeformed and Deformed High Strength Crack-Arrest Steel Plates for Large Container Ships
- Formation Mechanism and Influence Factors of the Sticker between Solidified Shell and Mold in Continuous Casting of Steel
- Casting Defects in Transition Layer of Cu/Al Composite Castings Prepared Using Pouring Aluminum Method and Their Formation Mechanism
- Effect of Current on Segregation and Inclusions Characteristics of Dual Alloy Ingot Processed by Electroslag Remelting
- Investigation of Growth Kinetics of Fe2B Layers on AISI 1518 Steel by the Integral Method
- Microstructural Evolution and Phase Transformation on the X-Y Surface of Inconel 718 Ni-Based Alloys Fabricated by Selective Laser Melting under Different Heat Treatment
- Characterization of Mn-Doped Co3O4 Thin Films Prepared by Sol Gel-Based Dip-Coating Process
- Deposition Characteristics of Multitrack Overlayby Plasma Transferred Arc Welding on SS316Lwith Co-Cr Based Alloy – Influence ofProcess Parameters
- Elastic Moduli and Elastic Constants of Alloy AuCuSi With FCC Structure Under Pressure
- Effect of Cl on Softening and Melting Behaviors of BF Burden
- Effect of MgO Injection on Smelting in a Blast Furnace
- Structural Characteristics and Hydration Kinetics of Oxidized Steel Slag in a CaO-FeO-SiO2-MgO System
- Optimization of Microwave-Assisted Oxidation Roasting of Oxide–Sulphide Zinc Ore with Addition of Manganese Dioxide Using Response Surface Methodology
- Hydraulic Study of Bubble Migration in Liquid Titanium Alloy Melt during Vertical Centrifugal Casting Process
- Investigation on Double Wire Metal Inert Gas Welding of A7N01-T4 Aluminum Alloy in High-Speed Welding
- Oxidation Behaviour of Welded ASTM-SA210 GrA1 Boiler Tube Steels under Cyclic Conditions at 900°C in Air
- Study on the Evolution of Damage Degradation at Different Temperatures and Strain Rates for Ti-6Al-4V Alloy
- Pack-Boriding of Pure Iron with Powder Mixtures Containing ZrB2
- Evolution of Interfacial Features of MnO-SiO2 Type Inclusions/Steel Matrix during Isothermal Heating at Low Temperatures
- Effect of MgO/Al2O3 Ratio on Viscosity of Blast Furnace Primary Slag
- The Microstructure and Property of the Heat Affected zone in C-Mn Steel Treated by Rare Earth
- Microwave-Assisted Molten-Salt Facile Synthesis of Chromium Carbide (Cr3C2) Coatings on the Diamond Particles
- Effects of B on the Hot Ductility of Fe-36Ni Invar Alloy
- Impurity Distribution after Solidification of Hypereutectic Al-Si Melts and Eutectic Al-Si Melt
- Induced Electro-Deposition of High Melting-Point Phases on MgO–C Refractory in CaO–Al2O3–SiO2 – (MgO) Slag at 1773 K
- Microstructure and Mechanical Properties of 14Cr-ODS Steels with Zr Addition
- A Review of Boron-Rich Silicon Borides Basedon Thermodynamic Stability and Transport Properties of High-Temperature Thermoelectric Materials
- Siliceous Manganese Ore from Eastern India:A Potential Resource for Ferrosilicon-Manganese Production
- A Strain-Compensated Constitutive Model for Describing the Hot Compressive Deformation Behaviors of an Aged Inconel 718 Superalloy
- Surface Alloys of 0.45 C Carbon Steel Produced by High Current Pulsed Electron Beam
- Deformation Behavior and Processing Map during Isothermal Hot Compression of 49MnVS3 Non-Quenched and Tempered Steel
- A Constitutive Equation for Predicting Elevated Temperature Flow Behavior of BFe10-1-2 Cupronickel Alloy through Double Multiple Nonlinear Regression
- Oxidation Behavior of Ferritic Steel T22 Exposed to Supercritical Water
- A Multi Scale Strategy for Simulation of Microstructural Evolutions in Friction Stir Welding of Duplex Titanium Alloy
- Partition Behavior of Alloying Elements in Nickel-Based Alloys and Their Activity Interaction Parameters and Infinite Dilution Activity Coefficients
- Influence of Heating on Tensile Physical-Mechanical Properties of Granite
- Comparison of Al-Zn-Mg Alloy P-MIG Welded Joints Filled with Different Wires
- Microstructure and Mechanical Properties of Thick Plate Friction Stir Welds for 6082-T6 Aluminum Alloy
- Research Article
- Kinetics of oxide scale growth on a (Ti, Mo)5Si3 based oxidation resistant Mo-Ti-Si alloy at 900-1300∘C
- Calorimetric study on Bi-Cu-Sn alloys
- Mineralogical Phase of Slag and Its Effect on Dephosphorization during Converter Steelmaking Using Slag-Remaining Technology
- Controllability of joint integrity and mechanical properties of friction stir welded 6061-T6 aluminum and AZ31B magnesium alloys based on stationary shoulder
- Cellular Automaton Modeling of Phase Transformation of U-Nb Alloys during Solidification and Consequent Cooling Process
- The effect of MgTiO3Adding on Inclusion Characteristics
- Cutting performance of a functionally graded cemented carbide tool prepared by microwave heating and nitriding sintering
- Creep behaviour and life assessment of a cast nickel – base superalloy MAR – M247
- Failure mechanism and acoustic emission signal characteristics of coatings under the condition of impact indentation
- Reducing Surface Cracks and Improving Cleanliness of H-Beam Blanks in Continuous Casting — Improving continuous casting of H-beam blanks
- Rhodium influence on the microstructure and oxidation behaviour of aluminide coatings deposited on pure nickel and nickel based superalloy
- The effect of Nb content on precipitates, microstructure and texture of grain oriented silicon steel
- Effect of Arc Power on the Wear and High-temperature Oxidation Resistances of Plasma-Sprayed Fe-based Amorphous Coatings
- Short Communication
- Novel Combined Feeding Approach to Produce Quality Al6061 Composites for Heat Sinks
- Research Article
- Micromorphology change and microstructure of Cu-P based amorphous filler during heating process
- Controlling residual stress and distortion of friction stir welding joint by external stationary shoulder
- Research on the ingot shrinkage in the electroslag remelting withdrawal process for 9Cr3Mo roller
- Production of Mo2NiB2 Based Hard Alloys by Self-Propagating High-Temperature Synthesis
- The Morphology Analysis of Plasma-Sprayed Cast Iron Splats at Different Substrate Temperatures via Fractal Dimension and Circularity Methods
- A Comparative Study on Johnson–Cook, Modified Johnson–Cook, Modified Zerilli–Armstrong and Arrhenius-Type Constitutive Models to Predict Hot Deformation Behavior of TA2
- Dynamic absorption efficiency of paracetamol powder in microwave drying
- Preparation and Properties of Blast Furnace Slag Glass Ceramics Containing Cr2O3
- Influence of unburned pulverized coal on gasification reaction of coke in blast furnace
- Effect of PWHT Conditions on Toughness and Creep Rupture Strength in Modified 9Cr-1Mo Steel Welds
- Role of B2O3 on structure and shear-thinning property in CaO–SiO2–Na2O-based mold fluxes
- Effect of Acid Slag Treatment on the Inclusions in GCr15 Bearing Steel
- Recovery of Iron and Zinc from Blast Furnace Dust Using Iron-Bath Reduction
- Phase Analysis and Microstructural Investigations of Ce2Zr2O7 for High-Temperature Coatings on Ni-Base Superalloy Substrates
- Combustion Characteristics and Kinetics Study of Pulverized Coal and Semi-Coke
- Mechanical and Electrochemical Characterization of Supersolidus Sintered Austenitic Stainless Steel (316 L)
- Synthesis and characterization of Cu doped chromium oxide (Cr2O3) thin films
- Ladle Nozzle Clogging during casting of Silicon-Steel
- Thermodynamics and Industrial Trial on Increasing the Carbon Content at the BOF Endpoint to Produce Ultra-Low Carbon IF Steel by BOF-RH-CSP Process
- Research Article
- Effect of Boundary Conditions on Residual Stresses and Distortion in 316 Stainless Steel Butt Welded Plate
- Numerical Analysis on Effect of Additional Gas Injection on Characteristics around Raceway in Melter Gasifier
- Variation on thermal damage rate of granite specimen with thermal cycle treatment
- Effects of Fluoride and Sulphate Mineralizers on the Properties of Reconstructed Steel Slag
- Effect of Basicity on Precipitation of Spinel Crystals in a CaO-SiO2-MgO-Cr2O3-FeO System
- Review Article
- Exploitation of Mold Flux for the Ti-bearing Welding Wire Steel ER80-G
- Research Article
- Furnace heat prediction and control model and its application to large blast furnace
- Effects of Different Solid Solution Temperatures on Microstructure and Mechanical Properties of the AA7075 Alloy After T6 Heat Treatment
- Study of the Viscosity of a La2O3-SiO2-FeO Slag System
- Tensile Deformation and Work Hardening Behaviour of AISI 431 Martensitic Stainless Steel at Elevated Temperatures
- The Effectiveness of Reinforcement and Processing on Mechanical Properties, Wear Behavior and Damping Response of Aluminum Matrix Composites