Characterization of Mn-Doped Co3O4 Thin Films Prepared by Sol Gel-Based Dip-Coating Process
-
Lakehal Abdelhak
 ,
Bouaza Amar
,
Bouaza Amar

Abstract
In this article, manganese-doped cobalt oxide (Mn-doped Co3O4) thin films have been prepared on glass substrates using sol gel-based dip-coating technique in order to investigate their optical, structural and electrical properties. The Mn concentration was changed from 0 % to 9 %. The synthesized samples were characterized by ultraviolet-visible spectroscopy (UV-visible), X-ray diffraction (XRD), Fourier transform infrared spectroscopy (FTIR) and complex impedance spectroscopy to elucidate the optical, structural, vibrational and electrical properties. Our optical results show that the transmittance of Mn-doped Co3O4 films decreases with increasing doping levels. The optical band gaps were found to be
Introduction
Transparent conducting oxides (TCOs) are promising materials in various potential applications due to their dual property; they combine electrical conductivity and optical transparency in the visible range. These properties have attracted the attention for using them in optoelectronic devices such as photovoltaic solar cells and electrochromic windows [1, 2].
Among the TCOs, cobalt oxide (Co3O4) is considered as one of the broadly studied compounds due to its importance in various scientific fields such as solar selective absorber [1], energy storage [2], supercapacitors [3] and electrochromic sensor [4]. Co3O4 exhibits p-type semiconducting property and behaves like an antiferromagnet (AF) with the Néel temperature
In recent years, great efforts have been devoted to fabricating nanostructured systems of cobalt oxide with tunable physical–chemical properties for a broad range of applications, among which transition metal doping is a promising and efficient route to improve the optical absorption and the electrical behavior of Co3O4. In this regard, this study fabricates Mn-doped Co3O4 thin films in an effort to understand their enhanced optical and electrical properties. We will introduce a Mn metal impurity into the Co3O4 matrix by the sol gel technique in order to produce optimized semiconductor thin films of Co3O4 with good optical and electrical properties, and we controlled the doping levels so that the Co3O4 phase did not change. We choose doping by manganese Mn2+ because its atomic radius (0.80 Å) is almost equal to that of cobalt Co2+ (0.72 Å). It can substitute the Co2+ ion. A small change in dopant concentration is significant for changing the band gaps, and the energy band gaps are expected to vary in a wide and very attractive energies intervals ranging from
Various methods have been reported for the synthesis of Co3O4 thin films such as chemical vapor deposition (CVD) [7], spray pyrolysis [8] and precipitation method [6]. In this paper, we have adopted a simple sol gel dip-coating method to obtain Mn-doped Co3O4 thin films. This method of preparing thin films has several advantages: its low cost, flexibility in the deposition process and convenience for a large area. It has been used successfully in our laboratory to fabricate a variety of porous materials such as SnO2 [9] and TiO2 [10]. The synthesized samples were subjected to characterizations such as ultraviolet-visible spectroscopy (UV-visible), X-ray diffraction (XRD), Fourier-transform infrared spectroscopy (FTIR), scanning electron microscopy (SEM) and impedance measurements.
Experimental procedure
Materials and methods
The principle of the dip-coating method is to dip the substrate in a viscous solution and to withdraw at constant speed under controlled and stable conditions to obtain a homogeneous film of regular thickness. The deposition of the thin films by the dip-coating technique is carried out in three steps:
preparation of substrates (cleaning).
the deposit of the film by the dip-coating technique
drying and heat treatment
There are several parameters that influence the thickness of the thin films such as sol viscosity, pressure, pulling force, gravitational force, surface tension and surface tension gradient. It is possible, in principle, to adjust some parameters to obtain the desired thickness.
In the present venture, a sol gel dip-coating setup operating at atmospheric pressure was used to deposit cobalt oxide thin films. In a typical experiment, cobalt nitrate hexahydrate (Co(NO3)2.6H2O) was dissolved in an aqueous solution (100 ml) of sucrose (C12H22O11) and stirred vigorously at 100 °C for about 2 h to form a burgundy homogeneous solution. To achieve Mn doping
The procedure of cleaning glass substrates is very important to get well-adherent, smooth films. The substrates Pyrex pieces (75×25×1 mm3) were cleaned through dipping them in ultrasonic bath containing trichloroethylene, ethanol and aciton for 5 min, respectively, and finally rinsed by distilled water. The withdrawal speed of the substrates from the solution was 50 mm/min. The formed films pass through the drying step to evaporate the solvent. After that, the obtained films were calcined in muffle furnace at 400°C for 45 min. A schematic representation of the sol gel synthesis is given in Figure 1.

Schematic diagram of sol gel process of Mn-doped Co3O4 preparation.
Characterizations
The as-prepared samples were characterized by using different physical techniques. The optical transmittance spectra and band gap energies of Mn-doped Co3O4 thin films were measured using Shimadzu-1650 spectrophotometer in the wavelength range from 300 to 900 nm. The phase and crystal structure of all samples were studied by XRD (Rigaku miniflex 600) with
Results and discussion
Optical properties
In this part, the UV-Vis spectra of Mn-doped Co3O4 films were recorded in the wavelength range from 300 to 900 nm. Figure 2 shows the optical transmission spectra of Mn-doped Co3O4 thin films. All the obtained spectra manifest the presence of two sharp absorption edges in the visible region. The first one as reported in many researches is associated to the O2– and Co2+ charge transfer process, while the other observed at 500–600 nm wavelength range is due to the O2– and Co3+ charge transfer (ligand to metal charge transfer (LMCT) event). This indicates the presence of two band gap energies, in agreement with the literature [11, 12]. It is evident that the transmittance (Figure 2) gradually decreases while increasing Mn content. It can be seen from Figure 2 that the average transmission in the visible region has decreased with increasing doping levels. The absorption bands of Mn-doped Co3O4 vary with a change in the concentration of manganese. The band gap energies (allowed direct transition) of Mn-doped Co3O4 can be determined by the following equation [10]:
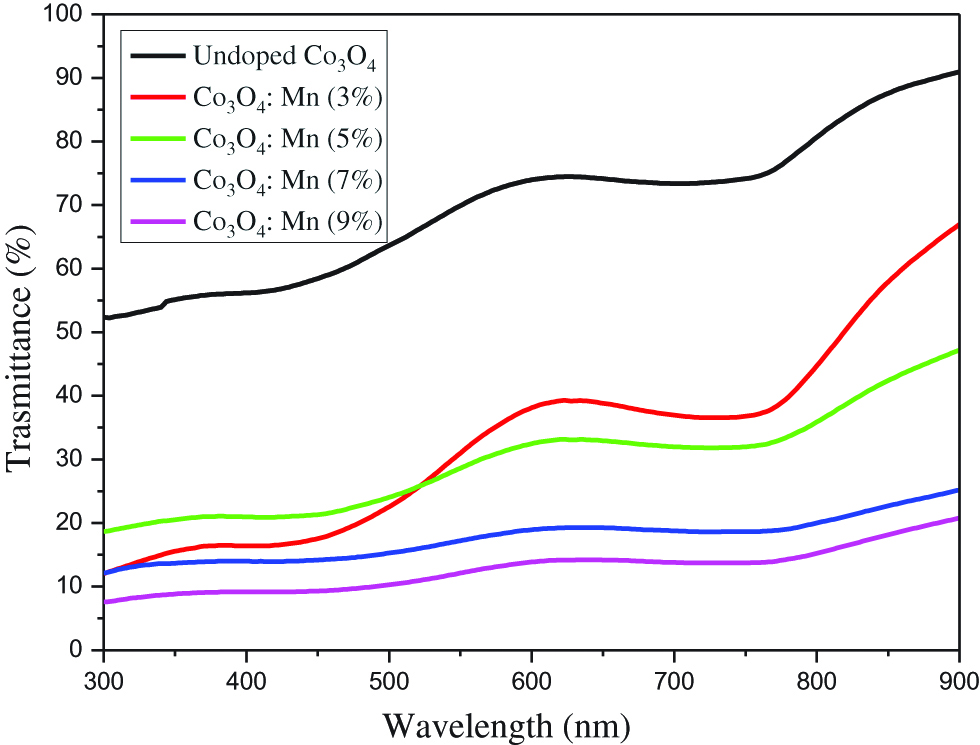
Transmittance spectra of Mn-doped Co3O4 films.
where

Tauc plots of Mn-doped Co3O4 films.
where

Extinction coefficient plots of Mn-doped Co3O4 thin films.
The film thickness d has been calculated from UV-visible data using the following equation [15]:
where n is the refractive index at two adjacent maxima or minima at wavelengths
Band gap energies, average of transmission, refractive index and film thickness of Mn-doped Co3O4 films.
| Samples | Eg1 (eV) | Eg2 (eV) | Refractive index | Film thickness (nm) |
|---|---|---|---|---|
| Undoped Co3O4 | 1.51 | 2.12 | 2.642 | 215.91 |
| Co3O4: Mn (3 %) | 1.45 | 2.07 | 2.676 | 230.77 |
| Co3O4: Mn (5 %) | 1.37 | 1.87 | 2.812 | 233.01 |
| Co3O4: Mn (7 %) | 1.23 | 1.75 | 2.894 | 216.05 |
| Co3O4: Mn (9 %) | 1.20 | 1.72 | 2.914 | 222.15 |
The band gap energies were found to decrease with increasing Mn content as shown in Figure 5. From these results, it can be seen that the shift in the band gap energies of our samples is generally due to individual or combined effects such as quantum confinement, crystallites size, charged impurities at grain boundaries, structural disorder, the network distortions caused by the introduction of impurities in the matrix and the creation of impurities energy levels. The optical properties of Mn-doped Co3O4 have attracted the attention for using it in solar cells.

Energy band gap vs. Mn content of Mn-doped Co3O4 films.
The refractive index value of undoped Co3O4 film is
Structural analysis
Figure 6 shows the XRD pattern of Mn-doped Co3O4 powders at different concentrations of manganese (3 %, 5 %, 7 % and 9 %). All obtained powders of Mn-doped Co3O4 show that multiple diffraction peaks coincided well with the cubic spinel type structure (Fd3m space group), implying the complete solubility of the Mn ions into the Co3O4 cubic crystal. The main peak is

XRD patterns of Mn-doped Co3O4 powders.
Structural parameters of Mn-doped Co3O4 powders.
| Samples | (hkl) | 2θ | d spacing (Ǻ) | Lattice parameter (Ǻ) | FWHM (deg) | Crystallite size D (Ǻ) |
|---|---|---|---|---|---|---|
| Undoped Co3O4 | (311) | 36.90 | 2.433 | 8.069 | 0.60 | 243 |
| Co3O4: Mn (3 %) | (311) | 36.87 | 2.438 | 8.089 | 0.45 | 325 |
| Co3O4: Mn (5 %) | (311) | 36.80 | 2.442 | 8.099 | 0.45 | 311 |
| Co3O4: Mn (7 %) | (311) | 36.79 | 2.443 | 8.102 | 0.45 | 324 |
| Co3O4: Mn (9 %) | (311) | 36.76 | 2.444 | 8.109 | 0.40 | 365 |
In Figure 7, we show the variations of the network parameter and grain size as a function of doping levels. The increase of the lattice parameter with increasing Mn content refers to the substitution of smaller Co2+ ions (0.72 Å) by larger Mn2+ ions (0.80 Å) in the system. The particle sizes of Mn-doped Co3O4 powders were calculated using the full width at half maximum (FWHM) of (311) peak from the Debye–Scherrer formula [9], knowing that the width increases as the particle size decreases:

Network parameter and grain size of Mn-doped Co3O4.
where D is the crystallite size, λ is the wavelength of
FTIR spectroscopy
In order to investigate the influence of Mn doping on vibrational properties, Alpha Bruker FTIR spectrometer experiments were carried out. Figure 8 shows FTIR transmission spectra of Mn-doped Co3O4 films. In the investigated region (4,000–400 cm−1), all obtained spectra have two absorption bands ʋ1, ʋ2 at 555 cm−1 and 664 Cm−1 assigned from stretching vibration of the metal–oxygen bond in Co3O4 spinel oxide [3, 4, 5, 6, 7, 8, 9, 10, 11, 12, 13, 14, 15, 16, 17, 18, 19, 20, 21]. The band at approximately 555 cm−1 can be attributed to the vibrations of the bonds formed by the Co3+ ion which are present in the octahedral holes of the crystal lattice. The other band at about 664 cm−1 is associated to the vibrations of the bonds formed by the Co2+ ion which are present in the tetrahedral holes of the crystal lattice [22]. The absorption peak ʋ4 at (2,350 cm−1) is assigned to the bending vibration of O-H, and we suggest that the origin of this bond is due to the solvent involved in the synthesis of the films [10]. FTIR spectra show other low-intensity peaks which are assigned to the organic matter remaining after annealing. In the Mn-doped Co3O4 spectrum, the absorption band ʋ3 in the region [600–630 cm−1] confirms the vibrational frequency of Mn–O complex [23]. The obtained results are in good agreement with the XRD results (Figure 6).

FTIR spectra of Mn-doped Co3O4 films.
Scanning electron microscopy studies
To understand the morphology of as-prepared powders, the scanning electron microphotographs of powders are recorded. Figure 9 shows the scanning electron microphotographs of manganese-doped Co3O4 powders at different doping levels (undoped, 3 wt%, 5 wt%, 7 wt% and 9 wt%) under the magnification of×2,000. All microphotographs are characterized by the presence of nanocrystalline grains with some overgrown clusters. Coalescence of smaller grains of different sizes and shapes can be noticed when the manganese concentration increases.

SEM of Co3O4 powder at different doping levels of manganese (a) undoped, (b) 3 %Mn, (c) 5 %Mn, (d) 7 %Mn and (e) 9 % Mn.
Impedance spectroscopy
The measurement of the electrical properties of materials requires powerful tools to explore the electrical behavior, and that is through modeling them by an equivalent circuit [24]. In this method, we apply a sinusoidal disturbance of constant amplitude and a variable frequency to determine the conduction properties of a polycrystalline oxide and also, in theory, the different contributions to the conduction of a material (grains, grain boundaries and Pores, defects). It also characterizes the different electrically active regions in the material and demonstrates their existence by their individual electrical properties. The following complex expressions describe the electrical behavior of our films [15].
where RS and CS are the series resistance and capacitance; RP and CP are the parallel resistance and capacitance, C0 is the empty capacitance, the real and imaginary components are ω=2πʋ, ʋ is the applied frequency and j2=−1. The plot (Zˊˊ versus Zˊ) that describes the electrical behavior of our samples which have three components; each of these components corresponds to a particular relaxation frequency. The electrical response is due to the bulk properties (νb) at higher frequencies. At intermediate frequencies, the electrical response is due to the grain boundaries (νgb) and at low frequencies the electrical response corresponds to electrode process (νel), or processes occurring in the material/electrode interface (νel ≪ νgb≪ νb) [25]. Several factors influence the properties of grain boundaries as chemical composition, impurities, ageing and conditions of preparation. The electrical characteristic of a material is shown by the appearance of semicircular arcs in the Nyquist plots. Figure 10 is the Nyquist representation of undoped and Mn-doped Co3O4 thin films, whose f frequency varies from 75 KHz to 20 MHz at ambient temperature. The processes that occur in the electrode are modeled by an equivalent electrical circuit. The physical logic of the system indicates that the concurrent processes are connected in parallel. The capacity Cp of the layer was calculated using the following equation [10]:

Complex impedance spectrum (Nyquist plots) of Mn-doped Co3O4 thin films.
The variation of the resistance and capacitance as a function of Mn-doping levels are listed in Table 3 and shown in Figure 11. It is clear that the resistance of cobalt oxide decreases and the capacity increases with the increase of doping level; this shift is also due to the introduction of manganese ions in Co3O4 lattice which induces a variation in the particle size and consequently introduce more grain boundaries within the samples. Two conduction mechanisms are simultaneously present: conduction across the grain and the conduction through the grain boundaries. The effect of grain boundaries in samples becomes more dominant in the conduction mechanism compared to the grain contribution.

Variation of capacity and resistance of Mn-doped Co3O4 thin films.
Values of fc, Rp and Cp of Mn-doped Co3O4 films.
| Samples | fc (MHz) | Rp (Ω) | Cp (µF) |
|---|---|---|---|
| Undoped Co3O4 | 15.40 | 127.66 | 80.9 |
| Co3O4: Mn (3 %) | 15.29 | 119.02 | 87.5 |
| Co3O4: Mn (5 %) | 14.96 | 106.52 | 99.9 |
| Co3O4: Mn (7 %) | 14.74 | 102.37 | 105.5 |
| Co3O4: Mn (9 %) | 14.40 | 92.04 | 120.1 |
Conclusion
In conclusion, we have successfully synthesized Mn-doped cobalt oxide (Co3O4) thin films using a sol gel dip-coating technique. We used several experimental methods of investigation to study the effect of Mn doping on optical, structural and electrical properties of cobalt oxide as optical transmission spectroscopy (UV-visible and IR), XRD, FTIR and complex impedance measurement. The transmittance of all samples decreases with increasing doping levels. The band gap energies of our samples were determined by the Tauc plot. The values of the band gaps were found to decrease as the dopant concentration increases; it might be due to the formation of impurity energy level. XRD patterns revealed that Mn-doped Co3O4 samples were crystallized in cubic spinel structure, knowing that the crystallite size was found to be from 243 to 365 Å. The FTIR spectra of Mn-doped Co3O4 revealed four distinct bands due to the stretching vibrations of Co-O, Mn-O for all doped samples and O-H. The complex impedance spectroscopy indicates that the physical concurrent processes of Mn-doped Co3O4 are connected in parallel RC. The conduction mechanism of all samples is highly due to the grain boundaries.
References
[1] G.B. Smith, A. Igantier and G. Zijac, J. Appl. Phys., 51 (1980) 4186–4196.10.1063/1.328276Search in Google Scholar
[2] L. Yao, Y. Xi, G. Xi and Y. Feng, J. Alloys Compd., 680 (2016) 73–79.10.1016/j.jallcom.2016.04.092Search in Google Scholar
[3] V.R. Shinde, S.B. Mahadik, T.P. Gujar and C.D. Lokhande, Appl. Surf. Sci., 252 (2006) 7487–7492.10.1016/j.apsusc.2005.09.004Search in Google Scholar
[4] H. Razmi and E. Habibi, Electrochim. Acta., 55 (2010) 8731–8737.10.1016/j.electacta.2010.07.081Search in Google Scholar
[5] P.S. Patil, L.D. Kadam and C.D. Lokhande, Thin Solid Films, 272 (1996) 29–32.10.1016/0040-6090(95)06907-0Search in Google Scholar
[6] J. Pal and P. Chauhan, Mater. Charac., 61 (2010) 575–579.10.1016/j.matchar.2010.02.017Search in Google Scholar
[7] L. Armelao, D. Barreca, S. Gross and E. Tondello, Surf Sci. Spectra, 08 (2001) 14–23.10.1116/11.20010601Search in Google Scholar
[8] S. Grace Victoria, A. Moses Ezhil Raj and C. Ravidhas, Mat. Chem. Phys., 162 (2015) 1–8.10.1016/j.matchemphys.2015.05.025Search in Google Scholar
[9] B. Benrabah, A. Bouaza, A. Kadari and M.A. Maaref, Superlattices Microstruct., 50 (2011) 591–600.10.1016/j.spmi.2011.08.009Search in Google Scholar
[10] A. Kharoubi, A. Bouaza, B. Benrabah, A. Ammari and A. Khiali, Eur. Phys. J. Appl. Phys., 72 (2015) 30301.10.1051/epjap/2015150282Search in Google Scholar
[11] A. Louardi, A. Rmili, F. Ouachtari, A. Bouaoud, B. Elidrissi and H. Erguig, J. Alloys Compd., 509 (2011) 9183–9189.10.1016/j.jallcom.2011.06.106Search in Google Scholar
[12] D. Barreca, C. Massignan, S. Daolio, M. Fabrizini, C. Piccirillo, L. Armelao and E. Tondello, Chem. Mater, 13 (2001) 588–593.10.1021/cm001041xSearch in Google Scholar
[13] A. Alshahrie, Superlattices Microstruct., 96 (2016) 75–81.10.1016/j.spmi.2016.05.022Search in Google Scholar
[14] N.M. Ravindra, Infrared Phys. Technol., 21 (1981) 283–285.10.1016/0020-0891(81)90033-6Search in Google Scholar
[15] N.T. Mc Devitt and N.L. Baun, Spectrochim. Acta, 20 (1964) 799–808.10.1016/0371-1951(64)80079-5Search in Google Scholar
[16] A. Gulino, G. Fiorito and I. Fragala, J. Mater. Chem., 13 (2003) 861–865.10.1039/b211861kSearch in Google Scholar
[17] R. Drasovean, R. Monteiro, E. Fortunato and V. Musat, J. Non-Cryst. Solids., 352 (2006) 1479–1485.10.1016/j.jnoncrysol.2006.02.036Search in Google Scholar
[18] A. Göktas, F. Aslan, A. Tumbul and S.H. Gunduz, Ceram. Int., 43 (2016) 704–713.10.1016/j.ceramint.2016.09.217Search in Google Scholar
[19] F. Gu, C. Li, Y. Hu and L. Zhang, J. Cryst. Growth, 304 (2007) 369–373.10.1016/j.jcrysgro.2007.03.040Search in Google Scholar
[20] A.M. Gomaa Ali, A. Osama Fouad and A. Salah Makhlouf, J. Alloys. Compd., 579 (2013) 606–611.10.1016/j.jallcom.2013.07.095Search in Google Scholar
[21] S. Gholamrezaei, M. Salavati-Niasari, H. Hadadzadeh and M. Taghi Behnamfar, High Temp. Mater. Proc., 36 (2015) 107–112.10.1515/htmp-2015-0158Search in Google Scholar
[22] M. Th Makhlouf, B.M. Abu-Zied and T.H. Mansoure, J. Nanopart., 10 (2013) 1155.Search in Google Scholar
[23] A. Kadari, K. Mahi, R. Mostefa, M. Badaoui, A. Mameche and D. Kadri, J. Alloys Compd., 688 (2016) 32–36.10.1016/j.jallcom.2016.07.040Search in Google Scholar
[24] E. Barsoukov, J.R. Ross. Macdonald (ed.), Impedance Spectroscopy, Theory, Experiment, and Applications, 2nd ed., John Wiley & Sons, Inc, Publication (2005).10.1002/0471716243Search in Google Scholar
[25] R. Mechiakh, F. Meriche, R. Kremer, R. Bensaha, B. Boudine and A. Boudrioua, Opt. Mater., 30 (2007) 645–651.10.1016/j.optmat.2007.02.047Search in Google Scholar
© 2019 Walter de Gruyter GmbH, Berlin/Boston
This work is licensed under the Creative Commons Attribution 4.0 Public License.
Articles in the same Issue
- Frontmatter
- Review Article
- Research on the Influence of Furnace Structure on Copper Cooling Stave Life
- Influence of High Temperature Oxidation on Hydrogen Absorption and Degradation of Zircaloy-2 and Zr 700 Alloys
- Correlation between Travel Speed, Microstructure, Mechanical Properties and Wear Characteristics of Ni-Based Hardfaced Deposits over 316LN Austenitic Stainless Steel
- Factors Influencing Gas Generation Behaviours of Lump Coal Used in COREX Gasifier
- Experiment Research on Pulverized Coal Combustion in the Tuyere of Oxygen Blast Furnace
- Phosphate Capacities of CaO–FeO–SiO2–Al2O3/Na2O/TiO2 Slags
- Microstructure and Interface Bonding Strength of WC-10Ni/NiCrBSi Composite Coating by Vacuum Brazing
- Refill Friction Stir Spot Welding of Dissimilar 6061/7075 Aluminum Alloy
- Solvothermal Synthesis and Magnetic Properties of Monodisperse Ni0.5Zn0.5Fe2O4 Hollow Nanospheres
- On the Capability of Logarithmic-Power Model for Prediction of Hot Deformation Behavior of Alloy 800H at High Strain Rates
- 3D Heat Conductivity Model of Mold Based on Node Temperature Inheritance
- 3D Microstructure and Micromechanical Properties of Minerals in Vanadium-Titanium Sinter
- Effect of Martensite Structure and Carbide Precipitates on Mechanical Properties of Cr-Mo Alloy Steel with Different Cooling Rate
- The Interaction between Erosion Particle and Gas Stream in High Temperature Gas Burner Rig for Thermal Barrier Coatings
- Permittivity Study of a CuCl Residue at 13–450 °C and Elucidation of the Microwave Intensification Mechanism for Its Dechlorination
- Study on Carbothermal Reduction of Titania in Molten Iron
- The Sequence of the Phase Growth during Diffusion in Ti-Based Systems
- Growth Kinetics of CoB–Co2B Layers Using the Powder-Pack Boriding Process Assisted by a Direct Current Field
- High-Temperature Flow Behaviour and Constitutive Equations for a TC17 Titanium Alloy
- Research on Three-Roll Screw Rolling Process for Ti6Al4V Titanium Alloy Bar
- Continuous Cooling Transformation of Undeformed and Deformed High Strength Crack-Arrest Steel Plates for Large Container Ships
- Formation Mechanism and Influence Factors of the Sticker between Solidified Shell and Mold in Continuous Casting of Steel
- Casting Defects in Transition Layer of Cu/Al Composite Castings Prepared Using Pouring Aluminum Method and Their Formation Mechanism
- Effect of Current on Segregation and Inclusions Characteristics of Dual Alloy Ingot Processed by Electroslag Remelting
- Investigation of Growth Kinetics of Fe2B Layers on AISI 1518 Steel by the Integral Method
- Microstructural Evolution and Phase Transformation on the X-Y Surface of Inconel 718 Ni-Based Alloys Fabricated by Selective Laser Melting under Different Heat Treatment
- Characterization of Mn-Doped Co3O4 Thin Films Prepared by Sol Gel-Based Dip-Coating Process
- Deposition Characteristics of Multitrack Overlayby Plasma Transferred Arc Welding on SS316Lwith Co-Cr Based Alloy – Influence ofProcess Parameters
- Elastic Moduli and Elastic Constants of Alloy AuCuSi With FCC Structure Under Pressure
- Effect of Cl on Softening and Melting Behaviors of BF Burden
- Effect of MgO Injection on Smelting in a Blast Furnace
- Structural Characteristics and Hydration Kinetics of Oxidized Steel Slag in a CaO-FeO-SiO2-MgO System
- Optimization of Microwave-Assisted Oxidation Roasting of Oxide–Sulphide Zinc Ore with Addition of Manganese Dioxide Using Response Surface Methodology
- Hydraulic Study of Bubble Migration in Liquid Titanium Alloy Melt during Vertical Centrifugal Casting Process
- Investigation on Double Wire Metal Inert Gas Welding of A7N01-T4 Aluminum Alloy in High-Speed Welding
- Oxidation Behaviour of Welded ASTM-SA210 GrA1 Boiler Tube Steels under Cyclic Conditions at 900°C in Air
- Study on the Evolution of Damage Degradation at Different Temperatures and Strain Rates for Ti-6Al-4V Alloy
- Pack-Boriding of Pure Iron with Powder Mixtures Containing ZrB2
- Evolution of Interfacial Features of MnO-SiO2 Type Inclusions/Steel Matrix during Isothermal Heating at Low Temperatures
- Effect of MgO/Al2O3 Ratio on Viscosity of Blast Furnace Primary Slag
- The Microstructure and Property of the Heat Affected zone in C-Mn Steel Treated by Rare Earth
- Microwave-Assisted Molten-Salt Facile Synthesis of Chromium Carbide (Cr3C2) Coatings on the Diamond Particles
- Effects of B on the Hot Ductility of Fe-36Ni Invar Alloy
- Impurity Distribution after Solidification of Hypereutectic Al-Si Melts and Eutectic Al-Si Melt
- Induced Electro-Deposition of High Melting-Point Phases on MgO–C Refractory in CaO–Al2O3–SiO2 – (MgO) Slag at 1773 K
- Microstructure and Mechanical Properties of 14Cr-ODS Steels with Zr Addition
- A Review of Boron-Rich Silicon Borides Basedon Thermodynamic Stability and Transport Properties of High-Temperature Thermoelectric Materials
- Siliceous Manganese Ore from Eastern India:A Potential Resource for Ferrosilicon-Manganese Production
- A Strain-Compensated Constitutive Model for Describing the Hot Compressive Deformation Behaviors of an Aged Inconel 718 Superalloy
- Surface Alloys of 0.45 C Carbon Steel Produced by High Current Pulsed Electron Beam
- Deformation Behavior and Processing Map during Isothermal Hot Compression of 49MnVS3 Non-Quenched and Tempered Steel
- A Constitutive Equation for Predicting Elevated Temperature Flow Behavior of BFe10-1-2 Cupronickel Alloy through Double Multiple Nonlinear Regression
- Oxidation Behavior of Ferritic Steel T22 Exposed to Supercritical Water
- A Multi Scale Strategy for Simulation of Microstructural Evolutions in Friction Stir Welding of Duplex Titanium Alloy
- Partition Behavior of Alloying Elements in Nickel-Based Alloys and Their Activity Interaction Parameters and Infinite Dilution Activity Coefficients
- Influence of Heating on Tensile Physical-Mechanical Properties of Granite
- Comparison of Al-Zn-Mg Alloy P-MIG Welded Joints Filled with Different Wires
- Microstructure and Mechanical Properties of Thick Plate Friction Stir Welds for 6082-T6 Aluminum Alloy
- Research Article
- Kinetics of oxide scale growth on a (Ti, Mo)5Si3 based oxidation resistant Mo-Ti-Si alloy at 900-1300∘C
- Calorimetric study on Bi-Cu-Sn alloys
- Mineralogical Phase of Slag and Its Effect on Dephosphorization during Converter Steelmaking Using Slag-Remaining Technology
- Controllability of joint integrity and mechanical properties of friction stir welded 6061-T6 aluminum and AZ31B magnesium alloys based on stationary shoulder
- Cellular Automaton Modeling of Phase Transformation of U-Nb Alloys during Solidification and Consequent Cooling Process
- The effect of MgTiO3Adding on Inclusion Characteristics
- Cutting performance of a functionally graded cemented carbide tool prepared by microwave heating and nitriding sintering
- Creep behaviour and life assessment of a cast nickel – base superalloy MAR – M247
- Failure mechanism and acoustic emission signal characteristics of coatings under the condition of impact indentation
- Reducing Surface Cracks and Improving Cleanliness of H-Beam Blanks in Continuous Casting — Improving continuous casting of H-beam blanks
- Rhodium influence on the microstructure and oxidation behaviour of aluminide coatings deposited on pure nickel and nickel based superalloy
- The effect of Nb content on precipitates, microstructure and texture of grain oriented silicon steel
- Effect of Arc Power on the Wear and High-temperature Oxidation Resistances of Plasma-Sprayed Fe-based Amorphous Coatings
- Short Communication
- Novel Combined Feeding Approach to Produce Quality Al6061 Composites for Heat Sinks
- Research Article
- Micromorphology change and microstructure of Cu-P based amorphous filler during heating process
- Controlling residual stress and distortion of friction stir welding joint by external stationary shoulder
- Research on the ingot shrinkage in the electroslag remelting withdrawal process for 9Cr3Mo roller
- Production of Mo2NiB2 Based Hard Alloys by Self-Propagating High-Temperature Synthesis
- The Morphology Analysis of Plasma-Sprayed Cast Iron Splats at Different Substrate Temperatures via Fractal Dimension and Circularity Methods
- A Comparative Study on Johnson–Cook, Modified Johnson–Cook, Modified Zerilli–Armstrong and Arrhenius-Type Constitutive Models to Predict Hot Deformation Behavior of TA2
- Dynamic absorption efficiency of paracetamol powder in microwave drying
- Preparation and Properties of Blast Furnace Slag Glass Ceramics Containing Cr2O3
- Influence of unburned pulverized coal on gasification reaction of coke in blast furnace
- Effect of PWHT Conditions on Toughness and Creep Rupture Strength in Modified 9Cr-1Mo Steel Welds
- Role of B2O3 on structure and shear-thinning property in CaO–SiO2–Na2O-based mold fluxes
- Effect of Acid Slag Treatment on the Inclusions in GCr15 Bearing Steel
- Recovery of Iron and Zinc from Blast Furnace Dust Using Iron-Bath Reduction
- Phase Analysis and Microstructural Investigations of Ce2Zr2O7 for High-Temperature Coatings on Ni-Base Superalloy Substrates
- Combustion Characteristics and Kinetics Study of Pulverized Coal and Semi-Coke
- Mechanical and Electrochemical Characterization of Supersolidus Sintered Austenitic Stainless Steel (316 L)
- Synthesis and characterization of Cu doped chromium oxide (Cr2O3) thin films
- Ladle Nozzle Clogging during casting of Silicon-Steel
- Thermodynamics and Industrial Trial on Increasing the Carbon Content at the BOF Endpoint to Produce Ultra-Low Carbon IF Steel by BOF-RH-CSP Process
- Research Article
- Effect of Boundary Conditions on Residual Stresses and Distortion in 316 Stainless Steel Butt Welded Plate
- Numerical Analysis on Effect of Additional Gas Injection on Characteristics around Raceway in Melter Gasifier
- Variation on thermal damage rate of granite specimen with thermal cycle treatment
- Effects of Fluoride and Sulphate Mineralizers on the Properties of Reconstructed Steel Slag
- Effect of Basicity on Precipitation of Spinel Crystals in a CaO-SiO2-MgO-Cr2O3-FeO System
- Review Article
- Exploitation of Mold Flux for the Ti-bearing Welding Wire Steel ER80-G
- Research Article
- Furnace heat prediction and control model and its application to large blast furnace
- Effects of Different Solid Solution Temperatures on Microstructure and Mechanical Properties of the AA7075 Alloy After T6 Heat Treatment
- Study of the Viscosity of a La2O3-SiO2-FeO Slag System
- Tensile Deformation and Work Hardening Behaviour of AISI 431 Martensitic Stainless Steel at Elevated Temperatures
- The Effectiveness of Reinforcement and Processing on Mechanical Properties, Wear Behavior and Damping Response of Aluminum Matrix Composites