
Tribological characterization of sponge gourd outer skin fiber-reinforced epoxy composite with Tamarindus indica seed filler addition using the Box–Behnken method
-
Felix Sahayaraj Arockiasamy
 ,
Mayakrishnan Muthukrishnan
,
Mayakrishnan Muthukrishnan

Abstract
The tribological properties of the sponge gourd outer skin fiber (SGOSF)-reinforced epoxy composites filled with tamarind seed powder were investigated using a pin-on-disc dry sliding wear testing machine. The fiber and filler contents were kept constant (30 and 7.5 wt%). The fibers were treated with sodium hydroxide (NaOH), which increases the bonding strength that has been identified by scanning electron microscope (SEM). A filler content of 7.5 wt% has better hardness due to the embedment of filler with treated fiber and epoxy. Therefore, the SGOSFs/epoxy with 7.5 wt% tamarind filler was chosen for the study of tribological characterization. The lowest specific wear rate of 2.565 × 10⁻⁴ mm3·N m−1 was obtained using the design of expert optimization technique for the control factors such as a load of 44.99 N, a sliding distance of 1,701.39 m, and a sliding velocity of 3.36 m·s−1 using a ramp plot at the desirable level of 1. For the gripping material application, the highest coefficient of friction value of 0.51 was obtained by maintaining the specified input parameters, such as a load of 42.15 N, a sliding distance of 1,874.86 m, and a sliding velocity of 4.99 m·s−1 using a ramp plot at the desirable level of 0.927. SEM images were used to investigate the failure mechanism of the worn surfaces, which substantiates the failure of the pure matrix layer on the surface even at low load, followed by the formation of a rarely breakable adhesive layer.
1 Introduction
In the material industry, the wear performance of a material is crucial for determining its compactness and sustainability in specific applications. Composite materials composed of fiber-reinforced polymers satisfy most of these requirements. The friction and wear study in polymer composite materials is more significant for understanding the reliability of the material when the material is subjected to different working conditions in an erosive environment. This tribological study measured the material’s resistance to mass loss during rubbing. According to Jenish et al. (1), the ideal input parameter can be selected to obtain the lowest possible specific wear rate (SWR). They computed the ideal composition of natural fiber-reinforced polymer composite materials with an optimum amount of fillers. The optimal use of natural resources to create superior wear-resistant materials has been the focus of recent reviews, according to Paul and Bhowmik (2). This work reviews various chemical treatments for developing polymer-based composite materials with natural fibers and fillers.
García et al. (3) investigated the construction of HDPE composites with various amounts of peanut shell fillers (2, 4, 6, 8, and 10 wt%) and the influence of variations in filler amounts on the mechanical and tribological properties. Significant dry sliding wear conditions were optimized with a sliding speed of 50 mm·s−1 and a normal force of 10 kN, comparable to a contact pressure of 4 MPa. This process was performed to obtain optimal results for polymer composites used in heavy-duty applications (4). The influence of operational factors on wear loss was examined. The test results showed that the carbon fiber epoxy composite with seaweed filler exhibited good wear resistance (5). Alkali treatment modified the surface of the coir filler, and a different type of coir filler reinforcement was used to fabricate the composite. A pin-on-disc tribometer was used in the wear test under dry, wet, and hot conditions (2). The ideal combination for reducing the coefficient of friction (COF) consists of 1% fly ash, 30% fiber, a sliding distance, a load of 500 m and 5 N, respectively, and a high SN ratio. The results of the scanning electron microscope (SEM) studies revealed that increasing the amount of reinforcement increased surface deformations (6). Jenish et al. (7) examined the wear loss under the dry sliding wear condition of Cissus quadrangularis stem/epoxy resin supplemented with a red mud composite. All significant and insignificant parameters for SWR and COF response variables were confirmed by the response surface method-central composite design technique. Individual and interaction effects on responses were investigated using regression equations and contour plots.
According to Sumesh and Kavimani (8), a combination of 2% peanut filler and 20% plant fiber with a standard distance of 500 m had a lower COF, as revealed by the Taguchi optimization method. According to the SEM results, the worn surfaces of the composites are deformed. When the amount of cashew nutshell in the composite was 30%, the SWR and COF decreased. Compared with untreated cashew nut shell filler, composites treated with NaOH were better at resisting wear and friction (9). Peanut shell husk and sesame oil with 10% reinforced epoxy hybrid composites have been suggested for tribological applications, such as self-lubricating materials (10).
The Taguchi method was used for wear analysis in a research by Omri et al. (11). The insertion of filler particles from tungsten carbide led to a considerable modification in the mechanical properties of the material, as well as an enhancement in the wear resistance. The pin-on-disc method was used by Mysiukiewicz et al. (12) to determine the COF of polylactic acid composites filled with linseed cakes, with the Co–Cr–Mo alloy serving as the counter surface. However, the hardness of the composite samples was comparable to that of the unfilled polymers, and the COF was lower than that of the unfilled polymer.
Parikh et al. (13) reported that engineering components' wear and friction behavior indicated the possibility of using composites as tribo-materials. According to research findings, the amount of mass lost by a composite is influenced by the characteristics of the fiber. In addition, several operating characteristics, including the applied load, speed of the counter-part disc, working temperature, and contact time under sliding, have impact on wear behavior. The SWR and COF decreased as the polyoxymethylene fiber content increased. Transfer film developed on the countersurface of rolling steels, and the PTFE fiber orientation helped lower the friction coefficient and SWR (14).
In the earlier study by the authors (15,16), sponge gourd outer skin fibers (SGOSF) collected from agricultural waste were reinforced with epoxy resin. The study revealed the mechanical, thermal, and water absorption behavior of the developed composites with Tamarindus indica seed filler addition for use in a wide variety of applications. But the suitability of the use of the composites in an erosive environment is not explored. Since the current investigations aimed to optimize various test parameters (load [N], sliding distance [m], and sliding velocity [m·s−1]) at multiple levels. SWR and COF were determined based on the wear or mass loss of the material. Dry conditions were used for the wear tests. The wear performance of SGOSF-reinforced epoxy composite filled with tamarind seed powder was investigated to determine the appropriate use of composites in erosive environments. Filler materials have more significant properties to sustain in industries. Graphene incorporated with resole/carbon fiber hybrid composite provides a decent improvement in modulus (19.5%) and flexural strength (8.7%) (17). A novel CF/N−RGO/PW ternary skeleton is developed to enhance MCPA6’s tribological performance, featuring N−RGO sheets decorating carbon fibers for lubrication. This structure, acting as both ponds and ditches for PW storage and transport, reduces the friction coefficient and wear loss by 83% and 65%, respectively, compared to neat MCPA6 (18).
2 Materials and methods
2.1 Composite fabrication
A compressive stainless-steel mold was used to fabricate the composite samples with a compression molding machine. The dimensions of the mold plate were 300 × 300 × 5 mm3 (19). The prepared composite board is illustrated in Figure 1. The mold was dried and kept open to apply wax over the mold area for easy sample withdrawal. The chopped SGOSFs were spread over the mold area to an even thickness. An epoxy resin and hardener (10:1) with 7.5 wt% of tamarind seed powder mixture was poured over the fiber in the mold. The bonding materials are epoxy LY 556 (density 1.15–1.20 g·cm−3) and hardener HY 951 (0.97–0.99 g·cm−3). The filler was mixed with a resin and hardener to obtain a proper bonding strength (20). Subsequently, the excess resin and hardener mixture and air bubbles were removed by the rolling process. Then, the mold was closed and subjected to a load of 35 bar until bonding was initiated between the fiber and epoxy. At the beginning of polymerization, the temperature was increased to 130°C for 50 min. Once the sample was adequately dried, it was drawn from the mold. The minimum curing time was 24 h at ambient temperature conditions (21–23).

Process flow chart.
2.2 Two-body wear test
A dry sliding pin-on-disc wear testing machine was used to investigate the wear characteristics of SGOSF/epoxy particulate filled with tamarind seed filler composite surface under ASTM G 99 standard (24,25). The counter surface exhibited a hardness of 62 HRC. The machine provided a load of up to 60 N, with the ability to change the sliding velocity, sliding distance, and load applied during the experiments (Table 1).
The sample was prepared in a cuboid shape with dimensions of 8 × 4 × 4 mm3. A square-shaped surface was encountered for the wear analysis, and the long side was for the holding portion while experimenting. Appropriate input parameters were set during the experiment. After each experiment, the counter surface was cleaned with emery paper (Grade 320) and acetone to keep the surface free from debris. The number of experiments was designed using the Box–Behnken model for 16 runs using the Design of Expert software (13). The weight of the sample before and after the experiment was measured to evaluate the wear loss. Three experiments were done for each run, and the average was taken for the study. A digital weighing machine with a decimal place value of 4 was selected for all the experiments to obtain accurate results. The most significant input parameters were load (N), sliding distance (m), and sliding velocity (m·s−1). These were taken to determine their influence levels on the SWR and COF.
The SGOSF/epoxy composite with 7.5% filler addition was used for the wear characterization. Thus, three different compositions were considered in this analysis. The SWR and COF of the SGOSF/TISP/epoxy composite materials were determined using Eqs 1 and 2, respectively,
where K S is the SWR (mm3·N m−1), ΔM is the wear loss (g), ρ is the density (g·mm−3), L is the load (N), and d is the sliding distance (m).
where µ is the COF, F f is the frictional force (N), and A l is the applied load (N).
Different levels of independent factors
| Factor | Name | Unit | Levels | ||
|---|---|---|---|---|---|
| −1 | 0 | 1 | |||
| A | Load | N | 15 | 30 | 45 |
| B | Sliding velocity | m·s−1 | 3 | 4 | 5 |
| C | Sliding distance | m | 750 | 1,500 | 2,250 |
Experimental design with SWR and COF results
| Run | Load (N) | Sliding velocity (m·s−1) | Sliding distance (m) | Wear loss (mg) | SWR (mm3·N m−1) | COF |
|---|---|---|---|---|---|---|
| 1 | 30 | 3 | 2,250 | 48 | 0.00059408 | 0.5 |
| 2 | 45 | 4 | 2,250 | 44 | 0.00036305 | 0.48 |
| 3 | 30 | 4 | 1,500 | 32 | 0.00059408 | 0.51 |
| 4 | 15 | 5 | 1,500 | 13 | 0.00048269 | 0.41 |
| 5 | 45 | 3 | 1,500 | 41 | 0.00050744 | 0.51 |
| 6 | 15 | 3 | 1,500 | 30 | 0.0011139 | 0.48 |
| 7 | 45 | 4 | 750 | 20 | 0.00049506 | 0.29 |
| 8 | 15 | 4 | 2,250 | 26 | 0.00064358 | 0.42 |
| 9 | 15 | 4 | 750 | 18 | 0.00133668 | 0.4 |
| 10 | 30 | 5 | 2,250 | 28 | 0.00034655 | 0.45 |
| 11 | 30 | 3 | 750 | 28 | 0.00103964 | 0.48 |
| 12 | 30 | 4 | 1,500 | 32 | 0.00059408 | 0.5 |
| 13 | 30 | 5 | 750 | 15 | 0.00055695 | 0.29 |
| 14 | 45 | 5 | 1,500 | 21 | 0.00025991 | 0.4 |
| 15 | 30 | 4 | 1,500 | 29 | 0.00053838 | 0.49 |
| 16 | 30 | 4 | 1,500 | 30 | 0.00055695 | 0.5 |
3 Results and discussion
3.1 Two-body wear test
The two-body wear test can also be called an abrasive or a sliding wear test. The sample and counter surfaces were rolled or slid over one another to create a wear surface for two-body wear tests (26). Particles developed from the sample, creating a layer between the samples and the counter surface. Moreover, as the particles move across the surface in a subsequent motion, they begin to wear away. In most cases, the wear resulting from experimentation is called adhesive wear.
3.2 Wear characterization using Box–Behnken design
3.2.1 Raw data analysis (SWR and COF)
The histogram indicates the group range of the common repeats. Other names include the grouped frequency data. Figure 2(a) displays a frequency of 6 within the range of 0.00025909–0.000529101 and 7 outcomes from the interval of 0.000529101–0.000798292. Only 3 out of the 16 data points were derived from higher values. There are more opportunities to obtain the lowest SWR. In addition, it is positively skewed owing to the concentration of values in the lower value zone.
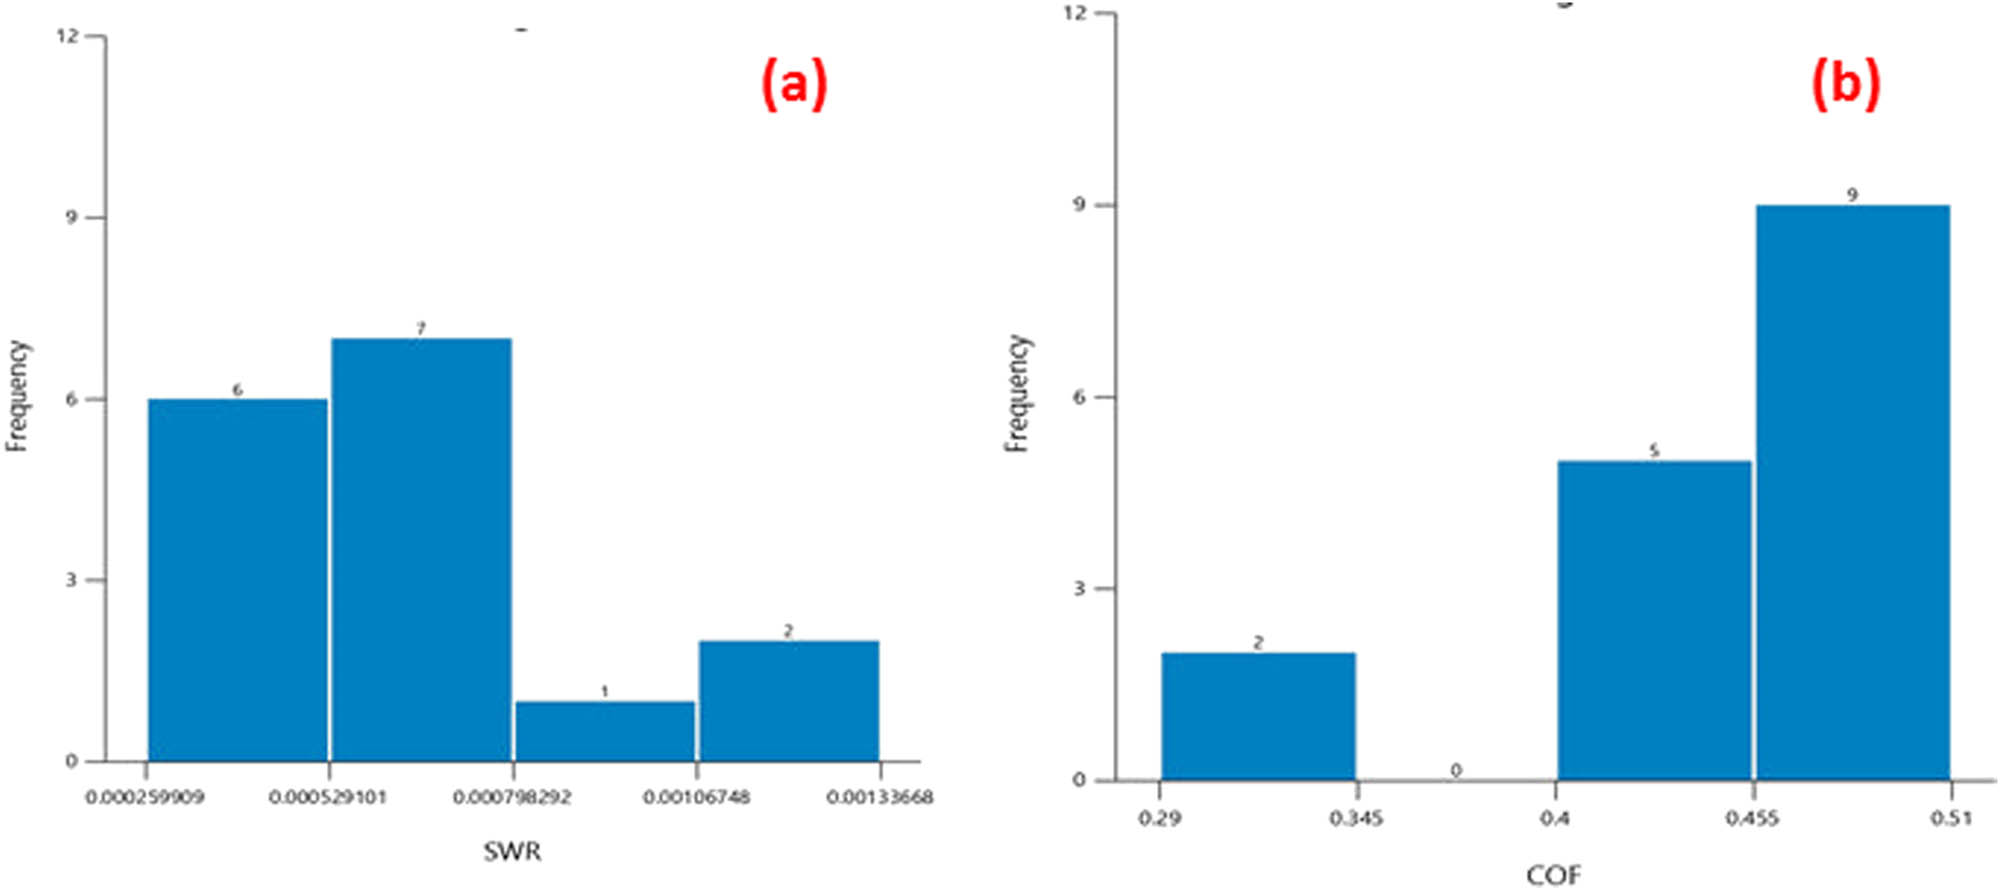
Histogram of (a) SWR and (b) COF.
A COF histogram is shown in Figure 2(b). Values fall between 0.4 and 0.51, while the two values range from 0.29 to 0.345. They also exhibit negative skewness because most values are in the higher range. Consequently, the COF increased when the input parameter was changed.
The Box plot describes the accumulation of a large portion of the data, which gives the possibility of the outcome for the specific input parameter. It also represents all the data in a graphical output. Figure 3(a) analyzes the relation between load and SWR. The highest SWR is obtained at 15 N load; also, it has a high interquartile range (IQR) compared to SWR at 30 and 45 N. It happens due to the removal of the matrix layer even at low load after that sustains the wear loss with the support of fiber and filler. Moreover, the treated fiber has more bonding strength that is why low SWR is obtained for the other two loads (30 and 45 N). At 30 N load, it has low IQR and two outliers at the maximum and minimum levels. Because of this, it has a high range for the obtained data. As discussed, a low range is obtained at 45 N load. It happens due to the treated fiber and filler. After removing the matrix layer, filler and treated fiber bind the matrix with a protected layer that has not been broken even by a higher load. SWR is inversely proportional to the load and distance, so for the same wear loss, if the load and sliding distance increase, then the SWR automatically decreased. The same trend happens in Figure 3(b) and (c). The velocity is not increasing the SWR because if speed increases, then contact time automatically decreased. This is the reason for obtaining minimum SWR at a maximum velocity of 4 and 5 m·s−1.
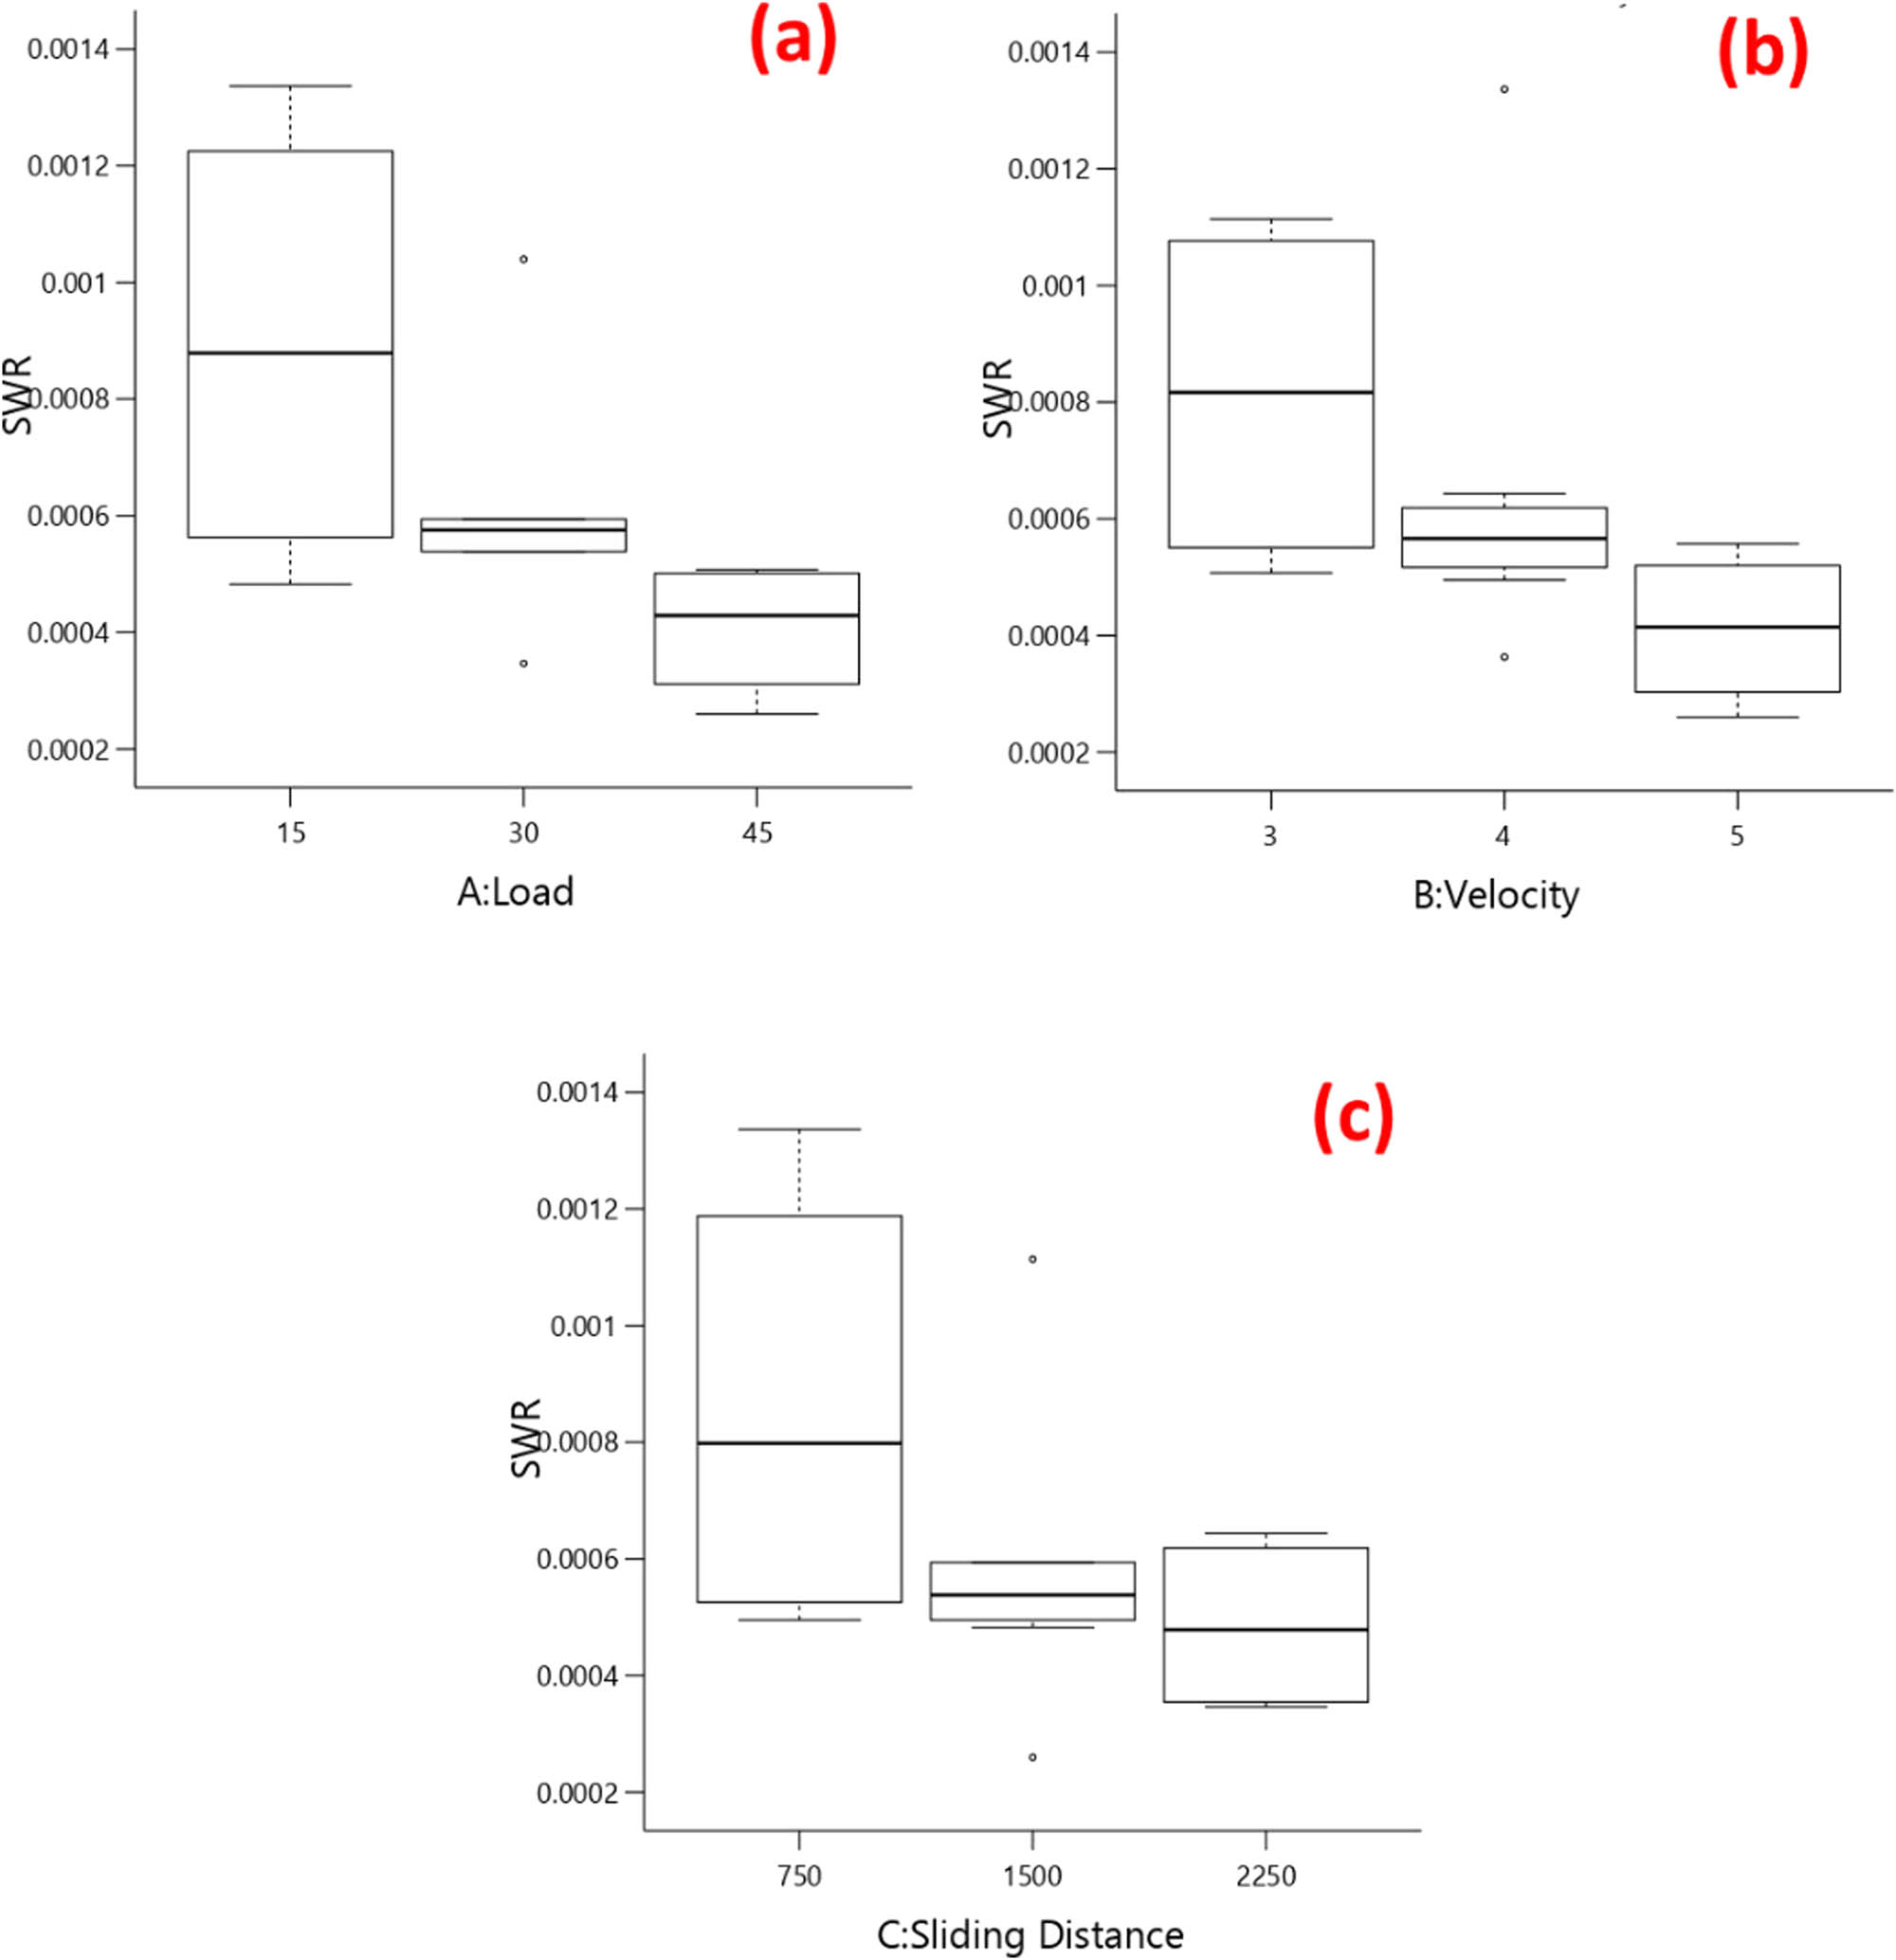
Box plot (a) load vs SWR, (b) velocity vs SWR, (c) sliding distance vs SWR.
The Box plot for the COF data with respect to input parameters is given in Figure 4. In Figure 4(a), the maximum COF of around 0.5 is obtained for all the load conditions because the wear loss is almost the same, which occurs at the matrix layer. One outlier is obtained at 30 N load, which increases the range, but IQR is low. High IQR is obtained at 45 N load, which leads to a minimum COF of below 0.5. It happens due to the hard inner layer because of the proper bonding of filler, treated fiber, and matrix. Once the weak matrix escaped, the hardened surface was smoothened by continuously rubbing the counter surface. In Figure 4(b), low IQR is obtained at 3 m·s−1. Then, around the same IQR is obtained at 4 and 5 m·s−1 load. Moreover, both are positively skewed, which means there is more possibility for lower COF value. In Figure 4(c), the highest IQR is obtained at a 750 m sliding distance, also positively skewed, which means the possibility of obtaining low COF at this condition. Then, low IQR is obtained at the maximum roughness position. It happens due to the abrasive wear. The debris started rubbing the sample when the sliding distance increased.
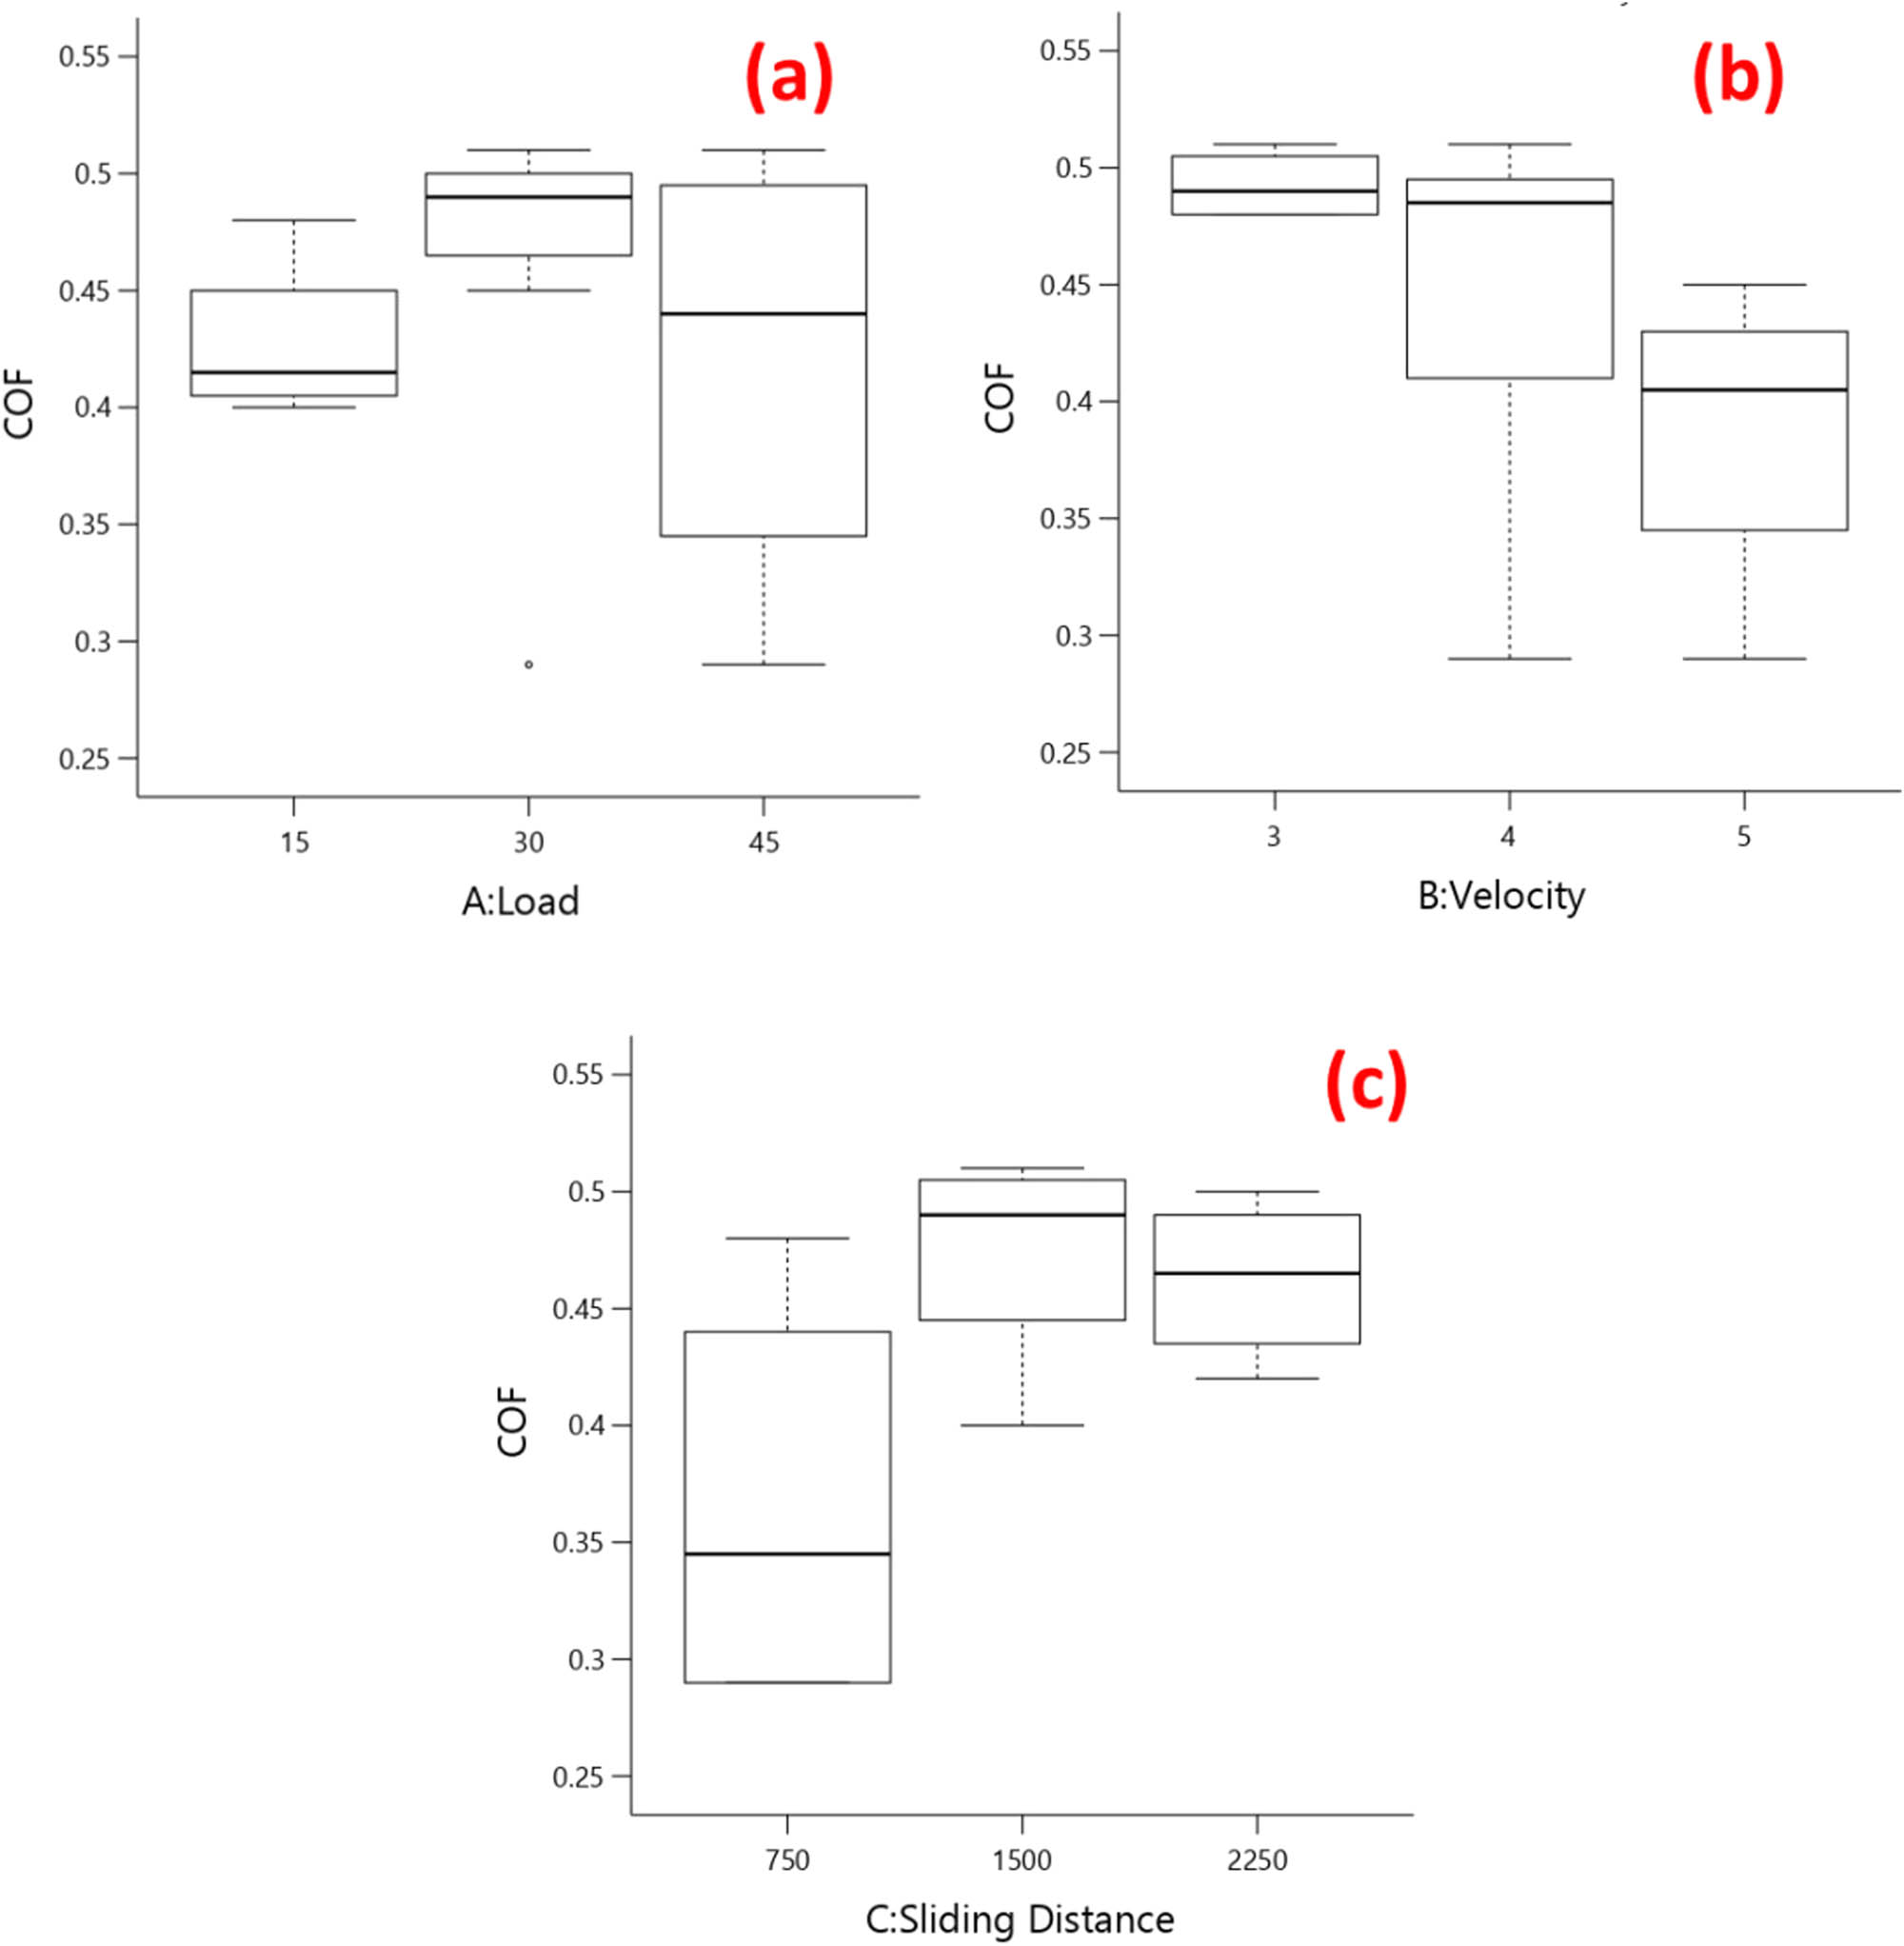
Box plot (a) load vs COF, (b) velocity vs COF, and (c) sliding distance vs COF.
3.2.2 Modal summary analysis
The modal summary analysis for SWR and COF is displayed in Tables 3 and 4. Quadratic equations (second-order polynomial) were selected for both investigations, such as SWR and COF. In addition, the cubic source is aliased, which is even more important as it prevents the analysis from becoming unpredictable and complex. The pure error must also be extremely low in order to yield a better forecast. The adjusted percentage and forecast R 2 values for the suggested model in Table 3 were 96.03% and 78.09%, respectively, with an accuracy level near 100%. The SWR has a solid prediction (27). The adjusted percentage and forecasted R 2 value for the suggested model in Table 4 were 95.24 and 74.68, respectively. The COF also had a good prediction in this instance because its accuracy was close to 100%.
Modal summary for SWR
| Source | Std. dev. | R² | Adjusted R² | Predicted R² | Press | |
|---|---|---|---|---|---|---|
| Linear | 0.0001 | 0.8450 | 0.8063 | 0.6853 | 3.999 × 10⁻⁷ | |
| 2FI | 0.0001 | 0.9468 | 0.9114 | 0.7770 | 2.834 × 10⁻⁷ | |
| Quadratic | 0.0001 | 0.9841 | 0.9603 | 0.7809 | 2.784 × 10⁻⁷ | Suggested |
| Cubic | 0.0000 | 0.9976 | 0.9878 | * | Aliased |
*Represents not suitable for prediction.
Modal summary for COF
| Source | Std. dev. | R² | Adjusted R² | Predicted R² | Press | |
|---|---|---|---|---|---|---|
| Linear | 0.0540 | 0.5405 | 0.4257 | 0.1798 | 0.0625 | |
| 2FI | 0.0500 | 0.7050 | 0.5083 | 0.0933 | 0.0691 | |
| Quadratic | 0.0155 | 0.9810 | 0.9524 | 0.7468 | 0.0193 | Suggested |
| Cubic | 0.0096 | 0.9964 | 0.9819 | * | Aliased |
*Represents not suitable for prediction.
3.2.3 Analysis of variance
Details of the analysis of the SGOSF-reinforced epoxy with 7.5 wt% of tamarind seed powder composites' SWR, and COF are presented in Tables 5 and 6.
ANOVA for SWR
| Source | Sum of squares | df | Mean square | F-value | P-value | Percentage contribution |
|---|---|---|---|---|---|---|
| Model | 1.251 × 10⁻⁶ | 9 | 1.389 × 10⁻⁷ | 41.35 | 0.0001 | Significant |
| A-load | 4.760 × 10⁻⁷ | 1 | 4.760 × 10⁻⁷ | 141.66 | <0.0001 | 38.06 |
| B-velocity | 3.236 × 10⁻⁷ | 1 | 3.236 × 10⁻⁷ | 96.31 | <0.0001 | 25.88 |
| C-sliding distance | 2.742 × 10⁻⁷ | 1 | 2.742 × 10⁻⁷ | 81.60 | 0.0001 | 21.93 |
| AB | 3.680 × 10⁻⁸ | 1 | 3.680 × 10⁻⁸ | 10.95 | 0.0162 | 2.94 |
| AC | 7.870 × 10⁻⁸ | 1 | 7.870 × 10⁻⁸ | 23.42 | 0.0029 | 6.29 |
| BC | 1.382 × 10⁻⁸ | 1 | 1.382 × 10⁻⁸ | 4.11 | 0.0889 | 1.10 |
| A² | 1.001 × 10⁻⁸ | 1 | 1.001 × 10⁻⁸ | 2.98 | 0.1351 | 0.80 |
| B² | 2.554 × 10⁻⁹ | 1 | 2.554 × 10⁻⁸ | 0.7601 | 0.4168 | 0.20 |
| C² | 3.485 × 10⁻⁸ | 1 | 3.485 × 10⁻⁸ | 10.37 | 0.0181 | 2.79 |
| Residual | 2.016 × 10⁻⁸ | 6 | 3.360 × 10⁻⁹ | — | — | — |
| Lack of fit | 1.706 × 10⁻⁸ | 3 | 5.686 × 10⁻⁹ | 5.50 | 0.0976 | Not significant |
| Pure error | 3.102 × 10⁻⁹ | 3 | 1.034 × 10⁻⁹ | — | — | — |
| Cor total | 1.271 × 10⁻⁶ | 15 | — | — | — | — |
ANOVA for COF
| Source | Sum of squares | df | Mean square | F-value | P-value | Percentage contribution |
|---|---|---|---|---|---|---|
| Model | 0.0747 | 9 | 0.0083 | 34.36 | 0.0002 | Significant |
| A-load | 0.0001 | 1 | 0.0001 | 0.4655 | 0.5205 | 0.15 |
| B-velocity | 0.0220 | 1 | 0.0220 | 91.24 | <0.0001 | 29.51 |
| C-sliding distance | 0.0190 | 1 | 0.0190 | 78.67 | 0.0001 | 25.44 |
| AB | 0.0004 | 1 | 0.0004 | 1.66 | 0.2457 | 0.54 |
| AC | 0.0072 | 1 | 0.0072 | 29.90 | 0.0016 | 9.67 |
| BC | 0.0049 | 1 | 0.0049 | 20.28 | 0.0041 | 6.56 |
| A² | 0.0064 | 1 | 0.0064 | 26.48 | 0.0021 | 8.56 |
| B² | 0.0002 | 1 | 0.0002 | 0.9310 | 0.3719 | 0.30 |
| C² | 0.0144 | 1 | 0.0144 | 59.59 | 0.0002 | 19.27 |
| Residual | 0.0015 | 6 | 0.0002 | — | — | — |
| Lack of fit | 0.0012 | 3 | 0.0004 | 4.27 | 0.1319 | Not significant |
| Pure error | 0.0003 | 3 | 0.0001 | — | — | — |
| Cor total | 0.0762 | 15 | — | — | — | — |
The analysis in Tables 5 and 6 emphasizes the influence of individual and interaction parameters and their significance levels. The probability level was increased by controlling the noise levels of the parameters. This describes the validation of the optimal output parameters. The F-value of 41.35 in the table indicates the significance of the model. An F-value of this large could only occur owing to noise in 0.01% of cases. The lack-of-fit F-value (5.50) indicates the presence of a 9.76% probability of noise being the cause of a large lack-of-fit F-value. This is undesirable because the model is to fit (28). This rate is very low (10%). An F-value of 34.36 (Table 6) indicated the significance of the model.
In Table 6, for COF, the obtained F-value is 34.36, which explains why a noise level exists in 0.02% of cases. The “lack of fit of P-value” is seen as “insignificant” compared with the pure mistake because of the obtained value of 4.27. A large “lack-of-fit F-value” had a 13.19% likelihood of being caused by noise. A non-significant lack of fit was observed due to the model’s desire to fit. The model was considered significant when the P-value was less than 0.05 (28). The individual and interaction noise levels are responsible for the COF. If it is greater than 0.1000, the noise level is significant, and the influence level decreases. We expect a high number of squares and mean squares to achieve a significant level. The low sum of square values of 0.0002 and 0.0004 highlighted that the position has more noise.
3.2.4 Normality testing
The normal plot of the residuals, as shown in Figure 5(a) and (b), was used to determine the accuracy of the responses, including the SWR and COF. The residuals represent the disparity between observed and projected values. Consequently, there was a decrease in residuals close to the accuracy line. This highlights the typical feature of incorrect numbers. The data were evenly dispersed and were highly powerful. 50% of the data were almost certainly on the negative side, considering that data in the positive and negative regions were present in equal amounts. In contrast, the remaining 50% of the samples were positive. These data eventually resulted in a more precise prediction.
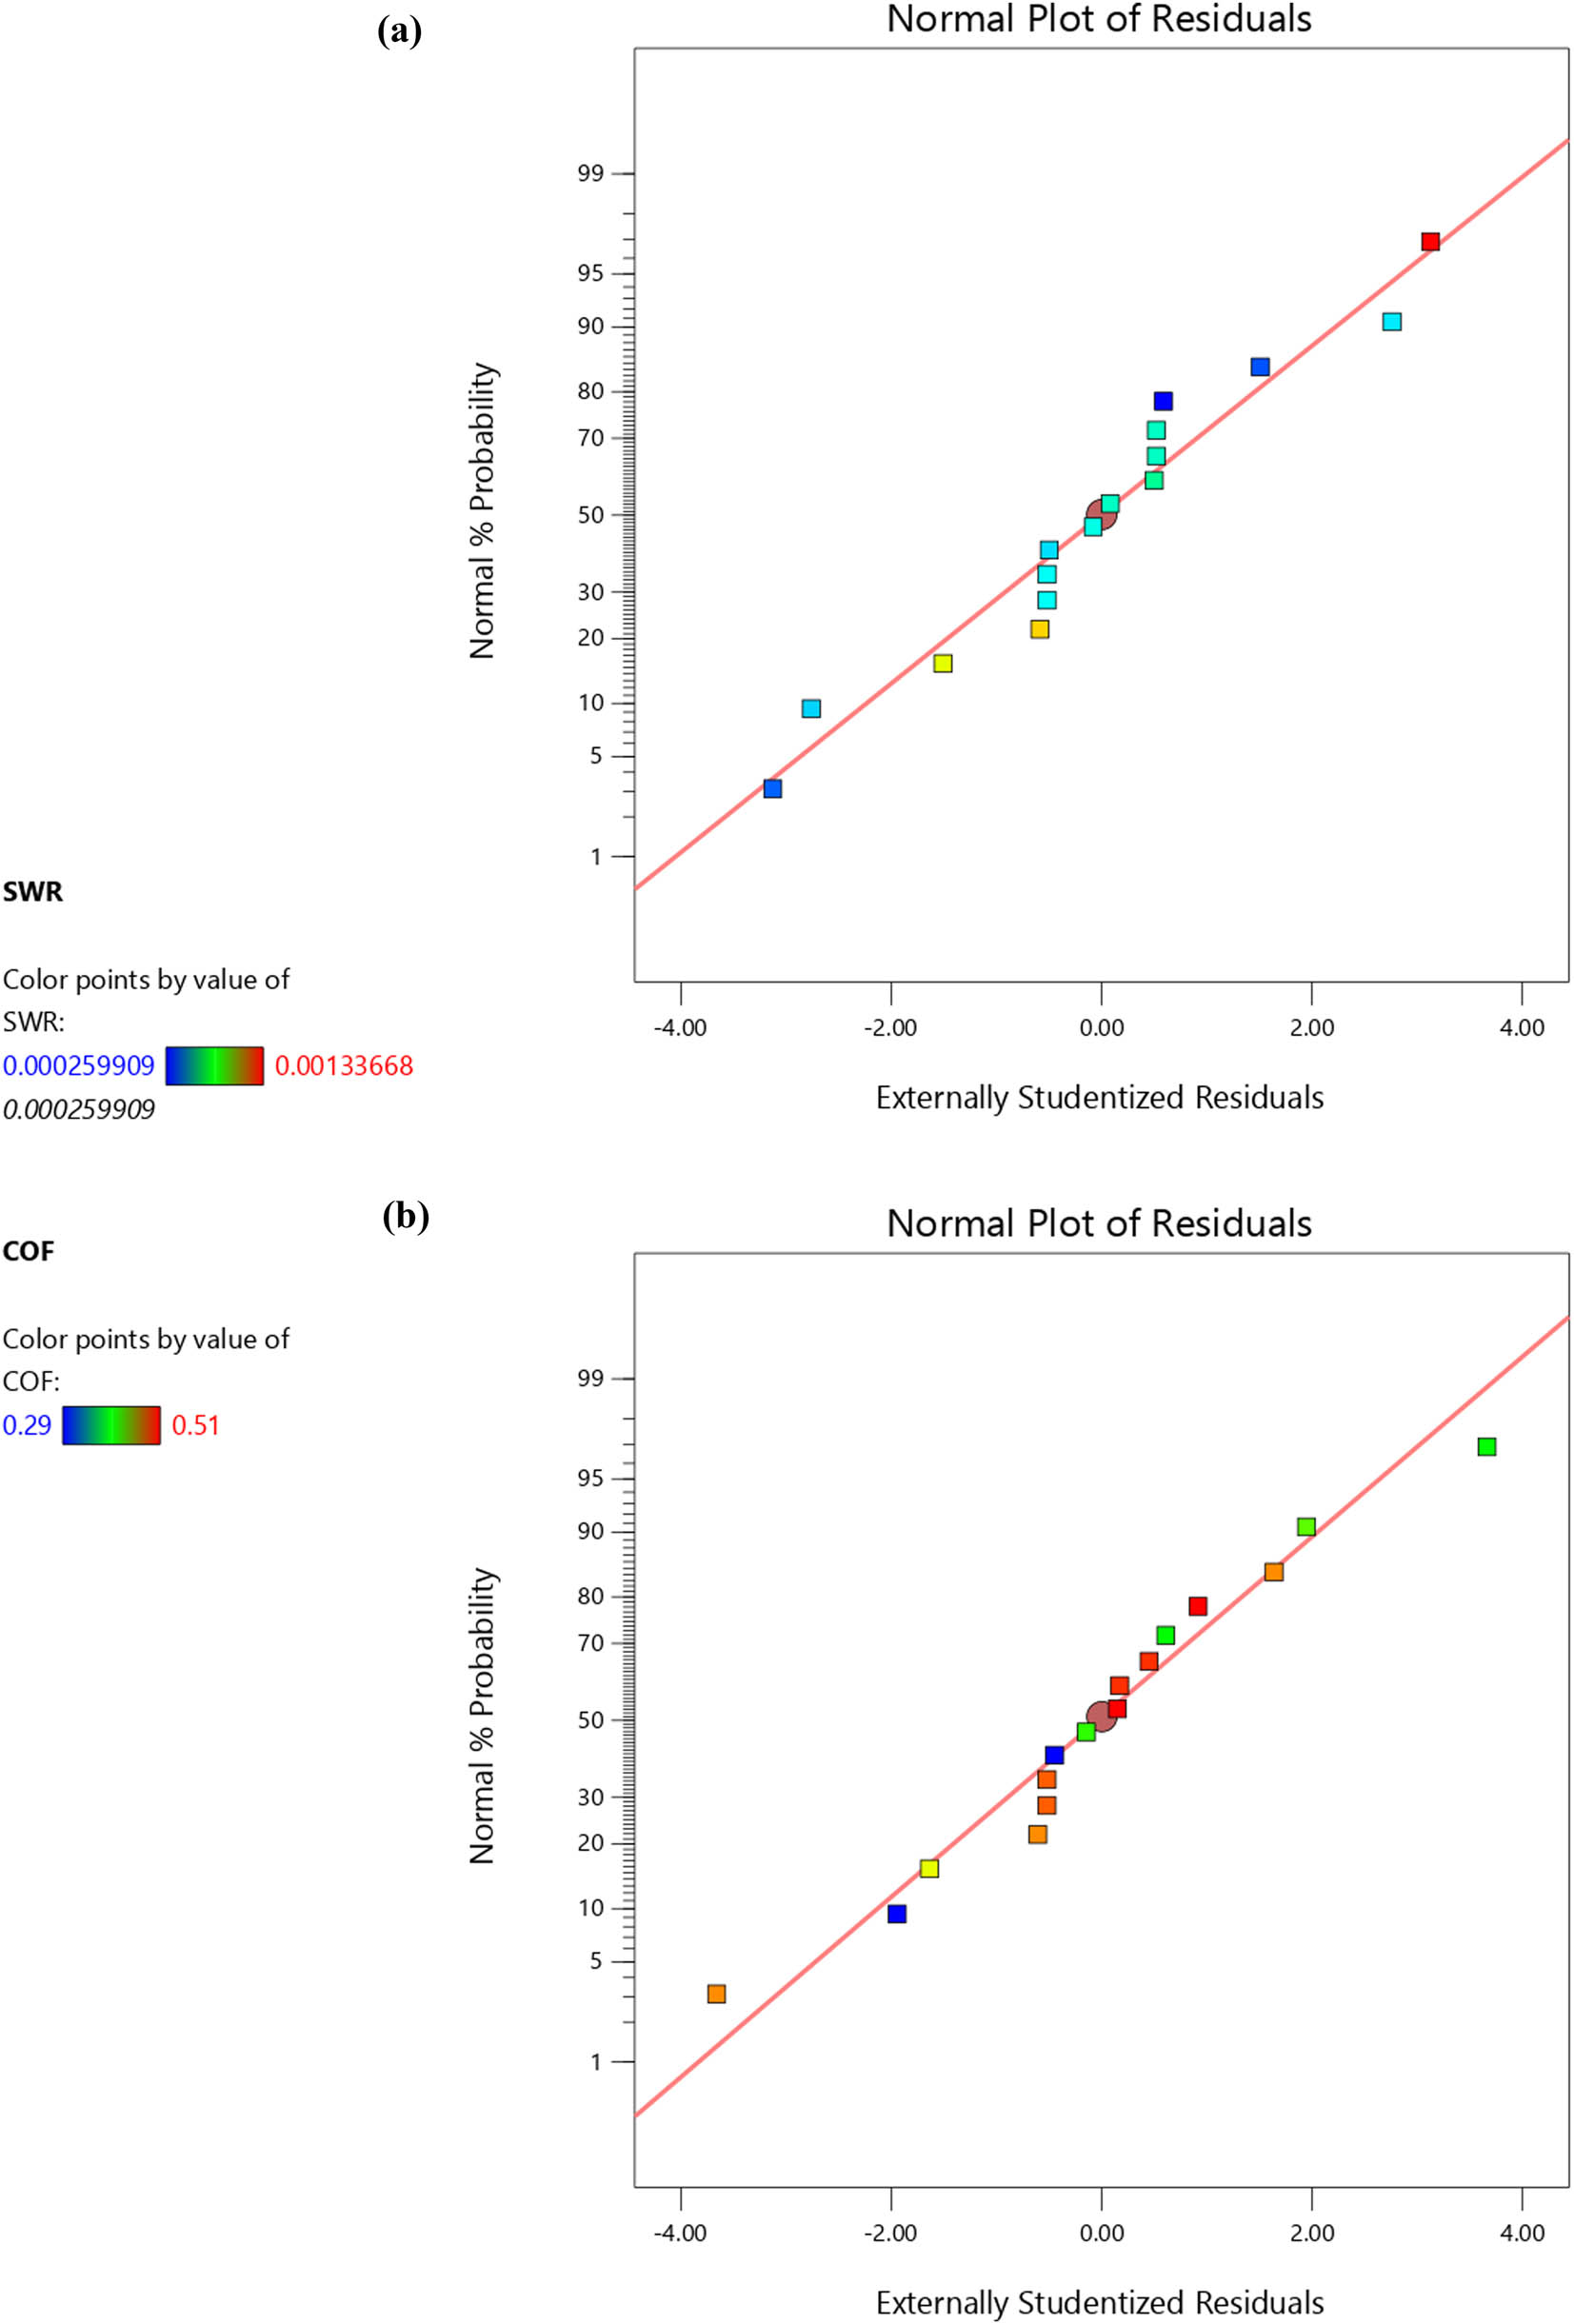
(a) SWR-normality plot and (b) COF-normality plot.
3.2.5 Contour plot evaluation
Figure 6 shows a 3D surface plot of the SWR for various input parameters, which can be used to determine the ideal filler content condition for a given wear rate. The precise wear rates for each experiment ranged from 0.000259909 to 0.00133668 mm3·N m−1. The variation in SWR from the outcome of the pin-on-disc apparatus against selected input parameter load and velocity by keeping the sliding distance constant (1,500 m). The load and velocity have negative action with the SWR (Figure 6(a)). The optimized input parameters such as load, sliding velocity, and their interaction increase with a decrease in the SWR. This is relatively uncommon in many circumstances because of the strong connection between the fiber and matrix and favorable wear behavior. A higher SWR was produced in the initial condition owing to matrix wear; however, once the wear was complete, the matrix and fiber had a strong bond and did not break readily within the chosen range.
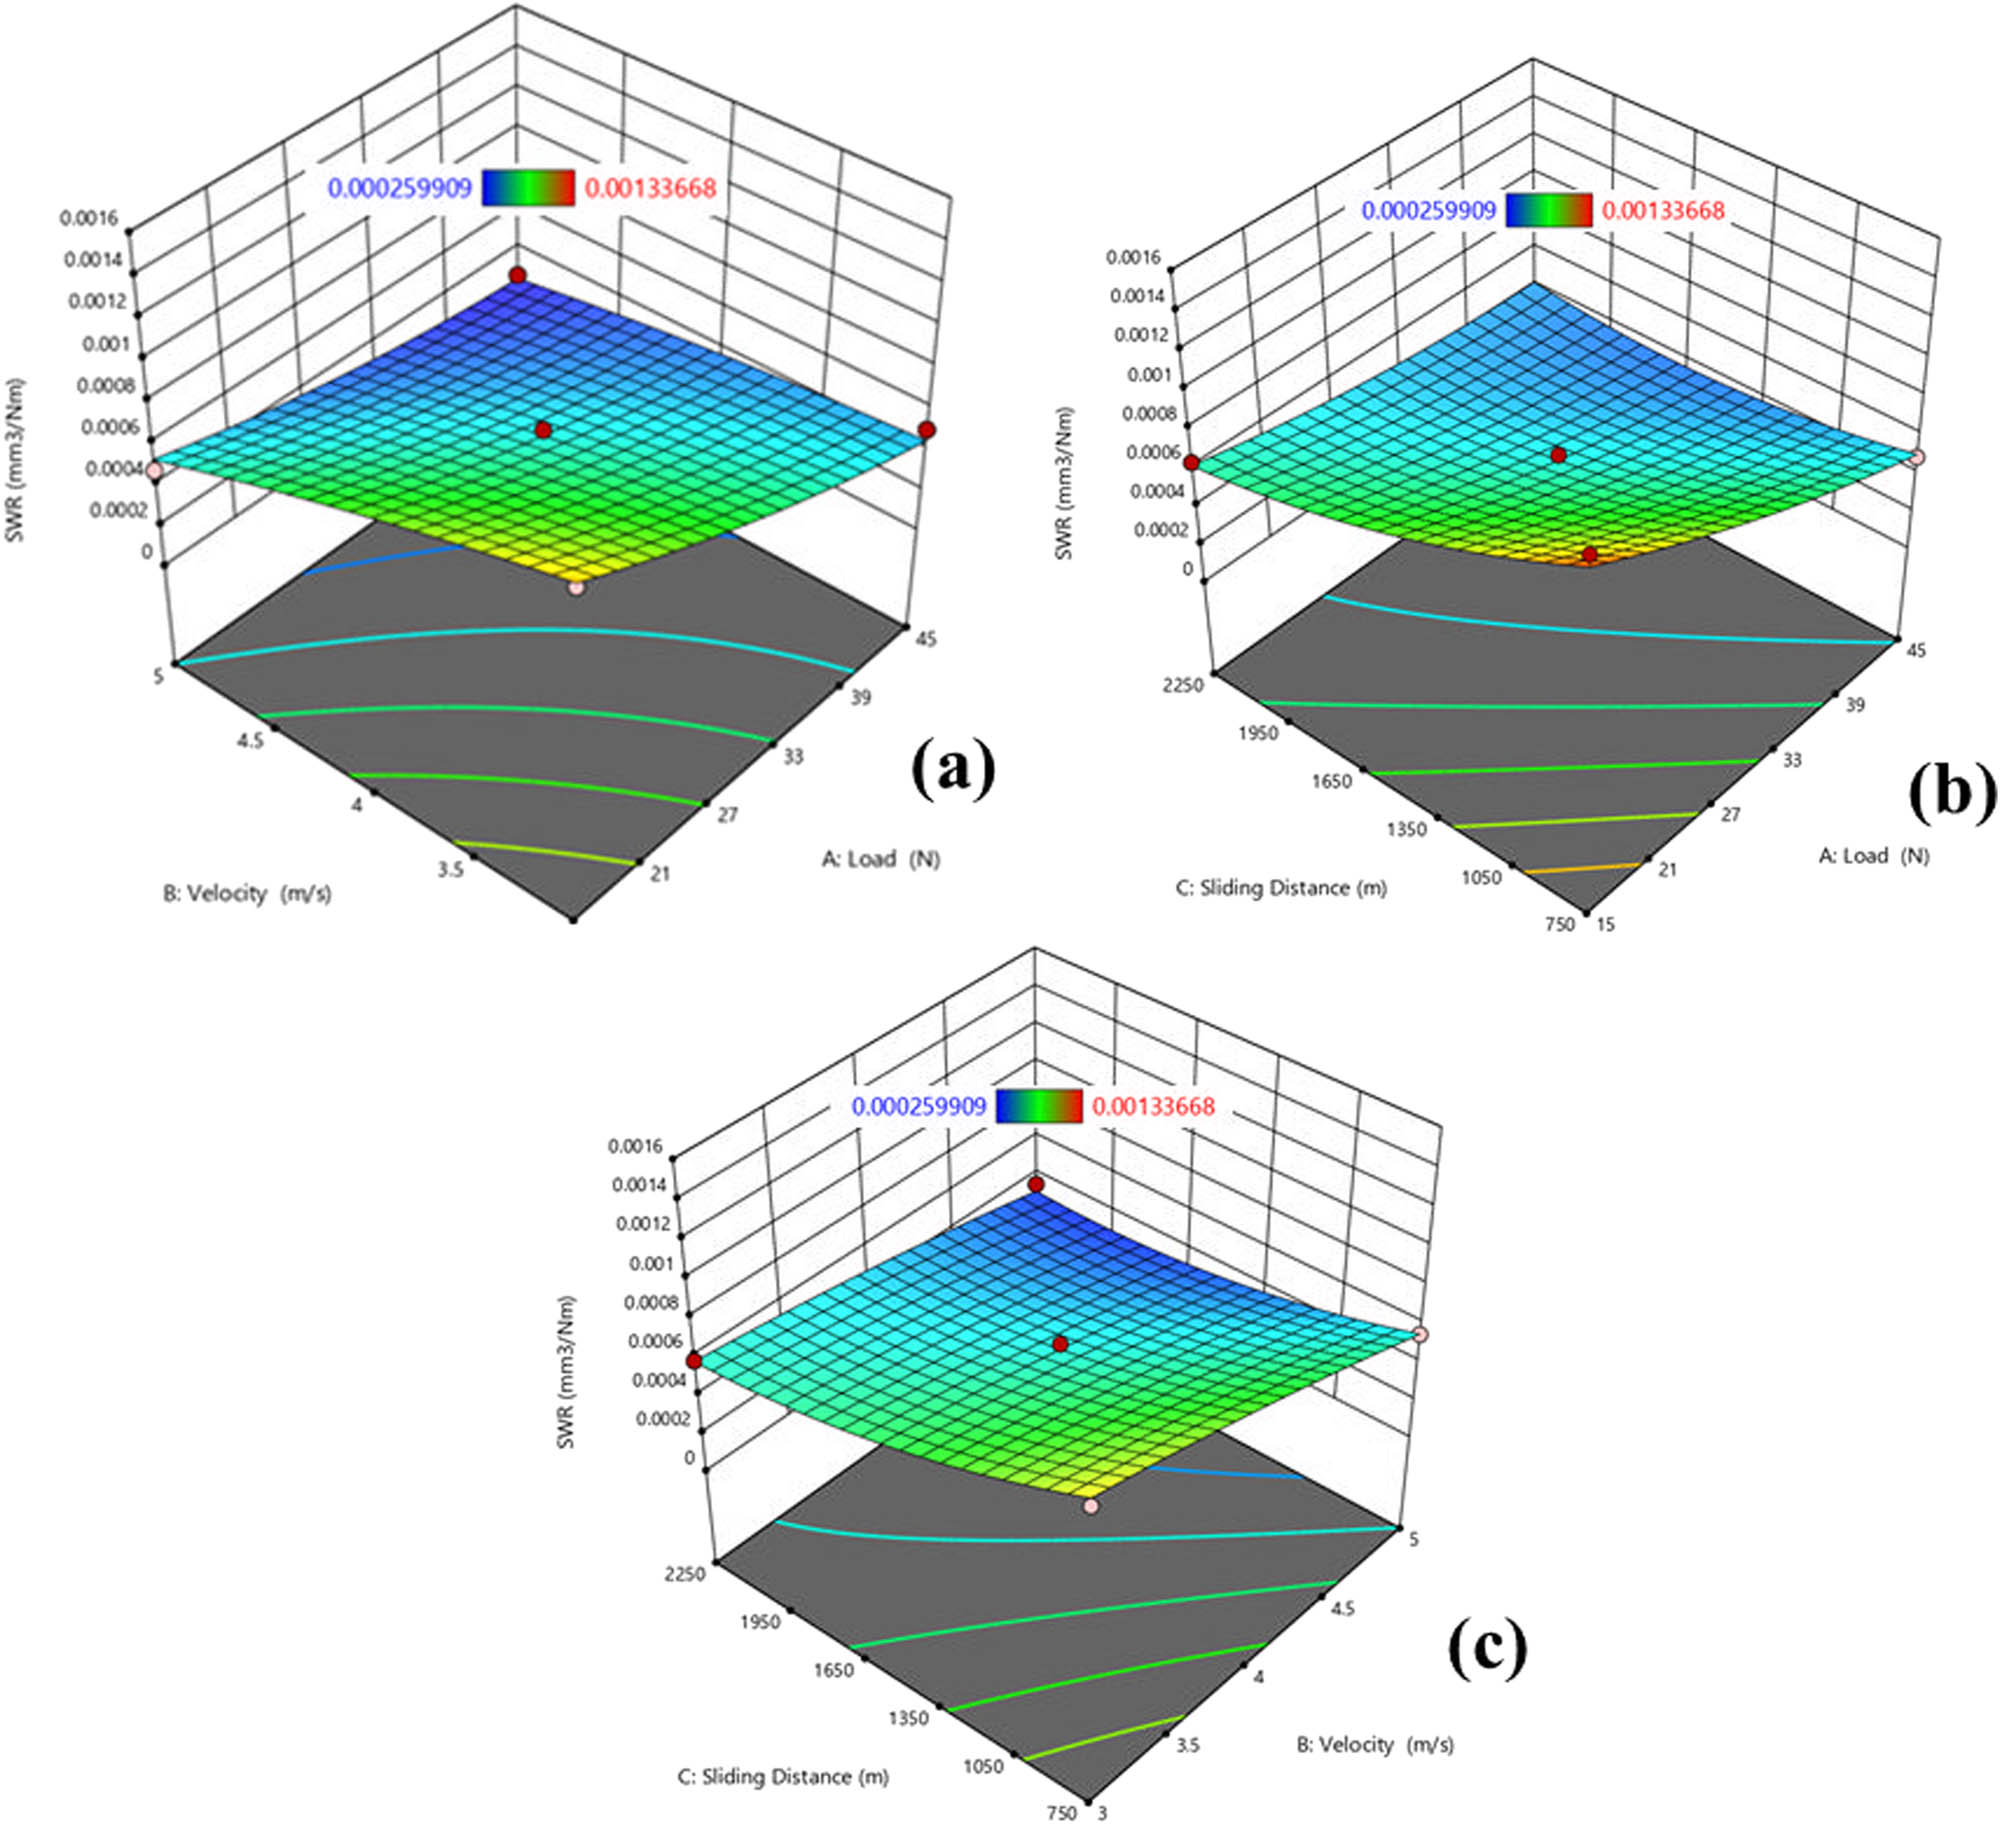
SWR contour plot, (a) velocity–load, (b) sliding distance–load, and (c) sliding distance–velocity.
Additionally, the velocity increased with a decrease in the contact time; therefore, wear loss did not occur in progressively increasing order. Figure 6(b) shows the fluctuations in the SWR of the pin-on-disc apparatus with respect to the load and sliding distance. By contrast, the sliding velocity was maintained at 4 m·s−1. The relationship among the load, sliding distance, and SWR was inverse. The load, sliding distance, and interactions increased with decreasing SWR. The wear rate initially increased and remained constant owing to the bonding between the fibers and the matrix. Hence, an increase in the sliding distance did not cause any increase in wear loss. This was likely to continue if this trend did not exceed the limit. Figure 6(c) illustrates the variations in the SWR in the pin-on-disc apparatus with respect to the sliding distance and velocity when the load was maintained constant at 30 N. The SWR, sliding distance, velocity, and their interactions all exhibited a negative relationship. As the sliding velocity and distance increased, SWR decreased.
The COF contour plots were used to display the effects of the input parameters on the COF. All surface maps provided the minimum and highest COF values, which were 0.29 and 0.51, respectively. Figure 7(a) shows the COF fluctuations in the pin-on-disc apparatus with respect to the load and sliding velocity when the sliding distance was maintained at 1,500 m. The SWR was negatively correlated with load and sliding velocity. With an increase in COF, the load and sliding velocity also increased, changing the phenomenon when both increased. The highest COF is achieved at a load of 45 N.

COF contour plot: (a) velocity–load, (b) sliding distance–load, and (c) sliding distance–velocity.
Figure 7(b) depicts the COF fluctuations in the pin-on-disc apparatus when the sliding velocity was held constant at 4 m·s−1. The changes only happened in load and sliding distance. The relationships between the load, sliding distance, and WR were positive. The load, sliding distance, and interactions increased with an increase in COF. Figure 7(c) illustrates the fluctuations in the SWR of the pin-on-disc apparatus. The input parameters such as sliding distance and velocity are the varying factors. Simultaneously, the load was maintained at 30 N. The SWR and the interplay between the sliding distance and velocity were negatively correlated. There was an increase in the SWR following an increase in the sliding length. A sliding distance of 2,250 m was reached before maximum roughness was attained. There was an increase in the sliding speed following a decrease in COF. The regression formulae for the coded and actual SWR data are shown in Eqs. 3 and 4
The regression formulae for the coded and actual COF data are shown in Eqs. 5 and 6
For the coded equation, the maximum level was taken as +1, and the minimum level was taken as −1. The middle level is defined as 0. However, in the actual equation, the original values and their units are used for the regression equation. The coefficient value emphasizes the influence level of each individual and interaction parameter. In all the equations, the first value represents the highest value compared to all the other parameters. The positive sign of the coefficient increases the response value, and the negative indication of the coefficient value decreases the response value. Anticipating the reaction for specific levels of each factor was possible using an equation expressed in terms of real factors. In the SWR equation, all the independent relative positions were negative. Therefore, it has a negative correlation with SWR. In the COF equation, A and B are negatively correlated, and C exhibits a positive relative movement when it increases.
3.2.6 Ideal parameter evaluation
Statistical analyses were performed to determine statistical significance. After obtaining the experimental and predicted results, the minimum difference was preferable. The anticipated SWR and COF excluded the unimportant parameters (P > 0.05). The design expert optimization model obtained the lowest wear rate by maintaining the ideal input parameters, such as a load of 44.99 N, a sliding distance of 1,701.39 m, and a sliding velocity of 3.36 m·s−1. A ramp plot was used at the desired level of 1.
The maximum COF was attained by preserving the ideal input parameters, such as a load of 42.15 N, a sliding distance of 1,874.86 m, and a sliding velocity of 4.99 m·s−1. A ramp plot was used at the desired level of 0.927. Jenish et al. (7) reported similar findings in their experimental analysis. The optimal parameters for SWR and COF are shown in Figure 8(a) and (b), respectively. The comparative discussion of experimental and analytical results for the minimum input parameter is shown in Table 7. The calculated error percentage for both the responses is around 5% to 6%, which describes the reliability of the model. The polynomial second order regression equation for the original value was used to find the analytical result.
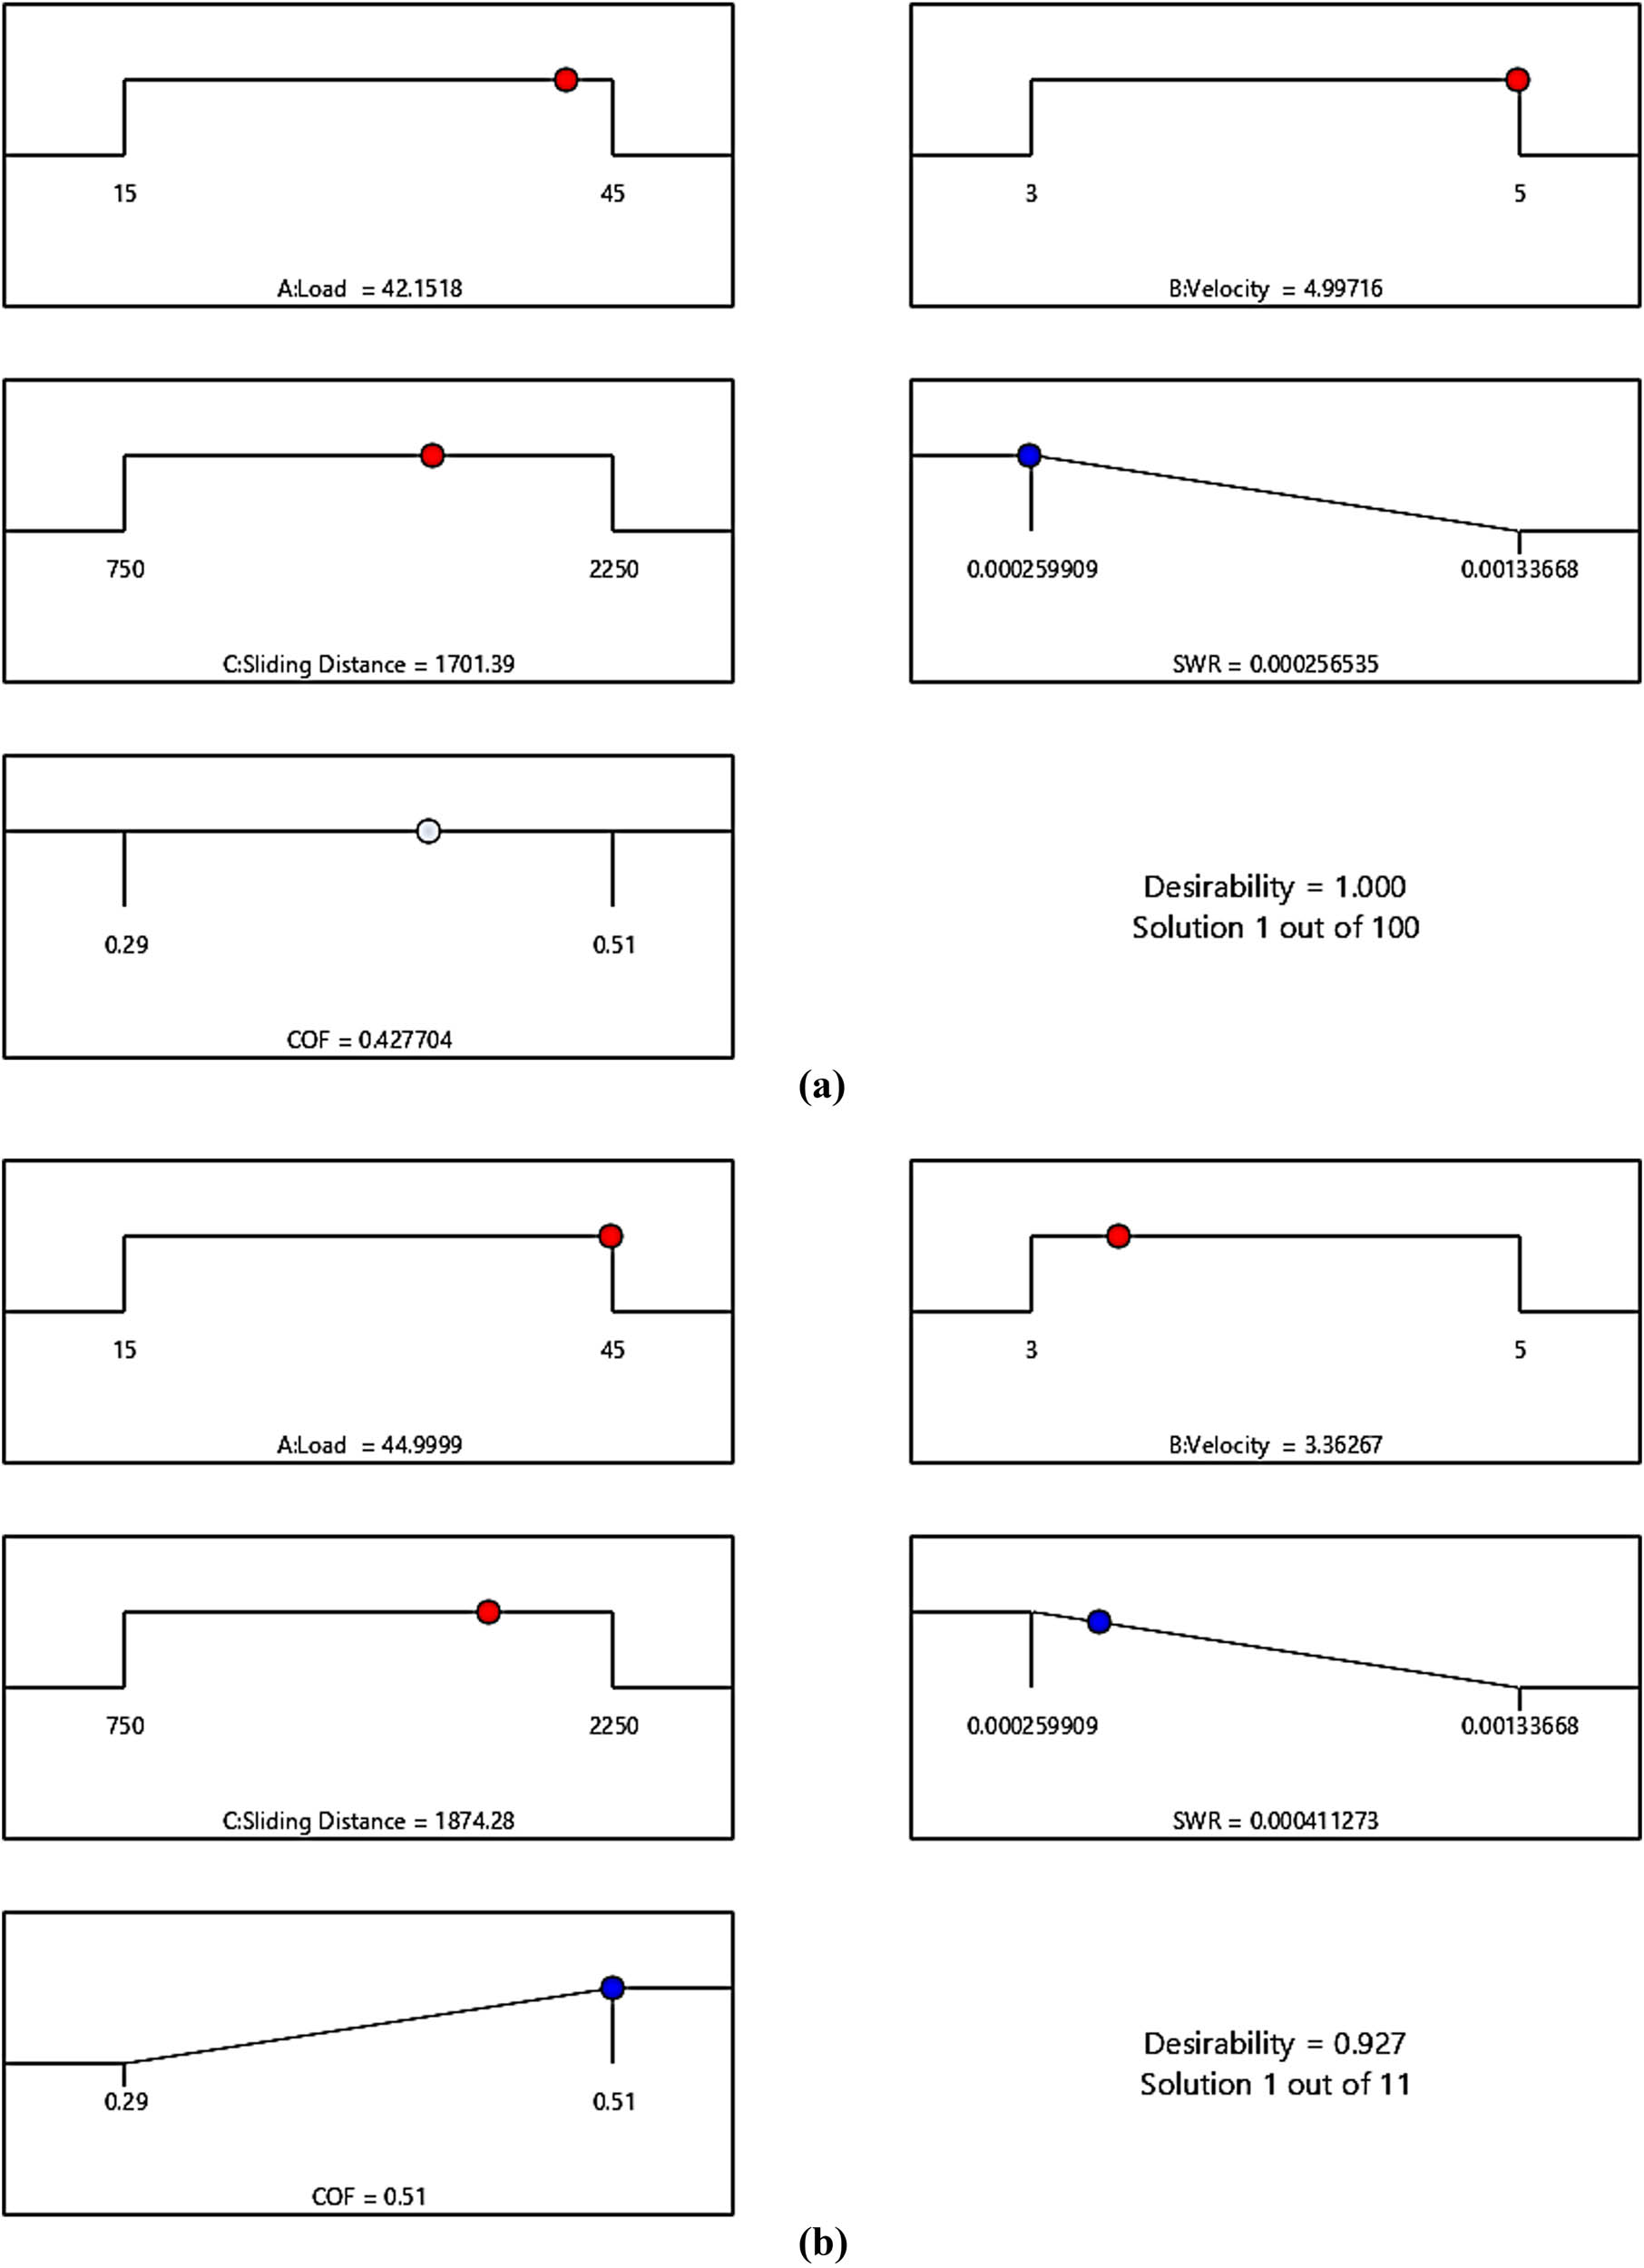
(a) Requirement for the lowest SWR and (b) requirement for the maximum COF.
Comparative study table
| Load (N) | Sliding velocity (m·s−1) | Sliding distance (m) | SWR (mm3·N m−1) | COF | ||
|---|---|---|---|---|---|---|
| Analytical | Experimental | Analytical | Experimental | |||
| 10 | 1,500 | 0.001202 | 0.00112988 | 0.462 | 0.452 | |
3.3 Morphological study
SEM investigation done on the worn surfaces to study the wear mechanism such as wear debris, matrix crack, fiber crack, fiber pullout, and delamination may be used to study the wear mechanism of the produced samples. The essential wear characteristics were examined from the worn surfaces of fabricated samples at various input parameters.
Figure 9(a) and (b) shows the R-4 run conditions. Low wear loss occurred in this scenario due to the load input load (15 N) and the short sliding distance (1,500 m). Their worn surfaces were observed to be smooth. The primary plateaus occur during the sliding of the matric soft layer, and the hard layer starts scrubbing after a few minutes owing to the contact time and load, which affects the primary layers. The broken pieces also wear over the sliding surface, which worsens the situation (29).
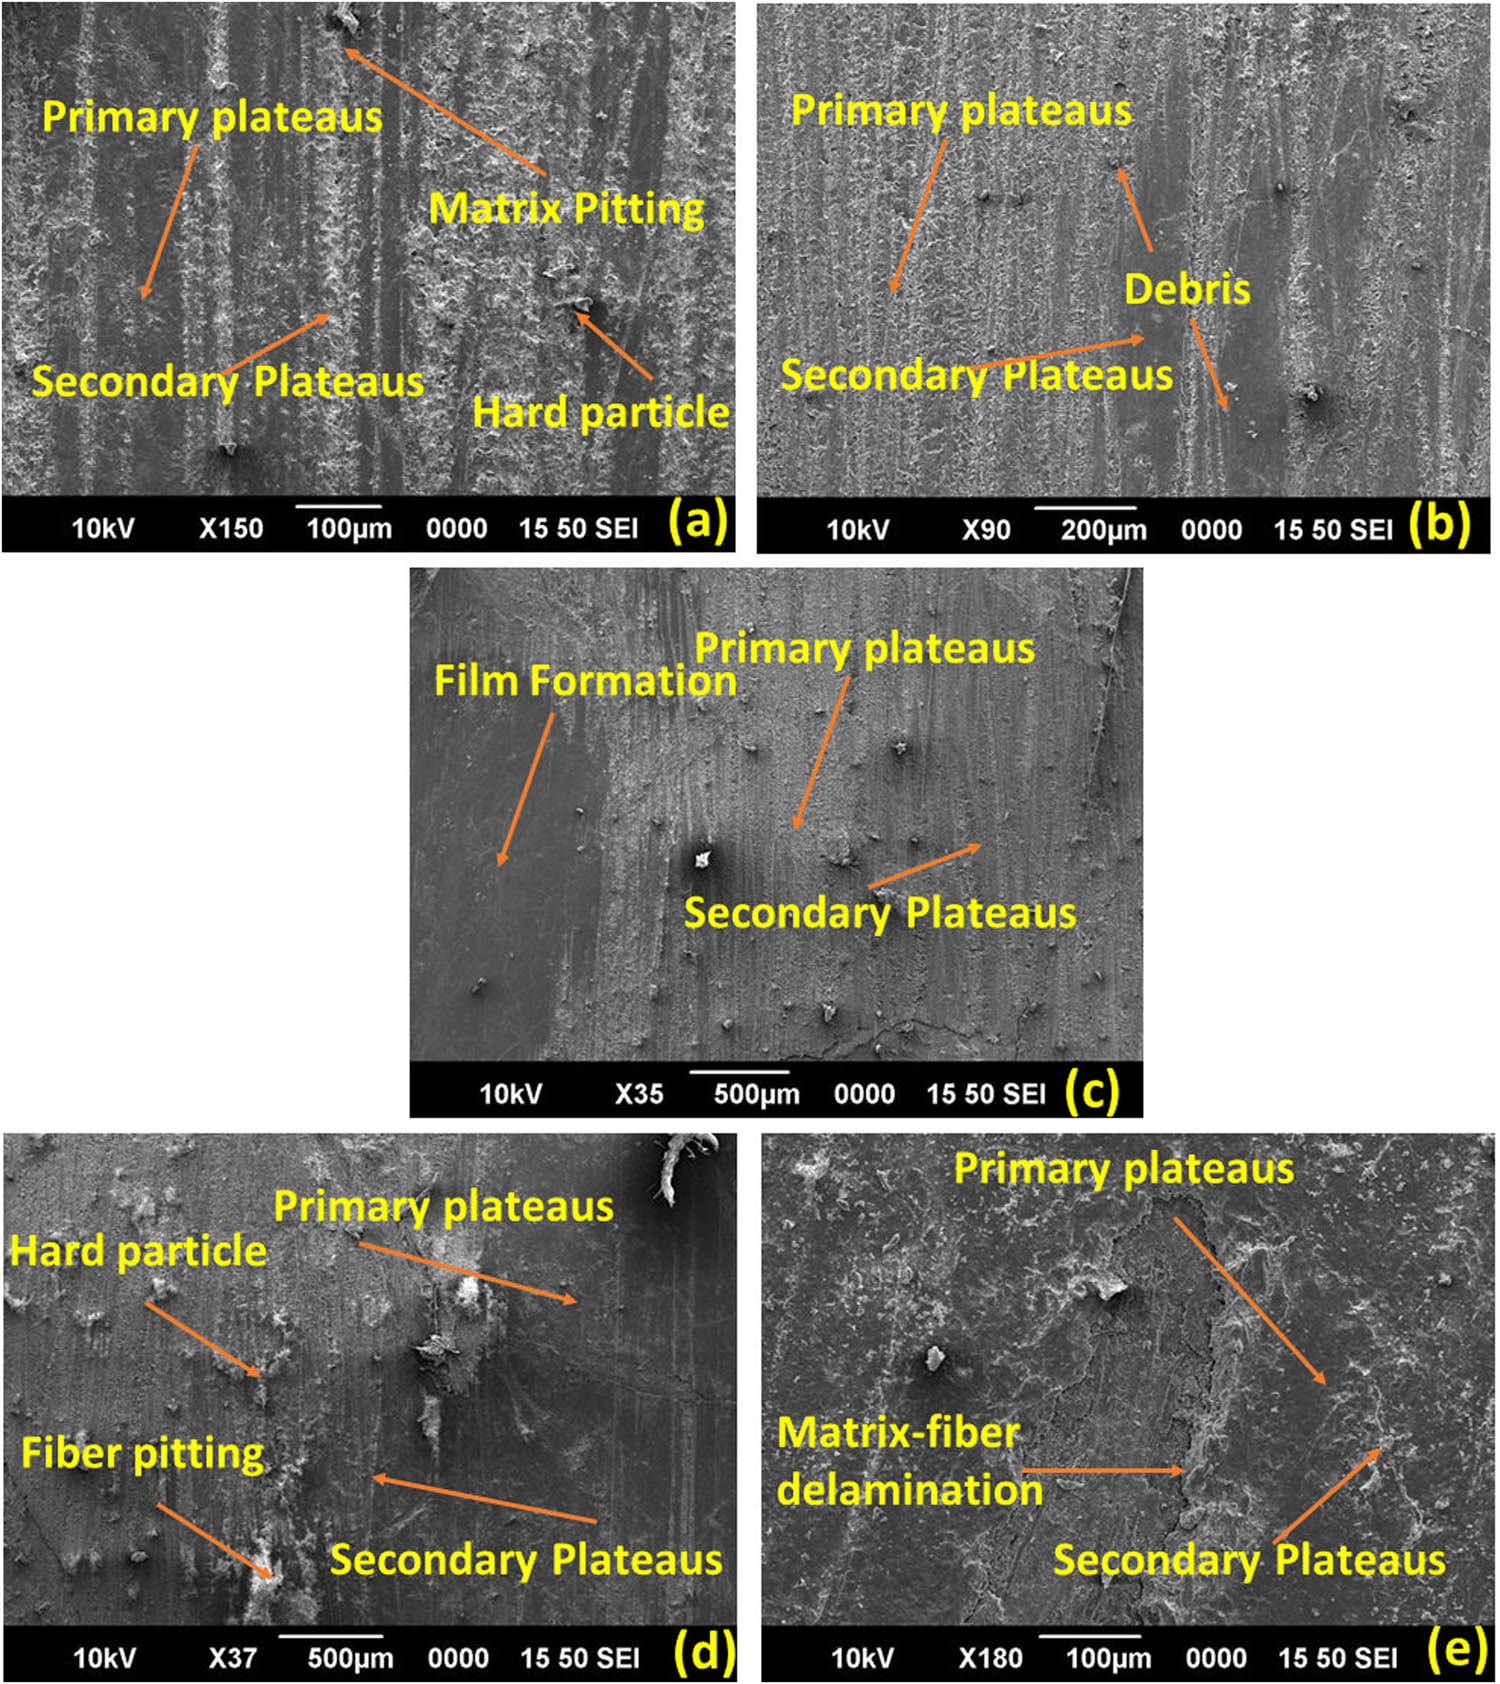
SEM image after wear test: (a) and (b) R-4, (c) R-1, (d) R-5, and (e) R-2 (R – run from the design Table 2).
As shown in Figure 9(c), the experimental condition shows minimal debris with considerable amount of adhesive wear and contact plateaus occurring on the worn surface. In this case, the sliding distance was 2,250 m, but it had little effect. The contact resin surface is first worn away, and the primary trash rolls on the counter surface when the hard surface begins. Therefore, excessive particle removal can be reduced. The fabrication method controls the wear behavior, which subsequently influences the wear mechanism (30). As a result, a large amount of debris developed on the worn surfaces. Meanwhile, layer formation on the worn surface due to the friction force forms adhesive wear. In addition, primary and secondary plateaus developed on the worn surface. However, these plateaus were not effectively bound to the epoxy matrix, limiting the wear resistance of the sample.
Figure 9(d) depicts a worn surface micrograph of the experimental condition R-5, which had a rough surface. Due to separation of particles separated from the friction surface leads to a pit developed on the sample surface. The friction material’s strong load (45 N) and sliding distance (1,500 m) could readily soften the epoxy at high-temperature conditions. Several plateaus developed on the surfaces will ripped off from the worn surface due to the friction and shear stresses, preventing the plateaus from acting as a protective layer for the friction surface. Hard particles managed the overwear of the surfaces.
Figure 9(e) shows a substantial quantity of wear debris and a more significant fiber pitting on the worn surface under wear condition R-2, as well as microcracks over the fiber and loose material matrix, indicating a relatively rough worn surface caused by the maximum load and sliding distance. The primary and secondary plateaus did not protect the surface layer due to the excess load (45 N) and sliding distance (2,250 m). Furthermore, microcracks, wear debris, and pitting were formed sequentially under the influence of an unbearable normal load, shear load, and frictional heat, indicating a considerable decrease in the wear resistance of the sample.
4 Conclusion
The performances of the fabricated samples were evaluated by conducting hardness and wear tests. The SGOSF/epoxy composite materials with 7.5 wt% tamarind seed powder particulate-filled composite materials provided superior mechanical and tribological properties due to their unique characteristics. Statistical analyses were performed by comparing experimental and predicted results. The anticipated SWR and COF excluded insignificant parameters (P > 0.05). The lowest SWR was achieved by maintaining ideal input parameters, such as a load of 44.99 N, a sliding distance of 1,701.39 m, and a sliding velocity of 3.36 m·s−1. A ramp plot was used at the desired level of 1. The maximum COF was attained by preserving the ideal input parameters, such as a load of 42.15 N, a sliding distance of 1,874.86 m, and a sliding velocity of 4.99 m·s−1. A ramp plot was used at the desired level of 0.927. The fractography images substantiate the wear mechanism, such as primary plateaus, secondary plateaus, debris, matrix pitting, fiber pitting, film forming, and fiber–matrix delamination. This applies to high-gripping materials because a low wear loss is obtained at the maximum roughness value. Moreover, fiber treatment and filler incorporation really provided good wear resistance by increasing bonding strength. So, the particle removal rate drastically reduced even at maximum testing parameters.
Acknowledgments
This project was supported by Researchers Supporting Project number (RSP2023R315) King Saud University, Riyadh, Saudi Arabia. This work was supported by the National Research Foundation of Korea (NRF) grant funded by the Korea Government (MSIT) (No. 2021054783).
-
Funding information: This project was supported by Researchers Supporting Project number (RSP2023R315) King Saud University, Riyadh, Saudi Arabia. This work was supported by the National Research Foundation of Korea (NRF) grant funded by the Korea Government (MSIT) (No. 2021054783).
-
Competing interest: The authors declare no competing interests.
-
Data availability statement: All the data were included within the article.
References
(1) Jenish I, Veeramalai Chinnasamy SG, Basavarajappa S, Indran S, Divya D, Liu Y. Tribo-Mechanical characterization of carbonized coconut shell micro particle reinforced with Cissus quadrangularis stem fiber/epoxy novel composite for structural application. J Nat Fibers. 2020;19:2963–79. 10.1080/15440478.2020.1838988.Search in Google Scholar
(2) Paul R, Bhowmik S. Tribological behavior of micro coir filler reinforced polymer composite under dry, wet, and heated contact condition. J Nat Fibers. 2020;19:1–2092. 10.1080/15440478.2020.1798845.Search in Google Scholar
(3) García E, Louvier-Hernández JF, Cervantes-Vallejo FJ, Flores-Martínez M, Hernández R, Alcaraz-Caracheo LA. Mechanical, dynamic and tribological characterization of HDPE/peanut shell composites. Polym Test. 2021;98:98. 10.1016/j.polymertesting.2021.107075.Search in Google Scholar
(4) Omrani E, Menezes PL, Rohatgi PK. State of the art on tribological behavior of polymer matrix composites reinforced with natural fibers in the green materials world. Eng Sci Technol an Int J. 2016;19:717–36. 10.1016/j.jestch.2015.10.007.Search in Google Scholar
(5) Madhu S, Balasubramanian M. Influence of seaweed filler on dry sliding wear of carbon fiber reinforced epoxy composites. J Nat Fibers. 2020;19:1–1619. 10.1080/15440478.2020.1787916.Search in Google Scholar
(6) Sumesh KRJ. An investigation into the mechanical and wear characteristics of hybrid composites: Influence of different types and content of biodegradable reinforcements. Nat Fibers. 2020;19:1–2835. 10.1080/15440478.2020.1821297.Search in Google Scholar
(7) Jenish I, Gandhi VCS, Raj RE, Basavarajappa S, Indran S, Divya D. A new study on tribological performance of cissus quadrangularis stem fiber/epoxy with red mud filler composite. J Nat Fibers. 2020;19:1–3516. 10.1080/15440478.2020.1848709.Search in Google Scholar
(8) Sumesh KR, Kavimani V, Rajeshkumar G, Indran S, Khan A. Mechanical, water absorption and wear characteristics of novel polymeric composites: Impact of hybrid natural fibers and oil cake filler addition. Text. 2022;51:1–5937S. 10.1177/1528083720971344.Search in Google Scholar
(9) Sathishkumar TP, Kumar SA, Navaneethakrishnan P, Siva I, Rajini N. Synergy of cashew nut shell filler on tribological behaviors of natural-fiber-reinforced epoxy composite. Sci Eng Compos Mater. 2018;25:761–72. 10.1515/secm-2016-0243.Search in Google Scholar
(10) Ibrahem RA. Effect of sunflower seeds husk, peanut shell husk and vegetable oils on the tribological performance of basalt chopped fiber reinforced epoxy hybrid-composites. Tribol Ind. 2021;43:624–31. 10.24874/ti.1076.03.21.07.Search in Google Scholar
(11) Omri MA. Effect of tungsten carbide on mechanical and tribological properties of jute/sisal/E-glass fabrics reinforced natural rubber/epoxy composites. J Ind Text. 2017;48:713–37. 10.1177/1528083717740765.Search in Google Scholar
(12) Mysiukiewicz O, Sulej-chojnacka J, Kotkowiak M, Wi T, Piasecki A. Evaluation of the oil-rich waste fillers’ influence on the tribological properties of polylactide-based composites. Materials. 2022;15.10.3390/ma15031237Search in Google Scholar PubMed PubMed Central
(13) Parikh HH, Gohil PP, Husk R. Sliding wear experimental investigation and prediction using response surface method: fillers filled fiber reinforced composites. Mater Today Proc. 2019;18:5388–93. 10.1016/j.matpr.2019.07.566.Search in Google Scholar
(14) Zhou S, Wu Y, Zou H, Liang M, Chen Y. Tribological properties of PTFE fiber filled polyoxymethylene composites: The influence of fiber orientation. Compos Commun. 2021;28:100918.10.1016/j.coco.2021.100918Search in Google Scholar
(15) Arockiasamy FS. Experimental investigation on the effect of fiber volume fraction of sponge gourd outer skin fiber reinforced epoxy composites. Polym Compos. 2022;43(10):6932–42. 10.1002/pc.26754.Search in Google Scholar
(16) Felix Sahayaraj A, Muthukrishnan M, Ramesh M. Influence of Tamarindus indicaseed nano‐powder on properties ofLuffa cylindrica(L.) fruit waste fiber reinforced polymer composites. Polym Compos. 2022;43(9):6442–52.10.1002/pc.26957Search in Google Scholar
(17) Sabri Abbas Z, Kadhim MM, Mahdi Rheima A, Jawad Al-Bayati AD, Talib Abed Z, Dashoor Al-Jaafari FM, et al. Preparing hybrid nanocomposites on the basis of resole/graphene/carbon fibers for investigating mechanical and thermal properties. BioNanoSci. 2023;13:983–1011. 10.1007/s12668-023-01119-9.Search in Google Scholar
(18) Liu H, Wang Z, Pan B, Li M, Huang S, Lee JH, et al. Carbon felt/nitrogen-doped graphene/paraffin wax 3D skeleton regulated tribological performances of the MCPA6 composites: A novel strategy of oil embedding and transporting. Tribol Int. 2023 Jun;184:108440. 10.1016/j.triboint.2023.108440.Search in Google Scholar
(19) Vigneshwaran GV, Jenish I, Sivasubramanian R. Design, fabrication and experimental analysis of pandanus fibre reinforced polyester composite. Adv Mater Res. 2014;984:253–6. 10.4028/www.scientific.net/AMR.984-985.253.Search in Google Scholar
(20) Jenish VCSGI. Mechanical and thermal analysis of cissus quadrangularis stem fiber/epoxy composite with micro-red mud filler composite for structural application. Trans Indian Inst Met. 2021;75:737–47. 10.1007/s12666-021-02478-1.Search in Google Scholar
(21) Sahayaraj AF, Jenish I, Tamilselvan M, Muthukrishnan M, Kumar BA. Mechanical and morphological characterization of sisal/kenaf/pineapple mat reinforced hybrid composites. Int Polym Proc. 2022;37:581–8.10.1515/ipp-2022-4238Search in Google Scholar
(22) Torres MG, Rodríguez JR, Vargas S, González E, Carreón-castro MP, Calzada GL. Tribological and mechanical properties of poly[(R)-3-hydroxybutyric acid] grafted with vinyl compounds: Insight into possible application. Int J Polym Anal Charact. 2015;20:5341–479. 10.1080/1023666X.2015.1036225.Search in Google Scholar
(23) Wani TP, Raja R, Sampathkumaran P, Seetharamu S. Investigation on wear and friction characteristics of bi-directional silk fiber reinforced nanoclay added HDPE composites. Mater Today Proc. 2018;5:25713–9. 10.1016/j.matpr.2018.11.013.Search in Google Scholar
(24) Prabhu Stalin JR, Jenish I, Indran S. Tribological charecterization of carbon epoxy composite materials with particulate silane treated SiC fillers. Adv Mater Res. 2014;984:331–5. 10.4028/www.scientific.net/AMR.984-985.331.Search in Google Scholar
(25) Jenish I, Sahayaraj AF, Appadurai M, Irudaya Raj EF, Suresh P. Sea sand abrasive wear of red mud micro particle reinforced cissus quadrangularis stem fiber/epoxy composite. J Nat Fibers. 2022 Nov;19(16):13216–31. 10.1080/15440478.2022.2087131.Search in Google Scholar
(26) Basavarajappa S, Ellangovan S, Arun KV. Studies on dry sliding wear behaviour of graphite filled glass–epoxy composites. Mater Des. 2009;30:2670–5. 10.1016/j.matdes.2008.10.013.Search in Google Scholar
(27) Dehghani MH, Karri RR, Yeganeh ZT, Mahvi AH, Nourmoradi H, Salari M. Statistical modelling of endocrine disrupting compounds adsorption onto activated carbon prepared from wood using CCD-RSM and DE hybrid evolutionary optimization framework: Comparison of linear vs non-linear isotherm and kinetic parameters. J Mol Liq. 2020;302:112526. 10.1016/j.molliq.2020.112526.Search in Google Scholar
(28) Elsen SR, Ramesh T. Analysis and optimization of dry sliding wear characteristics of zirconia reinforced alumina composites formed by conventional sintering using response surface method. Int J Refract Met Hard Mater. 2016;58:92–103. 10.1016/j.ijrmhm.2016.04.007.Search in Google Scholar
(29) Liu Y, Wang L, Liu D, Ma Y, Tian Y, Tong J. Evaluation of wear resistance of corn stalk fiber reinforced brake friction materials prepared by wet granulation. Wear. 2019;432:102918. 10.1016/j.wear.2019.05.033.Search in Google Scholar
(30) Yousif BF, Lau STW, McWilliam S. Polyester composite based on betelnut fibre for tribological applications. Tribol Int. 2010;43:503–11. 10.1016/j.triboint.2009.08.006.Search in Google Scholar
© 2023 the author(s), published by De Gruyter
This work is licensed under the Creative Commons Attribution 4.0 International License.
Articles in the same Issue
- Research Articles
- Chitosan nanocomposite film incorporating Nigella sativa oil, Azadirachta indica leaves’ extract, and silver nanoparticles
- Effect of Zr-doped CaCu3Ti3.95Zr0.05O12 ceramic on the microstructure, dielectric properties, and electric field distribution of the LDPE composites
- Effects of dry heating, acetylation, and acid pre-treatments on modification of potato starch with octenyl succinic anhydride (OSA)
- Loading conditions impact on the compression fatigue behavior of filled styrene butadiene rubber
- Characterization and compatibility of bio-based PA56/PET
- Study on the aging of three typical rubber materials under high- and low-temperature cyclic environment
- Numerical simulation and experimental research of electrospun polyacrylonitrile Taylor cone based on multiphysics coupling
- Experimental investigation of properties and aging behavior of pineapple and sisal leaf hybrid fiber-reinforced polymer composites
- Influence of temperature distribution on the foaming quality of foamed polypropylene composites
- Enzyme-catalyzed synthesis of 4-methylcatechol oligomer and preliminary evaluations as stabilizing agent in polypropylene
- Molecular dynamics simulation of the effect of the thermal and mechanical properties of addition liquid silicone rubber modified by carbon nanotubes with different radii
- Incorporation of poly(3-acrylamidopropyl trimethylammonium chloride-co-acrylic acid) branches for good sizing properties and easy desizing from sized cotton warps
- Effect of matrix composition on properties of polyamide 66/polyamide 6I-6T composites with high content of continuous glass fiber for optimizing surface performance
- Preparation and properties of epoxy-modified thermosetting phenolic fiber
- Thermal decomposition reaction kinetics and storage life prediction of polyacrylate pressure-sensitive adhesive
- Effect of different proportions of CNTs/Fe3O4 hybrid filler on the morphological, electrical and electromagnetic interference shielding properties of poly(lactic acid) nanocomposites
- Doping silver nanoparticles into reverse osmosis membranes for antibacterial properties
- Melt-blended PLA/curcumin-cross-linked polyurethane film for enhanced UV-shielding ability
- The affinity of bentonite and WO3 nanoparticles toward epoxy resin polymer for radiation shielding
- Prolonged action fertilizer encapsulated by CMC/humic acid
- Preparation and experimental estimation of radiation shielding properties of novel epoxy reinforced with Sb2O3 and PbO
- Fabrication of polylactic acid nanofibrous yarns for piezoelectric fabrics
- Copper phenyl phosphonate for epoxy resin and cyanate ester copolymer with improved flame retardancy and thermal properties
- Synergistic effect of thermal oxygen and UV aging on natural rubber
- Effect of zinc oxide suspension on the overall filler content of the PLA/ZnO composites and cPLA/ZnO composites
- The role of natural hybrid nanobentonite/nanocellulose in enhancing the water resistance properties of the biodegradable thermoplastic starch
- Performance optimization of geopolymer mortar blending in nano-SiO2 and PVA fiber based on set pair analysis
- Preparation of (La + Nb)-co-doped TiO2 and its polyvinylidene difluoride composites with high dielectric constants
- Effect of matrix composition on the performance of calcium carbonate filled poly(lactic acid)/poly(butylene adipate-co-terephthalate) composites
- Low-temperature self-healing polyurethane adhesives via dual synergetic crosslinking strategy
- Leucaena leucocephala oil-based poly malate-amide nanocomposite coating material for anticorrosive applications
- Preparation and properties of modified ammonium polyphosphate synergistic with tris(2-hydroxyethyl) isocynurate for flame-retardant LDPE
- Thermal response of double network hydrogels with varied composition
- The effect of coated calcium carbonate using stearic acid on the recovered carbon black masterbatch in low-density polyethylene composites
- Investigation of MXene-modified agar/polyurethane hydrogel elastomeric repair materials with tunable water absorption
- Damping performance analysis of carbon black/lead magnesium niobite/epoxy resin composites
- Molecular dynamics simulations of dihydroxylammonium 5,5′-bistetrazole-1,1′-diolate (TKX-50) and TKX-50-based PBXs with four energetic binders
- Preparation and characterization of sisal fibre reinforced sodium alginate gum composites for non-structural engineering applications
- Study on by-products synthesis of powder coating polyester resin catalyzed by organotin
- Ab initio molecular dynamics of insulating paper: Mechanism of insulating paper cellobiose cracking at transient high temperature
- Effect of different tin neodecanoate and calcium–zinc heat stabilizers on the thermal stability of PVC
- High-strength polyvinyl alcohol-based hydrogel by vermiculite and lignocellulosic nanofibrils for electronic sensing
- Impacts of micro-size PbO on the gamma-ray shielding performance of polyepoxide resin
- Influence of the molecular structure of phenylamine antioxidants on anti-migration and anti-aging behavior of high-performance nitrile rubber composites
- Fiber-reinforced polyvinyl alcohol hydrogel via in situ fiber formation
- Preparation and performance of homogenous braids-reinforced poly (p-phenylene terephthamide) hollow fiber membranes
- Synthesis of cadmium(ii) ion-imprinted composite membrane with a pyridine functional monomer and characterization of its adsorption performance
- Impact of WO3 and BaO nanoparticles on the radiation shielding characteristics of polydimethylsiloxane composites
- Comprehensive study of the radiation shielding feature of polyester polymers impregnated with iron filings
- Preparation and characterization of polymeric cross-linked hydrogel patch for topical delivery of gentamicin
- Mechanical properties of rCB-pigment masterbatch in rLDPE: The effect of processing aids and water absorption test
- Pineapple fruit residue-based nanofibre composites: Preparation and characterizations
- Effect of natural Indocalamus leaf addition on the mechanical properties of epoxy and epoxy-carbon fiber composites
- Utilization of biosilica for energy-saving tire compounds: Enhancing performance and efficiency
- Effect of capillary arrays on the profile of multi-layer micro-capillary films
- A numerical study on thermal bonding with preheating technique for polypropylene microfluidic device
- Development of modified h-BN/UPE resin for insulation varnish applications
- High strength, anti-static, thermal conductive glass fiber/epoxy composites for medical devices: A strategy of modifying fibers with functionalized carbon nanotubes
- Effects of mechanical recycling on the properties of glass fiber–reinforced polyamide 66 composites in automotive components
- Bentonite/hydroxyethylcellulose as eco-dielectrics with potential utilization in energy storage
- Study on wall-slipping mechanism of nano-injection polymer under the constant temperature fields
- Synthesis of low-VOC unsaturated polyester coatings for electrical insulation
- Enhanced apoptotic activity of Pluronic F127 polymer-encapsulated chlorogenic acid nanoparticles through the PI3K/Akt/mTOR signaling pathway in liver cancer cells and in vivo toxicity studies in zebrafish
- Preparation and performance of silicone-modified 3D printing photosensitive materials
- A novel fabrication method of slippery lubricant-infused porous surface by thiol-ene click chemistry reaction for anti-fouling and anti-corrosion applications
- Development of polymeric IPN hydrogels by free radical polymerization technique for extended release of letrozole: Characterization and toxicity evaluation
- Tribological characterization of sponge gourd outer skin fiber-reinforced epoxy composite with Tamarindus indica seed filler addition using the Box–Behnken method
- Stereocomplex PLLA–PBAT copolymer and its composites with multi-walled carbon nanotubes for electrostatic dissipative application
- Enhancing the therapeutic efficacy of Krestin–chitosan nanocomplex for cancer medication via activation of the mitochondrial intrinsic pathway
- Variation in tungsten(vi) oxide particle size for enhancing the radiation shielding ability of silicone rubber composites
- Damage accumulation and failure mechanism of glass/epoxy composite laminates subjected to repeated low velocity impacts
- Gamma-ray shielding analysis using the experimental measurements for copper(ii) sulfate-doped polyepoxide resins
- Numerical simulation into influence of airflow channel quantities on melt-blowing airflow field in processing of polymer fiber
- Cellulose acetate oleate-reinforced poly(butylene adipate-co-terephthalate) composite materials
- Radiation shielding capability and exposure buildup factor of cerium(iv) oxide-reinforced polyester resins
- Recyclable polytriazole resins with high performance based on Diels-Alder dynamic covalent crosslinking
- Adsorption and recovery of Cr(vi) from wastewater by Chitosan–Urushiol composite nanofiber membrane
- Comprehensive performance evaluation based on electromagnetic shielding properties of the weft-knitted fabrics made by stainless steel/cotton blended yarn
- Review Articles
- Preparation and application of natural protein polymer-based Pickering emulsions
- Wood-derived high-performance cellulose structural materials
- Flammability properties of polymers and polymer composites combined with ionic liquids
- Polymer-based nanocarriers for biomedical and environmental applications
- A review on semi-crystalline polymer bead foams from stirring autoclave: Processing and properties
- Rapid Communication
- Preparation and characterization of magnetic microgels with linear thermosensitivity over a wide temperature range
- Special Issue: Biodegradable and bio-based polymers: Green approaches (Guest Editors: Kumaran Subramanian, A. Wilson Santhosh Kumar, and Venkatajothi Ramarao)
- Synthesis and characterization of proton-conducting membranes based on bacterial cellulose and human nail keratin
- Fatigue behaviour of Kevlar/carbon/basalt fibre-reinforced SiC nanofiller particulate hybrid epoxy composite
- Effect of citric acid on thermal, phase morphological, and mechanical properties of poly(l-lactide)-b-poly(ethylene glycol)-b-poly(l-lactide)/thermoplastic starch blends
- Dose-dependent cytotoxicity against lung cancer cells via green synthesized ZnFe2O4/cellulose nanocomposites