Numerical simulation and experimental research of electrospun polyacrylonitrile Taylor cone based on multiphysics coupling
-
Peng Chen
 ,
Ge Chen
,
Ge Chen

Abstract
In the electrospinning process, the Taylor cone, as the jet source, directly affects the jet movement and the quality of the fiber membrane. Therefore, to understand the formation mechanism of the Taylor cone intuitively, a multiphysics coupling model that comprehensively considers the gravitational field, electrostatic field, and fluid field is established, and numerical simulations are conducted in this study. First, we construct a level-set function and analyze the force of the droplet. The gravity, surface tension, and electric field force are coupled to the incompressible Navier–Stokes equation as volume forces, and the nonconservation of the droplet area is solved by approximating the Dirac function with a smooth function. Subsequently, the deformation of the electrospun polyacrylonitrile (PAN) Taylor cone under different process parameters is simulated. Finally, data obtained from the numerical simulation and the average diameter of the electrospun PAN fiber membrane are analyzed via gray relational analysis. The results show that the volume force is the key factor affecting the average diameter of the fiber membrane (the correlation is 0.934). This article provides an effective reference and basis for the analysis and control of the electrospinning process.
1 Introduction
Nanofibers have a high-specific surface area where many molecules or functional atomic groups are exposed on the surface of the material. This affords various unique properties not possessed by ordinary thick fibers. Electrospinning technology has been widely used in biological tissue engineering (1,2), filter materials (3,4,5), energy conversion (6,7), flexible sensors (8,9,10), and many other fields owing to its simple structure, convenient operation, and continuous preparation of nanofibers. Polyacrylonitrile (PAN) has a high dielectric constant and good ionic conductivity; furthermore, it is excellent at absorbing liquid electrolytes and affords good thermal stability. Therefore, electrospun PAN films are typically used as a lithium battery separator material, and their high capacity and cycle life are related to the fiber diameter and porosity (11,12). Electrospun PAN nanofibers are continuous and relatively well-arranged. They are typically used as precursors for the manufacture of carbon nanofibers. Electrospun PAN nanofibers can be converted into carbon nanofibers through stabilization, carbonization, and graphitization (13,14). The strength and conductivity of electrospun PAN films are strongly correlated with the morphology of the fiber membrane.
Investigations regarding the morphology of electrospun fiber membranes aim to improve the mechanical structure from a macro perspective (15,16,17,18,19); however, the effects of the electrospinning process parameters on the morphology of the fiber membranes must be investigated. Many researchers have investigated the effects of electrospinning voltage, spinning distance (the distance between the needle and collector), liquid supply speed, and other process parameters on the morphology of electrospun membranes based on experimental recording combined with regression analysis (20,21,22). Meanwhile, other researchers have changed the microscopic parameters of the spinning solution, such as the mass fraction, conductivity, and viscosity, to study the morphology of electrospun membranes (23,24,25). These studies pertain to the effect of a single variable and can only explain special experimental phenomena to a certain extent. Meanwhile, the electrospinning process involves the coupling of multiple physical fields, such as electric, flow, and gravitational fields, which can only be established from the jet source. The multiphysics coupling model can reveal the most essential relationship between various influencing factors more effectively.
In the electrospinning process, before a voltage is applied, the droplets are only affected by surface tension, gravity, and viscoelastic force, forming an elliptical sphere on the surface of the needle. After a voltage is applied, the charge in the droplet is transferred to the surface of the droplet under the action of the electric field force, and the droplet begins to deform. After a few milliseconds, the droplet deforms into a cone (Taylor cone) and subsequently shoots a stream from the tip of the Taylor cone. Therefore, by understanding the formation mechanism of Taylor cones, we can understand the law of jet motion and control the shape of the fiber membrane more effectively. Reznik et al. (26) studied the deformation process of small droplets under the action of different electric field strengths from both experimental and theoretical aspects by observing electrospinning experimentally. Three different deformations of small droplets were observed. Subsequently, researchers conducted more in-depth studies regarding the Taylor cone and jet motion on this basis. Stanger et al. (27) studied the effect of charge density in a droplet on the rate of fiber deposition to the collector and the initial jet diameter. They discovered that the fiber deposition rate and initial jet diameter decreased with an increase in the charge density. Liu et al. (28) used an industrial charge coupled device (CCD) industrial camera system to obtain a Taylor cone image. After detecting and post-processing the image, they effectively extracted the geometric characteristic parameters of the Taylor cone and analyzed the relationship between the Taylor cone characteristic parameters and the fiber diameter. Studies regarding the formation mechanism of the Taylor cone mentioned previously were primarily based on theoretical research and experimental recording. The theoretical research method is extremely difficult to apply to nonlinear gas–liquid two-phase flows, and it cannot describe the deformation process of the gas–liquid interface. Meanwhile, experimental recording is often limited by environmental factors, time, and material costs; moreover, it does not necessarily guarantee measurement accuracy and personal safety. Since the twenty-first century, with the development of computer technology, computer numerical simulation methods have become the mainstream in studying multiphysics coupling (29).
Hartman et al. (30) assumed a longitudinal, one-dimensional electric field and assumed that the liquid flow in a Taylor cone was uniform. They constructed a one-dimensional momentum conservation equation to simulate the formation of the Taylor cone and jet but did not consider the two-dimensional nature of the electric field near the needle. Only an initial shape can be assumed to evaluate the liquid–gas interface. Similar methods are often used to simulate changes in a two-phase flow interface (31,32). Rahmanpour and Ebrahimi (33) proposed a numerical model describing the electric field force in the Taylor cone jet mode. The model can predict the conical jet structure without any initial shape by solving the axisymmetric continuum, momentum, and potential energy equations. The deformation process of the Taylor cone is essentially the deformation of the gas–liquid interface between the liquid phase, represented by the polymer solution, and the gas phase, represented by air. The current methods for calculating the interface change of this two-phase flow primarily include the phase-field and level-set methods.
Singh and Subramanian (34) proposed a numerical model based on the two-phase flow, phase-field method to simulate the ejection of fluid from a needle in an electric field. The model can simulate the deformation and elongation of the jet, but the simulated shape differs from the actual shape. In contrast to the phase-field method, the essence of the level-set algorithm is to use the zero contour of the high-dimensional surface as the target boundary to segment the low-dimensional target. If one observes the low dimension from a high dimension, the topological changes in the high and low dimensions are only a change in the surface shape; this will not cause a change in the surface topology and hence satisfies the actual situation. Zheng et al. (35,36) established a mathematical model for a gas–liquid two-phase flow based on the level-set method and used commercial finite element software (COMSOL Multiphysics) to solve the incompressible Navier–Stokes equation to predict the jet velocity. By changing the parameter values in the model, they discussed the effects of the polymer solution flow rate, viscosity, needle diameter, applied voltage, and other parameters on the jet velocity. The shape change of the Taylor cone was simulated over time, but the changes in these parameters and the quality of the electrospun fiber were not correlated. In addition, this method could not guarantee the conservation of the liquid level owing to artificial reinitialization.
The current study solved these key issues. First, the force of the droplet was analyzed based on the level-set function. An incompressible Navier–Stokes equation was constructed, and the Dirac function was approximated using a smooth function to solve the nonconservation of the droplet area. Subsequently, the deformation process of the electrospun PAN Taylor cone under different process parameters was simulated using numerical simulation software (COMSOL Multiphysics). Finally, the data obtained from the numerical simulation and the average diameter of the electrospun PAN fiber membrane were used for gray correlation analysis.
2 Experts and basic assumptions
The materials used included PAN (M w = 150,000 g·mol−1) and N,N-dimethylformamide (density = 0.95 g·mL−1, purity >99%), which were configured into a PAN solution with a mass fraction of 12%. The experimental schematic diagram of the electrospun PAN is shown in Figure 1. The microthruster pushed the syringe, releasing the PAN solution in the syringe from the needle. The needle was connected to the positive pole of the direct current (DC) high-voltage power supply. The receiver was connected to the negative pole of the DC high-voltage power supply and grounded. The PAN solution was in a high-voltage electrostatic field. Under the combined action of gravity, electric field force, and surface tension, a Taylor cone gradually formed at the needle. A micron-level Taylor cone was observed through an image acquisition system equipped with a CCD camera (5KF20S, 1,920 × 1,080 at 2,000 fps). The morphology of the electrospun PAN fiber membrane was confirmed via field emission scanning electron microscopy (FE-SEM, Hitachi S-4800). With the increase in the electric field force, a micro–nano jet was ejected from the tip of the Taylor cone and catapulted to the receiver to form a nanofiber membrane.

Schematic diagram of electrospun PAN experiment.
To study the motion trajectory of the jet, a multiphysics coupling mathematical model for the Taylor cone must be established. The principle is to retain the main part that reflects the real situation, whereas the minor part that does not affect the results can be abstracted. This not only ensures the validity of the numerical simulation results but also reduces the calculation time. Based on the aforementioned principles, the following were assumed for the state of the gas–liquid two-phase flow:
Both the gas and liquid phases are incompressible fluids and in a flowing state.
The calculation area is in a constant temperature and humidity state, and no energy is lost in the numerical simulation; therefore, energy transfer is not considered.
The PAN solution forms a jet under the action of a high-voltage electric field, disregarding the charge changes from the spinning jet and their effect on the high-voltage electric field.
When modeling, the effects of the electrospinning device and its motors on the electric field are disregarded.
3 Multiphysics coupling model
3.1 Level-set function
The fundamental concept of the level-set algorithm is to use the zero contour of the high-dimensional surface as the target boundary to segment the low-dimensional target (37). The deformation of the Taylor cone involves the change in the gas–liquid interface with time; accordingly, the level-set function (φ) is constructed. In the entire two-phase flow area (Ω) at any time t, the target interface (K) is exactly the zero isosurface of φ as follows:
The value of φ varies between 0 and 1, and the rate of change (u) is the flow rate of the solution in the liquid phase. The values of φ herein are 0 and 1 in the liquid and gas phases, respectively; the value of φ at the interface between the liquid and gas phases is 0.5. Because φ is a dynamic quantity, the parameters related to the fluid characteristics are also functions of φ as follows:
where ρ, μ, and ε r represent the dynamic density, dynamic viscosity coefficient, and dynamic dielectric constant of the two-phase fluid, respectively. When the values of φ are 0 and 1, the fluid property parameters are those of the polymer solution and air, respectively. The equation for control transfer and reinitialization is given as follows:
where u represents the fluid velocity and γ is the reinitialization parameter whose value ensures that the level-set function gradient gradually increases on the free surface over time. In this study, γ was set as 1; ε is the interface parameter, which controls the thickness of the area where the level-set function changes. A small value of ε is conducive to the generation of a clear surface; ε was set as 0.01 in this study.
3.2 Force analysis
In the electrospinning process, the droplets are simultaneously affected by gravity, electric field force, and surface tension. Their combination is expressed as the volume force in the governing equation. The volume force caused by gravity is as follows:
The relationship between the electric field force of the droplet in the electrostatic field and the Maxwell stress tensor (T) is as follows:
where T resulting from the difference among the electrical properties at the interface of the multi-medium fluid can be expressed as follows:
where ε 0, E, and I represent the vacuum dielectric constant, electric field strength, and second-order unit tensor, respectively. In the solution domain (except for the gas–liquid interface), T is 0; hence, the electric field force (F e) can be expressed as follows:
The surface tension is generated by the interaction of attraction and repulsion among the molecules in the fluid and performs an important role in the formation of Taylor cones. In the level-set method, the surface area of the droplet may not be conserved because of the artificial initialization of the two-phase flow interface. Therefore, in this study, the Dirac function was employed to represent the smooth function, which ensures that the area of the droplet is conserved.
where F st represents the surface tension force per unit interfacial area, σ is the surface tension coefficient, δ is the Dirac delta function, κ is the mean curvature of the interface, ∇s is the gradient taken along the interface, and n is the unit normal vector to the interface between the liquid and gas.
where I is an identity matrix, and δ can be estimated by any smoothing function. The specific form of the latter is as follows:
3.3 Governing equation
In fluid mechanics, two-phase flows of fluids are mainly described by three basic equations: the continuity, momentum conservation, and energy conservation equations. Based on previously defined assumptions, this study did not involve energy transfer; therefore, no energy equation was required. Because this study was focused on the motion of an incompressible and immiscible gas–liquid two-phase Newtonian fluid, the diffusion effect at the interface is balanced; hence, the convective divergence is 0, and the continuity equation, which expresses mass conservation, is as follows:
Based on the aforementioned analysis, gravity, surface tension, and electric field force were included as the additional volume force in the Navier–Stokes (i.e., momentum conservation) equation. Thus, the governing equation is as follows:
where u, t, and P represent velocity, time, and pressure, respectively. The control equation was solved using the multiphysics simulation software, COMSOL Multiphysics (version 5.5; COMSOL Inc., Sweden). The laminar two-phase flow determines the level-set interface to describe the multiphysics coupling stage embedded in the software.
4 Numerical simulation
4.1 Geometric model and initial conditions
The electrospinning model was symmetrical. To reduce the amount of calculation, a two-dimensional geometric model that can be simplified into three parts comprising a needle (with PAN solution inside), air, and a receiver was used, as shown in Figure 2a. Their material property parameters are listed in Table 1. The needle was made of 304 stainless steel with an outer diameter of 0.8 mm and an inner diameter of 0.6 mm. The receiver was made of 1060 aluminum alloy, and its thickness was 1 mm. The remainder was air. A voltage of 20 kV was applied to the needle tip, the liquid supply speed of the thruster was 0.42 mL·h−1, and the distance between the needle and receiver was 18 cm. The AC/direct current module in COMSOL Multiphysics software was used for electrostatic field analysis, as shown in Figure 2b.

(a) Two-dimensional model of electrospun PAN. (b) Electric field distribution of electrospun PAN.
Properties of model materials
| Material | Viscosity (mPa·S) | Surface tension (N·m−1) | Density (kg·m−3) | Conductivity (S·m−1) | Relative permittivity |
|---|---|---|---|---|---|
| PAN 12 wt% | 3.48 | 0.0375 | 960 | 3.6 × 10⁻⁶ | 40.7 |
| Needle | — | — | 793 | 9.93 × 10⁶ | 2 |
| Air | 2 × 10⁻⁵ | — | 1.25 | — | 1 |
| Collector | — | — | 268 | 2.78 × 10⁸ | 2.2 |
It can be experimentally verified that the forming process of the Taylor cone is extremely short, i.e., on the order of milliseconds, and its size is extremely small, i.e., on the order of millimeters. Therefore, to understand the formation process of the Taylor cone more effectively, the area 3 mm from the needle was selected as the modeling area, which is sufficient to observe the initial stage of the jet. The boundary conditions of the simulation model are shown in Figure 3a. To accurately analyze the interface between the air and PAN solution, the grid in the simulation was segmented into three parts, as shown in Figure 3b. The mapping distribution method was adopted for the PAN solution. An extremely fine distribution was adopted in the vicinity of the interface, whereas a free triangular network was adopted in the remaining part. After applying 20 kV to the needle, the potential on the needle was 20,000 V, which decreased at locations farther from the needle; it decreased to 16,864 V at a distance of 3 mm from the needle, as shown in Figure 4. Therefore, by applying a voltage of 3,136 V to the model shown in Figure 3a, the simulation result at 0.0035 s was as shown in Figure 3c.

(a) Boundary conditions of the simulation model. (b) The meshing of the simulation model. (c) Two-dimensional simulation model.

Diagram of potential change with distance from the needle.
4.2 Experimental results and discussion
When the applied voltage was 20 kV, the spinning distance was 18 cm, and the liquid supply speed was 0.42 mL·h−1. The numerical simulation results of the Taylor cone with time are shown in Figure 5a–f, and the experimental results are shown in Figure 6a–f. The results show that the model established in this study can reflect the real changes in the Taylor cone effectively. In electric fields, the Maxwell stresses overcome the surface tension, and in this case, the jet base acquires a quasi-steady, nearly conical shape with a vertical semi-angle of 49°. These results are basically consistent with the results of empirical studies conducted by Reznik et al. (26). Another objective of this study is to investigate the changes in the volume force, jet velocity, and electric field intensity when a Taylor cone produces a jet under different process parameters and calculate their correlation with the electrospun fiber diameter.

(a–f) When the applied voltage was 20 kV, the spinning distance was 18 cm, and the liquid supply speed was 0.42 mL·h−1, simulation results of Taylor cone over time.

(a–f) When the applied voltage was 20 kV, the spinning distance was 18 cm, and the liquid supply speed was 0.42 mL·h−1, experimental results of Taylor cones over time.
The experimental process of this study involved a voltage V applied to the needle, a distance L between the needle and collector, and a liquid supply speed S of the thruster. The morphology of the PAN film obtained from electrospinning was observed via FE-SEM, and 100 fibers were randomly selected to measure the diameter using Image-J software, as shown in Figure 7. Setting the potential 3 mm away from the needle as V 0, “V–V 0” can yield the voltage value required for the numerical simulation. All the parameters were input to COMSOL Multiphysics software to analyze the volume force, jet velocity, and electric field strength at the moment when the Taylor cone generated the jet, as shown in Figures 8–10.
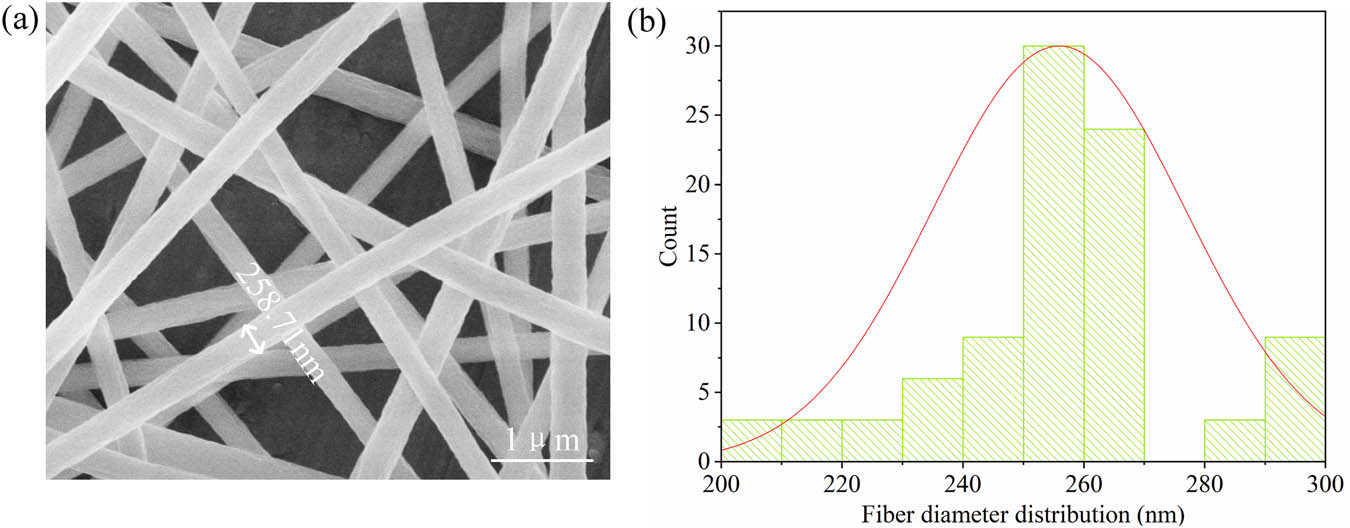
(a) FE-SEM image of the electrospun PAN nanofibers. (b) Diameter distribution of 100 fibers.

(a–c) Simulation results of the volume force at different time nodes.

(a–c) Simulation results of the electric field strength at different time nodes.

(a–c) Simulation results of the jet velocity at different time nodes.
The experimental parameters are listed in Table 2. Groups 1–5 of the experiments were used as examples to analyze the changes in their volume forces over time, as shown in Figure 11. The results show that under the interaction of gravity, electric field force, and surface tension, the volume force increased significantly, and after approximately 0.0035 s, it began to decrease. Hence, it can be assumed that the moment when the volume force begins to decrease is the moment when the jet is generated. The jet velocity and electric field strength at this moment are listed in Table 2, where D represents the average diameter, F represents the volume force, U represents the initial velocity of the jet, and E represents the electric field strength.
Experimental and simulation results
| Number | V (kV) | V 0 (V) | L (cm) | S (mL·h−1) | F (N·m−1) | U (m·s−1) | E (V·m−1) | D (nm) |
|---|---|---|---|---|---|---|---|---|
| 1 | 16 | 13,243 | 14 | 0.54 | 2.02 × 10⁷ | 0.7951 | 1.35 × 10⁶ | 275.58 |
| 2 | 16 | 13,375 | 16 | 0.54 | 1.93 × 10⁷ | 0.7550 | 1.29 × 10⁶ | 270.69 |
| 3 | 16 | 13,491 | 18 | 0.54 | 1.91 × 10⁷ | 0.7453 | 1.23 × 10⁶ | 263.68 |
| 4 | 16 | 13,595 | 20 | 0.54 | 1.84 × 10⁷ | 0.7066 | 1.18 × 10⁶ | 271.97 |
| 5 | 16 | 13,690 | 22 | 0.54 | 1.80 × 10⁷ | 0.6890 | 1.14 × 10⁶ | 276.48 |
| 6 | 12 | 10,119 | 18 | 0.42 | 1.53 × 10⁷ | 0.5396 | 9.22 × 10⁵ | 237.88 |
| 7 | 14 | 11,805 | 18 | 0.42 | 1.78 × 10⁷ | 0.6678 | 1.08 × 10⁶ | 242.22 |
| 8 | 16 | 13,492 | 18 | 0.42 | 1.91 × 10⁷ | 0.7462 | 1.23 × 10⁶ | 255.35 |
| 9 | 18 | 15,178 | 18 | 0.42 | 2.04 × 10⁷ | 0.7964 | 1.38 × 10⁶ | 259.69 |
| 10 | 20 | 16,864 | 18 | 0.42 | 2.31 × 10⁷ | 0.8557 | 1.54 × 10⁶ | 250.28 |
| 11 | 16 | 13,491 | 18 | 0.36 | 1.70 × 10⁷ | 0.8512 | 1.23 × 10⁶ | 237.84 |
| 12 | 16 | 13,491 | 18 | 0.42 | 1.73 × 10⁷ | 0.7966 | 1.23 × 10⁶ | 247.60 |
| 13 | 16 | 13,491 | 18 | 0.48 | 1.84 × 10⁷ | 0.7697 | 1.23 × 10⁶ | 255.60 |
| 14 | 16 | 13,491 | 18 | 0.54 | 1.85 × 10⁷ | 0.7453 | 1.23 × 10⁶ | 260.64 |
| 15 | 16 | 13,491 | 18 | 0.6 | 1.87 × 10⁷ | 0.6655 | 1.23 × 10⁶ | 263.02 |

Schematic diagram of the change of the volume force of the 1–5 experiments with time.
4.3 Gray relational analysis
To understand the effect of various physical parameters on fiber diameter, the gray correlation was used to characterize this effect in this study. As an important part of gray theory (38), the degree of gray correlation has been widely used to compare the similarity of dependent and independent variables (39,40,41). By considering the correlation analysis between the initial jet velocity and fiber diameter in experiments 6–10 in Table 2, as an example, the original data are expressed as follows:
To ensure comparability between the original data, it is necessary to eliminate the difference in order of magnitude and use the following average conversion formula for processing:
Following the calculations based on Eqs. 17 and 18, two rows of data with elimination dimensions are obtained. The following formula is employed to determine the absolute value of the difference between the two rows of data. The maximum (Δ max) and minimum (Δ min) values from the data are calculated using Eq. 19. The gray correlation coefficient, L ij (t), is calculated as follows:
where the value of k is 0.5. After the calculations, Δ max is 0.207, Δ min is 0.01, and the sequence of L 12 is as follows:
Finally, the value of the gray correlation degree is solved by the following formula:
After solving, the gray correlation degree between the initial jet velocity and fiber diameter is 0.654. Similarly, the correlation degree between the volume force and fiber diameter is 0.934, and the correlation degree between the electric field strength and fiber diameter is 0.7. The correlation between the aforementioned three factors and fiber diameter is greater than 0.6, which is higher than the correlation of other factors that were previously reported (40). Hence, this indicates that the factors considered in this study are among the main factors that significantly affect the fiber diameter. Furthermore, this explains the groups 1–5 of experimental data in Table 2 shown in Figure 12. The fiber diameter initially decreases and then increases. This is because of the fact that as the spinning distance increases, the jet can be fully stretched before reaching the receiver. The solvent is fully volatilized. However, simultaneously, the volume force and jet velocity also decrease sharply, thereby resulting in an increase in the initial diameter of the jet. Similarly, as shown in Figure 13, the fiber diameter initially increases and then decreases because, when the voltage value is small, the volume force is also small, and the increase is small. However, the jet velocity increases significantly, and the solvent does not volatilize completely. Thus, the fiber diameter increases. As the electric field force increases, the increase in the jet velocity decreases, and the jet is effectively stretched. Thus, the fiber diameter exhibits a downward trend.

(a) Change trend of the average diameter. (b) Change trend of jet velocity. (c) Change trend of volume force. (d) Change trend of electric field strength.

(a) Change trend of the average diameter. (b) Change trend of jet velocity. (c) Change trend of volume force. (d) Change trend of electric field strength.
5 Conclusion
In this study, a mathematical model based on multiphysics coupling was established to simulate the formation process of an electrospun PAN Taylor cone. The electric field force, gravity, and surface tension based on the level-set function were coupled to the Navier–Stokes equation, and a smooth function was used to approximate the Dirac delta function to solve the nonconservation of the droplet surface area. The mathematical model was solved using COMSOL Multiphysics, in which a two-dimensional image of the Taylor cone was simulated over time, and physical parameters such as volume force, jet initial velocity, and electric field intensity were obtained. After comparing the experimental phenomena and data, it was discovered that the model accurately reflected the formation process of Taylor cones. The correlation among the volume force, initial jet velocity, electric field strength, and average fiber diameter was calculated via gray relational analysis. Compared with previous studies, the physical parameters in this study were more closely associated with the fiber diameter than the process parameters.
-
Funding information: This work was supported by the Fundamental Research Funds for the Central Universities and Graduate Student Innovation Fund of Donghua University (CUSF-DH-D-2022070).
-
Author contributions: Peng Chen: writing – original draft, writing – review and editing, resources, formal, and analysis; Qihong Zhou: writing – original draft, formal analysis, and project administration; Ge Chen: visualization; Yuntao Wang: supervision; Jinghu Lv: investigation.
-
Conflict of interest: The authors state that there is no conflict of interest.
-
Data availability statement: The datasets generated and/or analyzed during the current study are available from the corresponding author on reasonable request.
References
(1) Yan X, Yu M, Ramakrishna S, Russell SJ, Long Y-Z. Advances in portable electrospinning devices for in situ delivery of personalized wound care. Nanoscale. 2019;11(41):19166–78.10.1039/C9NR02802ASearch in Google Scholar
(2) Zeaiean Firouzabadi P, Ghanbari H, Mahmoudi N, Haramshahi SMA, Javadpour J. Synthesis of nanobentonite–poly (vinyl alcohol)–bacterial cellulose nanocomposite by electrospinning for wound healing applications. Phys status solidi (a). 2020;217(6):1900536.10.1002/pssa.201900536Search in Google Scholar
(3) Zhou H, Niu H, Wang H, Yang W, Wei X, Shao H, et al. A versatile, highly effective nanofibrous separation membrane. Nanoscale. 2020;12(4):2359–65.10.1039/C9NR09776GSearch in Google Scholar
(4) Kim M-W, An S, Seok H, Yarin AL, Yoon SS. Transparent metallized microfibers as recyclable electrostatic air filters with ionization. ACS Appl Mater & Interfaces. 2020;12(22):25266–75.10.1021/acsami.0c01697Search in Google Scholar PubMed
(5) Li X, Yang W, Li H, Wang Y, Bubakir MM, Ding Y, et al. Water filtration properties of novel composite membranes combining solution electrospinning and needleless melt electrospinning methods. J Appl Polym Sci. 2015;132(10):41601.10.1002/app.41601Search in Google Scholar
(6) Wang H, Wang W, Wang H, Li Y, Jin X, Niu H, et al. Improving supercapacitance of electrospun carbon nanofibers through increasing micropores and microporous surface area. Adv Mater Interfaces. 2019;6(6):1801900.10.1002/admi.201801900Search in Google Scholar
(7) Wang W, Zheng Y, Jin X, Sun Y, Lu B, Wang H, et al. Unexpectedly high piezoelectricity of electrospun polyacrylonitrile nanofiber membranes. Nano Energy. 2019;56:588–94.10.1016/j.nanoen.2018.11.082Search in Google Scholar
(8) Zhu M, Chng SS, Cai W, Liu C, Du Z. Piezoelectric polymer nanofibers for pressure sensors and their applications in human activity monitoring. RSC Adv. 2020;10(37):21887–94.10.1039/D0RA03293JSearch in Google Scholar PubMed PubMed Central
(9) Meng X, Yang J, Liu Z, Lu W, Sun Y, Dai Y. Non-contact, fibrous cellulose acetate/aluminum flexible electronic-sensor for humidity detecting. Compos Commun. 2020;20:100347.10.1016/j.coco.2020.04.013Search in Google Scholar
(10) Vu DL, Lin T-F, Lin T-H, Wu M-C. Highly-sensitive detection of volatile organic compound vapors by electrospun PANI/P3TI/PMMA fibers. Polymers. 2020;12(2):455.10.3390/polym12020455Search in Google Scholar PubMed PubMed Central
(11) Dong T, Arifeen WU, Choi J, Yoo K, Ko TJ. Surface-modified electrospun polyacrylonitrile nano-membrane for a lithium-ion battery separator based on phase separation mechanism. Chem Eng J. 2020;398:125646.10.1016/j.cej.2020.125646Search in Google Scholar
(12) Gao Y, Sang X, Chen Y, Li Y, Liu B, Sheng J, et al. Polydopamine modification electrospun polyacrylonitrile fibrous membrane with decreased pore size and dendrite mitigation for lithium ion battery. J Mater Sci. 2020;55(8):3549–60.10.1007/s10853-019-04218-9Search in Google Scholar
(13) Arshad SN, Naraghi M, Chasiotis I. Strong carbon nanofibers from electrospun polyacrylonitrile. Carbon. 2011;49(5):1710–9.10.1016/j.carbon.2010.12.056Search in Google Scholar
(14) Dror Y, Salalha W, Khalfin RL, Cohen Y, Yarin AL, Zussman E. Carbon nanotubes embedded in oriented polymer nanofibers by electrospinning. Langmuir. 2003;19(17):7012–20.10.1021/la034234iSearch in Google Scholar
(15) Wang X, Xiang H, Song C, Zhu D, Sui J, Liu Q, et al. Highly efficient transparent air filter prepared by collecting-electrode-free bipolar electrospinning apparatus. J Hazard Mater. 2020;385:121535.10.1016/j.jhazmat.2019.121535Search in Google Scholar PubMed
(16) Wang X, Niu H, Wang X, Lin T. Needleless electrospinning of uniform nanofibers using spiral coil spinnerets. J Nanomaterials. 2012;2012:1–9.10.1155/2012/785920Search in Google Scholar
(17) Edmondson D, Cooper A, Jana S, Wood D, Zhang M. Centrifugal electrospinning of highly aligned polymer nanofibers over a large area. J Mater Chem. 2012;22(35):18646–52.10.1039/c2jm33877gSearch in Google Scholar
(18) Wang X, Niu H, Lin T, Wang X. Needleless electrospinning of nanofibers with a conical wire coil. Polym Eng & Sci. 2009;49(8):1582–6.10.1002/pen.21377Search in Google Scholar
(19) Pu C, He J, Cui S, Gao W. Double‐nozzle air‐jet electrospinning for nanofiber fabrication. J Appl Polym Sci. 2014;131(6):40040.10.1002/app.40040Search in Google Scholar
(20) Kheirkhah Barzoki P, Latifi M, Rezadoust AM. Response surface methodology optimization of electrospinning process parameters to fabricate aligned polyvinyl butyral nanofibers for interlaminar toughening of phenolic-based composite laminates. J Ind Text. 2020;49(7):858–74.10.1177/1528083718798635Search in Google Scholar
(21) Schubert DW. Revealing novel power laws and quantization in electrospinning considering jet splitting—toward predicting fiber diameter and its distribution. Macromol Theory Simul. 2019;28(4):1900006.10.1002/mats.201900006Search in Google Scholar
(22) Anindyajati A, Boughton P, Ruys AJ. Modelling and optimization of polycaprolactone ultrafine-fibres electrospinning process using response surface methodology. Materials. 2018;11(3):441.10.3390/ma11030441Search in Google Scholar PubMed PubMed Central
(23) Nasir M, Rahmawati T, Dara F, Andayani DGS, editors. Synthesis and characterization of copolymer poly (vinylidene fluoride)/graphene nanofiber. IOP Conference Series: Materials Science and Engineering. IOP Publishing; 2020.10.1088/1757-899X/833/1/012079Search in Google Scholar
(24) Jiang A-Y, Pan Z-J. Surface-porous and hollow poly(lactic acid)(SPH-PLA) and surface-porous and lotus-root-like PLA (SPL-PLA) nanofibres: preparation, quantitative analysis, and modelling. J Nanopart Res. 2020;22(8):1–21.10.1007/s11051-020-04965-wSearch in Google Scholar
(25) Zeng J, Haoqing H, Schaper A, Wendorff JH, Greiner A. Poly-l-lactide nanofibers by electrospinning–Influence of solution viscosity and electrical conductivity on fiber diameter and fiber morphology. e-Polymers. 2003;3(1):9.10.1515/epoly.2003.3.1.102Search in Google Scholar
(26) Reznik S, Yarin A, Theron A, Zussman E. Transient and steady shapes of droplets attached to a surface in a strong electric field. J Fluid Mech. 2004;516:349–77.10.1017/S0022112004000679Search in Google Scholar
(27) Stanger J, Tucker N, Kirwan K, Staiger MP. Effect of charge density on the Taylor cone in electrospinning. Int J Mod Phys B. 2009;23(06n07):1956–61.10.1142/S0217979209061895Search in Google Scholar
(28) Liu YY, Jing CJ, Liu DL, Hu QX, Li QW. Study on the relation between electrospinning fiber diameter distribution and Taylor cone dynamics. Adv Mat Res. 2011;311:450–3.10.4028/www.scientific.net/AMR.311-313.450Search in Google Scholar
(29) Kwon Y, Yoon J, Jeon SY, Cho D, Lee K, Ahn S, et al. Numerical simulation of gas‐assisted polymer‐melt electrospinning: Parametric study of a multinozzle system for mass production. Polym Eng & Sci. 2020;60(9):2111–21.10.1002/pen.25455Search in Google Scholar
(30) Hartman R, Brunner D, Camelot D, Marijnissen J, Scarlett B. Jet break-up in electrohydrodynamic atomization in the cone-jet mode. J Aerosol Sci. 2000;31(1):65–95.10.1016/S0021-8502(99)00034-8Search in Google Scholar
(31) Eggers J, Villermaux E. Physics of liquid jets. Rep Prog Phys. 2008;71(3):036601.10.1088/0034-4885/71/3/036601Search in Google Scholar
(32) Eggers J. Nonlinear dynamics and breakup of free-surface flows. Rev Mod Phys. 1997;69(3):865.10.1103/RevModPhys.69.865Search in Google Scholar
(33) Rahmanpour M, Ebrahimi R. Numerical simulation of electrohydrodynamic spray with stable Taylor cone–jet. Heat Mass Transf. 2016;52(8):1595–603.10.1007/s00231-015-1680-6Search in Google Scholar
(34) Singh SK, Subramanian A. Phase-field simulations of electrohydrodynamic jetting for printing nano-to-microscopic constructs. RSC Adv. 2020;10(42):25022–8.10.1039/D0RA04214ESearch in Google Scholar
(35) Zheng Y, Xin B, Li M. Model development and validation of electrospun jet formation. Text Res J. 2019;89(11):2177–86.10.1177/0040517518786280Search in Google Scholar
(36) Zheng Y, Zeng Y, Dong X. Simulation of jet motion during electrospinning process through coupled multiphysics method. Fibers Polym. 2019;20(1):113–9.10.1007/s12221-019-8737-ySearch in Google Scholar
(37) An R, Yu CH. A level set redistancing algorithm for simulation of two-phase flow. Numerical Heat Transfer. Part B: Fundamentals. 2020;78(1):30–53.10.1080/10407790.2020.1746601Search in Google Scholar
(38) Julong D. Introduction to grey system theory. J Grey Syst. 1989;1(1):1–24.Search in Google Scholar
(39) Wang Q, Zeng X, Chen C, Lian G, Huang X. An integrated method for multi-objective optimization of multi-pass Fe50/TiC laser cladding on AISI 1045 steel based on grey relational analysis and principal component analysis. Coatings. 2020;10(2):151.10.3390/coatings10020151Search in Google Scholar
(40) Zhou Q, Lin L, Chen G, Du Z. Prediction and optimization of electrospun polyacrylonitrile fiber diameter based on grey system theory. Materials. 2019;12(14):2237.10.3390/ma12142237Search in Google Scholar PubMed PubMed Central
(41) Gajalakshmi K, Senthilkumar N, Prabu B. Multi-response optimization of dry sliding wear parameters of AA6026 using hybrid gray relational analysis coupled with response surface method. Meas Control. 2019;52(5–6):540–53.10.1177/0020294019842603Search in Google Scholar
© 2023 the author(s), published by De Gruyter
This work is licensed under the Creative Commons Attribution 4.0 International License.
Articles in the same Issue
- Research Articles
- Chitosan nanocomposite film incorporating Nigella sativa oil, Azadirachta indica leaves’ extract, and silver nanoparticles
- Effect of Zr-doped CaCu3Ti3.95Zr0.05O12 ceramic on the microstructure, dielectric properties, and electric field distribution of the LDPE composites
- Effects of dry heating, acetylation, and acid pre-treatments on modification of potato starch with octenyl succinic anhydride (OSA)
- Loading conditions impact on the compression fatigue behavior of filled styrene butadiene rubber
- Characterization and compatibility of bio-based PA56/PET
- Study on the aging of three typical rubber materials under high- and low-temperature cyclic environment
- Numerical simulation and experimental research of electrospun polyacrylonitrile Taylor cone based on multiphysics coupling
- Experimental investigation of properties and aging behavior of pineapple and sisal leaf hybrid fiber-reinforced polymer composites
- Influence of temperature distribution on the foaming quality of foamed polypropylene composites
- Enzyme-catalyzed synthesis of 4-methylcatechol oligomer and preliminary evaluations as stabilizing agent in polypropylene
- Molecular dynamics simulation of the effect of the thermal and mechanical properties of addition liquid silicone rubber modified by carbon nanotubes with different radii
- Incorporation of poly(3-acrylamidopropyl trimethylammonium chloride-co-acrylic acid) branches for good sizing properties and easy desizing from sized cotton warps
- Effect of matrix composition on properties of polyamide 66/polyamide 6I-6T composites with high content of continuous glass fiber for optimizing surface performance
- Preparation and properties of epoxy-modified thermosetting phenolic fiber
- Thermal decomposition reaction kinetics and storage life prediction of polyacrylate pressure-sensitive adhesive
- Effect of different proportions of CNTs/Fe3O4 hybrid filler on the morphological, electrical and electromagnetic interference shielding properties of poly(lactic acid) nanocomposites
- Doping silver nanoparticles into reverse osmosis membranes for antibacterial properties
- Melt-blended PLA/curcumin-cross-linked polyurethane film for enhanced UV-shielding ability
- The affinity of bentonite and WO3 nanoparticles toward epoxy resin polymer for radiation shielding
- Prolonged action fertilizer encapsulated by CMC/humic acid
- Preparation and experimental estimation of radiation shielding properties of novel epoxy reinforced with Sb2O3 and PbO
- Fabrication of polylactic acid nanofibrous yarns for piezoelectric fabrics
- Copper phenyl phosphonate for epoxy resin and cyanate ester copolymer with improved flame retardancy and thermal properties
- Synergistic effect of thermal oxygen and UV aging on natural rubber
- Effect of zinc oxide suspension on the overall filler content of the PLA/ZnO composites and cPLA/ZnO composites
- The role of natural hybrid nanobentonite/nanocellulose in enhancing the water resistance properties of the biodegradable thermoplastic starch
- Performance optimization of geopolymer mortar blending in nano-SiO2 and PVA fiber based on set pair analysis
- Preparation of (La + Nb)-co-doped TiO2 and its polyvinylidene difluoride composites with high dielectric constants
- Effect of matrix composition on the performance of calcium carbonate filled poly(lactic acid)/poly(butylene adipate-co-terephthalate) composites
- Low-temperature self-healing polyurethane adhesives via dual synergetic crosslinking strategy
- Leucaena leucocephala oil-based poly malate-amide nanocomposite coating material for anticorrosive applications
- Preparation and properties of modified ammonium polyphosphate synergistic with tris(2-hydroxyethyl) isocynurate for flame-retardant LDPE
- Thermal response of double network hydrogels with varied composition
- The effect of coated calcium carbonate using stearic acid on the recovered carbon black masterbatch in low-density polyethylene composites
- Investigation of MXene-modified agar/polyurethane hydrogel elastomeric repair materials with tunable water absorption
- Damping performance analysis of carbon black/lead magnesium niobite/epoxy resin composites
- Molecular dynamics simulations of dihydroxylammonium 5,5′-bistetrazole-1,1′-diolate (TKX-50) and TKX-50-based PBXs with four energetic binders
- Preparation and characterization of sisal fibre reinforced sodium alginate gum composites for non-structural engineering applications
- Study on by-products synthesis of powder coating polyester resin catalyzed by organotin
- Ab initio molecular dynamics of insulating paper: Mechanism of insulating paper cellobiose cracking at transient high temperature
- Effect of different tin neodecanoate and calcium–zinc heat stabilizers on the thermal stability of PVC
- High-strength polyvinyl alcohol-based hydrogel by vermiculite and lignocellulosic nanofibrils for electronic sensing
- Impacts of micro-size PbO on the gamma-ray shielding performance of polyepoxide resin
- Influence of the molecular structure of phenylamine antioxidants on anti-migration and anti-aging behavior of high-performance nitrile rubber composites
- Fiber-reinforced polyvinyl alcohol hydrogel via in situ fiber formation
- Preparation and performance of homogenous braids-reinforced poly (p-phenylene terephthamide) hollow fiber membranes
- Synthesis of cadmium(ii) ion-imprinted composite membrane with a pyridine functional monomer and characterization of its adsorption performance
- Impact of WO3 and BaO nanoparticles on the radiation shielding characteristics of polydimethylsiloxane composites
- Comprehensive study of the radiation shielding feature of polyester polymers impregnated with iron filings
- Preparation and characterization of polymeric cross-linked hydrogel patch for topical delivery of gentamicin
- Mechanical properties of rCB-pigment masterbatch in rLDPE: The effect of processing aids and water absorption test
- Pineapple fruit residue-based nanofibre composites: Preparation and characterizations
- Effect of natural Indocalamus leaf addition on the mechanical properties of epoxy and epoxy-carbon fiber composites
- Utilization of biosilica for energy-saving tire compounds: Enhancing performance and efficiency
- Effect of capillary arrays on the profile of multi-layer micro-capillary films
- A numerical study on thermal bonding with preheating technique for polypropylene microfluidic device
- Development of modified h-BN/UPE resin for insulation varnish applications
- High strength, anti-static, thermal conductive glass fiber/epoxy composites for medical devices: A strategy of modifying fibers with functionalized carbon nanotubes
- Effects of mechanical recycling on the properties of glass fiber–reinforced polyamide 66 composites in automotive components
- Bentonite/hydroxyethylcellulose as eco-dielectrics with potential utilization in energy storage
- Study on wall-slipping mechanism of nano-injection polymer under the constant temperature fields
- Synthesis of low-VOC unsaturated polyester coatings for electrical insulation
- Enhanced apoptotic activity of Pluronic F127 polymer-encapsulated chlorogenic acid nanoparticles through the PI3K/Akt/mTOR signaling pathway in liver cancer cells and in vivo toxicity studies in zebrafish
- Preparation and performance of silicone-modified 3D printing photosensitive materials
- A novel fabrication method of slippery lubricant-infused porous surface by thiol-ene click chemistry reaction for anti-fouling and anti-corrosion applications
- Development of polymeric IPN hydrogels by free radical polymerization technique for extended release of letrozole: Characterization and toxicity evaluation
- Tribological characterization of sponge gourd outer skin fiber-reinforced epoxy composite with Tamarindus indica seed filler addition using the Box–Behnken method
- Stereocomplex PLLA–PBAT copolymer and its composites with multi-walled carbon nanotubes for electrostatic dissipative application
- Enhancing the therapeutic efficacy of Krestin–chitosan nanocomplex for cancer medication via activation of the mitochondrial intrinsic pathway
- Variation in tungsten(vi) oxide particle size for enhancing the radiation shielding ability of silicone rubber composites
- Damage accumulation and failure mechanism of glass/epoxy composite laminates subjected to repeated low velocity impacts
- Gamma-ray shielding analysis using the experimental measurements for copper(ii) sulfate-doped polyepoxide resins
- Numerical simulation into influence of airflow channel quantities on melt-blowing airflow field in processing of polymer fiber
- Cellulose acetate oleate-reinforced poly(butylene adipate-co-terephthalate) composite materials
- Radiation shielding capability and exposure buildup factor of cerium(iv) oxide-reinforced polyester resins
- Recyclable polytriazole resins with high performance based on Diels-Alder dynamic covalent crosslinking
- Adsorption and recovery of Cr(vi) from wastewater by Chitosan–Urushiol composite nanofiber membrane
- Comprehensive performance evaluation based on electromagnetic shielding properties of the weft-knitted fabrics made by stainless steel/cotton blended yarn
- Review Articles
- Preparation and application of natural protein polymer-based Pickering emulsions
- Wood-derived high-performance cellulose structural materials
- Flammability properties of polymers and polymer composites combined with ionic liquids
- Polymer-based nanocarriers for biomedical and environmental applications
- A review on semi-crystalline polymer bead foams from stirring autoclave: Processing and properties
- Rapid Communication
- Preparation and characterization of magnetic microgels with linear thermosensitivity over a wide temperature range
- Special Issue: Biodegradable and bio-based polymers: Green approaches (Guest Editors: Kumaran Subramanian, A. Wilson Santhosh Kumar, and Venkatajothi Ramarao)
- Synthesis and characterization of proton-conducting membranes based on bacterial cellulose and human nail keratin
- Fatigue behaviour of Kevlar/carbon/basalt fibre-reinforced SiC nanofiller particulate hybrid epoxy composite
- Effect of citric acid on thermal, phase morphological, and mechanical properties of poly(l-lactide)-b-poly(ethylene glycol)-b-poly(l-lactide)/thermoplastic starch blends
- Dose-dependent cytotoxicity against lung cancer cells via green synthesized ZnFe2O4/cellulose nanocomposites