Determination of anthropometric measurements and their application in the development of clothing sizing systems for women in the regions of the Republic of Croatia
-
Ksenija Doležal
 and
Blaženka Brlobašić Šajatović
and
Blaženka Brlobašić Šajatović

Abstract
The aim of this article is to determine the differences in the physical dimensions of the female body that form the basis of the clothing size system and compare their deviations within the three regions of the Republic of Croatia. Due to the changes in the dimensions and shape of the human body, there is a need to adjust clothing in order to achieve the best possible fit. A systematic consideration of the fit of clothing includes investigation of a number of elements and factors, especially those based on anthropometric knowledge. The results of anthropometric measurements performed on a representative sample determine the body dimensions of the measured population. By sorting and grouping the data of body measurements, clothing sizes are created, with significant differences in body shape and body proportions of individual population groups. In the clothing size system, individual body dimensions define the clothing size and form a scale determined by a norm that prescribes body shape based on two dimensions of girths, where the measurement of bust girth is the basic measurement, and the body height is the dependent variable. This research was carried out on a sample of 940 women from the region of Slavonia, 1,109 women from the region of Dalmatia, and 799 women from the City of Zagreb, classified into seven age groups. The statistical processing of the results, i.e., the method of principal components, the values of the observed body measurements, and the representation of certain categories of bust girth and body size in the measured population of each region were determined.
1 Introduction
The industrial production of clothing, due to the ever-increasing demands of consumers, must constantly follow market trends and adapt in order to meet the new needs and interests of consumers. One of the most important requirements of this industry is to adapt clothing to the shape of the body in order to achieve the best possible fit. Scientific knowledge based on anthropometric research is therefore also used in the production of cuts. The anthropometric approach in the research of body measurements is applied after established knowledge about the variability of the proportions of the human body. The shape of the human body is constantly changing, which is influenced by numerous factors, and it is necessary to determine these changes in order to influence the design of the garment and improve it [1,2,3,4]. The results of anthropometric measurements of the human body carried out on a representative sample determine the clothing sizes of the measured population, which are used as a starting point in the industrial production of clothing. Their labeling is prescribed by the standard, and based on the European standards (EN), clothing items are assigned a label, i.e., a clothing size. The task of clothing sizes is to enable good product placement on the market as well as consumer satisfaction with the final product. It is important for clothing manufacturers to know the representation of certain clothing sizes in the population, namely, the share of less than 1% includes an extremely small number of respondents whose dress sizes clothing manufacturers have no interest in. In the industrial production of clothing, an individual clothing size is used to cover as much of the population as possible [1,2,5]. With the aim of determining the physical dimensions of the population of the Republic of Croatia for the purpose of creating a system of clothing sizes, anthropometric measurements were carried out as part of a complex, technological research and development project called the Croatian Anthropometric System (CAS), which form the basis for the establishment of a new system of clothing sizes. Data on measures are presented in the framework of the Croatian technical report (HRI 1148:2012 h) entitled “Anthropometric system - Body measurement and marking of clothing and footwear sizes” published in February 2012 (Tables 1–3). The report was prepared on the basis of European standards (EN 13402: 1–3), with certain deviation characteristics of the population of the Republic of Croatia [1,6].
Body height with a range of 8 cm for women in cm
| Body height | 152 | 160 | 168 | 176 | 184 |
| Range | 148–156 | 156–164 | 164–172 | 172–180 | 180–188 |
Standardized measures of women's bust girth and waist girth and their ranges in cm
| Bust girth | 76 | 80 | 84 | 88 | 92 | 96 | 100 | 104 | 110 | 116 | 122 | 128 | 134 |
| Range | 74–78 | 78–82 | 82–86 | 86–90 | 90–94 | 94–98 | 98–102 | 102–107 | 107–113 | 113–119 | 119–125 | 125–131 | 131–137 |
| Waist girth | 60 | 64 | 68 | 72 | 76 | 80 | 84 | 88 | 94 | 116 | 122 | 128 | 134 |
| Range | 58–62 | 62–66 | 66–70 | 70–74 | 74–78 | 78–82 | 82–86 | 86–91 | 91–97 | 97–103 | 103–109 | 109–115 | 115–121 |
Measures of hip girth in cm, according to body types, for women
| Body types A0 (especially narrow hips) | ||||||||||||||
| Hip girth | 64 | 68 | 72 | 76 | 80 | 84 | 88 | 92 | 96 | 100 | 104 | 110 | 116 | 122 |
| Body types A (very narrow hips) | ||||||||||||||
| Hip girth | 68 | 72 | 76 | 80 | 84 | 88 | 92 | 96 | 100 | 104 | 110 | 116 | 122 | 128 |
| Body types B (narrow hips) | ||||||||||||||
| Hip girth | 72 | 76 | 80 | 84 | 88 | 92 | 96 | 100 | 104 | 108 | 114 | 120 | 126 | 132 |
| Body types C (normal hips) | ||||||||||||||
| Hip girth | 76 | 80 | 84 | 88 | 92 | 96 | 100 | 104 | 108 | 112 | 118 | 124 | 130 | 136 |
| Body types D (wide hips) | ||||||||||||||
| Hip girth | 80 | 84 | 88 | 92 | 96 | 100 | 104 | 108 | 112 | 116 | 122 | 128 | 134 | 140 |
| Body types E (very wide hips) | ||||||||||||||
| Hip girth | 84 | 88 | 92 | 96 | 100 | 104 | 108 | 112 | 116 | 120 | 128 | 132 | 138 | 144 |
| Body types E0 (especially wide hips) | ||||||||||||||
| Hip girth | 88 | 92 | 96 | 100 | 104 | 108 | 112 | 116 | 120 | 124 | 130 | 136 | 142 | 148 |
2 Role of anthropometric knowledge in the industrial production of clothing
Before the nineteenth century, there is little evidence of early attempts to systematize body measurements and their application in drafting clothing patterns. During this period, men's and women's clothing were mostly similar, and tailored by tailors. Almost all tailoring patterns that made it easier for tailors to make a garment were based on garment measurements. They did not use units of measurement, but used notched strips of parchment to record the lengths and widths of the pre-made garment, and they were called yardsticks or measurements on article.
The creation of templates had to follow the shape of the body in order to fit as well as possible, so it was extremely difficult to create them in the previously described way. For this reason, they were considered very valuable, so the tailors did not reveal the method of their production. Only a small number of them published manuals in which they presented their own creation of templates [7]. Mass production of women's clothing began to develop in the 1920s, and clothing manufacturers created their own unique, and sometimes arbitrary, clothing size system that was often based on inaccurate data. Disadvantages of such clothing were manifested in inadequate fit to the body shape, which resulted in reduced interest in industrially produced clothing. In order to improve the production and placement of clothing on the market, the application of empirical knowledge based on systematic anthropometric research was started. Systematic research on the peculiarities of the human body and intergroup-subpopulation differences determines body dimensions and their deviation from the average of the measured total population. The existence of differences in individual dimensions of the human body within some population has been proven beyond question, as indicated by the results of anthropometric research on the morphological characteristics of man. Research shows that between the most represented human races there are significant differences in the speed of growth and development, as well as in the ultimate height and physique, and it is more difficult to separate the influence of inherited factors from environmental factors (climatic conditions, diet, etc.). The great influence of environmental factors is confirmed by the monitoring of the impact of migration on body growth, and previous beliefs about the dominant genetic factors of growth are changing. Knowledge of the peculiarities of the human body and subpopulation differences in the body dimensions of a certain area enables a better fit of clothing to the body, and established deviations, characteristic of the measured population, are used when creating a national norm [8,9,10]. Subpopulation differences in body dimensions converted into a national norm, in the form of a Technical Report, are attached to the European norms for clothing. In this way, the physical dimensions of the measured population and, what is most important, their peculiarities documented through the norm, are valuable knowledge related to clothing production [10].
3 Experimental method
3.1 Materials and methods
3.1.1 Subjects
This research includes a sample of 940 women from the region of Slavonia, 1,109 women from the region of Dalmatia, and 799 women from the City of Zagreb. The age of all respondents is from 20 to 85 years. Depending on their age, the respondents were divided into 10-year age groups, of which there are seven in total. Within a period of 10 years of an age group, there are no significant changes in the physical dimensions of the subjects, but they are observed to a greater or lesser extent every 10 years or more. Within the region of Slavonia, the sample included 0.26% of women from the total female population of that region, within the region of Dalmatia, 0.32% of the respondents were included, and within the City of Zagreb, 0.23% of the respondents were included. The size of the population included in the measurement indicates the significance of the obtained results (Figure 1).

Map of the Republic of Croatia with highlighted regions.
3.1.2 Methods
The measurements required for this research were carried out within the framework of the Complex Technological Research and Development Project “Croatian Anthropometric System” of STIRP HAS, using the standard method applied in similar projects in Europe and the world. The measurement procedure was carried out using anthropometric instruments, an anthropometer with one arm, and a tape measure, in accordance with ISO 3635, ISO 8559, and EN 13402 standards. Two body dimensions (body height and bust girth) were measured on a sample of test subjects [11,12].
3.1.3 Statistics
The research of the complex system of body measurements on a sample of women in three regions of the Republic of Croatia was carried out using the methods of descriptive statistics, which includes the evaluation of parameters of central tendency (arithmetic mean and median) and dispersion (standard deviation, coefficient of variation, 95% confidence interval, and data range). The distributions of body measurements that were included in this research were compared with appropriate graphical representations. The mentioned methods that were used for the description are from the group of univariate data analysis methods by means of which body measurements are analyzed one by one or at most pair by pair. Body measurements, however, form a unique and interrelated system for describing the structure (morphology) of the body, so univariate methods generate more or less mutually dependent partial relationships. The method of principal components in this research helps to verify the method of determining the clothing size system, which is based on the categorization of bust girth and body height. The results of the analyses are presented in tables and graphs, and the statistical conclusions are accepted with a permissible error of α = 0.05. Data description and processing were performed with the Statistica and SPSS software packages and with the help of professional literature [13,14].
4 Results and discussion
The parameters of central tendency and dispersion of body height and bust girth were estimated using the method of descriptive statistics. The estimates of baseline parameters are shown in Tables 4 and 5 and a comparison of the distribution of body sizes by age groups of the observed sample of all three regions of the Republic of Croatia is graphically presented in Figures 2 and 3 [10].
Basic parameters of the body height distribution of women within the region of Slavonia, Dalmatia, and City of Zagreb by age group
| Region | Age | N a | x̄ b | s c | CVd (%) | 95% CIe | Span | ||
|---|---|---|---|---|---|---|---|---|---|
| h 1 | h 2 | Min. | Max. | ||||||
| Slavonia | −29 | 243 | 166.9 | 6.4 | 3.8 | 166.1 | 167.7 | 149.0 | 191.0 |
| 30–39 | 121 | 166.3 | 6.8 | 4.1 | 165.1 | 167.5 | 150.0 | 189.0 | |
| 40–49 | 118 | 163.6 | 5.7 | 3.5 | 162.6 | 164.7 | 148.0 | 176.0 | |
| 50–59 | 109 | 162.4 | 6.7 | 4.1 | 161.1 | 163.7 | 145.0 | 191.0 | |
| 60–69 | 113 | 159.6 | 6.3 | 3.9 | 158.4 | 160.8 | 144.0 | 174.0 | |
| 70–79 | 126 | 157.5 | 6.9 | 4.4 | 156.3 | 158.7 | 142.0 | 177.0 | |
| 80– | 110 | 155.8 | 6.9 | 4.4 | 154.5 | 157.1 | 139.5 | 176.0 | |
| Total | 940 | 162.5 | 7.7 | 4.7 | 162.0 | 162.9 | 139.5 | 191.0 | |
| Dalmatia | −29 | 253 | 169.0 | 5.9 | 3.5 | 168.2 | 169.7 | 147.5 | 193.0 |
| 30–39 | 175 | 168.3 | 6.0 | 3.6 | 167.4 | 169.1 | 147.0 | 185.5 | |
| 40–49 | 191 | 167.4 | 6.0 | 3.6 | 166.6 | 168.3 | 151.0 | 188.0 | |
| 50–59 | 147 | 166.4 | 5.2 | 3.1 | 165.6 | 167.2 | 154.5 | 190.0 | |
| 60–69 | 109 | 162.4 | 5.8 | 3.6 | 161.3 | 163.5 | 145.0 | 176.5 | |
| 70–79 | 119 | 160.9 | 7.9 | 4.9 | 159.5 | 162.4 | 137.5 | 178.3 | |
| 80– | 115 | 159.6 | 8.9 | 5.6 | 158.0 | 161.3 | 136.0 | 180.0 | |
| Total | 1,109 | 165.8 | 7.3 | 4.4 | 165.3 | 166.2 | 136.0 | 193.0 | |
| City of Zagreb | −29 | 168 | 166.5 | 5.9 | 3.5 | 165.6 | 167.4 | 151.0 | 181.0 |
| 30–39 | 127 | 165.7 | 6.8 | 4.1 | 164.5 | 166.9 | 152.5 | 181.0 | |
| 40–49 | 154 | 163.7 | 6.0 | 3.7 | 162.7 | 164.6 | 148.4 | 177.0 | |
| 50–59 | 110 | 162.4 | 6.2 | 3.8 | 161.2 | 163.6 | 150.5 | 179.0 | |
| 60–69 | 87 | 162.0 | 6.9 | 4.3 | 160.5 | 163.4 | 145.1 | 180.0 | |
| 70–79 | 83 | 159.2 | 6.8 | 4.3 | 157.8 | 160.7 | 140.0 | 174.0 | |
| 80− | 70 | 159.6 | 5.7 | 3.6 | 158.3 | 161.0 | 147.0 | 172.0 | |
| Total | 799 | 163.4 | 6.8 | 4.2 | 163.0 | 163.9 | 140.0 | 181.0 | |
aNumber of cases, barithmetic mean, cstandard deviation, dcoefficient of variation, e95% confidence interval.
Basic parameters of the distribution of women's bust girth (cm) in the region of Slavonia, Dalmatia, and the City of Zagreb by age group
| Region | Age | N a | x̄ b | s c | CVd (%) | 95% CIe | Span | ||
|---|---|---|---|---|---|---|---|---|---|
| h 1 | h 2 | Min. | Max. | ||||||
| Slavonia | −29 | 243 | 89.7 | 7.6 | 8.5 | 88.8 | 90.7 | 71.0 | 122.0 |
| 30–39 | 121 | 91.9 | 7.5 | 8.2 | 90.6 | 93.3 | 79.0 | 113.0 | |
| 40–49 | 118 | 98.2 | 9.5 | 9.7 | 96.5 | 100.0 | 81.0 | 126.0 | |
| 50–59 | 109 | 100.8 | 11.4 | 11.3 | 98.6 | 103.0 | 78.0 | 134.0 | |
| 60–69 | 113 | 104.0 | 10.2 | 9.8 | 102.1 | 105.9 | 82.0 | 132.0 | |
| 70–79 | 126 | 105.2 | 9.7 | 9.2 | 103.4 | 106.9 | 81.0 | 134.0 | |
| 80– | 110 | 104.3 | 10.2 | 9.8 | 102.4 | 106.3 | 78.0 | 136.0 | |
| Total | 940 | 97.9 | 11.2 | 11.4 | 97.1 | 98.6 | 71.0 | 136.0 | |
| Dalmatia | −29 | 253 | 91.2 | 6.2 | 6.8 | 90.5 | 92.0 | 73.5 | 111.0 |
| 30–39 | 175 | 93.5 | 6.4 | 6.8 | 92.6 | 94.5 | 80.0 | 112.0 | |
| 40–49 | 191 | 98.1 | 8.0 | 8.2 | 96.9 | 99.2 | 80.0 | 125.0 | |
| 50–59 | 147 | 102.6 | 9.3 | 9.1 | 101.1 | 104.2 | 82.5 | 134.0 | |
| 60–69 | 109 | 103.8 | 8.2 | 7.9 | 102.2 | 105.3 | 80.4 | 120.0 | |
| 70–79 | 119 | 103.3 | 11.5 | 11.1 | 101.2 | 105.4 | 66.0 | 142.0 | |
| 80– | 115 | 102.5 | 10.4 | 10.1 | 100.6 | 104.4 | 80.0 | 128.0 | |
| Total | 1,109 | 98.0 | 9.7 | 9.9 | 97.4 | 98.6 | 66.0 | 142.0 | |
| City of Zagreb | −29 | 168 | 88.5 | 6.6 | 7.5 | 87.4 | 89.5 | 78.0 | 126.5 |
| 30–39 | 127 | 94.0 | 9.2 | 9.8 | 92.4 | 95.7 | 77.0 | 128.0 | |
| 40–49 | 154 | 98.2 | 9.4 | 9.6 | 96.7 | 99.7 | 78.0 | 129.0 | |
| 50–59 | 110 | 102.0 | 10.5 | 10.3 | 100.0 | 104.0 | 70.5 | 129.0 | |
| 60–69 | 87 | 105.1 | 11.4 | 10.8 | 102.7 | 107.5 | 83.0 | 131.0 | |
| 70–79 | 83 | 104.6 | 11.1 | 10.6 | 102.1 | 107.0 | 69.0 | 131.5 | |
| 80– | 70 | 107.2 | 11.6 | 10.8 | 104.4 | 109.9 | 79.0 | 127.0 | |
| Total | 799 | 98.2 | 11.6 | 11.8 | 97.4 | 99.0 | 69.0 | 131.5 | |
aNumber of cases, barithmetic mean, cstandard deviation, dcoefficient of variation, e95% confidence interval.

Graphic representation of average values of body height of subjects by age in all three regions of the Republic of Croatia.

Graphic representation of average values of bust girth of respondents by age in all three regions of the Republic of Croatia.
Table 4 shows that the body height of the subjects in the region of Slavonia constantly decreases with age, and this decrease on average, from the youngest to the oldest group, amounts to 11.1 cm [10]. The value of body height of test subjects in the Dalmatia region also decreases in all age groups, observed from the youngest to the oldest group, by 9.4 cm. The value of body height of test subjects in the City of Zagreb decreases with the increase in the age from the first to the sixth group by 7.3 cm, while a slight increase of 0.4 cm in the average value is observed in the oldest age group. From the graphic representation, deviations in body height values can be observed (Figure 2). The body height values of female respondents from the region of Slavonia and the City of Zagreb, on average, from the first to the fourth observed group, are approximately the same or equal, and the largest deviations are recorded at the age of 50–59 years to the oldest age groups. The difference in body height values in the 60–69 age group is 2.4 cm, in the 70–79 age group, it is 2.1 cm, and in the 80–85 age group, it is 3.8 cm. The average value of the body height of the subjects in the Dalmatia region differs the most from the first age group to the group of 50–59 years compared to the subjects of other regions, and the biggest difference is noticeable in the fourth group where the subjects are 4 cm taller. Female respondents aged 60–69 and 80–85 years old have the same height in the region of Dalmatia and the City of Zagreb, and compared to respondents in the region of Slavonia, their height in the oldest age group is 3.8 cm higher.
The average values of bust girth increase with the age of the test subjects up to the age group of 60–69 years, and after that a decrease in this value is observed in the oldest groups, except in the City of Zagreb, where the value of bust girth in the oldest group increases. The values of bust girth in all three observed regions have the same value in the 40–49 age group. The biggest differences, observed in all groups, are observed in the oldest age group. The increase in the average value of the bust girth in the region of the City of Zagreb, observed from the smallest value to the largest, is 18.7 cm, in the region of Slavonia, it is 15.5 cm, and in Dalmatia, the bust girth of the test subjects increases by 12.6 cm (Table 5 and Figure 3).
On the basis of the results presented for the two body measurements, it is possible to influence the improvement of garment adherence in industrial production, as they form the basis for the creation of a system of garment sizes. The results obtained from the measured sample fit into the range of chest circumference and corresponding age of body size prescribed by the standard are presented in tabular form. The system of clothing sizes is the result of the grouping of body measurements of the considered population, whose values are presented in a table with clearly visible differences in body shape and body proportions. The clothing sizes of the measured population of the Republic of Croatia are determined based on the regulations of European standards, with permitted deviation characteristics of each individual population (HTI). The bust girth is the basic designation for the clothing size depending on the defined size range. These two body measurements form the basis for the creation of a system of clothing sizes. Therefore, in further research, the representation of the female population was determined by a certain range of bust girth and height within the given regions of the Republic of Croatia. The regional representation of the determined body measurements of the female population of the Republic of Croatia was observed, and their overall occurrence in the measured population was also shown. Although the measured population covers a larger range defined by bust girth and body height, it will include those categories in which the representation of female respondents is equal to or greater than 1%. The representation of the measured population, based on the observed physical measurements, for all three regions is tabulated in Tables 6–8.
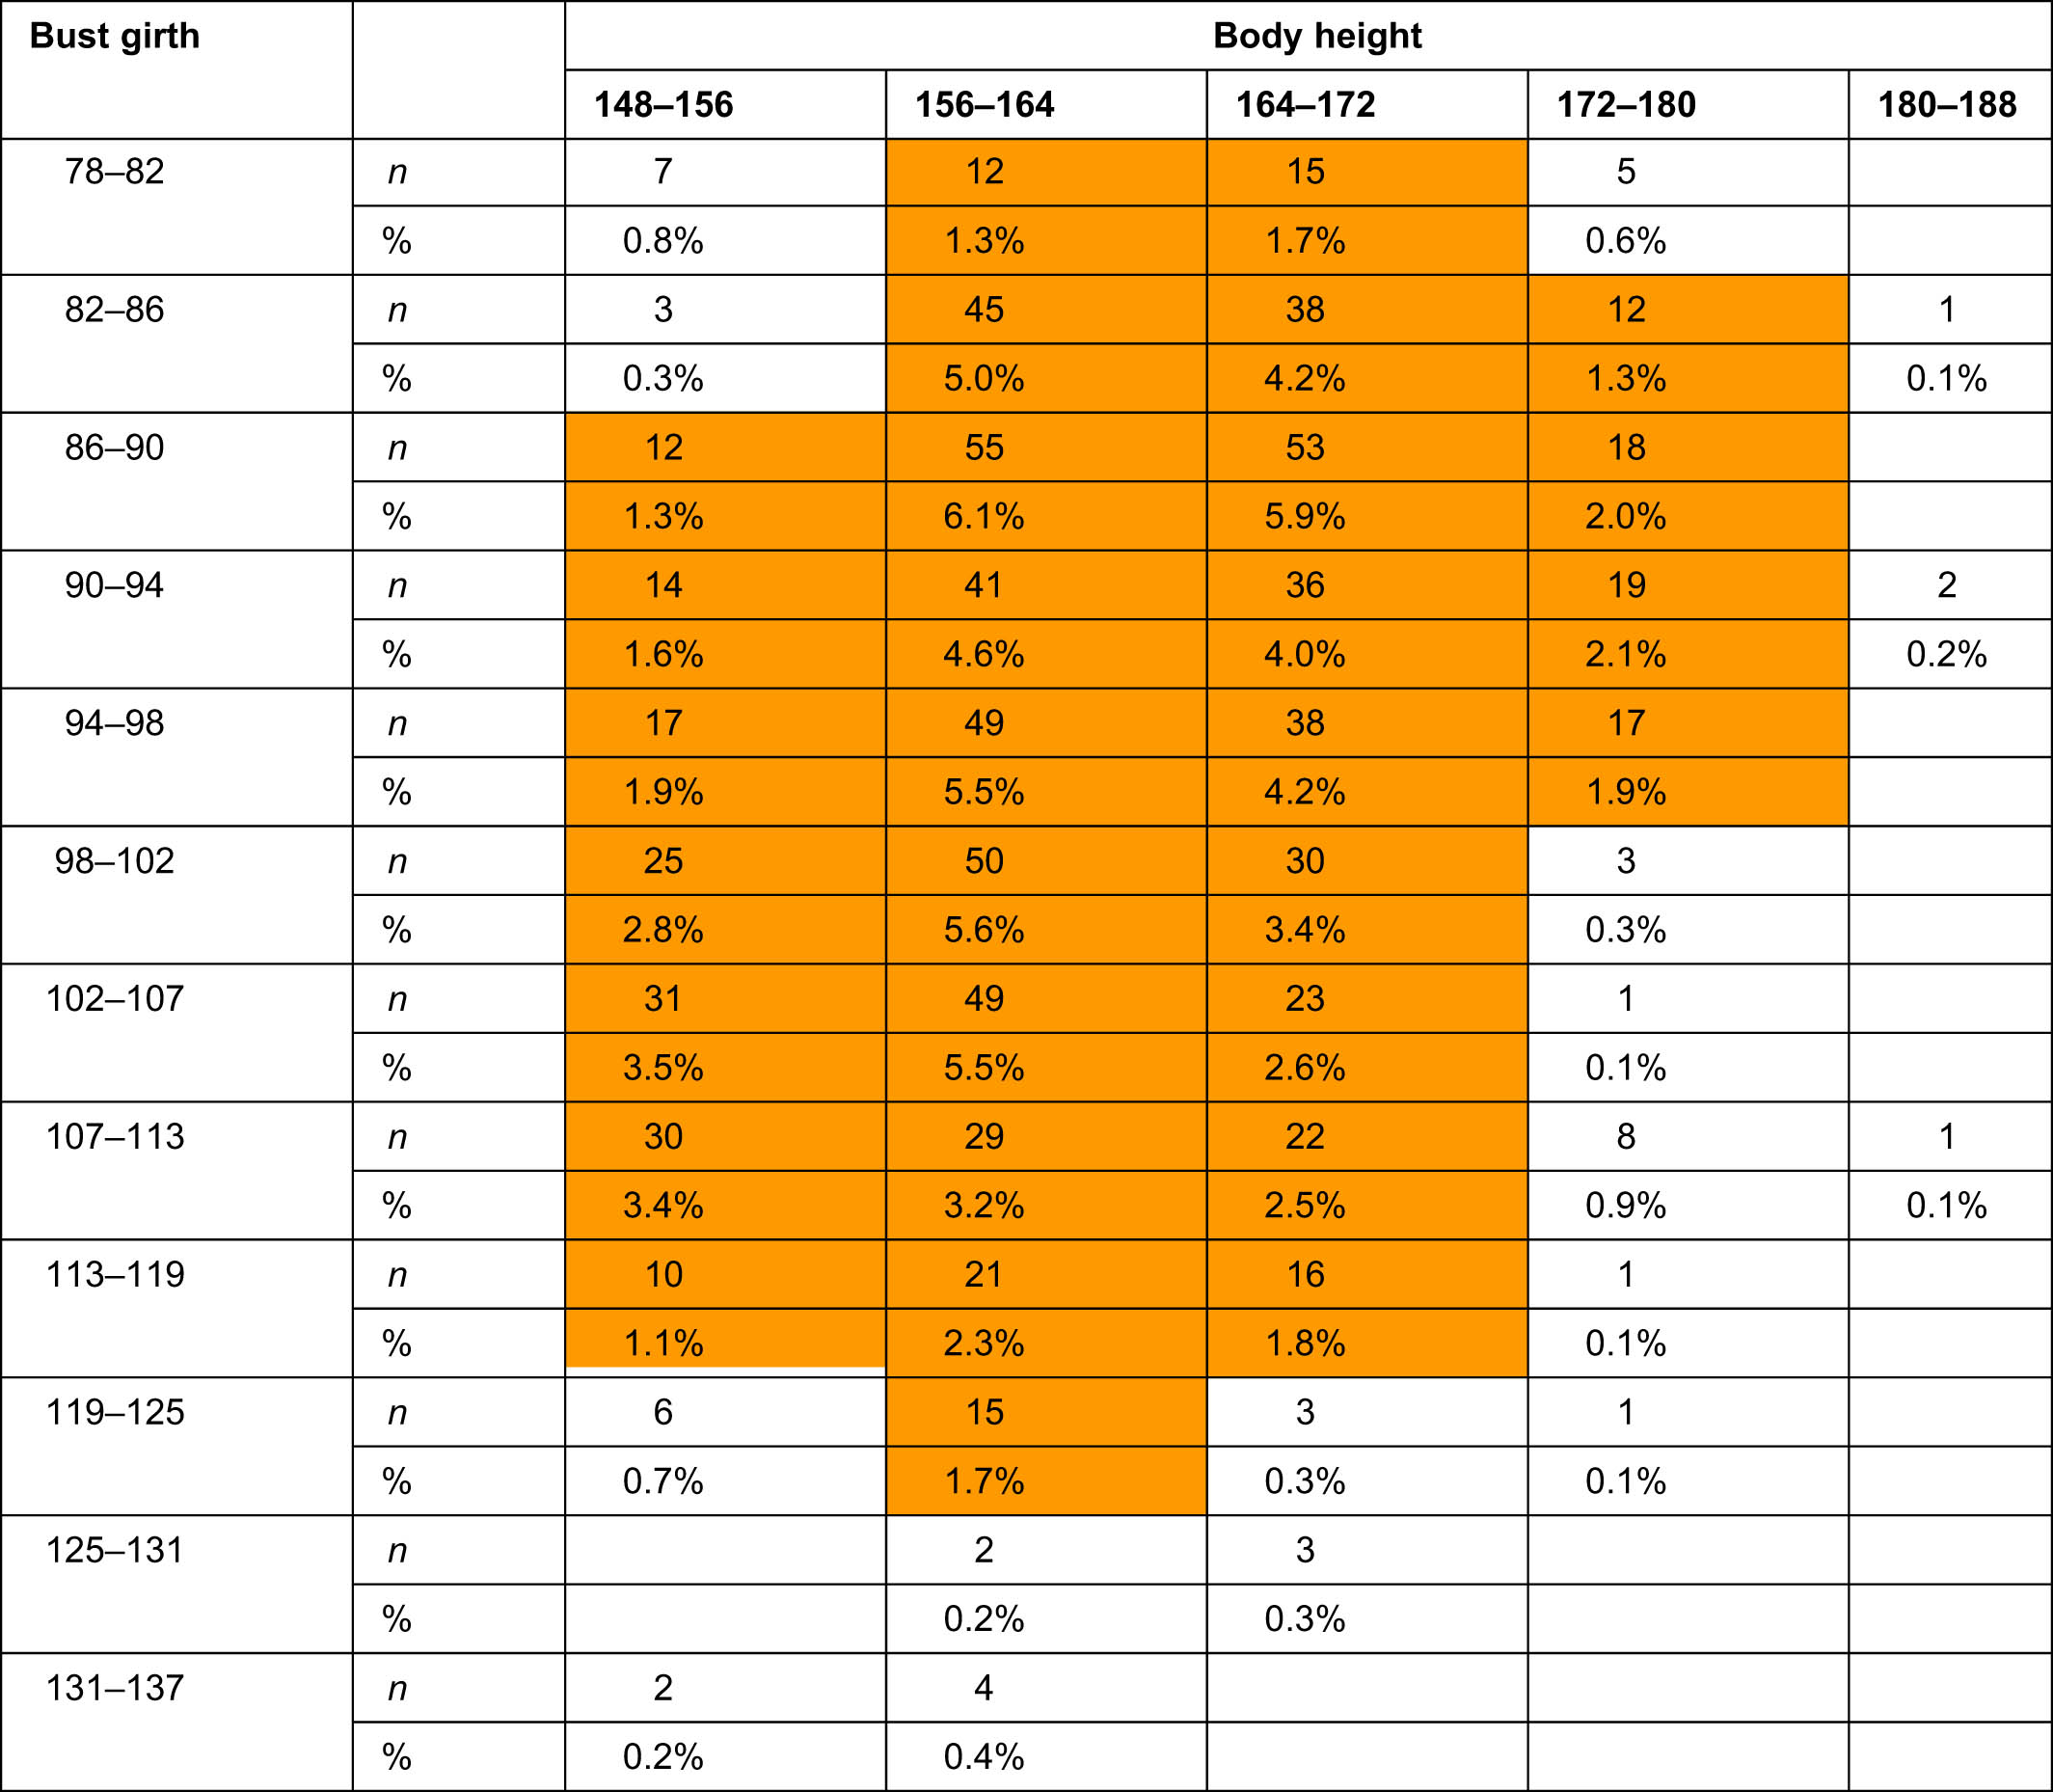
Representation of women from the Slavonia region in a particular range of bust girth and body height
 |
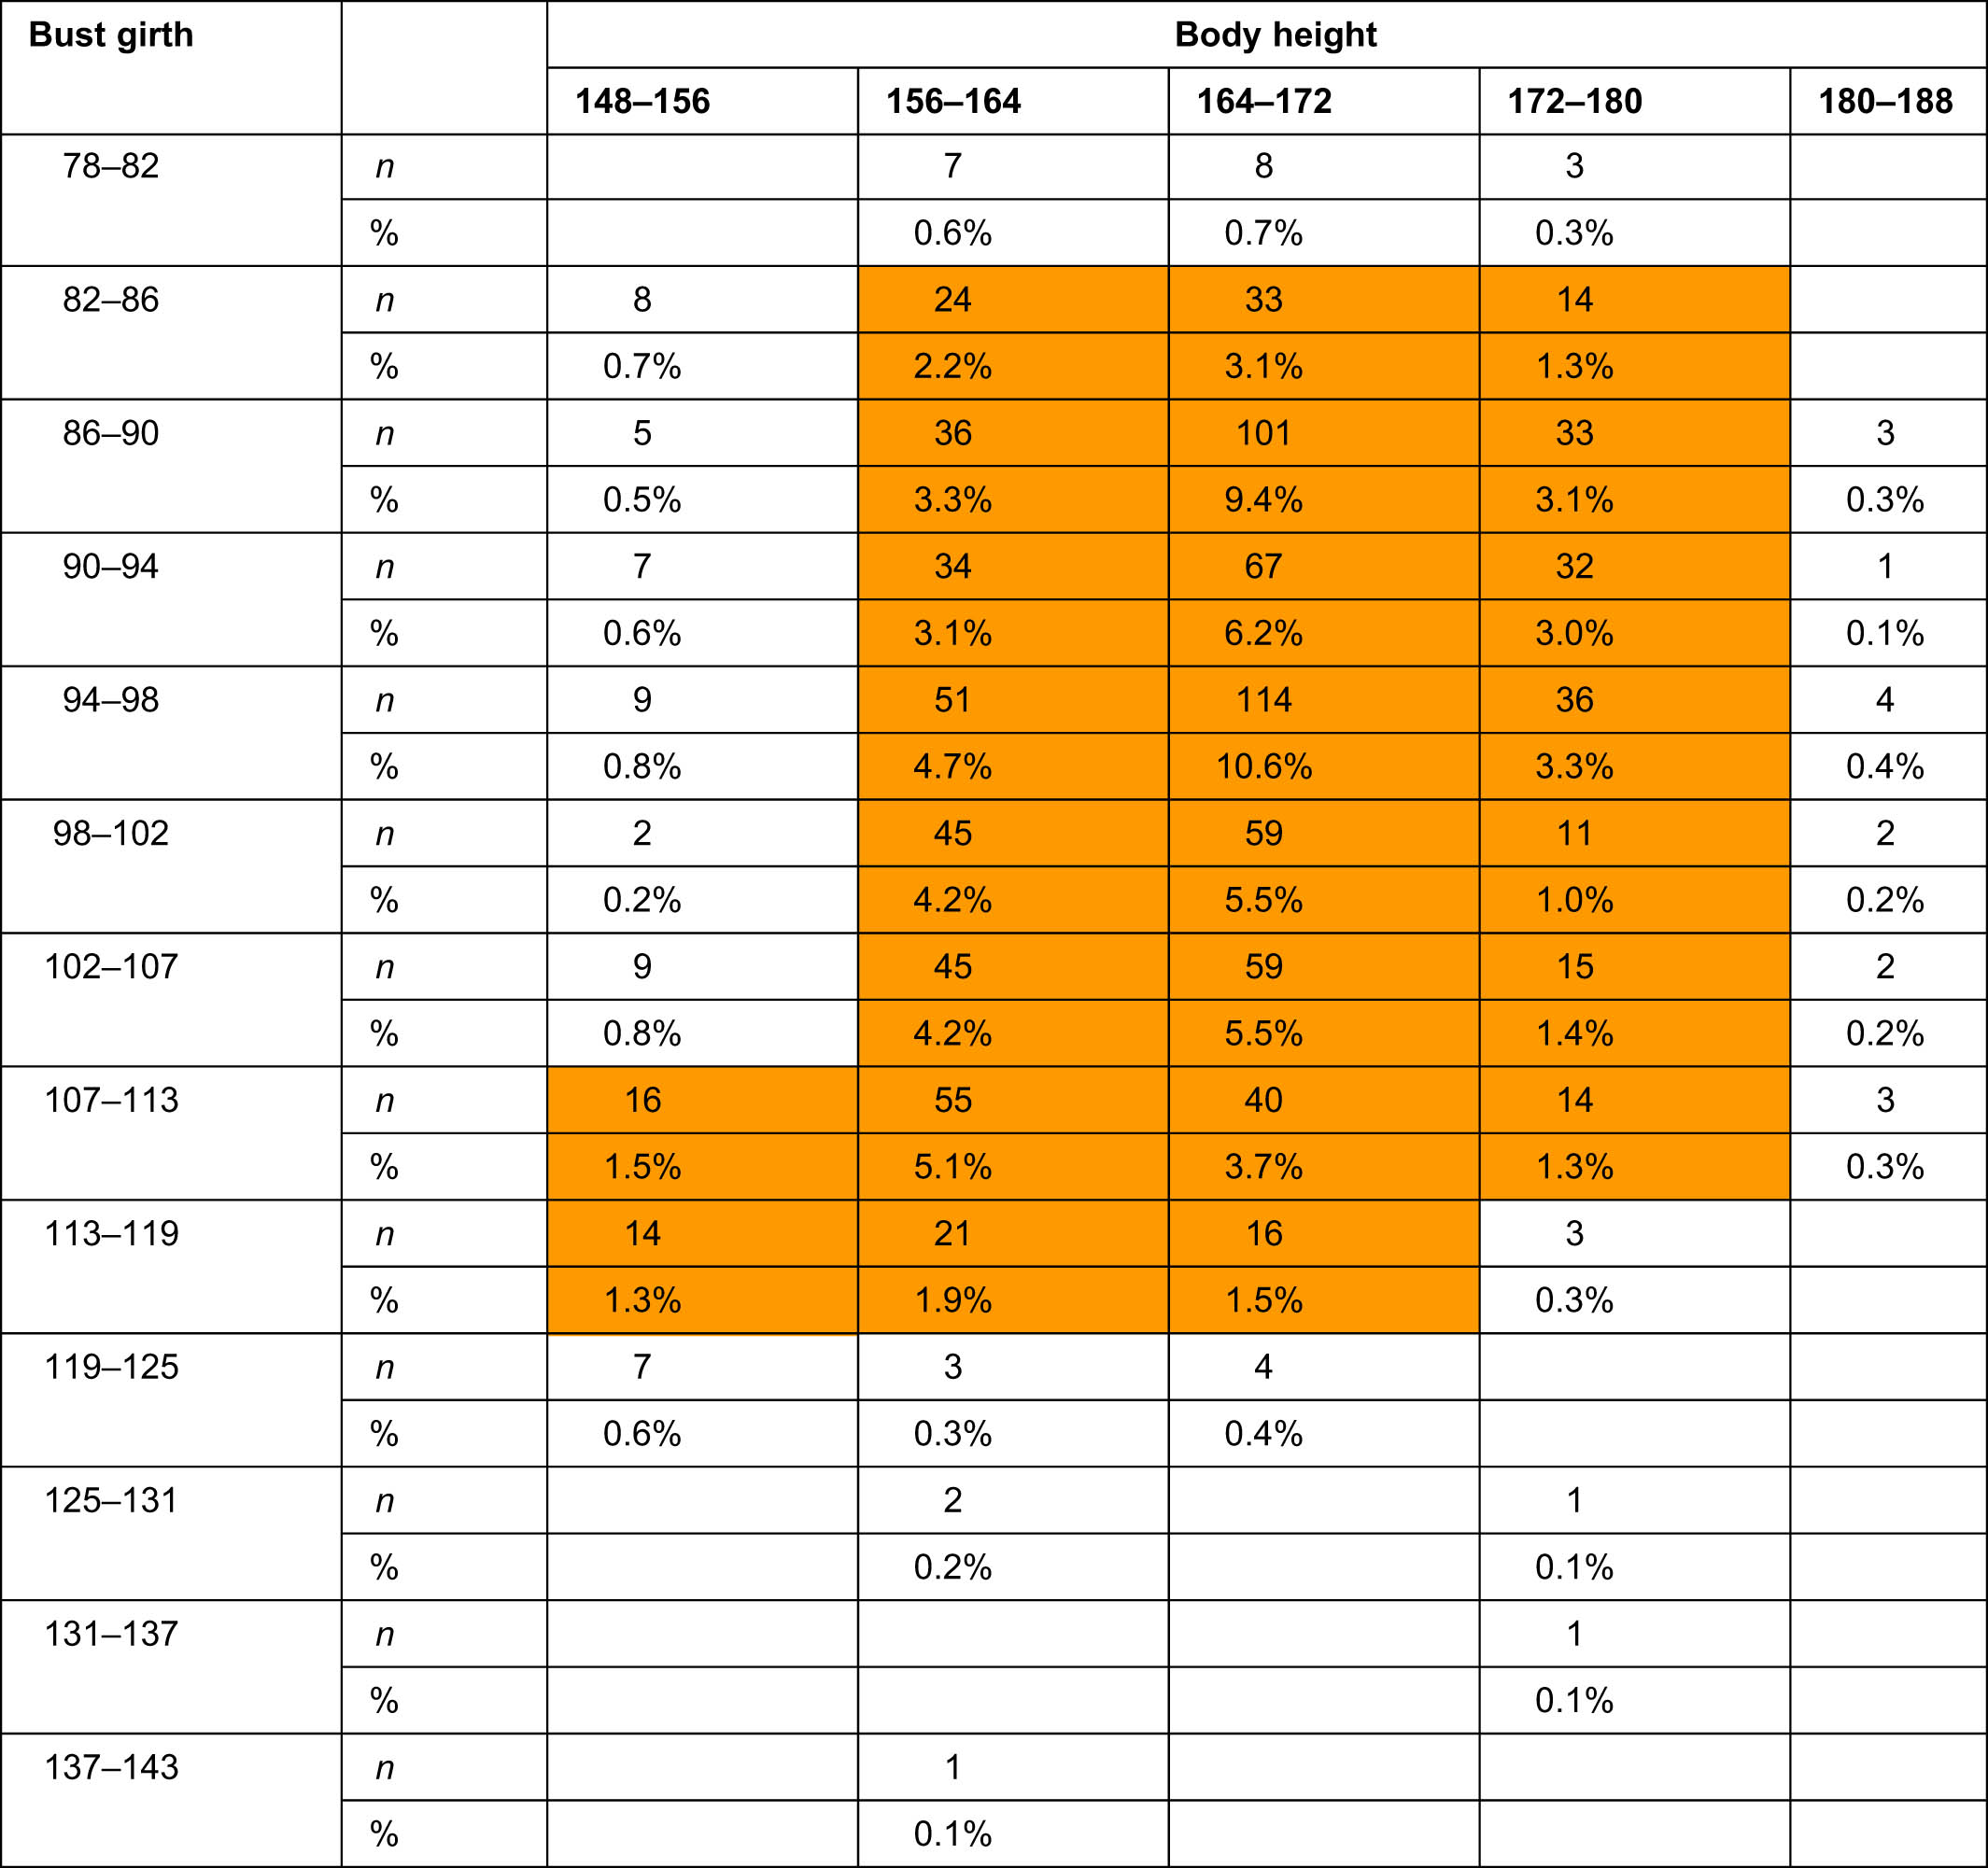
Representation of female subjects in the region of Dalmatia in a particular range of bust girth and body height
 |
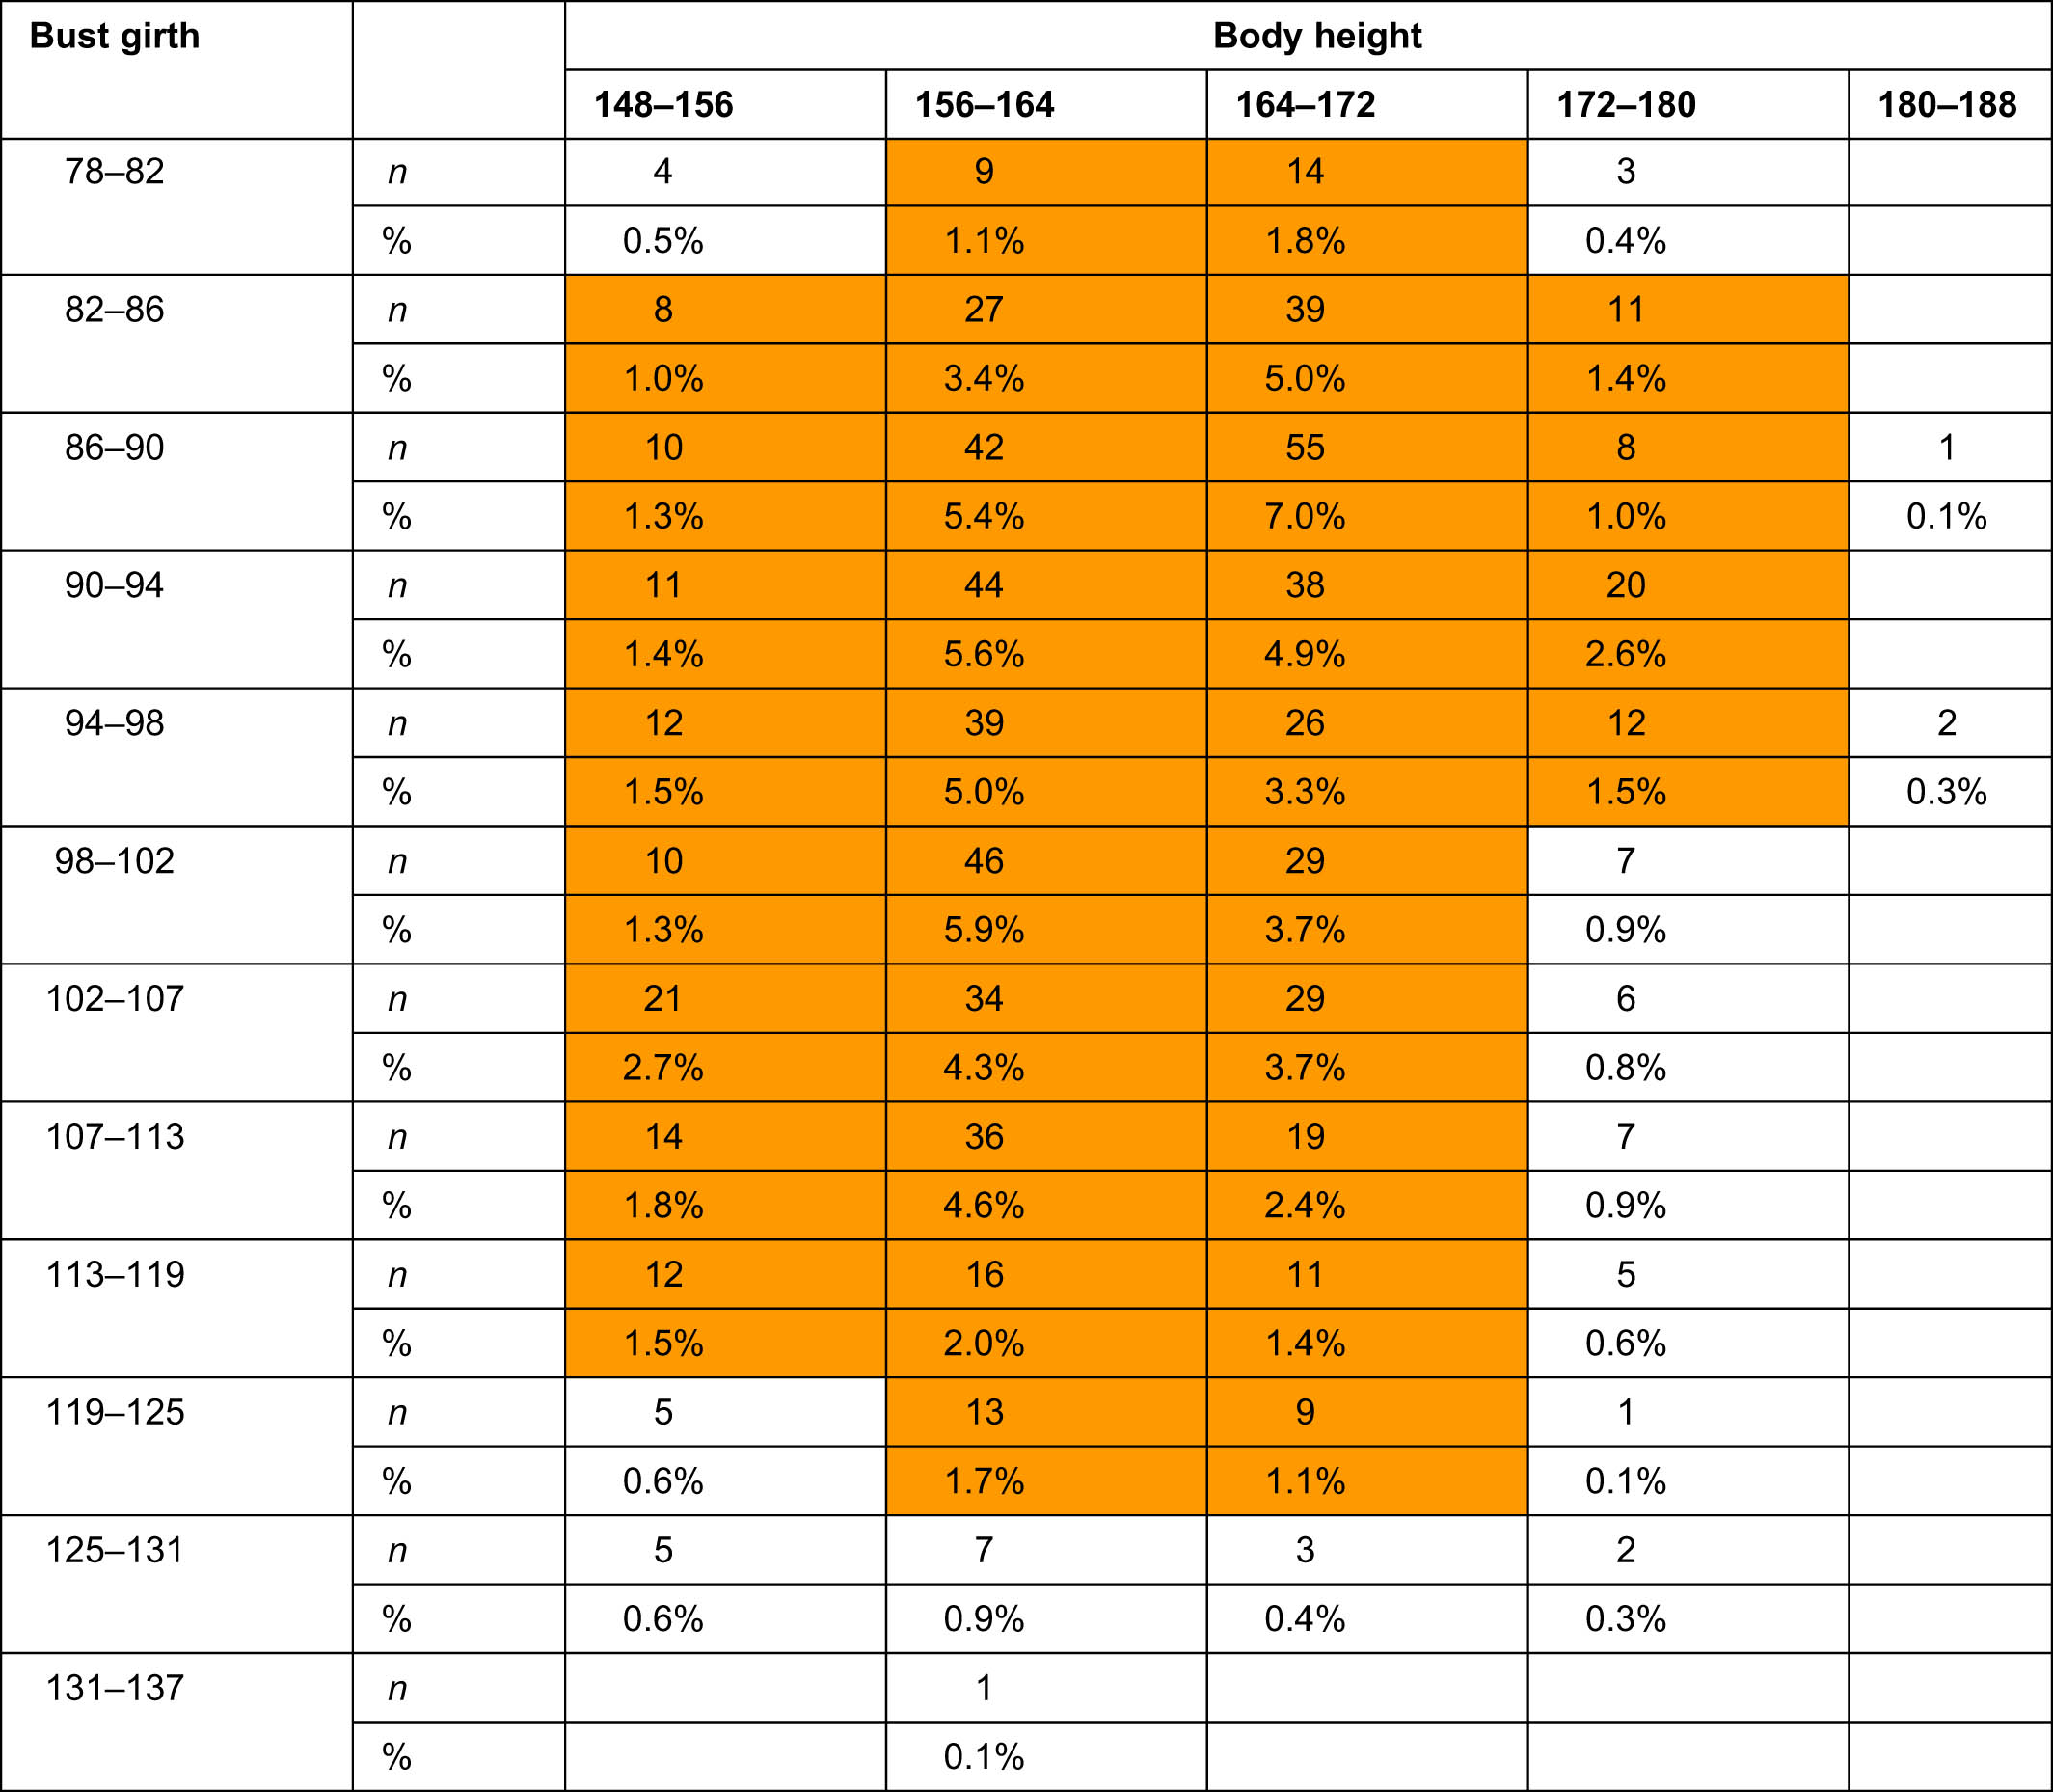
Representation of female respondents in the City of Zagreb in a particular range of bust girth and body height
 |
Out of 47 categories, which make up the total number, a share of more than 1% of the respondents covers 30 of them, which together covers 94% of the population of women in that region. The most frequent category with a share of more than 4% are covered by 405 respondents from the mentioned region. The largest number of category with a share of more than 1% is represented in the area of bust girth from 86 to 119 cm and height categories from 148 to 172 cm. The most common category covers 6.1% of the respondents, and is determined by the bust girth from 86 to 90 cm and body height from 156 to 164 cm.
Of the determined 48 categories with a share of more than 1% of the respondents, 25 of them are covered, which covers 91.4% of the total population of women in that region. The most frequent category with a share of more than 4% are covered by 495 respondents from the mentioned region. The largest number of category with a share of more than 1% of the respondents are represented by categories in the area of chest circumference from 82 to 113 cm and height range from 156 to 180 cm. The most common category covers 10.6% of the respondents, and is determined by the bust girth from 94 to 98 cm and body height from 164 to 172 cm.
Out of a total of 47 determined categories, a share greater than 1% of the female respondents covers 32 of them, which includes 92.3% of the female population of that region. The most frequent category with a share of more than 4% are covered by 334 respondents from the mentioned region. The largest number category with a share of more than 1% are represented in the area of bust girth from 82 to 119 cm and height categories from 148 to 172 cm. The most common category covers 7% of the respondents, and is determined by a bust girth of 86–90 cm and a body height of 164–172 cm.
5 Conclusion
The determined average values of the main body measurements in the sample of female respondents from the regions of the Republic of Croatia indicate changes due to aging. Body height decreases with the increase in age, and according to the measurement results, it is most pronounced in the region of Slavonia, and least in the City of Zagreb. The body height values of female respondents from the City of Zagreb and the region of Slavonia are approximately the same up to the age of 60. In the last three age groups, the body height of the subjects of the City of Zagreb is equal to that of the subjects of the Dalmatia region. The decrease in body height due to the increase in life expectancy is conditioned by changes in the human skeleton during aging, and the results obtained determined the actual values of these changes in the examined sample.
According to research results, the average values of bust girth increase with age. This increase is evident in all regions up to the age of 70, followed by a slight decrease in the value of bust girth due to advanced age and its influence on physical changes. The aforementioned results therefore provided a detailed insight into the resulting changes in body dimensions, and within the framework of this research they form the basis for determining clothing sizes. Therefore, the categories defined by bust girth and height were determined for each individual region and the similarity between the respondents from the City of Zagreb and the region of Slavonia was established. In the subjects from the region of Dalmatia, significant differences are observed, considering that body height from 148 to 156 cm is associated with only two categories, and in the range of body height from 172 to 180 cm, there is a greater number of compared to the remaining two regions. The differences that can be seen confirm the importance of this kind of research, and at the same time, they are a solution to the problems related to the production and marketing of clothes that arise due to the large variation in body dimensions of residents of a certain area. This research established the basis for the development of a system of clothing sizes in all three regions of the Republic of Croatia, because if the table with the values of bust girth and body height is determined, the secondary main body measures, i.e., the girth of the waist and hips that are defined by the body type, are determined quite simply.
-
Conflict of interest: The authors have no conflicts of interest to declare.
References
[1] Ujević, D., Doležal, K. (2010). Croatian anthropometric system in theory and practice, theoretical aspects and application of Croatian anthropometric system. In: Ujević, D. (Ed.). Faculty of Textile Technology University of Zagreb, Croatia.Search in Google Scholar
[2] Ujević, D., Hrastinski, M., Dragčević, Z., Szirovicza, L. (2006). Eksperimentalno utvrđivanje tjelesnih mjera u okviru STIRP-a HAS – Podloga za nove hrvatske norme za veličinu odjeće i obuće. In: Ujević, D. (Ed.). Tekstilno–tehnološki fakultet Sveučilišta u Zagrebu, Zagreb, Croatia.Search in Google Scholar
[3] Kouchi, M. (2020). Anthropometric methods for apparel design: Body measurement devices and techniques. Anthropometry, Apparel Sizing and Design, 29–56. 10.1016/B978-0-08-102604-5.00002-0.Search in Google Scholar
[4] Norton, K. (2018). Standards for anthropometry assessment. Kinanthropometry and Exercise Physiology, 68–137. 10.4324/9781315385662-4.Search in Google Scholar
[5] Balach, M., Lesiakowska-Jablonska, M., Frydrych, I. (2019). Anthropometry and size groups in the clothing industry. Autex Research Journal, 20(1), 1–7. 10.2478/aut-2019-0001.Search in Google Scholar
[6] Doležal, K., Hrženjak, R., Ujević, D. (2016). Determination of a System of Women’s Clothing Sizes in the Goransko-primorska County of the Republic of Croatia. Fibres & Textiles in Eastern Europe, 24(6(120)), 26–31. 10.5604/12303666.1221733 Search in Google Scholar
[7] Ashdown S. P. (2007). Sizing in clothing: Developing effective sizing systems for ready-to-wear clothing. Woodhead Publishing in association with The Textile Institute, Cambridge.10.1201/9781439824306Search in Google Scholar
[8] Qutubuddin, S. M., Hebbal, S. S., Kumar, A. C. S. (2013). Significance of anthropometric data for the manufacturing organizations. Journal of Bioinformatics Research and Applications, 5(I), 111–126.Search in Google Scholar
[9] Gupta, D. (2014). Anthropometry, apparel sizing and design (pp. 34–66). Woodhead Publishing Series in Textiles, Cambridge, England.10.1533/9780857096890.1.34Search in Google Scholar
[10] Doležal, K. (2012). Investigation of the influence of regional characterictics of the physical dimensions garment construction and fit. (PhD thesis). University of Zagreb, Croatia.Search in Google Scholar
[11] Anthropometric System – Measuring and Size Designation of Clothes and Footwear, Croatian Technical Report, HRI 1148:2012 hr, HZN, February 2012. (2012). ICS: 01.040.61:61.020.Search in Google Scholar
[12] Ujević, D., Rogale, D., Hrastinski, M, Drenovac, M., Szirovicza, L., Smolej Narančić, N. (2004). Croatian anthropometric system – Path to Europe. In: Ujević, D. (Ed.). Proceedings of the Professional Conference. Faculty of Textile Technology, University of Zagreb, Croatia.Search in Google Scholar
[13] Horvat, J. (1995). Statistics by SPSS/PC+. Osijek: J. J. Strossmayer University Osijek. Faculty of Economics in Osijek, Croatia.Search in Google Scholar
[14] Pallant, J. (2011). SPSS Survival manual: Astep by step guide to data analysis using SPSS for Windows (Version 15). (3rd ed.). Mikro Knjiga, Beograd.Search in Google Scholar
© 2024 by the authors, published by De Gruyter
This work is licensed under the Creative Commons Attribution 4.0 International License.
Articles in the same Issue
- Characterization of viscoelastic properties of yarn materials: Dynamic mechanical analysis in the transversal direction
- Analysis of omni-channel implementations that are preferred by consumers in clothing sector
- Structural modeling and analysis of three-dimensional cross-linked braided preforms
- An experimental study of mechanical properties and comfortability of knitted imitation woven shirt fabrics
- Technology integration to promote circular economy transformation of the garment industry: a systematic literature review
- Research on T-shirt-style design based on Kansei image using back-propagation neural networks
- Research on She nationality clothing recognition based on color feature fusion with PSO-SVM
- Accuracy prediction of wearable flexible smart gloves
- Preparation and performance of stainless steel fiber/Lyocell fiber-blended weft-knitted fabric
- Development of an emotional response model for hospital gown design using structural equation modeling
- Preparation and properties of stainless steel filament/pure cotton woven fabric
- Facemask comfort enhancement with graphene oxide from recovered carbon waste tyres
- Use of enzymatic processes in the tanning of leather materials
- Optical-related properties and characterization of some textile fibers using near-infrared spectroscopy
- Network modeling of aesthetic effect for Chinese Yue Opera costume simulation images
- Predicting consumers’ garment fit satisfactions by using machine learning
- Non-destructive identification of wool and cashmere fibers based on improved LDA using NIR spectroscopy
- Study on the relationship between structure and moisturizing performance of seamless knitted fabrics of protein fibers for autumn and winter
- Antibacterial and yellowing performances of sports underwear fabric with polyamide/silver ion polyurethane filaments
- Numerical and experimental analysis of ballistic performance in hybrid soft armours composed of para-aramid triaxial and biaxial woven fabrics
- Phonetic smart clothing design based on gender awareness education for preschoolers
- Determination of anthropometric measurements and their application in the development of clothing sizing systems for women in the regions of the Republic of Croatia
- Research on optimal design of pleated cheongsam based on Kano–HOQ–Pugh model
- Numerical investigation of weaving machine heald shaft new design using composite material to improve its performance
- Corrigendum to “Use of enzymatic processes in the tanning of leather materials”
- Shaping of thermal protective properties of basalt fabric-based composites by direct surface modification using magnetron sputtering technique
- Numerical modeling of the heat flow component of the composite developed on the basis of basalt fabric
- Weft insertion guideway design based on high-temperature superconducting levitation
- Ultrasonic-assisted alkali hydrolysis of polyethylene terephthalate fabric and its effect on the microstructure and dyeing properties of fibers
- Comparative study on physical properties of bio-based PA56 fibers and wearability of their fabrics
- Investigation of the bias tape roll change time efficiency in garment factories
- Analysis of foot 3D scans of boys from Polish population
- Optimization of garment sewing operation standard minute value prediction using an IPSO-BP neural network
- Influence of repeated switching of current through contacts made of electroconductive fabrics on their resistance
- Numerical calculation of air permeability of warp-knitted jacquard spacer shoe-upper materials based on CFD
- Compact Spinning with Different Fibre Types: An Experimental Investigation on Yarn Properties in the Condensing Zone with 3D-Printed Guiding Device
- Modeling of virtual clothing and its contact with the human body
- Advances in personalized modelling and virtual display of ethnic clothing for intelligent customization
- Investigation of weave influence on flame retardancy of jute fabrics
- Balloonless spinning spindle head shape optimisation
- Research on 3D simulation design and dynamic virtual display of clothing flexible body
- Turkish textile and clothing SMEs: Importance of organizational learning, digitalization, and internationalization
- Corrigendum To: “Washing characterization of compression socks”
- Study on the promotion multiple of blood flow velocity on human epidermal microcirculation of volcanic rock polymer fiber seamless knitted fabric
- Bending properties and numerical analysis of nonorthogonal woven composites
- Bringing the queen mother of the west to life: Digital reconstruction and analysis of Taoist Celestial Beings Worshiping mural’s apparel
- Modeling process for full forming sports underwear
- Retraction of: Ionic crosslinking of cotton
- An observational study of female body shape characteristics in multiracial Malaysia
- Study on theoretical model and actual deformation of weft-knitted transfer loop based on particle constraint
- Design and 3D simulation of weft-knitted jacquard plush fabrics
- An overview of technological challenges in implementing the digital product passport in the textile and clothing industry
- Understanding and addressing the water footprint in the textile sector: A review
- Determinants of location changes in the clothing industry in Poland
- Influence of cam profile errors in a modulator on the dynamic response of the heald frame
- Quantitative analysis of wool and cashmere fiber mixtures using NIR spectroscopy
- 3D simulation of double-needle bar warp-knitted clustered pile fabrics on DFS
- Finite element analysis of heat transfer behavior in glass fiber/metal composite materials under constant heat load
- Price estimation and visual evaluation of actual white fabrics used for dress shirts and their photographic images
- Effect of gluing garment materials with adhesive inserts on their multidirectional drape and bending rigidity
- Optimization analysis of carrier-track collision in braiding process
- Numerical and experimental analysis of the ballistic performance of soft bulletproof vests for women
- The antimicrobial potential of plant-based natural dyes for textile dyeing: A systematic review using prisma
- Influence of sewing parameters on the skin–fabric friction
- Validation by experimental study the relationship between fabric tensile strength and weave structures
- Optimization of fabric’s tensile strength and bagging deformation using surface response and finite element in stenter machine
- Analysis of lean manufacturing waste in the process flow of ready-to-wear garment production in Nigeria
- An optimization study on the sol–gel process to obtain multifunctional denim fabrics
- Drape test of fully formed knitted flared skirts based on 3D-printed human body posture
- Supplier selection models using fuzzy hybrid methods in the clothing textile industry