Solvothermal Synthesis and Magnetic Properties of Monodisperse Ni0.5Zn0.5Fe2O4 Hollow Nanospheres
-
Min Zhang


Abstract
The monodisperse Ni0.5Zn0.5Fe2O4 nanospheres have been synthesized via a simple solvothermal method. The effects of reactant concentration on structural and magnetic properties have been studied. X-ray diffraction analysis results indicate that the lattice constant and crystallite size can be tuned by controlling reactant concentration. The nanosphere size monotonically decreases from 238 to 35 nm with increasing reactant concentration. The magnetic studies show that blocking temperature is enhanced, and these single-domain particles are superparamagnetism at room temperature. The hollow nanospheres exhibit a high saturation magnetization value of 52.6 emu/g. The nanospheres with various diameters exhibit different magnetic saturation values which may be caused by the domain structure, surface effects and the distribution of metal ions on A and B sites. These superparamagnetic Ni0.5Zn0.5Fe2O4 nanospheres are expected to have potential application in biomedicine and magnetic fluid technology.
Introduction
Nickel–zinc ferrite (Ni–Zn ferrite) is one of the most versatile magnetic materials due to the high saturation magnetization, high Curie temperature, excellent chemical stability, low coercivity and biodegradability [1]. It is a mixed spinel structure based on a face-centered cubic lattice of oxygen ions, with functional units of (ZnxFe1-x) [Ni1-xFe1+x]O4. Zn2+ and Ni2+ ions are known to have very strong preferences for the tetrahedral A and octahedral B sites as depicted by curled and square brackets [2], respectively, while Fe3+ ions partially occupy the A and B sites. In the case of NixZn1−xFe2O4 system, it was found that for x greater than 0.5, Fe3+ moments in A and B sites have collinear arrangement, whereas for x less than 0.5, Fe3+ moments in the B site have noncollinear arrangement [3]. In our previous studies [4], it is found that Ni0.5Zn0.5Fe2O4 presents the best magnetic properties and microwave absorption ability in the Ni1-xZnxFe2O4 system. Thus, it is necessary to further study the microstructure and magnetic properties of Ni0.5Zn0.5Fe2O4 nanoparticles.
Various wet chemical synthesis have been used to prepare nanosized Ni–Zn ferrite powders such as the co-precipitation method [5, 6], hydrothermal route [7], reverse micelle process [8] and sol–gel method [9]. Among these methods, the hydrothermal/solvothermal method requires neither expensive starting materials and environment unfriendly solvent nor extremely high temperature and pressure. Hence, the hydrothermal/solvothermal method is usually used to synthesize Ni–Zn ferrites.
Some groups [7, 10] have synthesized the Ni0.5Zn0.5Fe2O4 sample by hydrothermal method and investigated different morphology and magnetic properties of the spinel ferrite samples by controlling the process parameters such as solution pH value, reaction temperature and durable time. However, few groups have investigated the morphology and magnetic properties by adjusting the reactant concentration. Some templates, such as silica [11] and carbon [12], have been widely investigated to prepare hollow spheres. However, the synthetic process usually suffers from high cost or complicated operation. Gu et al. [12] have reported the synthesis of CoFe2O4 hollow spheres obtained from hydrothermal treatment of the mixed solution of glucose. It was found that the variation of metal concentration showed little influence on the size of hollow spheres. Recently, considerable attention has been focused on hollow nanostructure without any templates. Jiang et al. [13] have fabricated hollow spheres of ZnFe2O4 without the assistance of a template by solvothermal method. ZnFe2O4 exhibited ferromagnetic properties with high saturation magnetization (Ms) of 83.4 emu/g. The relatively high Ms was induced by the superexchange effect which existed in the site of Zn–O–Fe.
Here, to the best of our knowledge, our group has synthesized monodisperse Ni0.5Zn0.5Fe2O4 hollow nanospheres without adding any surfactants or templates by controlling the reactant concentration in nonaqueous hydrothermal method. It is the first time to systematically demonstrate the effect of nanosphere size of Ni0.5Zn0.5Fe2O4 ferrites on the magnetic behaviors. The possible formation mechanism is discussed in detail.
Experimental
The monodisperse Ni0.5Zn0.5Fe2O4 (NZFO) nanospheres have been prepared using the solvothermal method, reported elsewhere [14]. For simplicity, the NZFO powders obtained under the same reaction conditions of temperature and reaction time, but with different concentrations, are named as NZFO-A, where A represents the mole number of the as-prepared NZFO powders. For example, NZFO-200 indicates that 0.002 mol NZFO powders were prepared at 180 °C with 24 h.
X-ray diffraction (XRD) patterns of the as-prepared products were recorded on a Philips X’pert PRO x-ray diffractometer with Cu Kα radiation. Field emission scanning electron microscopy (FESEM, FEI Sirion 200) and transmission electron microscopy (TEM, JEM-2010) were used to show the surface morphology and particle size distribution. The magnetic properties of the NZFO ferrite powders were measured by using a superconducting quantum interference device magnetometer measurement system (SQUID, MPMS-5T). The zero-field cooling (ZFC) and field cooling (FC) magnetization curves were performed in the temperature range between 5 and 350 K under an applied magnetic field of 100 Oe.
Results and Discussion
Structure and Morphology
Figure 1 shows the room-temperature XRD patterns and Rietveld analysis results for NZFO ferrite at different reactant concentrations. The parameters Rp (profile fitting R value), Rwp (weighted profile R value) and χ2 (goodness-of-fit quality factor) obtained after refinement are presented in Figure 1. For an excellent fit, the value of χ2 should be nearly one. As shown in Figure 1, the value of χ2 is less than or equal to two. Hence, the good fitting parameters indicate that the studied samples are of better quality and refinements of samples are effective. All reflection peaks have a good agreement with the standard JCPDS card of Ni-Zn ferrite (card no. 08-0234), and no other phase is detectable. The lattice constant a is obtained by Rietveld method, as listed Table 1. It is observed that the a value obviously increases with the increase in reactant concentration, indicating lattice expansion. According to the references [6, 15], we suppose that the variation of lattice constant can be attributed to the cation redistribution between A and B sites. The Zn2+, Ni2+ and Fe3+ cations simultaneously occupy the A and B sites of the spinel structure. For increasing the reactant concentration, the cation redistribution on A and B sites can increase the ionic radii of A and B sites, resulting in the increase of lattice constant. As shown in Figure 1, the corresponding diffraction peaks become narrower and sharper with increasing concentration of as-prepared NZFO except NZFO-500 sample, which indicates the growth in crystallite and much better crystallinity.

Refined room-temperature XRD patterns of Ni0.5Zn0.5Fe2O4 with different reactant concentrations. The black circle, red, blue and green lines signals represent the experimental pattern (Exp.), calculated pattern (Cal.), Bragg position and the difference plot (Exp.- Cal.), respectively.
Lattice constant a (Å), crystalline size D (nm), nanosphere size (nm), saturation magnetization Ms (emu/g), coercivity Hc (Oe) and blocking temperature (TB) of the Ni0.5Zn0.5Fe2O4 samples as a function of the reactant concentration.
| Reactant concentration (10–3 mol) | Lattice constant (Å) | Crystallite size (nm) | Nanosphere size (nm) | Ms (emu/g) | Hc (Oe) | TB (K) |
|---|---|---|---|---|---|---|
| 300 K | 300 K | |||||
| 0.25 | 8.3683 | 15 | 238 | … | … | 91 |
| 1.00 | 8.3777 | 17 | 236 | 44.5 | 8.8 | 134 |
| 2.00 | 8.3796 | 21 | 145 | 46.2 | 5.1 | 165 |
| 3.00 | 8.3811 | 22 | 125 | 52.6 | 2.7 | 236 |
| 4.00 | 8.3865 | 31 | 62 | 49.0 | 8.4 | >350 |
| 5.00 | 8.3858 | 18 | 35 | 51.7 | 10.1 | 217 |
The crystallite size for all NZFO nanoparticles is calculated from intensity (311) peak by the Debye–Scherrer equation:
where D is the crystallite size, λ is the wavelength of Cu Kα (λ=1.540598 Å), θ is the angle of Bragg diffraction and β is the full width at half maxima broadening. The values of crystallite size are listed in Table 1, and the variation tendency as a function of reactant concentration is shown in Figure 2. It is observed that crystallite size increases from 15 to 31 nm with increasing concentration, and then decreases to 18 nm as the reactant concentration increases further. The variation of crystallite size as a function of reactant concentration can be attributed to the nucleation and growth of crystals [16]. Once the crystal nuclei are formed, they form a crystal–liquid interface to grow up, namely atoms and ions of component crystals according to the arrangement form of the crystal structure to pile up crystals. The suitable reactant concentration increases the solubility of the crystalline substance and improves the crystal growth rate. So higher reactant concentration accelerates the growth of the crystal. But the excessive reactant concentration can increase the viscosity of the solution and then affect the solute convection, which will inhibit crystal growth. In addition, the decrease in crystallite size could also be related to the higher nucleation rate at higher reactant concentration, causing the consumption of the whole amount of reactants in the solution and stopping the growth of the crystals [17]. As a result, the reactant concentration reaches a critical value of 4 mmol, and then the crystallite size begins to decrease. Thus, the reactant concentration plays an important role in determining the crystallite size.

The variations of (a) lattice constant, (b) crystallite size and nanosphere size with the reactant concentration for NZFO samples.
The microstructure of the NZFO ferrite samples is analyzed by SEM. The surface morphology and the corresponding nanosphere size distribution graphs of NZFO with different reactant concentrations are shown in Figure 3. The spherical shape can be observed clearly in all samples. It can be clearly seen that the magnetic nanoparticles are agglomerated, but nanospheres consisting of nanoparticles are well monodisperse. The size distribution of the nanospheres was estimated by taking the average of 200 nanospheres and fitting the resultant histogram by a Gaussian function (solid line), as shown in the insets of Figure 3, indicating the size distribution is narrow. The corresponding values of nanosphere size are listed in Table 1. The center of the size distribution curves is shifted from 238 to 35 nm as the concentration increases, as shown in Figure 2, showing the significant influence of the reactant concentration on the nanosphere size. This phenomenon can be explained as the classical theories of crystal heterogeneous nucleation [13]. As indicated by the arrows in the inset of Figure 3(d), there exist open pores and some broken spheres, indicating the presence of hollow spheres in the NZFO-300 sample. The formation of the hollow NZFO nanospheres can be explained by the Ostwald ripening process [18].

SEM images of NZFO ferrite under different reactant concentrations, the inset is the corresponding particle size distribution graph. (a) NZFO-025, (b) NZFO-100, (c) NZFO-200, (d) NZFO-300, (e) NZFO-400 and (f) NZFO-500.
Figure 4 shows the representative TEM images of the NZFO-100 and NZFO-300 samples. Uniform and monodispersed nanospheres are observed. From Figure 4(b), the apparent contrast between the dark edge and the pale center confirms that the NZFO-300 nanospheres have a hollow interior, with the average outer diameter of 135 nm and the wall thickness of 45 nm. The inset of Figure 4(b) reveals clearly that the spherical shell are packed with numerous NZFO nanoparticles, and the average particle diameter is about 20 nm, which verifies the calculating results from XRD data. The insets of Figures 4(a)and 4(b) show the selected area electron diffraction (SAED) pattern. The SAED pattern shows diffuse rings that can be indexed to NZFO [(220), (311), (400), (422), (511), and (440)] plane reflections. High-resolution TEM (HRTEM) analysis is employed to determine the crystal facets and orientation. As shown in Figure 4(c), the lattice fringe spacing of d=0.25 nm agrees well with the (311) lattice plane of cubic NZFO. From Figure 4(d), the results from energy-dispersive x-ray analysis (EDX) spectra show that the as-prepared hollow nanospheres contain Ni, Zn, Fe and O, and no contamination element is detected.

(a) TEM images of the NZFO-100 sample and (b) the NZFO-300 sample. The insets are the corresponding SAED pattern and magnified image; (c) high magnification TEM image of NZFO-300 sample; (d) EDX spectrum of the NZFO-100 sample.
Magnetic Properties
The temperature (5 K<T<350 K) dependence of magnetization curves in an external field of 100 Oe recorded in ZFC and FC modes are clearly shown in Figure 5. At first, when the sample is cooled to 5 K without any external magnetic field, the total magnetization of particles will be zero because of randomly oriented magnetic moment. Then, an external magnetic field of 100 Oe is applied, which favors the moment of individual particle to reorient along the applied field at low temperature. With an increase in the temperature, more and more nanoparticles follow the direction of the applied magnetic field and reach the maximum at the blocking temperature (TB). The ZFC magnetization curves appear maximum at the blocking temperature TB at which the relaxation time equals the time scale of the magnetization measurements.

Temperature dependence of magnetization for field cooled (FC) and zero-field cooled (ZFC) NZFO nanoparticles under an applied field of 100 Oe.
Based on the above analysis, the reactant concentration is critical to the particle size. The TB values of NZFO-025, NZFO-100, NZFO-200, NZFO-300 and NZFO-500 are 91 K, 134 K, 165 K, 236 K and 217 K, respectively, as listed in Table 1, indicating that the different particle sizes are characterized by different average energy barriers. Note that the TB value of the NZFO-400 sample is higher than 350 K. The value of TB initially increases with an increase in the reactant concentration, and then decreases as the reactant concentration increases further.
In addition, in the spherical particle model, the critical size from single domain to multidomain can be calculated with the following formula [19]
where
According to the Stoner–Wohlfarth theory, the magnetocrystalline anisotropy EA of a single-domain particle can be expressed as [21]
where K is the magnetocrystalline anisotropy constant, V is the volume of the nanoparticle and θ is the angle between the magnetic direction and the easy axis of the nanoparticles. The anisotropy acts as the energy barrier to prevent the change of the magnetization direction. When the size of the magnetic nanoparticle is reduced to a threshold value, EA is comparable with thermal activation energy, kBT, with kB as the Boltzmann constant, and the magnetization direction of the nanoparticle can be easily moved away from the easy axis by thermal activation. Above TB, thermal activation can overcome the anisotropy energy barrier and the nanoparticles become superparamagnetic with the magnetization direction randomly flipping. Below TB, thermal activation is no longer able to overcome the magnetocrystalline anisotropy of the nanoparticles. According to the above analysis, larger nanoparticles possess a higher EA, and require a higher kBT to become superparamagnetic. Therefore, the value of TB increases with an increase in crystalline size.
The room-temperature magnetic hysteresis loops (M-H) of the NZFO nanoparticles prepared with different reactant concentrations are shown Figure 6. The samples exhibit nonsaturated magnetization even at the maximum applied field of 2 T, which indicates the superparamagnetic nature. Above the blocking temperature, the thermal activation can overcome the magnetocrystalline anisotropy, and the magnetocrystalline anisotropy constant may be seen as zero. Consequently, the negligible hysteresis of the nanoparticles is observed, as shown in the inset of Figure 6.
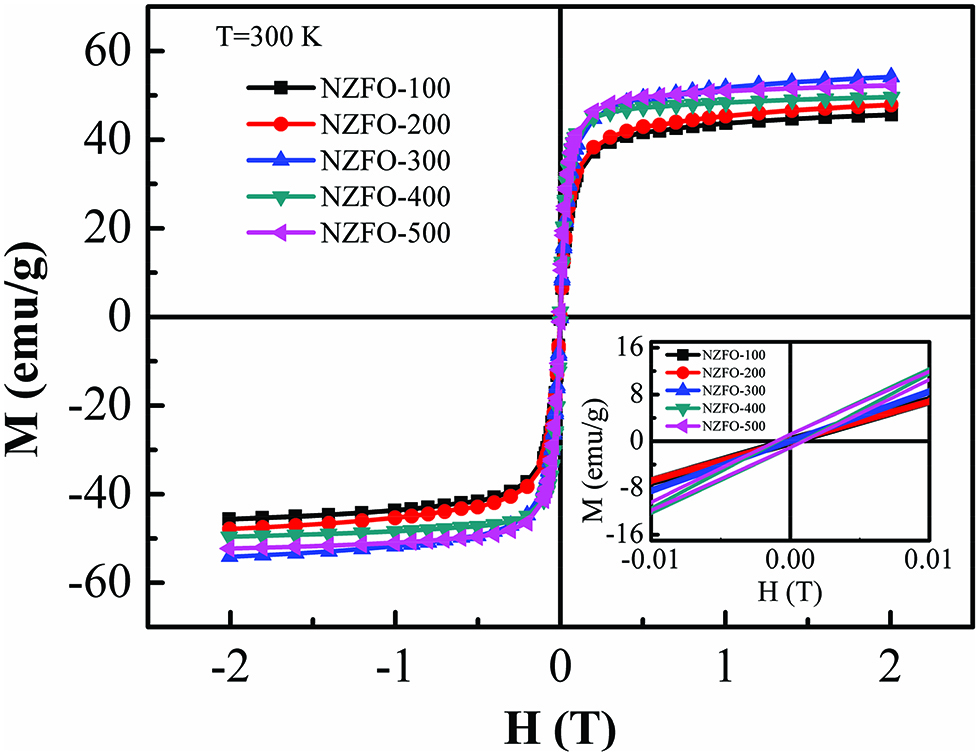
Room-temperature M-H loops for NZFO ferrites with different reactant concentrations. The inset shows the corresponding magnified view of the M-H curves at lower applied field.
The magnetic moment is obtained using nonlinear curve fit of Langevin function, which is described as the following equations [22]:
where

The nonlinear curve fit of Langevin function for the NZFO-100, NZFO-200 NZFO-300 and NZFO-500 samples.
The magnetization curves of the NZFO nanoparticles prepared under different reactant concentrations at 10 K are shown in Figure 8. Below the blocking temperature, the thermal activation is no longer able to overcome the magnetocrystalline anisotropy. Therefore, the NZFO nanoparticles show typical hysteresis behaviors, as shown in inset of Figure 8.
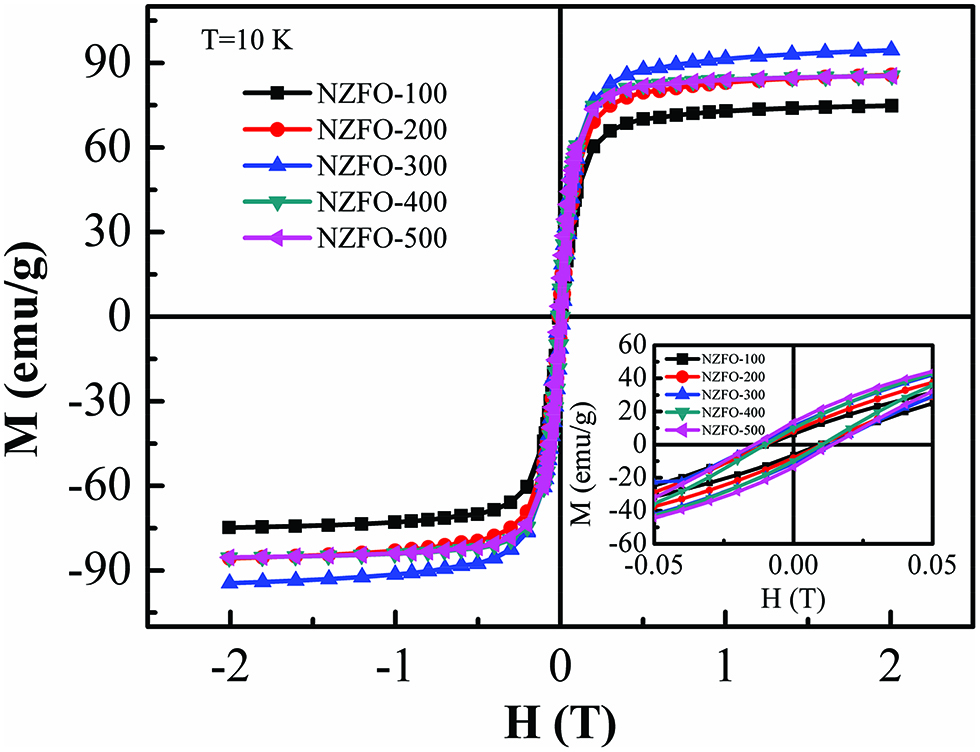
The M-H loops for NZFO ferrites at different reactant concentrations at 10 K. The inset shows the corresponding magnified view of the M-H curves at lower applied field.
Conclusions
In summary, we have synthesized the monodisperse Ni0.5Zn0.5Fe2O4 nanospheres by one-step solvothermal method. The variation of crystallite size and nanospheres size can be adjusted by controlling reactant concentration. SEM and TEM characterizations confirm hollow structure of NZFO-300 nanospheres. Room-temperature superparamagnetic behaviors of synthesized samples are confirmed by magnetic measurement. The prepared hollow magnetite spheres exhibit high saturation magnetization of 52.6 emu/g at room temperature, which may be induced by the distribution of metal ions on A and B sites. Our study demonstrates the monodisperse Ni0.5Zn0.5Fe2O4 nanospheres may be potential candidates for application as biomedicine and magnetic fluid.
Funding statement: This work was financially supported by the Foundation of Educational Commission of Anhui Province (KJ2016B004), Anhui Provincial Natural Science Foundation (1508085ME100) and key technical project of Huaibei City (20140311).
References
[1] M.M. Rashad, D.A. Rayan, A.O. Turky, et al., J. Magn. Magn. Mater., 374 (2015) 359–366.10.1016/j.jmmm.2014.08.031Search in Google Scholar
[2] S.D. Shenoy, P.A. Joy and M.R. Anantharaman, J. Magn. Magn. Mater., 269 (2004) 217–226.10.1016/S0304-8853(03)00596-1Search in Google Scholar
[3] N. Ponpandian, A. Narayanasamy, C.N. Chinnasamy, et al., Appl. Phys. Lett., 86 (2005) 192510.10.1063/1.1925755Search in Google Scholar
[4] M. Zhang, Q.C. Liu, Z.F. Zi, et al., Sci. China Tech. Sci., 56 (2012) 13–19.10.1007/s11431-012-5057-5Search in Google Scholar
[5] G.S. Shahane, A. Kumar, M. Arora, et al., J. Magn. Magn. Mater., 322 (2010) 1015–1019.10.1016/j.jmmm.2009.12.006Search in Google Scholar
[6] C. Srinivas, B.V. Tirupanyam, A. Satish, et al., J. Magn. Magn. Mater., 382 (2015) 15–19.10.1016/j.jmmm.2015.01.008Search in Google Scholar
[7] X. Li, Q. Li, Z. Xia, et al., J. Alloys Compd., 458 (2008) 558–563.10.1016/j.jallcom.2007.04.214Search in Google Scholar
[8] S.A. Morrison, C.L. Cahill, E.E. Carpenter, et al., J. Appl. Phys., 95 (2004) 6392–6395.10.1063/1.1715132Search in Google Scholar
[9] L.-Z. Li, L. Peng, X.-X. Zhong, et al., Ceram. Int., 42 (2016) 13238–13241.10.1016/j.ceramint.2016.05.120Search in Google Scholar
[10] H.-W. Wang and S.-C. Kung, J. Magn. Magn. Mater., 270 (2004) 230–236.10.1016/j.jmmm.2003.09.019Search in Google Scholar
[11] C.-R. Lin, I.H. Chen, C.-C. Wang, et al., Acta Mater, 59 (2011) 6710–6716.10.1016/j.actamat.2011.07.028Search in Google Scholar
[12] J. Gu, S. Li, M. Ju, et al., J. Cryst. Growth, 320 (2011) 46–51.10.1016/j.jcrysgro.2011.01.072Search in Google Scholar
[13] W. Jiang, Z. Cao, R. Gu, et al., Smart Mater. Struct., 18 (2009) 125013.10.1088/0964-1726/18/12/125013Search in Google Scholar
[14] M. Zhang, X.-W. Gao, Z.F. Zi, et al., Electrochim. Acta, 147 (2014) 143–150.10.1016/j.electacta.2014.09.072Search in Google Scholar
[15] C. Venkataraju, G. Sathishkumar and K. Sivakumar, J. Magn. Magn. Mater., 322 (2010) 230–233.10.1016/j.jmmm.2009.08.043Search in Google Scholar
[16] X. Lin, G. Ji, Y. Liu, et al., Cryst. Eng. Comm., 14 (2012) 8658.10.1039/c2ce26296gSearch in Google Scholar
[17] C. Vázquez-Vázquez, M.A. López-Quintela, M.C. Buján-Núñez, et al., J. Nanopart. Res., 13 (2010) 1663–1676.10.1007/s11051-010-9920-7Search in Google Scholar
[18] Y.F. Deng, Q.M. Zhang, S.D. Tang, et al., Chem. Commun., 47 (2011) 6828–6830.10.1039/c0cc05001fSearch in Google Scholar
[19] C. Caizer, Mater. Sci. Eng., B, 100 (2003) 63.10.1016/S0921-5107(03)00075-8Search in Google Scholar
[20] A.S. Albuquerque, J.D. Ardisson, W.A.A. Macedo, et al., J. Appl. Phys., 87 (2000) 4352–4357.10.1063/1.373077Search in Google Scholar
[21] D.L. Leslie-Pelecky and R.D. Rieke, Chem. Mater., 8 (1996) 1770–1783.10.1021/cm960077fSearch in Google Scholar
[22] D.G. Chen, X.G. Tang, J.B. Wu, et al., J. Magn. Magn. Mater.323 (2011) 1717–1721.10.1016/j.jmmm.2011.02.002Search in Google Scholar
[23] V. Sreeja, S. Vijayanand, S. Deka, et al., Hyperfine Interact, 183 (2008) 271–279.10.1007/978-3-540-78697-9_32Search in Google Scholar
[24] Q. Song and Z.J. Zhang, J. Am. Chem. Soc., 126 (2004) 6164–6168.10.1021/ja049931rSearch in Google Scholar PubMed
[25] S. Ayyappan, S. Mahadevan, P. Chandramohan, et al., J. Phys. Chem. C, 114 (2010) 6334–6341.10.1021/jp911966pSearch in Google Scholar
[26] F. Wang, J. Liu, J. Kong, et al., J. Mater. Chem., 21 (2011) 4314.10.1039/c0jm02894kSearch in Google Scholar
[27] A.G. Yan, X.H. Liu, R. Yi, et al., J. Phys. Chem. C, 112 (2008) 8558–8563.10.1021/jp800997zSearch in Google Scholar
© 2019 Walter de Gruyter GmbH, Berlin/Boston
This work is licensed under the Creative Commons Attribution 4.0 Public License.
Articles in the same Issue
- Frontmatter
- Review Article
- Research on the Influence of Furnace Structure on Copper Cooling Stave Life
- Influence of High Temperature Oxidation on Hydrogen Absorption and Degradation of Zircaloy-2 and Zr 700 Alloys
- Correlation between Travel Speed, Microstructure, Mechanical Properties and Wear Characteristics of Ni-Based Hardfaced Deposits over 316LN Austenitic Stainless Steel
- Factors Influencing Gas Generation Behaviours of Lump Coal Used in COREX Gasifier
- Experiment Research on Pulverized Coal Combustion in the Tuyere of Oxygen Blast Furnace
- Phosphate Capacities of CaO–FeO–SiO2–Al2O3/Na2O/TiO2 Slags
- Microstructure and Interface Bonding Strength of WC-10Ni/NiCrBSi Composite Coating by Vacuum Brazing
- Refill Friction Stir Spot Welding of Dissimilar 6061/7075 Aluminum Alloy
- Solvothermal Synthesis and Magnetic Properties of Monodisperse Ni0.5Zn0.5Fe2O4 Hollow Nanospheres
- On the Capability of Logarithmic-Power Model for Prediction of Hot Deformation Behavior of Alloy 800H at High Strain Rates
- 3D Heat Conductivity Model of Mold Based on Node Temperature Inheritance
- 3D Microstructure and Micromechanical Properties of Minerals in Vanadium-Titanium Sinter
- Effect of Martensite Structure and Carbide Precipitates on Mechanical Properties of Cr-Mo Alloy Steel with Different Cooling Rate
- The Interaction between Erosion Particle and Gas Stream in High Temperature Gas Burner Rig for Thermal Barrier Coatings
- Permittivity Study of a CuCl Residue at 13–450 °C and Elucidation of the Microwave Intensification Mechanism for Its Dechlorination
- Study on Carbothermal Reduction of Titania in Molten Iron
- The Sequence of the Phase Growth during Diffusion in Ti-Based Systems
- Growth Kinetics of CoB–Co2B Layers Using the Powder-Pack Boriding Process Assisted by a Direct Current Field
- High-Temperature Flow Behaviour and Constitutive Equations for a TC17 Titanium Alloy
- Research on Three-Roll Screw Rolling Process for Ti6Al4V Titanium Alloy Bar
- Continuous Cooling Transformation of Undeformed and Deformed High Strength Crack-Arrest Steel Plates for Large Container Ships
- Formation Mechanism and Influence Factors of the Sticker between Solidified Shell and Mold in Continuous Casting of Steel
- Casting Defects in Transition Layer of Cu/Al Composite Castings Prepared Using Pouring Aluminum Method and Their Formation Mechanism
- Effect of Current on Segregation and Inclusions Characteristics of Dual Alloy Ingot Processed by Electroslag Remelting
- Investigation of Growth Kinetics of Fe2B Layers on AISI 1518 Steel by the Integral Method
- Microstructural Evolution and Phase Transformation on the X-Y Surface of Inconel 718 Ni-Based Alloys Fabricated by Selective Laser Melting under Different Heat Treatment
- Characterization of Mn-Doped Co3O4 Thin Films Prepared by Sol Gel-Based Dip-Coating Process
- Deposition Characteristics of Multitrack Overlayby Plasma Transferred Arc Welding on SS316Lwith Co-Cr Based Alloy – Influence ofProcess Parameters
- Elastic Moduli and Elastic Constants of Alloy AuCuSi With FCC Structure Under Pressure
- Effect of Cl on Softening and Melting Behaviors of BF Burden
- Effect of MgO Injection on Smelting in a Blast Furnace
- Structural Characteristics and Hydration Kinetics of Oxidized Steel Slag in a CaO-FeO-SiO2-MgO System
- Optimization of Microwave-Assisted Oxidation Roasting of Oxide–Sulphide Zinc Ore with Addition of Manganese Dioxide Using Response Surface Methodology
- Hydraulic Study of Bubble Migration in Liquid Titanium Alloy Melt during Vertical Centrifugal Casting Process
- Investigation on Double Wire Metal Inert Gas Welding of A7N01-T4 Aluminum Alloy in High-Speed Welding
- Oxidation Behaviour of Welded ASTM-SA210 GrA1 Boiler Tube Steels under Cyclic Conditions at 900°C in Air
- Study on the Evolution of Damage Degradation at Different Temperatures and Strain Rates for Ti-6Al-4V Alloy
- Pack-Boriding of Pure Iron with Powder Mixtures Containing ZrB2
- Evolution of Interfacial Features of MnO-SiO2 Type Inclusions/Steel Matrix during Isothermal Heating at Low Temperatures
- Effect of MgO/Al2O3 Ratio on Viscosity of Blast Furnace Primary Slag
- The Microstructure and Property of the Heat Affected zone in C-Mn Steel Treated by Rare Earth
- Microwave-Assisted Molten-Salt Facile Synthesis of Chromium Carbide (Cr3C2) Coatings on the Diamond Particles
- Effects of B on the Hot Ductility of Fe-36Ni Invar Alloy
- Impurity Distribution after Solidification of Hypereutectic Al-Si Melts and Eutectic Al-Si Melt
- Induced Electro-Deposition of High Melting-Point Phases on MgO–C Refractory in CaO–Al2O3–SiO2 – (MgO) Slag at 1773 K
- Microstructure and Mechanical Properties of 14Cr-ODS Steels with Zr Addition
- A Review of Boron-Rich Silicon Borides Basedon Thermodynamic Stability and Transport Properties of High-Temperature Thermoelectric Materials
- Siliceous Manganese Ore from Eastern India:A Potential Resource for Ferrosilicon-Manganese Production
- A Strain-Compensated Constitutive Model for Describing the Hot Compressive Deformation Behaviors of an Aged Inconel 718 Superalloy
- Surface Alloys of 0.45 C Carbon Steel Produced by High Current Pulsed Electron Beam
- Deformation Behavior and Processing Map during Isothermal Hot Compression of 49MnVS3 Non-Quenched and Tempered Steel
- A Constitutive Equation for Predicting Elevated Temperature Flow Behavior of BFe10-1-2 Cupronickel Alloy through Double Multiple Nonlinear Regression
- Oxidation Behavior of Ferritic Steel T22 Exposed to Supercritical Water
- A Multi Scale Strategy for Simulation of Microstructural Evolutions in Friction Stir Welding of Duplex Titanium Alloy
- Partition Behavior of Alloying Elements in Nickel-Based Alloys and Their Activity Interaction Parameters and Infinite Dilution Activity Coefficients
- Influence of Heating on Tensile Physical-Mechanical Properties of Granite
- Comparison of Al-Zn-Mg Alloy P-MIG Welded Joints Filled with Different Wires
- Microstructure and Mechanical Properties of Thick Plate Friction Stir Welds for 6082-T6 Aluminum Alloy
- Research Article
- Kinetics of oxide scale growth on a (Ti, Mo)5Si3 based oxidation resistant Mo-Ti-Si alloy at 900-1300∘C
- Calorimetric study on Bi-Cu-Sn alloys
- Mineralogical Phase of Slag and Its Effect on Dephosphorization during Converter Steelmaking Using Slag-Remaining Technology
- Controllability of joint integrity and mechanical properties of friction stir welded 6061-T6 aluminum and AZ31B magnesium alloys based on stationary shoulder
- Cellular Automaton Modeling of Phase Transformation of U-Nb Alloys during Solidification and Consequent Cooling Process
- The effect of MgTiO3Adding on Inclusion Characteristics
- Cutting performance of a functionally graded cemented carbide tool prepared by microwave heating and nitriding sintering
- Creep behaviour and life assessment of a cast nickel – base superalloy MAR – M247
- Failure mechanism and acoustic emission signal characteristics of coatings under the condition of impact indentation
- Reducing Surface Cracks and Improving Cleanliness of H-Beam Blanks in Continuous Casting — Improving continuous casting of H-beam blanks
- Rhodium influence on the microstructure and oxidation behaviour of aluminide coatings deposited on pure nickel and nickel based superalloy
- The effect of Nb content on precipitates, microstructure and texture of grain oriented silicon steel
- Effect of Arc Power on the Wear and High-temperature Oxidation Resistances of Plasma-Sprayed Fe-based Amorphous Coatings
- Short Communication
- Novel Combined Feeding Approach to Produce Quality Al6061 Composites for Heat Sinks
- Research Article
- Micromorphology change and microstructure of Cu-P based amorphous filler during heating process
- Controlling residual stress and distortion of friction stir welding joint by external stationary shoulder
- Research on the ingot shrinkage in the electroslag remelting withdrawal process for 9Cr3Mo roller
- Production of Mo2NiB2 Based Hard Alloys by Self-Propagating High-Temperature Synthesis
- The Morphology Analysis of Plasma-Sprayed Cast Iron Splats at Different Substrate Temperatures via Fractal Dimension and Circularity Methods
- A Comparative Study on Johnson–Cook, Modified Johnson–Cook, Modified Zerilli–Armstrong and Arrhenius-Type Constitutive Models to Predict Hot Deformation Behavior of TA2
- Dynamic absorption efficiency of paracetamol powder in microwave drying
- Preparation and Properties of Blast Furnace Slag Glass Ceramics Containing Cr2O3
- Influence of unburned pulverized coal on gasification reaction of coke in blast furnace
- Effect of PWHT Conditions on Toughness and Creep Rupture Strength in Modified 9Cr-1Mo Steel Welds
- Role of B2O3 on structure and shear-thinning property in CaO–SiO2–Na2O-based mold fluxes
- Effect of Acid Slag Treatment on the Inclusions in GCr15 Bearing Steel
- Recovery of Iron and Zinc from Blast Furnace Dust Using Iron-Bath Reduction
- Phase Analysis and Microstructural Investigations of Ce2Zr2O7 for High-Temperature Coatings on Ni-Base Superalloy Substrates
- Combustion Characteristics and Kinetics Study of Pulverized Coal and Semi-Coke
- Mechanical and Electrochemical Characterization of Supersolidus Sintered Austenitic Stainless Steel (316 L)
- Synthesis and characterization of Cu doped chromium oxide (Cr2O3) thin films
- Ladle Nozzle Clogging during casting of Silicon-Steel
- Thermodynamics and Industrial Trial on Increasing the Carbon Content at the BOF Endpoint to Produce Ultra-Low Carbon IF Steel by BOF-RH-CSP Process
- Research Article
- Effect of Boundary Conditions on Residual Stresses and Distortion in 316 Stainless Steel Butt Welded Plate
- Numerical Analysis on Effect of Additional Gas Injection on Characteristics around Raceway in Melter Gasifier
- Variation on thermal damage rate of granite specimen with thermal cycle treatment
- Effects of Fluoride and Sulphate Mineralizers on the Properties of Reconstructed Steel Slag
- Effect of Basicity on Precipitation of Spinel Crystals in a CaO-SiO2-MgO-Cr2O3-FeO System
- Review Article
- Exploitation of Mold Flux for the Ti-bearing Welding Wire Steel ER80-G
- Research Article
- Furnace heat prediction and control model and its application to large blast furnace
- Effects of Different Solid Solution Temperatures on Microstructure and Mechanical Properties of the AA7075 Alloy After T6 Heat Treatment
- Study of the Viscosity of a La2O3-SiO2-FeO Slag System
- Tensile Deformation and Work Hardening Behaviour of AISI 431 Martensitic Stainless Steel at Elevated Temperatures
- The Effectiveness of Reinforcement and Processing on Mechanical Properties, Wear Behavior and Damping Response of Aluminum Matrix Composites