Optimization process of resistance spot welding for high-strength low-alloy steel using Taguchi method
-
Hayder H. Khaleel
 ,
Ibtihal A. Mahmood
,
Ibtihal A. Mahmood

Abstract
Resistance spot welding (RSW) is considered as predominant welding technique that is used in the manufacturing of modern automobile structure. The automobile structure is made of high strength steel which is preferred by the car industry companies due to its high strength-weight ratio. This work presents an optimization method for RSW of high-strength low-alloy steel DOCOL 500 LA. Tensile test and microstructure analysis for base material (BM) were carried out to get the mechanical properties of BM and to specify the rolling direction. Taguchi method, high efficiency technique, was applied using Minitab19 software to achieve the optimization process. Tensile shear test was carried out to evaluate the strength of welding nugget, absorbed energy and failure mode. The results showed that the optimum parameters were 8,800 A for the current, 30 cycles for the welding time and 2,230 N for the electrode force and two types of failure modes could be observed which were interfacial and full pullout mode.
1 Introduction
Resistance spot welding (RSW) is the one of most important welding techniques used in the modern automotive industry to join steel parts due to its high efficiency and low cost [1,2]. Usually, there are about 2,000–5,000 spot welds in new cars. RSW is a complicated process involving mechanical, metallurgical and thermo-electrical and many other effecting factors [3,4]. RSW is a fusion welding method in which heat is produced by the resistance of materials being welded to the flow of electrical current. In order to ensure a good contact between the parts being welded, pressure must be applied by using copper alloy electrodes which also allow electrical current to flow to the parts. Due to the resistance of materials to the electrical current, the temperature increases until it reaches the melting point of materials and the nugget begins to form between two sheets. The electrical current is then switched off and nugget begins to solidify under the force [5]. Many materials can be welded by using RSW such as plain carbon steel, high-strength steel and aluminum [6,7,8]. High strength steel has been used widely in automotive industry because of its advantages such as high-strength-weight ratio which leads to increase in the safety of vehicles, fuel efficiency and reduce CO2 emissions [9]. In order to obtain good welding quality, three main parameters which are welding current, welding time and electrode force are selected to be adjusted parameters that effected on the welding quality [10]. Many methods have been used to optimize the three main welding parameters and these methods are not only useful to ensure good welding quality, but also to reduce the cost of production especially in automotive industry. Taguchi design method is considered as one of the best methods in optimization process which can reduce the number of experiments by rearranging the number of tests through an orthogonal array and specify the most effecting parameters [11]. Many researchers studied the optimization process for spot welding technique for mild steel and stainless steel. P Muthu presented an experimental study for optimization of RSW for stainless steel 316L using Taguchi method. Experimental data were analyzed using signal-to-noise ratio with analysis of variance to find the most effecting parameters between electrode diameter, welding current and welding time on the spot welding process and the results showed that the electrode diameter is the most effective parameter in this study [12]. Sabah Khammass Hussein and Osamah Sabah Barrak investigated the effect of RSW parameters on shear force for two materials AISI 304L and AA 6061-T6 using DOE method to analyze the effect of four parameters which were welding time, welding current, squeeze time and electrode force. They concluded that by increasing sheet thickness and welding current led to increase in shear force, while the shear force decreased by increasing the welding time, squeeze time and electrode force, respectively [13]. Ghanbari et al. nvestigated the fatigue behavior of RSW for dual phase steel. They chose different experimental parameters such as welding current, electrode force and welding time by using Taguchi method L8. The results showed that the welding current was the more effective parameter on the fatigue life [14]. Yasin et al. studied the optimization process for spot welding using various parameters such as welding current, welding time and electrode force for low carbon steel. The experiments were done according to Taguchi method L9. They found that the optimum parameters were welding current 8 kA, welding time 10 cycles and electrode force 2.3 kN. The most effective parameter in their study was electrode force [15]. The main goal of this study is to design the optimization process for RSW for high-strength low-alloy (HSLA) steel DOCOL 500LA which is a new high-strength steel grade and used in a new car chassis. The microstructure scan of the base material (BM) and tensile test were performed to obtain the mechanical properties and to specify the rolling direction. Taguchi method with L9 array was used to determine the most effective parameters between the main three welding parameters (welding current, welding time and electrode force). Tensile shear test for each pattern was carried out to study the effect of welding parameters on the strength of nugget, absorbed energy and failure mode.
2 Experimental work
2.1 Material
The material used in this work was HSLA steel (DOCOL 500LA) which was purchased from Swedish Company (SSAB) and it was selected due to its characteristics such as high strength, ductility and corrosion resistance. Moreover, it is used widely in modern automotive structures. The thickness of the material sheet was 0.8 mm. The chemical composition of HSLA steel specimen was analyzed by using Thermo ARL 3460 Optical Emission Spectrometer as shown in Figure 1 (Table 1).

Thermo ARL 3460 optical emission spectrometer.
The chemical composition of HSLA steel
| C% | Mn% | Si% | S% | P% | Cr% | Ni% | Mo% | Al% | Cu% | Fe% |
|---|---|---|---|---|---|---|---|---|---|---|
| 0.0922 | 1.33 | 0.39 | 0.0063 | 0.0165 | 0.0343 | 0.0358 | 0.0064 | 0.0449 | 0.0085 | Bal. |
2.2 Microstructure scan and tensile test
The microstructure of HSLA steel specimen has a significant effect on the mechanical properties, therefore optical microscope was used to study the microstructure of the BM specimen as shown in Figure 2.

Optical microscope.
The specimens are first cleaned with acetone to remove dust or contaminations and then it is grinded by using different silicon papers (from grit 100 to grit 2,000). The next step is to polish by alumina suspension and finally it is etched with nital 2%. This etchant is composed of 2% volume fraction of nitric acid in 98% volume fraction of alcohol (e.g., ethanol) as shown in Figure 3.

(a) Grinding process. (b) Polishing Process.
The two specimens used to study the effect of microstructure on the rolling direction and to specify the microstructure phase for the BM form the top surface and cross section as shown in Figure 4.

Microstructure specimen. (a) Top surface and (b) cross section.
FESEM test was carried out using TESCAN MIRA 3. Moreover, the tensile test was performed for two purposes. First, to know the mechanical properties of HSLA steel and second, to know the rolling direction for steel plate so that six specimens with 3 different angles (0, 45, and 90°) were used and the specimens were cut using electrical discharge machining (EDM) process to ensure the accurate dimensions for specimens as shown in Figure 5.
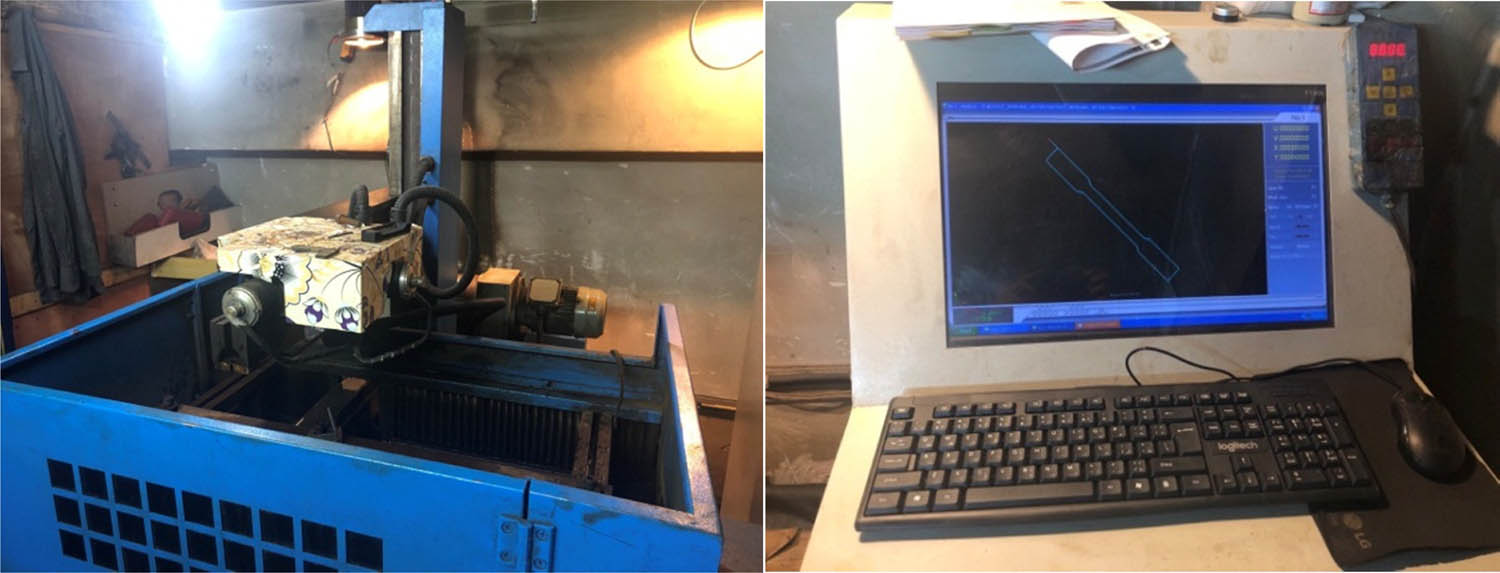
EDM cutting machine.
The tensile test was done according to ASTM E8 for metallic materials (shell type) using Tinius Olsen tensile test machine, which is connected to a computer, with maximum capacity of 50 kN under the strain rate of 2 mm/min as shown in Figure 6.

(a) Tensile test machine. (b) Tensile specimens.
2.3 Welding process
In this study, the effect of different welding parameters such as welding current, welding time and electrode force on the strength of welding was investigated to assess the failure mode. The dimensions of welding samples were chosen according to ISO standards and the nugget diameter was chosen according to the American welding society (AWS). The dimensions of the specimen are shown in Figure 7.

Spot welding specimen dimension.
The specimens were cut using CN machine and then cleaned with acetone to ensure good welding quality and to remove any contaminations. The welding process was carried out using WIM TOUCH 1800 digital spot welding machine cooled by water, with diameter tip of 6 mm made of copper alloys as shown in Figure 8.

Spot welding machine.
Welding parameter levels were selected according to AWS standards for high-strength steel with ultimate tensile strength from 350 to 700 MPa. Three welding parameters were selected (welding current, welding time and electrode force) with three levels as listed in Table 2 and analyzed with Taguchi method by using Minitab 19 which is a good optimization method with efficiency of approximately 95%. Nine trails were used for each pattern to get the maximum shear force and absorbed energy as shown in Figure 9.
Welding process parameters
| Parameter | Level 1 | Level 2 | Level 3 |
|---|---|---|---|
| Current (A) | 5,700 | 7,250 | 8,800 |
| Welding time (cycles) | 9 | 20 | 30 |
| Force (N) | 1,900 | 2,230 | 2,560 |

Welded specimens.
In this research, focus has been on the tensile shear strength, so that in Taguchi method, the larger is better equation was selected
where S/N is the signal-to-noise ratio; n is the number of experiments; y is the magnitude of the response.
If it gets a maximum number for the tensile shear test, it indicates that it is good in tensile shear strength.
2.4 Tensile shear test
Tensile shear test was carried out to evaluate the strength of spot welding for nine specimens by using tensile test machine (SANTAM STD-600) with maximum capacity of 600 N. The machine is connected to the computer to get force–displacement curve with strain rate of 1 mm/min as shown in Figure 10. The diameter and area of spot welding for all specimens were calculated using visual measuring machine which is connected to the computer.

Tensile shear test.
3 Results
3.1 Results of microstructure and tensile test
The microstructure of the base metal (Docol 500LA) was examined from either the top surface or the thickness as shown in Figure 11.

(a) Top surface. (b) Cross section.
It is well observed that the microstructure of the BM is almost completely ferritic with an equiaxed grain structure (i.e., having no certain shape and orientation). The as-received material, according to the datasheet, was hot-rolled. In the hot rolling process, it is expected that the material undergoes dynamic recrystallization, which produces a very fine equiaxed microstructure (in accordance with microstructural observations). The average grain size of the BM was about 3.9 μm. For the tensile test results of the BMs, there is no significant difference between the specimens for each direction (0 ,45, and 90°) and this is due to the microstructure of the BM as shown in Figure 12. The specimen in zero direction had the maximum yield strength which was 549 MPa and maximum tensile strength was 691 MPa while the specimen in the direction at 45° with the rolling direction had minimum yield strength of 501 MPa and the maximum tensile strength was 635 MPa. The results of tensile test for HSLA steel are listed in Table 3.

Stress–strain curve for HSLA.
Tensile test results for HSLA
| Specimen | Yield strength (MPa) | Tensile strength (MPa) | Fracture strength (MPa) | Elongation (%) |
|---|---|---|---|---|
| 0 (1) | 549 | 691 | 677 | 23 |
| 0 (2) | 548 | 689 | 676 | 22 |
| 90 (1) | 518 | 663 | 656 | 22.4 |
| 90 (2) | 516 | 665 | 655 | 22 |
| 45 (1) | 501 | 637 | 606 | 27.2 |
| 45 (2) | 504 | 635 | 603 | 26.4 |
3.2 Results of Taguchi method
Taguchi optimization method was carried out and the experiments were conducted using L9 with three parameters and for three levels using Minitab 19 software as listed in Table 4.
The result of Tensile shear test
| Trial | Current (A) | Welding time (cycle) | Force (N) | Shear force (N) | Absorbed energy (J) | Diameter of nugget (mm) |
|---|---|---|---|---|---|---|
| 1 | 5,700 | 9 | 1,900 | 5,817 | 4.95 | 5.86 |
| 2 | 5,700 | 20 | 2,230 | 6,318 | 5.54 | 6.1 |
| 3 | 5,700 | 30 | 2,560 | 4,032 | 1.68 | 6.42 |
| 4 | 7,250 | 9 | 2,230 | 5,209 | 3.17 | 6.37 |
| 5 | 7,250 | 20 | 2,560 | 6,475 | 4.88 | 6.6 |
| 6 | 7,250 | 30 | 1,900 | 7,485 | 5.5 | 6.55 |
| 7 | 8,800 | 9 | 2,560 | 4,326 | 2.41 | 6.59 |
| 8 | 8,800 | 20 | 1,900 | 7,995 | 7.17 | 6.76 |
| 9 | 8,800 | 30 | 2,230 | 9,839 | 8.15 | 6.26 |
The strength of spot welding increased by increasing the welding current and this is due to the increase in the heat input to the sheets being welded which increased the nugget area and subsequently the strength of nugget as shown in Figure 13.

Tensile shear results for single spot welding.
Figure 14 presents the tensile shear test vs absorbed energy which is calculated from the force–displacement up to the maximum load and it shows that the absorbed energy increased with the increase in the current and subsequently increased the tensile shear force.

Shear force vs absorbed energy.
According to Taguchi method, the optimum design is for a current of 8,800 A, for welding time of 30 cycles, and electrode force of 2,230 N (trail 9) as shown in Figure 15.

Main effect plot for SN ratio and for mean values using Taguchi method.
The response table for mean values shows that the most effective parameter was electrode force, then the welding time and finally the current and this is because of type of failure that occurred during the tensile shear test (Table 5).
The response table for mean values
| Level | Current | Time | Force |
|---|---|---|---|
| 1 | 5,389 | 5,117 | 7,099 |
| 2 | 6,390 | 6,929 | 7,122 |
| 3 | 7,387 | 7,119 | 4,944 |
| Delta | 1,998 | 2,001 | 2,178 |
| Rank | 3 | 2 | 1 |
The predicated value for optimum parameters according to Taguchi is 8,850 N, while that obtained from the table is 9,839 N. The confirmation test was carried out for two specimens and the results for first specimen was 8,711 N with error percentage of 1.5%, while that for the second specimen was 9,996 N with error percentage of 12% with a variation of 7% as shown in Figure 16.

Confirmation test.
The specimens after tensile shear test failed with interfacial failure mode which means that the crack propagates through the nugget diameter for the first eight trials and this is a common failure mode for high-strength steel because of the presence of element alloys while the trail number 9 failed with a full pullout failure mode which means that the nugget separates from one of the sheets and this failure mode is preferred more than the interfacial failure mode because it indicated high plastic deformation and high absorbed energy as shown in Figure 17.

Welded specimens after tensile shear test.
3.3 Microstructure of nugget zone
The microstructure of the nugget (fusion zone) consists of columnar grains near the fusion line (elongated towards the center of the nugget zone) and small equiaxed grains inside the nugget. The heat affected zone (HAZ) near the fusion line is predominantly tempered martensite, this due to high temeprature during the welding and high rapid cooilng more than 1,000°C/S, which converts the BM microstructre to martensite with some bainite. The volume fraction of martensite decreases from the nugget towards the base metal as shown in Figures 18 and 19, respectively.

FESEM images from different regions of sample A: (a) nugget–HAZ interface; (b–e) from the HAZ toward the BM; (f) BM.

Optical micrograph of the interface of nugget zone and HAZ.
4 Conculsion
This work presented the optimaztion process of spot welding for high-strength steel DOCOL 500LA which is used in automotive structure. The optimaztion was achieved using Taguchi method by analysising the data from the tensile shear test. The main conculsions can be summerizied as below:
The optimum parameters which were obtained from the Taguchi method were 8,800 A for the current, 30 cycles for time and 2,230 N for the electrode force.
The failure mode for the optimum trial was full pull out, while for the other trails, it was interfacial failure mode because of high elements contnent.
The most effective parameter was electrode force, welding time and finally the current.
For the nugget zone, the microstructure was equiaxed grains toward the center of the nugget where the temperature was maximum, while it was was martensite phase for HAZ.
Acknowledgments
Authors would like to express their gratitude to SSAB company for providing the sheets that used in this work.
-
Author contributions: Authors contributed equally in this work.
-
Conflict of interest: Authors state no conflict of interest.
References
[1] Zhang H, Wang F, Xi T, Zhao J, Wang L, Gao W. A novel quality evaluation method for resistance spot welding based on the electrode displacement signal and the Chernoff faces technique. Mech Syst Signal Pr. 2015;62–63:431–43.10.1016/j.ymssp.2015.03.007Search in Google Scholar
[2] Tamizi M, Pouranvari M, Movahedi M. Welding metallurgy of martensitic advanced high strength steels during resistance spot welding. Sci Technol Weld Join. 2016;22:327–35.10.1080/13621718.2016.1240979Search in Google Scholar
[3] Thakur AG, Nandedkar VM. Optimization of the resistance spot welding process of galvanized steel sheet using the Taguchi method. Arab J Sci Eng. 2014;39:1171–6.10.1007/s13369-013-0634-xSearch in Google Scholar
[4] Amirthalingam M, van der Aa EM, Kwakernaak C, Hermans MJM, Richardson IM. Elemental segregation during resistance spot welding of boron containing advanced high strength steels. Weld World. 2015;59:743–55.10.1007/s40194-015-0250-3Search in Google Scholar
[5] Williams NT, Parker JD. Review of resistance spot welding of steel sheets: Part 1 – Modelling and control of weld nugget formation. Int Mater Rev. 2004;49:45–75.10.1179/095066004225010523Search in Google Scholar
[6] Emad Sadiq S, Bakhy SH, Jweeg MJ. Effects of spot welding parameters on the shear characteristics of aluminum honeycomb core sandwich panels in aircraft structure. Test Eng Manag. March–April 2020;7244–55.Search in Google Scholar
[7] Muhsin J, Jweeg SH, Bakhy, Sadiq SE. Effects of core height, cell angle and face thickness on vibration behavior of aircraft sandwich structure with honeycomb core: An experimental and numerical investigations. Mater Sci Forum. 2021;1039:65–85.10.4028/www.scientific.net/MSF.1039.65Search in Google Scholar
[8] Njim EK, Al-Waily M, Bakhy SH. A review of the recent research on the experimental tests of functionally graded sandwich panels. J Mech Eng Res Dev. 2021;44(3):420–41.Search in Google Scholar
[9] Kuziak R, Kawalla R, Waegler S. Advanced high strength steels for automotive industry. Arch Civ Mech Eng. 2008;7:103–17.10.1016/S1644-9665(12)60197-6Search in Google Scholar
[10] Pradeep M, Mahesh NS, Hussain R. Process parameter optimization in resistance spot welding of dissimilar thickness materials. Int J Mech Mechatron Eng. 2014;8(1):80–3.Search in Google Scholar
[11] Bolboacă SD, Jäntschi L. Design of experiments: Useful orthogonal arrays for number of experiments from 4 to 16. Entropy. 2017;9(4):198–232.10.3390/e9040198Search in Google Scholar
[12] Muthu P. Optimization of the process parameters of resistance spot welding of AISI 316l sheets using Taguchi method. Mech Mech Eng. 2019;23:64–9.10.2478/mme-2019-0009Search in Google Scholar
[13] Hussein SK, Barrak OS. Optimization of the resistance spot welding parameters of austenitic stainless steel and aluminum alloy using design of experiment method. Eng & Tech J. 2016;34(7):1383–401.10.30684/etj.34.7A.11Search in Google Scholar
[14] Ghanbari HR, Shariati M, Sanati E, Nejad RM. Effects of spot welded parameters on fatigue behavior of ferrite-martensite dual-phase steel and hybrid joints. Eng Fail Anal. 2022;134:106079.10.1016/j.engfailanal.2022.106079Search in Google Scholar
[15] Yasin NA, Alisibramulisi A, Salleh Z, Ghazali FA, Pawan A. Optimization of resistance spot welding (RSW) parameters by using Taguchi method. Int J Innovative Technol Explor Eng (IJITEE). January 2020;9(3):2795–800.10.35940/ijitee.C9215.019320Search in Google Scholar
© 2022 the author(s), published by De Gruyter
This work is licensed under the Creative Commons Attribution 4.0 International License.
Articles in the same Issue
- Regular Articles
- Performance of a horizontal well in a bounded anisotropic reservoir: Part I: Mathematical analysis
- Key competences for Transport 4.0 – Educators’ and Practitioners’ opinions
- COVID-19 lockdown impact on CERN seismic station ambient noise levels
- Constraint evaluation and effects on selected fracture parameters for single-edge notched beam under four-point bending
- Minimizing form errors in additive manufacturing with part build orientation: An optimization method for continuous solution spaces
- The method of selecting adaptive devices for the needs of drivers with disabilities
- Control logic algorithm to create gaps for mixed traffic: A comprehensive evaluation
- Numerical prediction of cavitation phenomena on marine vessel: Effect of the water environment profile on the propulsion performance
- Boundary element analysis of rotating functionally graded anisotropic fiber-reinforced magneto-thermoelastic composites
- Effect of heat-treatment processes and high temperature variation of acid-chloride media on the corrosion resistance of B265 (Ti–6Al–4V) titanium alloy in acid-chloride solution
- Influence of selected physical parameters on vibroinsulation of base-exited vibratory conveyors
- System and eco-material design based on slow-release ferrate(vi) combined with ultrasound for ballast water treatment
- Experimental investigations on transmission of whole body vibration to the wheelchair user's body
- Determination of accident scenarios via freely available accident databases
- Elastic–plastic analysis of the plane strain under combined thermal and pressure loads with a new technique in the finite element method
- Design and development of the application monitoring the use of server resources for server maintenance
- The LBC-3 lightweight encryption algorithm
- Impact of the COVID-19 pandemic on road traffic accident forecasting in Poland and Slovakia
- Development and implementation of disaster recovery plan in stock exchange industry in Indonesia
- Pre-determination of prediction of yield-line pattern of slabs using Voronoi diagrams
- Urban air mobility and flying cars: Overview, examples, prospects, drawbacks, and solutions
- Stadiums based on curvilinear geometry: Approximation of the ellipsoid offset surface
- Driftwood blocking sensitivity on sluice gate flow
- Solar PV power forecasting at Yarmouk University using machine learning techniques
- 3D FE modeling of cable-stayed bridge according to ICE code
- Review Articles
- Partial discharge calibrator of a cavity inside high-voltage insulator
- Health issues using 5G frequencies from an engineering perspective: Current review
- Modern structures of military logistic bridges
- Retraction
- Retraction note: COVID-19 lockdown impact on CERN seismic station ambient noise levels
- Special Issue: Trends in Logistics and Production for the 21st Century - Part II
- Solving transportation externalities, economic approaches, and their risks
- Demand forecast for parking spaces and parking areas in Olomouc
- Rescue of persons in traffic accidents on roads
- Special Issue: ICRTEEC - 2021 - Part II
- Switching transient analysis for low voltage distribution cable
- Frequency amelioration of an interconnected microgrid system
- Wireless power transfer topology analysis for inkjet-printed coil
- Analysis and control strategy of standalone PV system with various reference frames
- Special Issue: AESMT
- Study of emitted gases from incinerator of Al-Sadr hospital in Najaf city
- Experimentally investigating comparison between the behavior of fibrous concrete slabs with steel stiffeners and reinforced concrete slabs under dynamic–static loads
- ANN-based model to predict groundwater salinity: A case study of West Najaf–Kerbala region
- Future short-term estimation of flowrate of the Euphrates river catchment located in Al-Najaf Governorate, Iraq through using weather data and statistical downscaling model
- Utilization of ANN technique to estimate the discharge coefficient for trapezoidal weir-gate
- Experimental study to enhance the productivity of single-slope single-basin solar still
- An empirical formula development to predict suspended sediment load for Khour Al-Zubair port, South of Iraq
- A model for variation with time of flexiblepavement temperature
- Analytical and numerical investigation of free vibration for stepped beam with different materials
- Identifying the reasons for the prolongation of school construction projects in Najaf
- Spatial mixture modeling for analyzing a rainfall pattern: A case study in Ireland
- Flow parameters effect on water hammer stability in hydraulic system by using state-space method
- Experimental study of the behaviour and failure modes of tapered castellated steel beams
- Water hammer phenomenon in pumping stations: A stability investigation based on root locus
- Mechanical properties and freeze-thaw resistance of lightweight aggregate concrete using artificial clay aggregate
- Compatibility between delay functions and highway capacity manual on Iraqi highways
- The effect of expanded polystyrene beads (EPS) on the physical and mechanical properties of aerated concrete
- The effect of cutoff angle on the head pressure underneath dams constructed on soils having rectangular void
- An experimental study on vibration isolation by open and in-filled trenches
- Designing a 3D virtual test platform for evaluating prosthetic knee joint performance during the walking cycle
- Special Issue: AESMT-2 - Part I
- Optimization process of resistance spot welding for high-strength low-alloy steel using Taguchi method
- Cyclic performance of moment connections with reduced beam sections using different cut-flange profiles
- Time overruns in the construction projects in Iraq: Case study on investigating and analyzing the root causes
- Contribution of lift-to-drag ratio on power coefficient of HAWT blade for different cross-sections
- Geotechnical correlations of soil properties in Hilla City – Iraq
- Improve the performance of solar thermal collectors by varying the concentration and nanoparticles diameter of silicon dioxide
- Enhancement of evaporative cooling system in a green-house by geothermal energy
- Destructive and nondestructive tests formulation for concrete containing polyolefin fibers
- Quantify distribution of topsoil erodibility factor for watersheds that feed the Al-Shewicha trough – Iraq using GIS
- Seamless geospatial data methodology for topographic map: A case study on Baghdad
- Mechanical properties investigation of composite FGM fabricated from Al/Zn
- Causes of change orders in the cycle of construction project: A case study in Al-Najaf province
- Optimum hydraulic investigation of pipe aqueduct by MATLAB software and Newton–Raphson method
- Numerical analysis of high-strength reinforcing steel with conventional strength in reinforced concrete beams under monotonic loading
- Deriving rainfall intensity–duration–frequency (IDF) curves and testing the best distribution using EasyFit software 5.5 for Kut city, Iraq
- Designing of a dual-functional XOR block in QCA technology
- Producing low-cost self-consolidation concrete using sustainable material
- Performance of the anaerobic baffled reactor for primary treatment of rural domestic wastewater in Iraq
- Enhancement isolation antenna to multi-port for wireless communication
- A comparative study of different coagulants used in treatment of turbid water
- Field tests of grouted ground anchors in the sandy soil of Najaf, Iraq
- New methodology to reduce power by using smart street lighting system
- Optimization of the synergistic effect of micro silica and fly ash on the behavior of concrete using response surface method
- Ergodic capacity of correlated multiple-input–multiple-output channel with impact of transmitter impairments
- Numerical studies of the simultaneous development of forced convective laminar flow with heat transfer inside a microtube at a uniform temperature
- Enhancement of heat transfer from solar thermal collector using nanofluid
- Improvement of permeable asphalt pavement by adding crumb rubber waste
- Study the effect of adding zirconia particles to nickel–phosphorus electroless coatings as product innovation on stainless steel substrate
- Waste aggregate concrete properties using waste tiles as coarse aggregate and modified with PC superplasticizer
- CuO–Cu/water hybrid nonofluid potentials in impingement jet
- Satellite vibration effects on communication quality of OISN system
- Special Issue: Annual Engineering and Vocational Education Conference - Part III
- Mechanical and thermal properties of recycled high-density polyethylene/bamboo with different fiber loadings
- Special Issue: Advanced Energy Storage
- Cu-foil modification for anode-free lithium-ion battery from electronic cable waste
- Review of various sulfide electrolyte types for solid-state lithium-ion batteries
- Optimization type of filler on electrochemical and thermal properties of gel polymer electrolytes membranes for safety lithium-ion batteries
- Pr-doped BiFeO3 thin films growth on quartz using chemical solution deposition
- An environmentally friendly hydrometallurgy process for the recovery and reuse of metals from spent lithium-ion batteries, using organic acid
- Production of nickel-rich LiNi0.89Co0.08Al0.03O2 cathode material for high capacity NCA/graphite secondary battery fabrication
- Special Issue: Sustainable Materials Production and Processes
- Corrosion polarization and passivation behavior of selected stainless steel alloys and Ti6Al4V titanium in elevated temperature acid-chloride electrolytes
- Special Issue: Modern Scientific Problems in Civil Engineering - Part II
- The modelling of railway subgrade strengthening foundation on weak soils
- Special Issue: Automation in Finland 2021 - Part II
- Manufacturing operations as services by robots with skills
- Foundations and case studies on the scalable intelligence in AIoT domains
- Safety risk sources of autonomous mobile machines
- Special Issue: 49th KKBN - Part I
- Residual magnetic field as a source of information about steel wire rope technical condition
- Monitoring the boundary of an adhesive coating to a steel substrate with an ultrasonic Rayleigh wave
- Detection of early stage of ductile and fatigue damage presented in Inconel 718 alloy using instrumented indentation technique
- Identification and characterization of the grinding burns by eddy current method
- Special Issue: ICIMECE 2020 - Part II
- Selection of MR damper model suitable for SMC applied to semi-active suspension system by using similarity measures