Impact of the COVID-19 pandemic on road traffic accident forecasting in Poland and Slovakia
-
Martin Jurkovic

 ,
Piotr Gorzelanczyk
,
Tomas Kalina
,
Jaroslav Jaros
,
Piotr Gorzelanczyk
,
Tomas Kalina
,
Jaroslav Jaros

Abstract
The COVID-19 pandemic significantly affected the performance of the transport sector and its overall intensity. Reducing mobility has a major impact on road traffic accidents. The aim of this study is to forecast the number of road traffic accidents in Poland and Slovakia and to assess how the COVID-19 pandemic affected its trend. For this purpose, data for Poland and Slovakia in the selected relevant period were analyzed. Based on actual data from the past, a forecast was made for the future considering two scenarios – one where there is no effect of pandemic, and another with effect of pandemic. Forecasting the number of accidents in Poland was carried out using selected time series models related to linear trend (Holt and Winters method) and the exponential model. In the case of Slovakia, the model without trend and the exponential model were used to forecast the number of traffic accidents. The results of the research show that the pandemic caused a decrease in the number of traffic accidents in Poland by 31% and in Slovakia by 33%. This is a significant decline, but it is linearly dependent on restrictive measures that affect the mobility of the population. A similar trend can therefore be expected on a European scale.
1 Introduction
Road traffic accidents are events that cause not only injuries or death to road users, but also damage to property. According to the WHO, approximately 1.3 million people die each year as a result of traffic accidents. Traffic accidents account for around 3% of their GDP for most of the countries in the world. Road traffic accidents are the leading cause of death for minors and young people aged 5–29 [1]. The UN General Assembly has set an ambitious goal of halving the number of road deaths and injuries by 2030.
The extent of a traffic accident is an attribute for determining its severity. Predicting the severity of accidents is important for competent authorities when designing transport safety policies to eliminate accidents, reduce injuries, deaths, and property losses [2,3,4]. The identification of critical factors that affect the severity of accidents is a precondition for taking countermeasures to eliminate and mitigate the severity of accidents [5]. Yang et al. propose a DNN (Deep Neutral Network) multi-carbon framework to predict different levels of severity of injury, death, and property loss. It allows a comprehensive and accurate analysis of the severity of traffic accidents [6].
There are several sources of accident data. They are mostly collected and analyzed by government authorities through the relevant government agencies. Data collection is carried out through police reports, insurance databases, or hospital records. Partial traffic accident information is subsequently processed for the transport sector on a larger scale [7].
Intelligent transportation systems are currently the most important source of data related to the analysis and prediction of traffic accidents [8]. The data can be processed due to the use of global positioning system (GPS) devices in vehicles [9]. Microwave vehicle detection systems on roadsides can continuously record vehicle data (speed, traffic volume, and vehicle type) [10]. The Vehicle License Plate Recognition system also makes it possible to collect large amounts of traffic data over a monitored period [11]. Another source of data for obtaining traffic and accidents information can be social media, but their relevance may be insufficient due to the incompetence of reporters [12].
For the relevance of accident data, it is necessary to work with several data sources that need to be confronted correctly. The combination of different data sources by consolidating heterogeneous traffic accident data helps to increase the accuracy of the analysis results [13].
A statistical survey aimed at assessing the severity, and finding out the connection between traffic accidents and road users was performed by Vilaça et al. [14]. The result of the study is a proposal to improve road safety standards and the adoption of other policies related to transport safety.
Bak et al. conducted a statistical survey of traffic safety in a selected region of Poland based on the number of traffic accidents, the pace of finding out the causes of their occurrence [15]. The survey applied a multidimensional statistical analysis to examine safety aspect of persons responsible for accidents.
The choice of the source of traffic accidents data for the analysis depends on the type of traffic problem being addressed. The combination of statistical models with other natural driving data or other data obtained through intelligent transport systems contributes to increasing the accuracy of accident forecasts and contributes to their elimination [16]. Szumska et al. investigated the main accidents in Poland in the selected period. The study summarizes statistics on the number of accident offenders by gender and age, as well as dynamic aspects of changes related to new passenger and truck vehicles in Poland over the years 2009–2019 [17].
Various methods of forecasting the number of accidents can be found in the literature. Most often, time series methods are used for forecasting the number of road traffic accidents [18,19], the disadvantages of which are the impossibility of assessing the quality of forecast based on expired forecasts and the often-occurring autocorrelation of the residual component [20]. Procházka et al. used the multiple seasonality model for forecasting [21], and Sunny et al. used the Holt-Winters exponential smoothing method [22]. Its limitations include the inability to introduce exogenous variables into the model [23,24].
For forecasting the number of road accidents, the vector autoregression model has also been used, whose drawback is the need to have many observations of the variables in order to correctly estimate their parameters [25], as well as the autoregression models of Monederoa et al. for analyzing the number of fatalities [26] and Al-Madani, curve-fitting regression models [27]. These, in turn, require only simple linear relationships [28], and the order of the autoregression (assuming that the series are already stationary) [29].
Biswas et al. used Random Forest regression [30] to predict the number of road accidents. In this case, the data contain groups of correlated features with similar significance to the original data, smaller groups are favored over larger ones [31], and there is instability in the method and spike prediction [32]. Chudy-Laskowska and Pisula [33] used the autoregressive model with quadratic trend, the univariate periodic trend model, and the exponential equalization model for the forecasting issue discussed. A moving mean model can also be used for forecasting the discussed issue, the disadvantages of which are low forecast accuracy, loss of data in the sequence, and lack of consideration of trends and seasonal effects [34]. Prochazka and Camaj used the GARMA method, in which some restrictions are imposed in the parameter space to guarantee the stationarity of the process [35]. Very often the ARMA model for a stationary process or ARIMA or SARIMA for a non-stationary process is used for forecasting [21,22,36,37]. These models result in very high flexibility of the discussed models, but it is also their disadvantage. Good model identification requires more experience from the researcher than, for example, regression analysis [38]. Another disadvantage is the linear nature of the ARIMA model [39].
Chudy-Laskowska and Pisula in their work [40] used the ANOVA method to forecast the number of road crashes. The disadvantage of this method is the adoption of additional assumptions, especially the assumption of sphericity, the violation of which may lead to erroneous conclusions [41]. Neural network models are also used to forecast the number of road accidents. The disadvantage of ANN is the need for experience in this field [40,42] and the dependence of the final solution on the initial conditions of the network, as well as the lack of interpretability in the traditional way since ANN is usually referred to as blackbox where you give input, and the model gives output without any knowledge about the analysis [43].
A new prediction method is the use of the Hadoop model by Kumar et al. [44]. The drawback of this method is its inability to work with small data files [45]. Karlaftis and Vlahogianni used the Garch model for prediction [37]. The disadvantage of this method is its complex form and complicated model [46,47]. On the other hand, McIlroy and his team used the augmented Dickey-Fuller test [48], which has the disadvantage of poor power in the case of autocorrelation of the random component [49].
Authors of publications [50,51] have also used data-mining techniques for forecasting, which usually have the disadvantage of huge sets of general descriptions [52]. The combination of models proposed by Sebego et al. as a combination of different models is also encountered [53]. Parametric models are also proposed in the work of Bloomfield [54].
2 Materials and methods
The number of road accidents on Polish roads is continuously decreasing. This follows from the analysis of monthly data in the monitored regions. However, while comparing these data with the data of the European Union, the value is still very high. In Slovakia, the number of road accidents has also decreased, especially during the pandemic period, but the decrease is not as visible as in Poland (Figure 1).
![Figure 1
Comparison of the number of traffic accidents in Poland and Slovakia in 2012–2021 [55,56].](/document/doi/10.1515/eng-2022-0370/asset/graphic/j_eng-2022-0370_fig_001.jpg)
Selected exponential equalization models were used to forecast the number of traffic accidents. The essence of this method is that the time series of the forecast variable is pronounced with a weighted moving mean and the weights are determined according to the exponential function. In this study, the optimal weights were selected by the Statistica software.
The forecast in this case is based on the weighted mean of current and historical series values. The result of the forecast using this method depends on the choice of the model and its parameters.
Forecasting the number of accidents in Poland was carried out using selected time series models related to linear trend.
One of the methods discussed is the Brownian method, which is categorized as an exponential smoothing method. It is most often used in the case of a time series in which there is no trend, i.e., the series used does not show a developmental trend, while its fluctuations are due to the action of random factors that occurs when forecasting the number of traffic accidents. The weights used in this method are determined according to the right exponential. The model of the change in
for the first moment in time:
(1)to subsequent time periods:
(2)where
The study was divided into two groups: monthly data and annual data. The following errors of expired forecasts determined from equations (3–7) were used to calculate measures of analytical forecast perfection:
ME – mean error
(3)MAE – mean average error
(4)MPE – mean percentage error
(5)MAPE – mean absolute percentage error
(6)SSE – mean square error
where n is the length of the forecast horizon depending on the research (month or year), Y i is the observed value of road traffic accidents, and Y p is the forecasted value of road traffic accidents.
In order to compare the number of road traffic accidents during a pandemic and if it did not exist, the mean percentage error was minimized.
3 Results
A statistical test was performed to compare fluctuations in the number of traffic accidents in Poland and Slovakia during the year. The value of the statistic for the non-parametric Kruskal–Wallis test for Poland is 70.07 and for Slovakia is 72.66 with a test probability of p < 0.05. In both cases, the hypothesis of equality of the average level of road accidents in both countries during the analyzed period should be rejected. This means that in the present case there is a systematic decrease in the average accident rate in individual years (Figures 2 and 3). It is clear from the data analysis that the largest number of traffic accidents occurs during the summer holidays (June–September). This increase is due to the higher flow of vehicles and mobility of people, as well as suitable weather conditions. These conditions can often decrease drivers’ attention while driving. The lowest number of traffic accidents is recorded in the winter months (January, February), when days become shorter, and night comes early due to which people drive more carefully [55].

Comparison of the mean number of road accidents in Poland by month over the years 2000–2021.

Comparison of the mean number of road accidents in Slovakia by month over the years 2000–2021.
Based on the analysis of the number of road accidents in Poland, it can be concluded that they have a seasonal character with a decreasing trend. In both countries, the data have a seasonal character. Therefore, for further analysis, selected time series models were used to forecast the estimated number of road traffic accidents.
3.1 Forecasting the road traffic accidents in Poland
To forecast the annual number of accidents in Poland, Polish Police data from 1990–2021 were used, while to forecast the monthly number of road accidents, data from 2001 have been utilized. Previously, the Polish Police did not collect monthly data in this regard [55].
In order to answer the question of how the pandemic affected the number of road traffic accidents, the study was also divided into two timelines. The results of the study in the case of a pandemic are shown in Figure 4, and in the case of no pandemic in Figure 5.
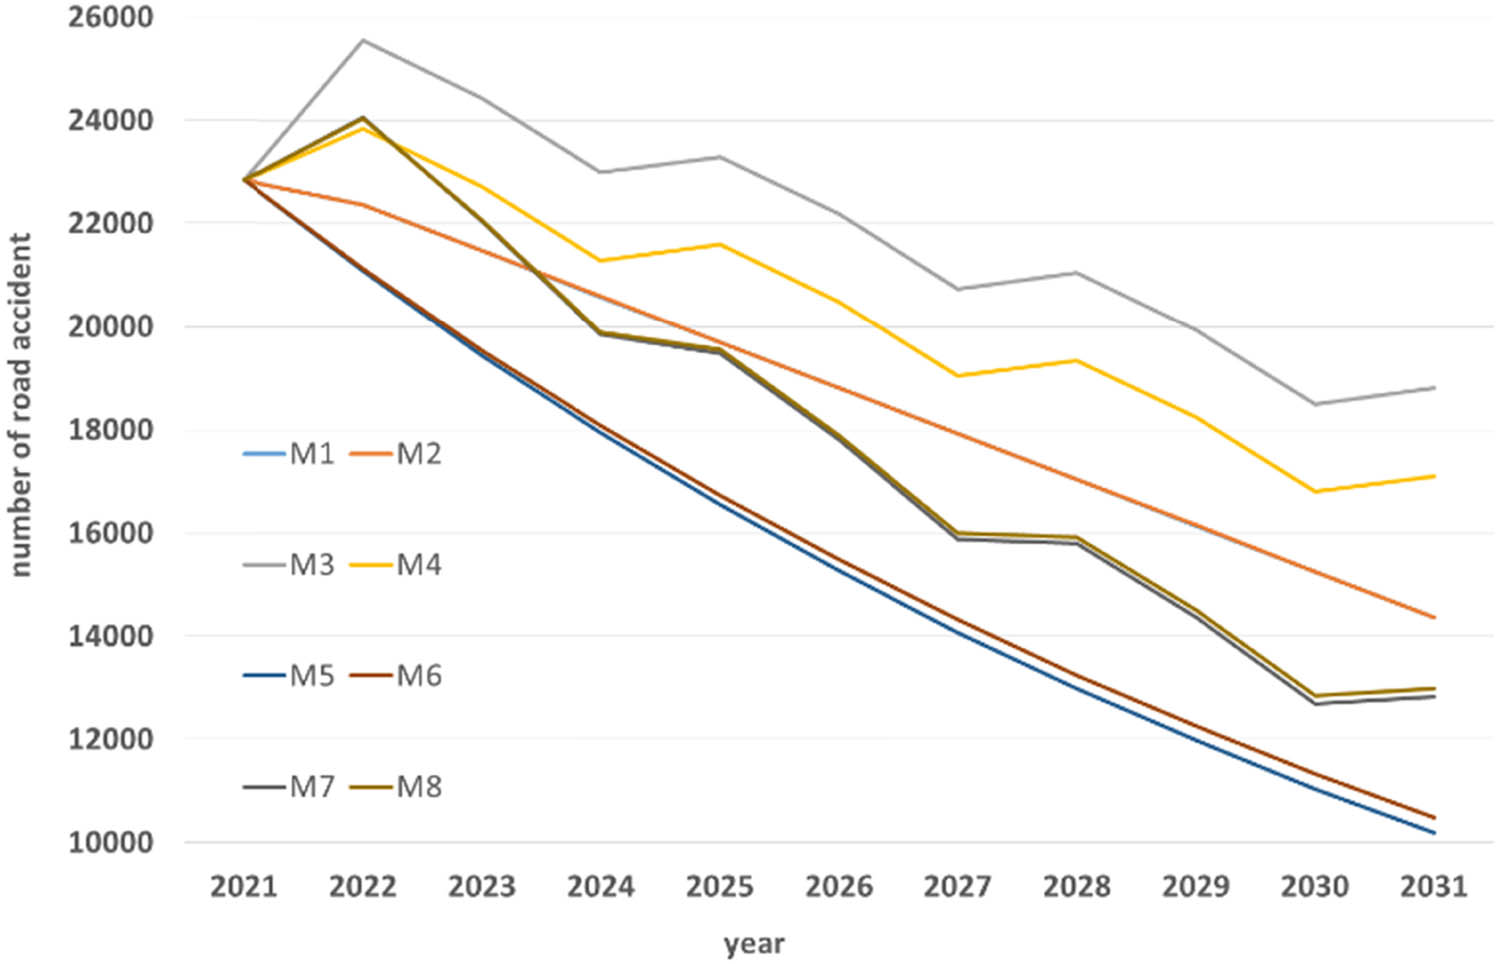
Forecasting the number of road accidents in Poland in 2022–2031 (M1 – linear Holt model – MPE; M2 – linear Holt model – SSE; M3 – linear additive model – MPE; M4 – linear additive model – SSE; M5 – exponential model – MPE; M6 – exponential model – SSE; M7 – additive exponential model – MPE; and M8 – additive exponential model – SSE).

Forecasting the number of road accidents in Poland in 2020–2029 if there was no pandemic.
Based on the conducted research, and considering the ongoing pandemic, it can be concluded that the forecasted number of road accidents in Poland, in the last studied period of 2031, varies from 10 to 18 thousand, depending on the method used. Based on the presented research results, it can be concluded that the number of road accidents in Poland will decrease year by year.
To compare the number of accidents in Poland during the pandemic and as if there was no pandemic, case no. M1 – the Holt linear model, for which the mean percentage error is the smallest, was adopted.
In the next step, the forecast of the number of road accidents in case there was no pandemic was made. The research was conducted in order to find an answer to how the pandemic influenced the number of road accidents in Poland. For this purpose, the number of road accidents between 1990 and 2019 was used.
Based on the obtained results, it can be concluded that the estimated number of road accidents in Poland changes for the year 2029, and depending on the method, it ranges from 21,678 to 23,583. Based on the presented research results, it can be concluded that the number of road accidents in Poland will decrease from year to year. To compare the number of accidents in Poland during the pandemic and in the situation, if there was no pandemic, case no. M3 of the additive linear model, for which the mean percentage error (3) is the smallest, was adopted.
3.2 Forecasting the road accidents in Slovakia
To forecast the annual number of accidents in Slovakia, Slovak Police data for the period 2009–2021 were used, while to forecast the monthly number of traffic accidents, data from 2012 onward were used. Previously, the Slovak Police did not collect monthly data in this regard. The legal norm changed in 2009, so there is a drop in the number of accidents. Since 2009, it is not mandatory to call the police for every accident.
The results of the study in the case of a pandemic are presented in Figure 6, and in the case of no pandemic are shown in Figure 7.

Forecasting the number of road accidents in Slovakia from 2022 to 2031 (M1 – no trend – ME; M2 – no trend SSE; M3 – no trend additive ME; M4 – no trend additive SSE; M5 – exponential model ME; M6 – exponential SSE; M7 – exponential additive ME and M8 – exponential additive SSE).

Forecasting the number of road accidents in Slovakia in 2020–2029 if there were no pandemic.
Based on the outcomes of models, and considering the ongoing pandemic, it can be concluded that the estimated number of road accidents in Slovakia, in the last studied period of 2031, varies from 5.5 to 25 thousand, depending on the method used. Based on the presented research results, it can be concluded that the number of road accidents in Slovakia will decrease from year to year.
To compare the number of accidents in Slovakia during the pandemic and as if there was no pandemic, case no. 5 was adopted, M5 – the exponential model, for which the mean percentage error is the smallest.
In the next step, the prediction of the number of road accidents in case there was no pandemic was made. The research was conducted to answer the question of how the pandemic affected the number of road accidents in Slovakia. For this purpose, the number of road accidents between 2009 and 2019 was used.
Based on the research, it can be concluded that the estimated number of road accidents in Slovakia changes for the year 2029 depending on the method from 12,047 to 15,765. Based on the presented research results, it can be concluded that the number of road accidents in Slovakia will decrease from year to year. To compare the number of accidents in Slovakia during the pandemic and as if there was no pandemic, case M5 was adopted – an exponential model for which the mean percentage error is the smallest.
4 Discussion
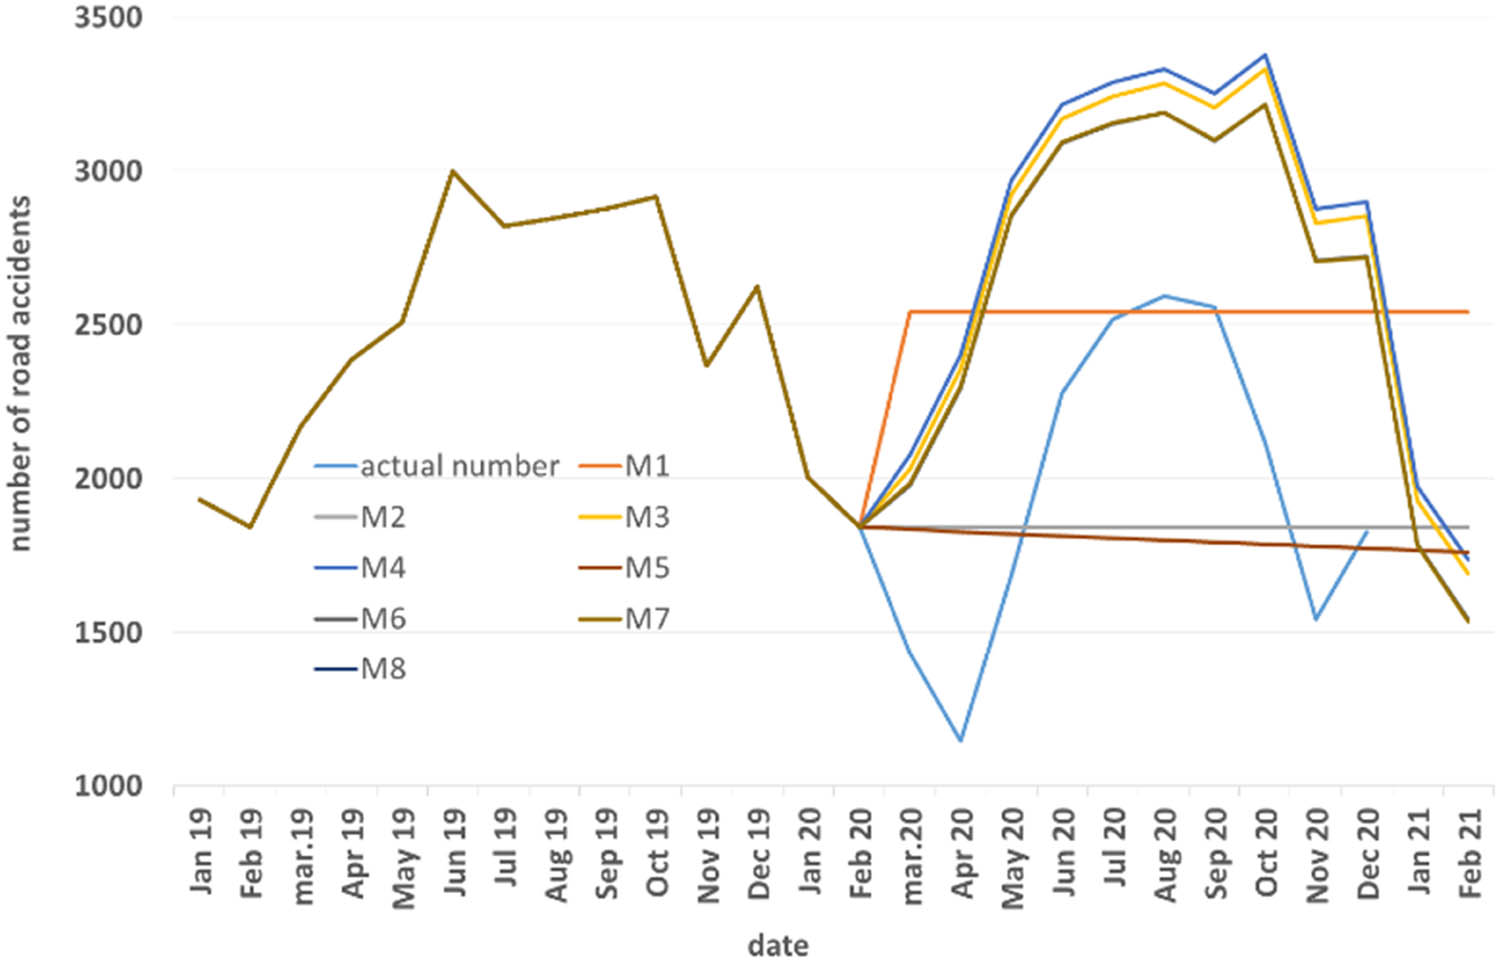
The estimated number of road accidents for 2020 was compared with the number of road accidents actually reported by the police [55,56]. These data are presented in Figure 8. Based on this analysis, it can be concluded that the pandemic has reduced the number of accidents by a mean of 31% over the analyzed period in Poland. This is most evident in 2027, when the value reaches over 39%. It is least evident in the year 2020, when the pandemic only started in March of that year.

Comparison of the number of road accidents in Poland with and without the pandemic.
In addition, a monthly analysis of the number of accidents in the period March 2020–February 2021, i.e., a year from the beginning of the pandemic, was carried out. During the forecast, the lowest average percentage error occurs for the additive linear trend model (M3), the results of which were compared with the number of road accidents occurring in this period. In the analyzed period, the pandemic reduced the number of accidents by nearly 50% (Figure 9). This is most noticeable at the start of the pandemic (April and May) when people mostly sat at home doing remote work.
Comparison of road accidents in Poland.
The estimated number of road accidents for Slovakia in the year 2020 was compared with the number of road accidents actually registered by the Police. These data are presented in Figure 10. Based on the analysis, it can be concluded that the pandemic caused a reduction in the number of accidents by 32% of the mean during the analyzed period. This is most evident in 2029 when the value reaches over 60%.

Comparison of the number of road accidents in Slovakia with and without the pandemic.
In addition, a monthly analysis of the number of accidents in the period March 2020–February 2021, i.e. a year from the beginning of the pandemic, was carried out. During the forecast, the lowest average percentage error occurs for the additive linear trend model (M3), the results of which were compared with the number of road accidents occurring in this period. In the analyzed period, the pandemic, as in Poland, reduced the number of accidents by nearly 20% (Figure 11). This is most evident during the onset of the pandemic and in the winter months, when people were mostly home and working remotely, and the next wave of the pandemic hit during the winter.

Comparison of the number of road accidents in Slovakia.
5 Conclusion
The number of accidents in Poland and Slovakia was forecasted by the exponential equalization method using the Statistica software. The weights used were estimated by the program in such a way as to minimize the mean absolute error and the mean absolute percentage error.
Based on the obtained data, it can be concluded that the pandemic reduced the number of road accidents in Poland by 31% and in Slovakia by 33%. In the current situation, further reduction of road accidents in Poland and Slovakia can be expected.
Moreover, based on the analysis of the obtained results, it may be stated that the forecasts of the number of road accidents in Poland and Slovakia for the following years show the decreasing tendency of the analyzed number, especially in the case of further COVID-19 pandemic. The calculated forecast errors prove the accuracy of the used models.
The obtained results for forecasts of the number of road accidents can be used in the future to formulate further actions aimed at minimizing the number of accidents in the analyzed countries. These actions may consist, for example, of the introduction of higher fines for traffic violations on Polish roads from January 1, 2022. It should be noted that in Slovakia it is planned to change the legislation aimed at the obligation to call the police for traffic accidents. So far, this has been made mandatory if the material damage caused by the accident exceeds € 3,990. This limit is due to be abolished in the near future, which will have a major impact on the number of accidents recorded by the police. This will create a major hurdle in the statistical comparison of accidents.
In their further research, the authors plan to consider more factors affecting the level of accidents in Poland. These may include traffic volume, weather conditions, or the age of the accident perpetrator.
Acknowledgment
This publication was created thanks to support under the Operational Program Integrated Infrastructure for the project: Identification and possibilities of implementation of new technological measures in transport to achieve safe mobility during a pandemic caused by COVID-19 (ITMS code: 313011AUX5), co-financed by the European Regional Development Fund.
-
Conflict of interest: Authors state no conflict of interest.
References
[1] WHO. The Global status on road safety; 2018. p. 403. ISBN: 9789241565684. https://www.who.int/publications/i/item/9789241565684.Search in Google Scholar
[2] Tambouratzis T, Souliou D, Chalikias M, Gregoriades A. Maximising accuracy and efficiency of traffic accident prediction combining information mining with computational intelligence approaches and decision trees. J Artif Intell Soft Comput Res. 2014;4(1):31–42.10.2478/jaiscr-2014-0023Search in Google Scholar
[3] Zhu L, Lu L, Zhang W, Zhao Y, Song M. Analysis of accident severity for curved roadways based on bayesian networks. Sustainability. 2019;11(8):2223.10.3390/su11082223Search in Google Scholar
[4] Ližbetin J, Stopka O. Proposal of a roundabout solution within a particular traffic operation. Open Eng. 2016;6(11):441–5. 10.1515/eng-2016-0066.Search in Google Scholar
[5] Arteaga C, Paz A, Park J. Injury severity on traffic crashes: A text mining with an interpretable machine-learning approach. Saf Sci. 2020;132:Article 104988.10.1016/j.ssci.2020.104988Search in Google Scholar
[6] Yang Z, Zhang W, Feng J. Predicting multiple types of traffic accident severity with explanations: A multi-task deep learning framework. Saf Sci. 2022;146:105522. ISSN 0925-7535. 10.1016/j.ssci.2021.105522.Search in Google Scholar
[7] Gorzelanczyk P, Pyszewska D, Kalina T, Jurkovic M. Analysis of road traffic safety in the Pila poviat. Sci J Silesian Univ Technol Ser Transp. 2020;107:33–52. ISSN: 0209-3324. 10.20858/sjsutst.2020.107.3.Search in Google Scholar
[8] Irawan K, Yusuf R, Prihatmanto AS. A Survey on traffic flow prediction methods. 2020 6th International Conference on Interactive Digital Media (ICIDM); 2020. p. 1–4. 10.1109/ICIDM51048.2020.9339675.Search in Google Scholar
[9] Chen C. Analysis and forecast of traffic accident big data. ITM Web Conf. 2017;12:04029. 10.1051/itmconf/20171204029.Search in Google Scholar
[10] Khaliq KA, Chughtai O, Shahwani A, Qayyum A, Pannek J. Road accidents detection, data collection and data analysis using V2X communication and edge/cloud computing. Electron. 2019;8(8):896. 10.3390/electronics8080896.Search in Google Scholar
[11] Rajput H, Som T, Kar S. An automated vehicle license plate recognition system. Computer. 2015;48(8):56–61. 10.1109/MC.2015.244.Search in Google Scholar
[12] Zheng Z, Wang C, Wang P, Xiong Y, Zhang F, Lv Y. Framework for fusing traffic information from social and physical transportation data. PLoS One. 2018;13(8):e0201531. 10.1371/journal.pone.0201531.Search in Google Scholar PubMed PubMed Central
[13] Abdullah, E, Emam, A. Traffic accidents analyzer using big data. 2015 International Conference on Computational Science and Computational Intelligence (CSCI); 2016. p. 392–7. 10.1109/CSCI.2015.187.Search in Google Scholar
[14] Vilaça M, Silva N, Coelho MC. Statistical analysis of the occurrence and severity of crashes involving vulnerable road users. Transp Res Procedia. 2017;27:1113–20. 10.1016/j.trpro.2017.12.113.Search in Google Scholar
[15] Bąk I, Cheba K, Szczecińska B. The statistical analysis of road traffic in cities of Poland. Transp Res Proc. 2019;39:14–23. 10.1016/j.trpro.2019.06.003.Search in Google Scholar
[16] Chand A, Jayesh S, Bhasi AB. Road traffic accidents: An overview of data sources, analysis techniques and contributing factors. Mater Today Proc. 2021;47(15):5135–41. ISSN 2214-7853. 10.1016/j.matpr.2021.05.415.Search in Google Scholar
[17] Szumska E, Frej D, Grabski P. Analysis of the causes of vehicle accidents in Poland in 2009-2019. LOGI – Sci J Transp Logist. 2020;11(2):76–87. 10.2478/logi-2020-0017.Search in Google Scholar
[18] Helgason A. Fractional integration methods and short time series: Evidence from asimulation study. Polit Anal. 2016;24(1):59–68, http://www.jstor.org/stable/24573204.10.1093/pan/mpv026Search in Google Scholar
[19] Lavrenz S, Vlahogianni E, Gkritza K, Ke Y. Time series modeling in traffic safetyresearch. Accid Anal Prev. 2018;117:368–80.10.1016/j.aap.2017.11.030Search in Google Scholar PubMed
[20] Forecasting based on time series; 2022. http://pis.rezolwenta.eu.org/Materialy/PiS-W-5.pdf.Search in Google Scholar
[21] Procházka J, Flimmel S, Čamaj M, Bašta M. Modelling the number of road accidents. Wrocław: Publishing House of the University of Economics in Wrocław; 2017. 10.15611/amse.2017.20.29.Search in Google Scholar
[22] Sunny CM, Nithya S, Sinshi KS, Vinodini VMD, Lakshmi AKG, Anjana S, et al. Forecasting of road accident in Kerala: A case study. Environmental science, computer science. International Conference on Data Science and Engineering (ICDSE); 2018. p. 1–5. 10.1109/ICDSE.2018.8527825.Search in Google Scholar
[23] Dudek G. Forecasting time series with multiple seasonal cycles using neural networks with local learning. In: Rutkowski L, Korytkowski M, Scherer R, Tadeusiewicz R, Zadeh LA, Zurada JM, editors. Artificial intelligence and soft computing. ICAISC. Berlin, Heidelberg: Springer; 2013. p. 52–63. 10.1007/978-3-642-38658-9_5.Search in Google Scholar
[24] Szmuksta-Zawadzka M, Zawadzki J. Forecasting on the basis of Holt-Winters models for complete and incomplete data. Research Papers of the Wrocław University of Economics. Vol. 38; 2009.Search in Google Scholar
[25] Wójcik A. Autoregressive vector models as a response to the critique of multi-equation structural econometric models. Katowice, Poland: Publishing house of the University of Economics in Katowice. Vol. 193; 2014.Search in Google Scholar
[26] Monederoa BD, Gil-Alanaa LA, Martínezaa MCV. Road accidents in Spain: Are they persistent? IATSS Res. 2021;45(3):317–25.10.1016/j.iatssr.2021.01.002Search in Google Scholar
[27] Al-Madani H. Global road fatality trends’estimations based on country-wise microlevel data. Accid Anal Prev. 2018;111:297–310. 10.1016/j.aap.2017.11.035.Search in Google Scholar PubMed
[28] Mamczur M. Machine learning How does linear regression work? And is it worth using? https://miroslawmamczur.pl/jak-dziala-regresja-liniowa-i-czy-warto-ja-stosowac/.Search in Google Scholar
[29] Piłatowska M. The choice of the order of autoregression depending on the parameters of the generating model. Econometrics. 2012;4(38):16–35.Search in Google Scholar
[30] Biswas AA, Mia J, Majumder A. Forecasting the number of road accidents and casualties using random forest regression in the context of Bangladesh. Economics 10th International Conference on Computing, Communication and Networking Technologies (ICCCNT); July 2019. p. 1–5.10.1109/ICCCNT45670.2019.8944500Search in Google Scholar
[31] Random forest. https://pl.wikipedia.org/wiki/Las_losowy.Search in Google Scholar
[32] Fijorek K, Mróz K, Niedziela K, Fijorek D. Forecasting electricity prices on the day-ahead market using data mining methods Energy Market; 12/2010.Search in Google Scholar
[33] Chudy-Laskowska K, Pisula T. Forecast of the number of road accidents in Poland. Logistics; 6/2014.Search in Google Scholar
[34] Kashpruk N. Comparative research of statistical models and soft computing for identification of time series and forecasting. [Phd Dissertation]. Opole University of Technology; 2010.Search in Google Scholar
[35] Prochazka J, Camaj M. Modelling the number of road accidents of uninsured drivers and their severity. Proceedings of International Academic Conferences 5408040, International Institute of Social and Economic Sciences; 2017.10.20472/IAC.2017.032.035Search in Google Scholar
[36] Dutta B, Barman MP, Patowary AN. Application of Arima model for forecasting road accident deaths in India. Int J Agric Stat Sci. 2020;16(2):607–15.Search in Google Scholar
[37] Karlaftis M, Vlahogianni E. Memory properties and fractional integration in trans-portation time-series. Transp Res C. 2009;17:444–53.10.1016/j.trc.2009.03.001Search in Google Scholar
[38] Łobejko S. Time series analysis and forecasting with SAS. Warsaw: Main Business School in Warsaw; 2015.Search in Google Scholar
[39] Dudek G. Exponential smoothing models for short-term power system load forecasting. Energy Mark. 2013;3:106.Search in Google Scholar
[40] Chudy-Laskowska K, Pisula T. Forecasting the number of road accidents in Podkarpacie. Logistics. 2015;4:2782–96.Search in Google Scholar
[41] Road safety assessment handbook. https://www.iung.pl/PJA/wydane/11/PJA11_3.pdf.Search in Google Scholar
[42] Wrobel MS. Application of neural fuzzy systems in chemistry. PhD thesis. Katowice: University of Silesia; 2017.Search in Google Scholar
[43] Data mining techniques StatSoft. https://www.statsoft.pl/textbook/stathome_stat.html?https%3A%2F%2Fwww.statsoft.pl%2Ftextbook%2Fstdatmin.html.Search in Google Scholar
[44] Kumar S, Viswanadham V, Bharathi B. Analysis of road accident. IOP Conf Ser Mater Sci Eng. 2019;590(1):012029. 10.1088/1757-899X/590/1/012029.Search in Google Scholar
[45] Top Advantages and Disadvantages of Hadoop 3 DataFlair. https://data-flair.training/blogs/advantages-and-disadvantages-of-hadoop/.Search in Google Scholar
[46] Perczak G, Fiszeder P. GARCH model – using additional information on minimum and maximum prices. Bank Credit. 2014;2:105–32.Search in Google Scholar
[47] Fiszeder P. GARCH class models in empirical financial research. Torun, Poland: Scientific Publishers of the Nicolaus Copernicus University; 2009.Search in Google Scholar
[48] McIlroy RC, Plant KA, Hoque MS, Wu J, Kokwaro GO, Nam VH, et al. Who is responsible for global road safety? A cross-cultural comparison ofactor maps. Accid Anal Prev. 2019;122:8–18. 10.1016/j.aap.2018.09.011.Search in Google Scholar PubMed
[49] Muck J. Econometrics. Modeling of time series. Stationary. Unit root tests. ARDL models. Co-integration. http://web.sgh.waw.pl/∼jmuck/Ekonometria/EkonometriaPrezentacja5.pdf.Search in Google Scholar
[50] Shetty P, Sachin PC, Kashyap VK, Madi V. Analysis of road accidents using data mining techniques. Int Res J Eng Technol. 2017;7(5):2395-0056.Search in Google Scholar
[51] Li L, Shrestha S, Hu G. Analysis of road traffic fatal accidents using data mining techniques. 2017 IEEE 15th International Conference on Software Engineering Research, Management and Applications (SERA); 2017. p. 363–70. 10.1109/SERA.2017.7965753.Search in Google Scholar
[52] Marcinkowska J. Statistical methods and data mining in assessing the occurrence of syncope in the group of narrow-QRS tachycardia (AVNRT and AVRT). Poznań: Medical University of Karol Marcinkowski in Poznań; 2015. http://www.wbc.poznan.pl/Content/373785/index.pdf.Search in Google Scholar
[53] Sebego M, Naumann RB, Rudd RA, Voetsch K, Dellinger AM, Ndlovu C. The impact of alcohol and road traffic policies on crash rates in Botswana, 2004–2011: atime-series analysis. Accid Anal Prev. 2008;70:33–9. 10.1016/j.aap.2014.02.017.Search in Google Scholar PubMed PubMed Central
[54] Bloomfield P. An exponential model in the spectrum of a scalar time series. Biometrika. 1973;60:217–26. https://www.jstor.org/stable/2334533.10.1093/biomet/60.2.217Search in Google Scholar
[55] Statistic Road Accident in Poland; 2022. https://statystyka.policja.pl/.Search in Google Scholar
[56] Statistic Road Accident in Slovakia. kompletna-statistika; 15.4.2022. https://www.minv.sk/?.Search in Google Scholar
© 2022 Martin Jurkovic et al., published by De Gruyter
This work is licensed under the Creative Commons Attribution 4.0 International License.
Articles in the same Issue
- Regular Articles
- Performance of a horizontal well in a bounded anisotropic reservoir: Part I: Mathematical analysis
- Key competences for Transport 4.0 – Educators’ and Practitioners’ opinions
- COVID-19 lockdown impact on CERN seismic station ambient noise levels
- Constraint evaluation and effects on selected fracture parameters for single-edge notched beam under four-point bending
- Minimizing form errors in additive manufacturing with part build orientation: An optimization method for continuous solution spaces
- The method of selecting adaptive devices for the needs of drivers with disabilities
- Control logic algorithm to create gaps for mixed traffic: A comprehensive evaluation
- Numerical prediction of cavitation phenomena on marine vessel: Effect of the water environment profile on the propulsion performance
- Boundary element analysis of rotating functionally graded anisotropic fiber-reinforced magneto-thermoelastic composites
- Effect of heat-treatment processes and high temperature variation of acid-chloride media on the corrosion resistance of B265 (Ti–6Al–4V) titanium alloy in acid-chloride solution
- Influence of selected physical parameters on vibroinsulation of base-exited vibratory conveyors
- System and eco-material design based on slow-release ferrate(vi) combined with ultrasound for ballast water treatment
- Experimental investigations on transmission of whole body vibration to the wheelchair user's body
- Determination of accident scenarios via freely available accident databases
- Elastic–plastic analysis of the plane strain under combined thermal and pressure loads with a new technique in the finite element method
- Design and development of the application monitoring the use of server resources for server maintenance
- The LBC-3 lightweight encryption algorithm
- Impact of the COVID-19 pandemic on road traffic accident forecasting in Poland and Slovakia
- Development and implementation of disaster recovery plan in stock exchange industry in Indonesia
- Pre-determination of prediction of yield-line pattern of slabs using Voronoi diagrams
- Urban air mobility and flying cars: Overview, examples, prospects, drawbacks, and solutions
- Stadiums based on curvilinear geometry: Approximation of the ellipsoid offset surface
- Driftwood blocking sensitivity on sluice gate flow
- Solar PV power forecasting at Yarmouk University using machine learning techniques
- 3D FE modeling of cable-stayed bridge according to ICE code
- Review Articles
- Partial discharge calibrator of a cavity inside high-voltage insulator
- Health issues using 5G frequencies from an engineering perspective: Current review
- Modern structures of military logistic bridges
- Retraction
- Retraction note: COVID-19 lockdown impact on CERN seismic station ambient noise levels
- Special Issue: Trends in Logistics and Production for the 21st Century - Part II
- Solving transportation externalities, economic approaches, and their risks
- Demand forecast for parking spaces and parking areas in Olomouc
- Rescue of persons in traffic accidents on roads
- Special Issue: ICRTEEC - 2021 - Part II
- Switching transient analysis for low voltage distribution cable
- Frequency amelioration of an interconnected microgrid system
- Wireless power transfer topology analysis for inkjet-printed coil
- Analysis and control strategy of standalone PV system with various reference frames
- Special Issue: AESMT
- Study of emitted gases from incinerator of Al-Sadr hospital in Najaf city
- Experimentally investigating comparison between the behavior of fibrous concrete slabs with steel stiffeners and reinforced concrete slabs under dynamic–static loads
- ANN-based model to predict groundwater salinity: A case study of West Najaf–Kerbala region
- Future short-term estimation of flowrate of the Euphrates river catchment located in Al-Najaf Governorate, Iraq through using weather data and statistical downscaling model
- Utilization of ANN technique to estimate the discharge coefficient for trapezoidal weir-gate
- Experimental study to enhance the productivity of single-slope single-basin solar still
- An empirical formula development to predict suspended sediment load for Khour Al-Zubair port, South of Iraq
- A model for variation with time of flexiblepavement temperature
- Analytical and numerical investigation of free vibration for stepped beam with different materials
- Identifying the reasons for the prolongation of school construction projects in Najaf
- Spatial mixture modeling for analyzing a rainfall pattern: A case study in Ireland
- Flow parameters effect on water hammer stability in hydraulic system by using state-space method
- Experimental study of the behaviour and failure modes of tapered castellated steel beams
- Water hammer phenomenon in pumping stations: A stability investigation based on root locus
- Mechanical properties and freeze-thaw resistance of lightweight aggregate concrete using artificial clay aggregate
- Compatibility between delay functions and highway capacity manual on Iraqi highways
- The effect of expanded polystyrene beads (EPS) on the physical and mechanical properties of aerated concrete
- The effect of cutoff angle on the head pressure underneath dams constructed on soils having rectangular void
- An experimental study on vibration isolation by open and in-filled trenches
- Designing a 3D virtual test platform for evaluating prosthetic knee joint performance during the walking cycle
- Special Issue: AESMT-2 - Part I
- Optimization process of resistance spot welding for high-strength low-alloy steel using Taguchi method
- Cyclic performance of moment connections with reduced beam sections using different cut-flange profiles
- Time overruns in the construction projects in Iraq: Case study on investigating and analyzing the root causes
- Contribution of lift-to-drag ratio on power coefficient of HAWT blade for different cross-sections
- Geotechnical correlations of soil properties in Hilla City – Iraq
- Improve the performance of solar thermal collectors by varying the concentration and nanoparticles diameter of silicon dioxide
- Enhancement of evaporative cooling system in a green-house by geothermal energy
- Destructive and nondestructive tests formulation for concrete containing polyolefin fibers
- Quantify distribution of topsoil erodibility factor for watersheds that feed the Al-Shewicha trough – Iraq using GIS
- Seamless geospatial data methodology for topographic map: A case study on Baghdad
- Mechanical properties investigation of composite FGM fabricated from Al/Zn
- Causes of change orders in the cycle of construction project: A case study in Al-Najaf province
- Optimum hydraulic investigation of pipe aqueduct by MATLAB software and Newton–Raphson method
- Numerical analysis of high-strength reinforcing steel with conventional strength in reinforced concrete beams under monotonic loading
- Deriving rainfall intensity–duration–frequency (IDF) curves and testing the best distribution using EasyFit software 5.5 for Kut city, Iraq
- Designing of a dual-functional XOR block in QCA technology
- Producing low-cost self-consolidation concrete using sustainable material
- Performance of the anaerobic baffled reactor for primary treatment of rural domestic wastewater in Iraq
- Enhancement isolation antenna to multi-port for wireless communication
- A comparative study of different coagulants used in treatment of turbid water
- Field tests of grouted ground anchors in the sandy soil of Najaf, Iraq
- New methodology to reduce power by using smart street lighting system
- Optimization of the synergistic effect of micro silica and fly ash on the behavior of concrete using response surface method
- Ergodic capacity of correlated multiple-input–multiple-output channel with impact of transmitter impairments
- Numerical studies of the simultaneous development of forced convective laminar flow with heat transfer inside a microtube at a uniform temperature
- Enhancement of heat transfer from solar thermal collector using nanofluid
- Improvement of permeable asphalt pavement by adding crumb rubber waste
- Study the effect of adding zirconia particles to nickel–phosphorus electroless coatings as product innovation on stainless steel substrate
- Waste aggregate concrete properties using waste tiles as coarse aggregate and modified with PC superplasticizer
- CuO–Cu/water hybrid nonofluid potentials in impingement jet
- Satellite vibration effects on communication quality of OISN system
- Special Issue: Annual Engineering and Vocational Education Conference - Part III
- Mechanical and thermal properties of recycled high-density polyethylene/bamboo with different fiber loadings
- Special Issue: Advanced Energy Storage
- Cu-foil modification for anode-free lithium-ion battery from electronic cable waste
- Review of various sulfide electrolyte types for solid-state lithium-ion batteries
- Optimization type of filler on electrochemical and thermal properties of gel polymer electrolytes membranes for safety lithium-ion batteries
- Pr-doped BiFeO3 thin films growth on quartz using chemical solution deposition
- An environmentally friendly hydrometallurgy process for the recovery and reuse of metals from spent lithium-ion batteries, using organic acid
- Production of nickel-rich LiNi0.89Co0.08Al0.03O2 cathode material for high capacity NCA/graphite secondary battery fabrication
- Special Issue: Sustainable Materials Production and Processes
- Corrosion polarization and passivation behavior of selected stainless steel alloys and Ti6Al4V titanium in elevated temperature acid-chloride electrolytes
- Special Issue: Modern Scientific Problems in Civil Engineering - Part II
- The modelling of railway subgrade strengthening foundation on weak soils
- Special Issue: Automation in Finland 2021 - Part II
- Manufacturing operations as services by robots with skills
- Foundations and case studies on the scalable intelligence in AIoT domains
- Safety risk sources of autonomous mobile machines
- Special Issue: 49th KKBN - Part I
- Residual magnetic field as a source of information about steel wire rope technical condition
- Monitoring the boundary of an adhesive coating to a steel substrate with an ultrasonic Rayleigh wave
- Detection of early stage of ductile and fatigue damage presented in Inconel 718 alloy using instrumented indentation technique
- Identification and characterization of the grinding burns by eddy current method
- Special Issue: ICIMECE 2020 - Part II
- Selection of MR damper model suitable for SMC applied to semi-active suspension system by using similarity measures