COVID-19 lockdown impact on CERN seismic station ambient noise levels
-
Łukasz Ścisło
 and
Michael Guinchard
and
Michael Guinchard

Abstract
Seismic measuring stations do not only record seismic waves. They also pick up tremors caused by other factors: these are known as seismic background noise. In normal conditions, this environmental background is steady over a long time. This article presents the influence of high reduction of human activity due to COVID-19 initial lockdown on ground vibration in the Large Hadron Collider tunnel at the European Organization for Nuclear Research.
1 Introduction
Seismic monitoring setups and stations are not only used to record seismic waves. They can also pick up tremors caused by other sources known as seismic background noise. Human activity is partly responsible for these continuous movements of the ground. For instance, road traffic or industrial activities will cause an additional response of the ground motion. Due to periodic human activity, their impact is typically greater during the workdays and lower at nights and during the weekends. Wind, waves and weather also cause the Earth to vibrate constantly. International studies have shown that levels of human-induced seismic background noise have decreased in many locations since the outbreak of the coronavirus pandemic [1,2]. Measuring stations were thus indirectly detecting the effects of the lockdown and the associated drop in human and industrial activity. This behaviour is especially interesting for places where ground motion conditions monitoring is important for the proper execution of research experiments. Research facilities like European Organization for Nuclear Research (CERN) (Switzerland) [3,4], EGO-Virgo experiment (Italy) [5,6] or SOLARIS (Poland) [7,8] require extensive research on the ground motion behaviour and its effects on the performance of their detectors. This article presents the observations of the seismic ambient noise at CERN during the 2020 strict lockdown around this research centre facilities due to the COVID-19 epidemic.
1.1 Influence of COVID-19 lockdown on seismic background noise in Switzerland
The Swiss Seismological Service (SED) has observed the reduction of seismic ambient noise phenomenon in Switzerland. Monitoring systems connected to the Swiss Strong Motion Network (SSMNet), many of which are located in highly populated areas, have recorded a significant decrease in seismic background noise. This has been the case especially for the stations in larger cities like Zurich, Basel and Geneva. Since the state of emergency was declared (16.03.2020), levels of background noise in these cities during workdays have nearly decreased to the levels recorded during weekends before the beginning of the lockdown. The decrease in ambient noise levels was also observed on the weekend evenings. The seismic noise levels recorded during this time has fallen to the level typically observed on a normal weekday evening in those cities. It is of note that due to the particularity of Swiss urban areas, more seismic noise is generated on weekends than on weekday evenings.
Conversely, rural or alpine stations belonging to the SDSNet have only recorded slight decreases in background noise because these areas are considerably less affected by vibrations from road traffic, trains and other human activities. However, strong winds and other weather factors may nevertheless lead to increased levels of background noise in specific areas.
The additional side effect of the lockdown was the possibility for monitoring stations to detect earthquakes of lesser magnitude for which the signals would otherwise be lost in the background noise. The COVID-19 lockdown has therefore increased the sensitivity of earthquake monitoring in some parts of Switzerland, although the overall effect at just 0.1–0.2 magnitude units. By way of comparison, the sensitivity of monitoring is on average 0.5 magnitude units greater during the night than during daytime working hours [9].
1.2 CERN monitoring system for seismic activity
Large Hadron Collider (LHC) is a part of an international collaboration facility at CERN. It is situated in the underground tunnels beneath the border of France and Switzerland, in the close vicinity to Geneva (Switzerland). It is currently the world largest and highest energy particle accelerator in the world. The underground placement of the accelerator was chosen in order to diminish the influence of undesirable vibrations and disturbances on the operation of this extremely precise scientific apparatus. The cultural noise related to human activity on the surface is typically not strong enough to disturb the current measurements performed in LHC. However, one might expect that either strong ground motion, e.g., caused by a nearby earthquake or a long-term heavy machinery work performed in the close vicinity of the accelerator, might impact its operation and in the worst-case scenario invalidate the data collected during its run. In addition, for future upgrades (LHC-HL) and future strategical investments (FCC), the matter of seismic ambient noise will be a serious matter.
Therefore, for the purpose of monitoring the ground vibration activity in the areas close to the accelerator, a CERN Seismic Network has been established thanks to a collaboration between CERN (EN-MME, EN-STI groups) and Swiss Seismological Service SED [10]. It consists of three separate seismic stations (vaults) as shown in Figure 1: two underground stations, placed in the tunnels at Point 1 (near ATLAS detector) and at Point 5 (near CMS detector) and a third surface station located approximately in the centre of the accelerator ring.
![Figure 1
Map of CERN Seismic Network with specified locations of separate seismic stations [11].](/document/doi/10.1515/eng-2022-0005/asset/graphic/j_eng-2022-0005_fig_001.jpg)
Map of CERN Seismic Network with specified locations of separate seismic stations [11].
Each of the three seismic stations has been equipped with a pair of highly precise vibration measuring devices, chosen in such a manner as to complement the measurements obtained from one another. The strong motion sensor of sensitivity of
Sensor parameters
| Model | Guralp 6T (geophone) | Guralp 40T (geophone) | Kinemetrics EpiSensor ES-T (str. motion) |
|---|---|---|---|
| Frequency range | 1/30–100 Hz | 1/60–100 Hz | DC – 200 Hz |
| Sensitivity |
|
|
|
| Sensor output |
|
|
|
| Sensor dynamic range | 137 dB
|
151 dB
|
155 dB |
| Supply voltage | 10–30 V | 10–36 V |
|
Although, the system was calibrated to measure in the frequency range 1/30–100 Hz, from the point of the LHC and current and future civil engineering operations within the range of 10–50 Hz are of much more importance, because of the natural frequencies of the magnets located in the LHC tunnel. The first two (and most prominent) natural frequencies for the magnets are at 8 and 22 Hz. Although the stations measure vibrations with good trueness, the signal might be perturbed by excessive cultural noise or electronic noise, reducing the quality of the data acquired. The broadband seismometer DAQ modules were chosen especially to present a noise level lower than LHC usual level of vibration between 1/30 and 100 Hz. Additional tests have been performed in the LHC for the purpose of selecting the most adequate modules. The modules have been connected to two Guralp 6T sensors to calculate the noise present in each acquisition chain. The measurement showed similar vertical ground motion levels, which was also verified using the reference equipment. This test confirmed that the module NI9239 is compliant with specific CERN noise requirements and showed that for a broadband seismometer, the noise in the acquisition chain comes mainly from the sensor. Out of the electrical noise, it is possible to point out the typical seismic signals shown in the literature. The strong motion sensor measures the vibration up to 2g. Contrary to broadband seismometers, its noise is low and comes mainly from the acquisition chain. Taking this into consideration, the NI9239 module had also been selected because of its
The chosen data acquisition system for seismic stations was an eight-channel CompactRIO from the National Instruments, complemented with two NI9239 modules each equipped with four differential channels. The selected modules allow a 24-bit simultaneous sampling on
Figure 2 presents a seismic station located at Point 5 with both the strong motion sensor (left) and the broadband sensor (right) placed inside.

Vibrometers placed inside the Point 5 seismic station: strong motion sensor (left) and broadband sensor (right).
2 Influence of COVID-19 on background noise in LHC tunnel
2.1 CERN measures to fight the COVID-19 pandemic
The users presence on the CERN sites from the middle of March 2020 was strongly limited to only the personnel essential for ensuring the security and safety of the facilities and the equipment. All the works on the site were halted, and all equipment and systems that were not required were switched off. CERN has been in a strict safe mode since 16.03.2020, with the majority of personnel working remotely. During this period, a maximum of around 600 people (of the typical 7,000) have been granted occasional permission to enter CERN to ensure the safe maintenance of the sites and facilities. The full plan of access to site restrictions is shown in Figure 3.

Phases of limitation of users’ access to CERN facilities.
Starting from 18.05.2020, on-site activities were extended to a limited number of CERN personnel and contractors, beginning with the personnel whose work was related to CERN maintenance period (Long Shutdown 2), accelerator and detector upgrades and urgent site and building construction activities. The aim is to allow additional 500 people the access to CERN site each week and by doing so restart crucial activities and experiments. The statistical data of the number of users at the site each day is shown in Figure 4.

Number of CERN users at the site from March to June 2020 by CERN SUSI (SUrveillance des SItes).
3 Seismic noise comparison due to COVID-19
A typical approach when analysing vibration is to transform the time-domain quantitative data into frequency-domain qualitative data, such as power spectral density. The analysis of the power spectral density of the data under consideration, provides the information regarding which frequencies (if any) are dominant in the area of the station, and makes it possible to determine how they are related to the nearby activities. The amplitude of vibration ranging from 10 to 100 Hz is mostly stable during the period of standard operation in the vicinity of the station (black line on Figure 5). However, the CERN closure from 16.03.2020 and subsequent limitation of human activity had a visible effect on the amplitude of vibration in the frequencies responsible for cultural noise for both the seismic station on the surface (Figure 5) and the one underground at CERN point 5 – CMS experiment (Figure 6).

PSD graph for the 20-min data block from seismic station at the surface (CERNS) before (black line) and after (green line) COVID-19 CERN closure.

PSD graph for the 20-min data block from the seismic station at LHC tunnel (CERN Point 5 – CMS) before (black line) and after (green line) COVID-19 CERN closure.
In addition, the data gathered in Figure 6 are presented as a 1/6th octave band graph (Figure 7). The whole frequency range (in this case 0–100 Hz) is divided into sets of frequencies called bands. Each band covers a specified range of frequencies. This approach allows more statistical way to calculate which frequencies are being activated. Finally, the yellow and red horizontal lines shown in Figure 7 correspond to the warning and alarm levels that have been decided upon for the vibration works at LHC. These have proven useful to the team monitoring the works, as a quick indicator for the severity of vibration caused by the heavy machine operation. It can be observed that the monitoring team has decided to lower the warning and alarm levels within the frequency range 7–28 Hz. This is dictated by the fact that the first two and most prominent natural frequencies of the magnets located in the tunnel lie within this range, specifically at 8 and 22 Hz. As such, the ground vibrations at these frequencies were going to have a stronger impact on the magnets and the beam circulating within them.

The 1/6th Octave Band Velocity RMS for 20-min data block, comparison of data before and after the lockdown at CERN point 5 (CMS) seismic station.
When analysing the data using Power Spectral Density, the aim of the analysis and the limitation imposed upon this technique must be considered, specifically the condition for the collected data to be stationary. One can simply assume this for short-term measurements (typically 5–20 min) when no sudden excitation is present. However, if the goal is to analyze the data over a long time, it is necessary to implement a different approach. One of the possibilities is to utilize the probabilistic power spectral density (PPSD) method, which combines the information from multiple PSD data streams to describe the long-term seismic behaviour of the observed area [11].
The data obtained for the analysis and calculation of the PPSD have been downloaded directly from the publicly available servers set up by SED. The detailed procedure for calculating and plotting PPSD is specified in refs [12,13]. In general, for each of the PSD graph acquired from the measurement, the calculation is performed to obtain the values of full-octave averages in 1/8 intervals, which are afterwards allocated in 1 dB power bins inside the PPSD map, under the assumption that the reference value is
The PPSD graphs for 2 months before the lockdown and 2 months after implementation of the safety measures are shown in Figure 5 for the CERN surface seismic station and Figure 6 for one of the underground seismic stations (in this case, station at CERN Point 1 – ATLAS experiment).
The thick black lines on the graphs correspond to the so-called new high noise model (upper line) and new low noise model (lower line) as specified in ref. [12]. These lines represent the highest and lowest measured levels of ambient natural Earth noise sources. Taking into account the sources of the seismic noise, the graphs are shown in Figures 8 and 9, and it is suggested that they can be sub-divided into three approximate frequency regions. The first one located within the frequency range between 0.1 and 1 Hz, shows an amplitude maximum at 0.15–0.2 Hz and a sudden drop afterwards. This behaviour is consistent over a period of four examined months. This range corresponds to the so-called micro-seismic vibration caused by the movement of Earth’s oceans. Therefore, limiting the human activity during the lockdown has no noticeable effect on the vibrations in this frequency range.

Probabilistic Power Spectral Density of CERN Seismic Station at the surface (CERNS) calculated over a period of 2 months before (left graph) and 2 months after (right graph) the CERN COVID-19 closure.
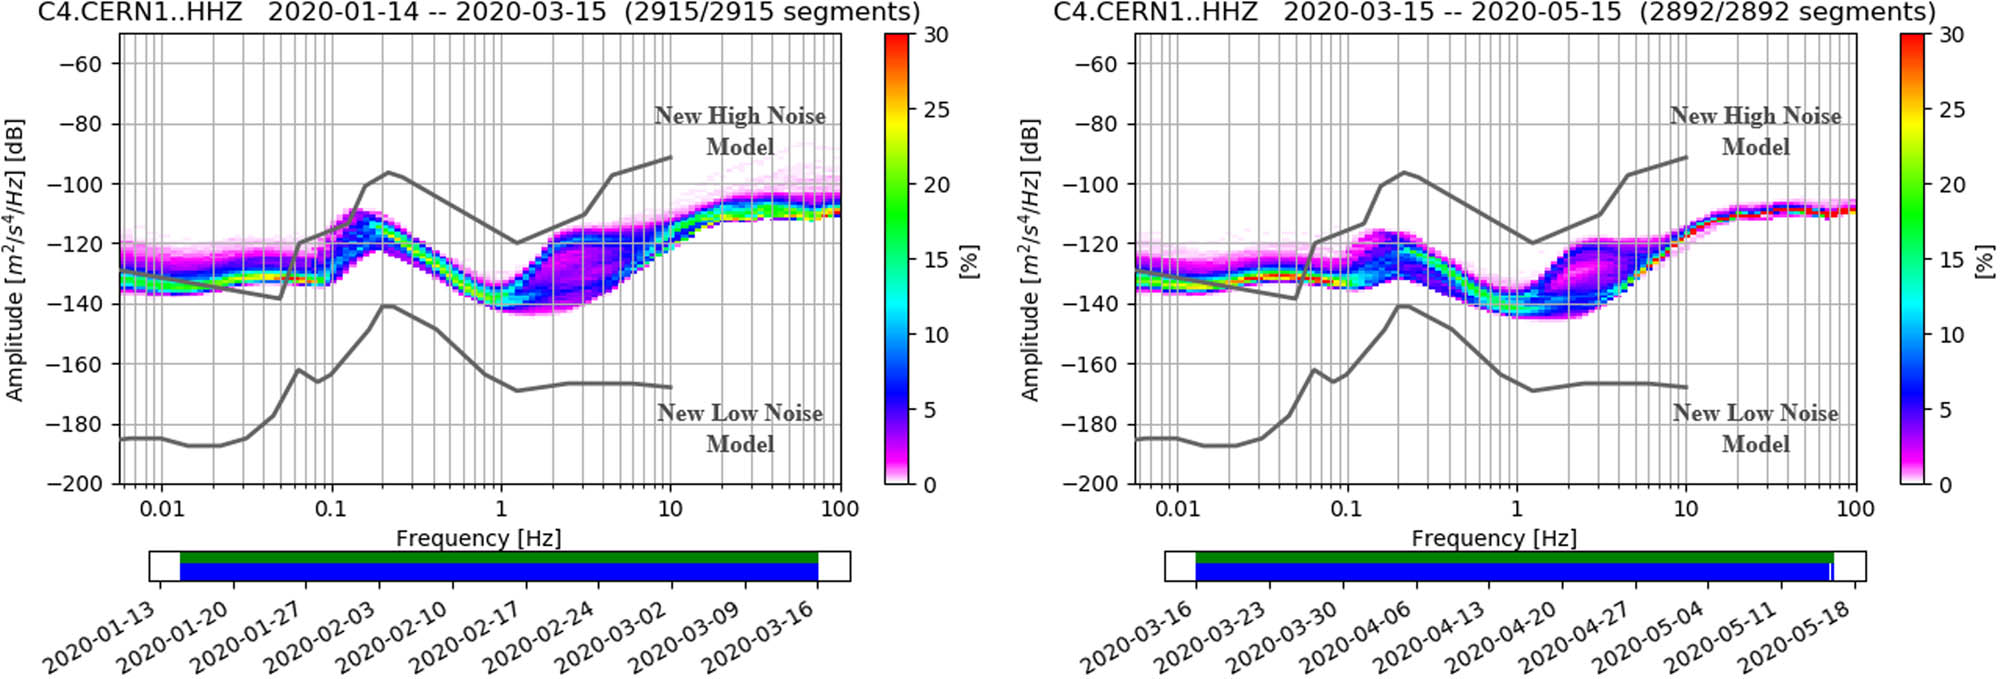
Probabilistic Power Spectral Density of CERN Seismic Station at Point 1 (ATLAS) calculated over a period of 2 months before (left graph) and 2 months after (right graph) the CERN COVID-19 closure.
When regarding Figures 8 and 9, both left and right graphs, two amplitude curves are readily visible within the frequency range from 1 to 10 Hz. Those can be interpreted as the vibration caused by human activity, known also as “cultural noise” (operating machines, manufactures, public transport, etc.), with the upper line corresponding to the peak-level of human activity during the day and the lower one to the nightly hours. It is already visible that the amplitudes decreased especially in the case of measurements for the tunnel (CERN1). For the surface station, this effect is much lower due to the location of the surface station in the fields far away from human activities. This behaviour corresponds to the observations done by the Swiss Seismological Service (SED) for rural or alpine stations where only a slight decrease in background noise was recorded.
Finally, within the last frequency range of 10–100 Hz a mostly stable amplitude curve can be seen. As the CERN1 station is located in an underground tunnel (close to ATLAS experiment), the influence of the vibration sources operating within this range on the surface in most part is diminished and thus negligible over a long period. This means that the curve represents the actual ambient noise level inside the tunnel. However, at this location, extensive civil engineering works have been in progress before the lockdown (new caverns excavations), and the effect of the lockdown is clearly visible in Figure 9. The levels for this range after the lockdown have visibly decreased, which can be attributed to the reduction of the additional (human-based) sources of vibration.
4 Summary and future prospects
The COVID-19 limitation of human and industry activity presented in this article has proven convenient for determining the actual impact of these activities on seismic data from the CERN Seismic Network. This study is especially useful in case of discussion about commissioning future generation of accelerators, the operation of which will be highly dependant on seismic noise and maintaining low vibration levels. This analysis makes it possible to obtain an estimate of how much the noise level can be reduced with the limitation of human activity, both on the surface and inside an underground location. Finally, the utilisation of PPSD approach to analyse ambient seismic noise is advantageous for presenting the long-term vibrational impact of human activity on the environment inside the caverns and tunnels at CERN.
Due to the higher energies and precision of LHC and the planned FCC project, it will be essential to monitor human activity directly above the accelerator line. The presented tools will provide a useful utility for a quick and easy way to evaluate seismic conditions in the whole CERN accelerator complex.
-
Conflict of interest: Authors state no conflict of interest.
References
[1] Poli P, Boaga J, Molinari I, Cascone V, Boschi L. The 2020 coronavirus lockdown and seismic monitoring of anthropic activities in Northern Italy. Scientific Reports. 2020 Jun;10(1):1–8. 10.1038/s41598-020-66368-0Search in Google Scholar PubMed PubMed Central
[2] Gibney E. Coronavirus lockdowns have changed the way Earth moves. Nature. 2020 Mar;580(7802):176–7. 10.1038/d41586-020-00965-xSearch in Google Scholar PubMed
[3] Schaumann M, Gamba D, Guinchard M, Scislo L, Wenninger J. Effect of ground motion introduced by HL-LHC CE work on LHC beam operation. Proceedings of the 10th International Particle Accelerator Conference. Geneva: JaCoW Publishing, CERN; 2019. Search in Google Scholar
[4] Guinchard M, Fessia P, Lacny L, Osborne J, Scislo L, Wenninger J, et al. Investigation and estimation of the LHC magnet vibrations induced by HL-LHC civil engineering activities. Proceedings of the 9th International Particle Accelerator Conference. Geneva: JaCoW Publishing, CERN; 2018. Search in Google Scholar
[5] Ballardin G, Bracci L, Braccini S, Bradaschia C, Casciano C, Calamai G, et al. Measurement of the VIRGO superattenuator performance for seismic noise suppression. Rev Scientific Instr. 2001 Sep;72(9):3643–52. 10.1063/1.1392338Search in Google Scholar
[6] Accadia T, Acernese F, Antonucci F, Astone P, Ballardin G, Barone F, et al. The seismic superattenuators of the virgo gravitational waves interferometer. J Low Freq Noise Vibrat Act Control. 2011 Mar;30(1):63–79. 10.1260/0263-0923.30.1.63Search in Google Scholar
[7] Ziemiański D, Kozień M, Nowak M. Analysis of 3rd Octave band ground motions transmission in synchrotron radiation facility SOLARIS. In: Gibbs B, editor. ICSV24: 24th International Congress on Sound and Vibration. London: International Institute of Acoustics and Vibration; 23–27 July, 2017. p. 2477–82. Search in Google Scholar
[8] Łacny Ł, Kozień M, Ziemiański D. Selected overview of the impact of ground motion on the vibrations of particle accelerators. In: 3rd National Conference on Current and Emerging Process Technologies - CONCEPT 2020. Melville, New York: AIP Publishing; 2020. 10.1063/5.0008950Search in Google Scholar
[9] Nanjo KZ, Schorlemmer D, Woessner J, Wiemer S, Giardini D. Earthquake detection capability of the Swiss Seismic network. Geophys J Int. 2010 Apr;181(3):1713–24. 10.1111/j.1365-246X.2010.04593.xSearch in Google Scholar
[10] Charrondière C, Cabon M, Develle K, Guinchard M. Ground vibration monitoring at CERN as part of the international seismic network. In: Proceedings of the 16th International Conference on Accelerator and Large Experimental Control Systems. ICALEPCS2017; 2018. p. 1695–8. Search in Google Scholar
[11] Łacny Ł, Ścisło L, Guinchard M. Application of probabilistic power spectral density technique to monitoring the long-term vibrational behaviour of CERN seismic network stations. Vibrat Phys Sys. 2020;31(3):2020311, p. 1–7.Search in Google Scholar
[12] McNamara DE, Buland RP. Ambient noise levels in the continental United States. Bulletin Seismolog Soc America. 2004 Aug;94(4):1517–27. 10.1785/012003001Search in Google Scholar
[13] McNamara DE, Boaz RI. Seismic noise analysis system, power spectral density probability density function: Stand-Alone software package. US Geological Survey; 2005. 10.3133/ofr20051438Search in Google Scholar
[14] Peterson JR. Observations and modeling of seismic background noise. US Geological Survey; 1993. 10.3133/ofr93322Search in Google Scholar
© 2022 Łukasz Ścisło et al., published by De Gruyter
This work is licensed under the Creative Commons Attribution 4.0 International License.
Articles in the same Issue
- Regular Articles
- Performance of a horizontal well in a bounded anisotropic reservoir: Part I: Mathematical analysis
- Key competences for Transport 4.0 – Educators’ and Practitioners’ opinions
- COVID-19 lockdown impact on CERN seismic station ambient noise levels
- Constraint evaluation and effects on selected fracture parameters for single-edge notched beam under four-point bending
- Minimizing form errors in additive manufacturing with part build orientation: An optimization method for continuous solution spaces
- The method of selecting adaptive devices for the needs of drivers with disabilities
- Control logic algorithm to create gaps for mixed traffic: A comprehensive evaluation
- Numerical prediction of cavitation phenomena on marine vessel: Effect of the water environment profile on the propulsion performance
- Boundary element analysis of rotating functionally graded anisotropic fiber-reinforced magneto-thermoelastic composites
- Effect of heat-treatment processes and high temperature variation of acid-chloride media on the corrosion resistance of B265 (Ti–6Al–4V) titanium alloy in acid-chloride solution
- Influence of selected physical parameters on vibroinsulation of base-exited vibratory conveyors
- System and eco-material design based on slow-release ferrate(vi) combined with ultrasound for ballast water treatment
- Experimental investigations on transmission of whole body vibration to the wheelchair user's body
- Determination of accident scenarios via freely available accident databases
- Elastic–plastic analysis of the plane strain under combined thermal and pressure loads with a new technique in the finite element method
- Design and development of the application monitoring the use of server resources for server maintenance
- The LBC-3 lightweight encryption algorithm
- Impact of the COVID-19 pandemic on road traffic accident forecasting in Poland and Slovakia
- Development and implementation of disaster recovery plan in stock exchange industry in Indonesia
- Pre-determination of prediction of yield-line pattern of slabs using Voronoi diagrams
- Urban air mobility and flying cars: Overview, examples, prospects, drawbacks, and solutions
- Stadiums based on curvilinear geometry: Approximation of the ellipsoid offset surface
- Driftwood blocking sensitivity on sluice gate flow
- Solar PV power forecasting at Yarmouk University using machine learning techniques
- 3D FE modeling of cable-stayed bridge according to ICE code
- Review Articles
- Partial discharge calibrator of a cavity inside high-voltage insulator
- Health issues using 5G frequencies from an engineering perspective: Current review
- Modern structures of military logistic bridges
- Retraction
- Retraction note: COVID-19 lockdown impact on CERN seismic station ambient noise levels
- Special Issue: Trends in Logistics and Production for the 21st Century - Part II
- Solving transportation externalities, economic approaches, and their risks
- Demand forecast for parking spaces and parking areas in Olomouc
- Rescue of persons in traffic accidents on roads
- Special Issue: ICRTEEC - 2021 - Part II
- Switching transient analysis for low voltage distribution cable
- Frequency amelioration of an interconnected microgrid system
- Wireless power transfer topology analysis for inkjet-printed coil
- Analysis and control strategy of standalone PV system with various reference frames
- Special Issue: AESMT
- Study of emitted gases from incinerator of Al-Sadr hospital in Najaf city
- Experimentally investigating comparison between the behavior of fibrous concrete slabs with steel stiffeners and reinforced concrete slabs under dynamic–static loads
- ANN-based model to predict groundwater salinity: A case study of West Najaf–Kerbala region
- Future short-term estimation of flowrate of the Euphrates river catchment located in Al-Najaf Governorate, Iraq through using weather data and statistical downscaling model
- Utilization of ANN technique to estimate the discharge coefficient for trapezoidal weir-gate
- Experimental study to enhance the productivity of single-slope single-basin solar still
- An empirical formula development to predict suspended sediment load for Khour Al-Zubair port, South of Iraq
- A model for variation with time of flexiblepavement temperature
- Analytical and numerical investigation of free vibration for stepped beam with different materials
- Identifying the reasons for the prolongation of school construction projects in Najaf
- Spatial mixture modeling for analyzing a rainfall pattern: A case study in Ireland
- Flow parameters effect on water hammer stability in hydraulic system by using state-space method
- Experimental study of the behaviour and failure modes of tapered castellated steel beams
- Water hammer phenomenon in pumping stations: A stability investigation based on root locus
- Mechanical properties and freeze-thaw resistance of lightweight aggregate concrete using artificial clay aggregate
- Compatibility between delay functions and highway capacity manual on Iraqi highways
- The effect of expanded polystyrene beads (EPS) on the physical and mechanical properties of aerated concrete
- The effect of cutoff angle on the head pressure underneath dams constructed on soils having rectangular void
- An experimental study on vibration isolation by open and in-filled trenches
- Designing a 3D virtual test platform for evaluating prosthetic knee joint performance during the walking cycle
- Special Issue: AESMT-2 - Part I
- Optimization process of resistance spot welding for high-strength low-alloy steel using Taguchi method
- Cyclic performance of moment connections with reduced beam sections using different cut-flange profiles
- Time overruns in the construction projects in Iraq: Case study on investigating and analyzing the root causes
- Contribution of lift-to-drag ratio on power coefficient of HAWT blade for different cross-sections
- Geotechnical correlations of soil properties in Hilla City – Iraq
- Improve the performance of solar thermal collectors by varying the concentration and nanoparticles diameter of silicon dioxide
- Enhancement of evaporative cooling system in a green-house by geothermal energy
- Destructive and nondestructive tests formulation for concrete containing polyolefin fibers
- Quantify distribution of topsoil erodibility factor for watersheds that feed the Al-Shewicha trough – Iraq using GIS
- Seamless geospatial data methodology for topographic map: A case study on Baghdad
- Mechanical properties investigation of composite FGM fabricated from Al/Zn
- Causes of change orders in the cycle of construction project: A case study in Al-Najaf province
- Optimum hydraulic investigation of pipe aqueduct by MATLAB software and Newton–Raphson method
- Numerical analysis of high-strength reinforcing steel with conventional strength in reinforced concrete beams under monotonic loading
- Deriving rainfall intensity–duration–frequency (IDF) curves and testing the best distribution using EasyFit software 5.5 for Kut city, Iraq
- Designing of a dual-functional XOR block in QCA technology
- Producing low-cost self-consolidation concrete using sustainable material
- Performance of the anaerobic baffled reactor for primary treatment of rural domestic wastewater in Iraq
- Enhancement isolation antenna to multi-port for wireless communication
- A comparative study of different coagulants used in treatment of turbid water
- Field tests of grouted ground anchors in the sandy soil of Najaf, Iraq
- New methodology to reduce power by using smart street lighting system
- Optimization of the synergistic effect of micro silica and fly ash on the behavior of concrete using response surface method
- Ergodic capacity of correlated multiple-input–multiple-output channel with impact of transmitter impairments
- Numerical studies of the simultaneous development of forced convective laminar flow with heat transfer inside a microtube at a uniform temperature
- Enhancement of heat transfer from solar thermal collector using nanofluid
- Improvement of permeable asphalt pavement by adding crumb rubber waste
- Study the effect of adding zirconia particles to nickel–phosphorus electroless coatings as product innovation on stainless steel substrate
- Waste aggregate concrete properties using waste tiles as coarse aggregate and modified with PC superplasticizer
- CuO–Cu/water hybrid nonofluid potentials in impingement jet
- Satellite vibration effects on communication quality of OISN system
- Special Issue: Annual Engineering and Vocational Education Conference - Part III
- Mechanical and thermal properties of recycled high-density polyethylene/bamboo with different fiber loadings
- Special Issue: Advanced Energy Storage
- Cu-foil modification for anode-free lithium-ion battery from electronic cable waste
- Review of various sulfide electrolyte types for solid-state lithium-ion batteries
- Optimization type of filler on electrochemical and thermal properties of gel polymer electrolytes membranes for safety lithium-ion batteries
- Pr-doped BiFeO3 thin films growth on quartz using chemical solution deposition
- An environmentally friendly hydrometallurgy process for the recovery and reuse of metals from spent lithium-ion batteries, using organic acid
- Production of nickel-rich LiNi0.89Co0.08Al0.03O2 cathode material for high capacity NCA/graphite secondary battery fabrication
- Special Issue: Sustainable Materials Production and Processes
- Corrosion polarization and passivation behavior of selected stainless steel alloys and Ti6Al4V titanium in elevated temperature acid-chloride electrolytes
- Special Issue: Modern Scientific Problems in Civil Engineering - Part II
- The modelling of railway subgrade strengthening foundation on weak soils
- Special Issue: Automation in Finland 2021 - Part II
- Manufacturing operations as services by robots with skills
- Foundations and case studies on the scalable intelligence in AIoT domains
- Safety risk sources of autonomous mobile machines
- Special Issue: 49th KKBN - Part I
- Residual magnetic field as a source of information about steel wire rope technical condition
- Monitoring the boundary of an adhesive coating to a steel substrate with an ultrasonic Rayleigh wave
- Detection of early stage of ductile and fatigue damage presented in Inconel 718 alloy using instrumented indentation technique
- Identification and characterization of the grinding burns by eddy current method
- Special Issue: ICIMECE 2020 - Part II
- Selection of MR damper model suitable for SMC applied to semi-active suspension system by using similarity measures