Numerical analysis of high-strength reinforcing steel with conventional strength in reinforced concrete beams under monotonic loading
-
Ibrahim S. I. Harba
 and
Ahmed A. M. AL-Shaar
and
Ahmed A. M. AL-Shaar

Abstract
This work presents finite element (FE) modeling using the ABAQUS program to investigate the effect of steel reinforcement with three different types of high-strength steels, grades 420, A1035, and SD685 on the flexural behavior of RC beams under monotonic loading. Experimental findings from the literature have been used to validate the proposed model. The numerical load, deflection, mode of failure, failure concrete strain, and bottom steel strain at failure of 24 numerical specimens with collapsed conditions of tension-controlled, balanced, and compression-controlled are recorded. Also, the effect of compression reinforcement is being investigated. The results reveal that the flexural behavior of the experimental test for the three steel grades is well validated by FE analysis. The ductile and brittle behavior features of yield strength (YS) larger than 420 can be predicted for specimens designed according to current standards ACI-318M-19. Also, the compression reinforcement improves load capacity while reducing displacement. It may be argued that when YS decreases, tensile stress and strain of flexural rebar rise, causing the beam to become more ductile. When the YS increased, the brittle behavior was induced.
1 Introduction
The use of high-strength steel reinforcement (HSSR) (yield stress greater than 60 Ksi or 420 MPa) could permit designers to reduce material quantities, thus leading to reduced construction costs and reinforcement congestion. Additionally, HSSR reinforcement improves the long-term endurance of concrete structures subjected to adverse weather conditions owing to its natural corrosion-resistant feature. The stress in steel at service load levels is projected to be higher with HSSR than with normal steel in concrete, also, a potential significant contribution of HSSR which still remains largely unrealized. The requirements of elongation and strain hardening of these higher grades is not a match with A706 grade 60 steel [1] (ASTM A706 2016). This raises concerns about the performance of reinforced concrete (RC) structures utilizing higher grade reinforcement.
Theoretically, the ultimate curvature capacity is reduced with reinforcement’s lower elongation capacity. While certain HSSR have a lower tensile strength to yield strength (TS/YS) ratio, this might theoretically reduce the strength at ultimate moment corresponding to the strength at yield moment, reducing the spread of plasticity down the length of the beam once yielding begins. The beams constructed with HSSR in theory, could reduce its deformation capacity because of these factors, which affect negatively the ductility of member. This is especially critical for tension-controlled parts like beams, where tension steel should surpass the yield limit and attain a minimum strain of 0.005 before ACI-318-19 [2] at the ultimate condition. For such beams, steel reinforcement reach yield before concrete reach crushing compressive strength, enabling large increases in deflections and providing ample notice before failure. As a result, beams are regarded as totally ductile when tensile strain reaches a minimum of 0.005. An unanticipated rise in YS may therefore alter a beam’s tension control and cause it to breach the minimal 0.005 strain criterion. While in the beginning with ACI-318M-19 [2], the segment is considered as tension-controlled failure when the yield of steel reaches the limit (≥ε ty + 0.003), where ε ty = f y/E s is net tensile strain of longitudinal tension reinforcement. This expression provides adequate ductility in case of reinforcement other than 420 MPa.
Al-Haddad [3,4] examined the influence of Saudi rebar’s HSSR on the ductility of beam elements. It was established that the ACI-318 provisions limiting the maximum longitudinal reinforcement ratio do not provide enough ductility for seismic and conventional constructions. Mast et al. [5] presented a simplified technique for flexural design of HSSR beams. Flexural members were created utilizing the simplified design procedure based on the conventional Grade 420 MPa. The predicted techniques closely match the measured behavior reported by previous researchers. Sumpter et al. [6] studied the behavior of concrete beams reinforced by HSSR as shear reinforcement. Test results revealed that using HSSR increases the shear capacity and reduction in shear crack width. Zhou et al. [7] predicted an empirical formula to measure the deformability of RC beams. The proposed empirical formula provides flexibility of using HSSR in RC beams, adding rebars in compression or confinement to enhance the deformability. Youcef and Chemrouk [8] recorded a reduction in ductility with HSSR. To recover the desired ductility, it was recommended to use proper compression rebars. Harries et al. [9] studied the flexural crack widths of RC beams with HSSR. The obtained crack widths were found below the limit provisions by ACI. Soltani et al. [10] studied the crack widths in concrete under service load and discovered that they were within accepted limitations and could be anticipated using ACI. According to Shahrooz et al. [11], the strain limitations for HSSR must be altered in order to obtain the curvature ductility implied by the existing usage of Grade 414 reinforcing steel. Furthermore, stresses in steel at service load levels must be reduced to 60% of their YS.
Giduquio et al. [12] investigated the behavior of RC beams reinforced with two different types of HSSR (Grade 100 A1035 and SD685). The obtained results illustrate that design provisions of the ACI can be used to estimate the strength of RC beams reinforced with either types of HSSR. Charif et al. [13] formulated that the beam ductility decreased by the increase in the steel yield stress and violated the condition of tension-control imposed in the design stage. Aldabagh et al. [14] showed that compression rebars have little to no effect on the concrete compression failure of HSSR RC beams. Furthermore, they demonstrated that fiber RC outperforms compression steel in enhancing the bending characteristics of such beams. Duy and Jack [15] evaluated the performance of RC beams with HSSR under reversed cyclic lateral loads modeling earthquake impacts. The results show that strain in longitudinal bars with higher TS/YS ratio obtained more ductility dispersion than beams with lower TS/YS. Xianhua et al. [16] compared the estimated values for RC beams’ ultimate bearing capacities based on various national codes. They showed that the formulas used to calculate the flexural strength of beams reinforced with steel of Grades 400 or 500 MPa can also be used to calculate the flexural strength of beams reinforced with steel of Grades 600 MPa. Lim and Lee [17] used RC beams using HSSR to assess the application of the ACI rules for the design of flexural members. The results demonstrate that the nominal flexural strength of members may be calculated using the nominal strength equation described in the ACI.
There are many sources of deformed rebar in the Middle East, all of whom follow ASTM A 615M [18] requirements. The steel bars are produced with YS greater than or equal to 420 MPa, and ultimate strength greater than or equal to 620 MPa. Also, the TS/YS ratio is greater than or equal 1.25. In the last few years, HSSR has been commercially available in the Middle East. However, the limited applications of HSSR owe to a lack of strength-matching concrete and associated design principles. As a result, there is a significant danger that a beam meant to break in a ductile mode would instead fracture in a brittle mode. The need for clarification of the impact of increased rebar YS on beam behavior must be investigated to fill the gap due to limited research.
The purpose of the present work is to illustrate the effect of HSSR on the flexural behavior of RC beams reinforced with three types of steel with different stress–strain characteristics (i.e., TS/YS ratio). The investigation is performed numerically by using ABAQUS software and verified with Giduquio et al. [12] experimental results. Furthermore, a parametric study is carried out to illustrate the influence of TS/YS ratio on beam behavior with different collapse mechanism (compressive, balance, and tensile).
2 Overview of experimental program
A brief description of the experimental test performed by Giduquio et al. [12] to verify the numerical solution proposed in this study is presented in this section. Three RC beam tested specimens designed by Giduquio et al. [12] to satisfy tension-controlled collapse mechanism were chosen to validate numerical analysis. The details of experimental data of these specimens are illustrated in Tables 1 and 2 and Figures 1–3.
Summarized material prosperities of steel [12]
| Bar type | Bar size | Minimum ε sh (%) | Minimum ε su (%) | ε y | Minimum f y (MPa) | Minimum f u (MPa) |
|---|---|---|---|---|---|---|
| ASTM A706 (GRADE 420) | No. 3 to No. 6 | NA | 14 | 0.24% | 414 | 550 |
| No. 7 to No. 11 | 12 | |||||
| No. 14 and No. 18 | 10 | |||||
| SD685 | All sizes | 1.4 | 10 | 0.38% | 690 | >1.25 f y |
| A1035 | No. 3 to No. 11 | NA | 7 | 0.67% | 690 | 1,035 |
| No. 14 and No. 18 | 6 |
Design parameters of specimens [12]
| Specimen | Specified material properties | ||||
|---|---|---|---|---|---|
| Group | Label | f c , MPa | Bar type | f y , MPa | Top/bottom bars |
| Control | C1 and C2 | 28 | Grade 420 | 414 | Two No. 5 |
| Four No. 9 | |||||
| I-Group | I-S1 and I-S2 | 28 | SD685 | 690 | Two No. 4 |
| Three No. 8 | |||||
| I-A1 and I-A2 | 28 | A1035 | 690 | Two No. 4 | |
| Three No. 8 | |||||
| II-Group | II-S1 and II-S2 | 35 | SD685 | 690 | Two No. 5 |
| Three No. 8 | |||||
| II-A1 and II-A2 | 42 | A1035 | 690 | Two No. 8 | |
| Three No. 8 | |||||
![Figure 1
Stress–strain relationship of steel reinforcement [12]: (a) Grade 420, (b) SD685, and (c) A1035.](/document/doi/10.1515/eng-2022-0365/asset/graphic/j_eng-2022-0365_fig_001.jpg)
Stress–strain relationship of steel reinforcement [12]: (a) Grade 420, (b) SD685, and (c) A1035.
![Figure 2
Specimens’ dimensions and reinforcement layout [12]. (a) Specimen cross section. (b) Specimen longitudinal section.](/document/doi/10.1515/eng-2022-0365/asset/graphic/j_eng-2022-0365_fig_002.jpg)
Specimens’ dimensions and reinforcement layout [12]. (a) Specimen cross section. (b) Specimen longitudinal section.
![Figure 3
Specimens test setup [12].](/document/doi/10.1515/eng-2022-0365/asset/graphic/j_eng-2022-0365_fig_003.jpg)
Specimens test setup [12].
3 Numerical FE modeling
Numerical simulation is carried out in this work utilizing the FE-code ABAQUS software [19]. The concrete’s inelastic behavior is described using the concrete damaged plasticity (CDP) model, which serves as the basis for Abaqus’ concrete plastic damage model. It is based on the formulations of Lee and Fenves [20] and Lubliner et al. [21] which provide a general facility for modeling concrete. Damage calculation may be based on a predetermined standard or on the law of damage variables. The CDP technique by Lee and Fenves [20] and Lubliner et al. [21] modifies the formulation to generate closed-form expressions of the damage variables in terms of the pertinent strains. This method can take into account any concrete constitutive law, whether it is based on specific experiments or empirical formulations like those frequently advised by design standards. The CEB-FIB 2010 [22] proposed model formula was adopted in this study to represent the concrete uniaxial stress–strain relationship. Table 3 lists the CDP parameters that were used in the FE model.
CDP parameters
| Parameter | Value | Description [19] |
|---|---|---|
| ψ | 56 | Dilation angle |
| ε | 0.1 | Eccentricity |
| Fb0/Fc0 | 1.16 | The ratio of initial equibiaxial compressive yield stress to initial uniaxial compressive yield stress |
| K | 0.667 | K c, the ratio of the second stress invariant on the tensile meridian |
| μ | 0.0001 | Viscosity parameter |
The behavior of the tension softening component following cracking is outlined in this work, utilizing Hordijk’s [23] exponential model of tension softening. Reinforcing steel material behavior is characterized depending on the experimental data by Giduquio et al. [12] as elastic and inelastic stress–strain correlations with effects of strain hardening.
3.1 Modeling of geometry
As illustrated in Figures 2 and 3, Giduquio et al. [12] proposed a simply supported RC beam with dimensions of 4,600 mm span, 460 mm section height, and 300 mm section width. The concrete steel plates utilized the (C3D8R) in the FE model, whereas the rebar used the (T3D2) 3D truss linear element, assumed fully embedded in the concrete. Several analytical attempts were made to find the optimum mesh for the numerical model that was chosen, and it was based on matching the load–displacement curve with the experimental verification problem and obtaining the required load. A 50 mm mesh size with aspect ratio of 1 is used in this study as shown in Figure 4.
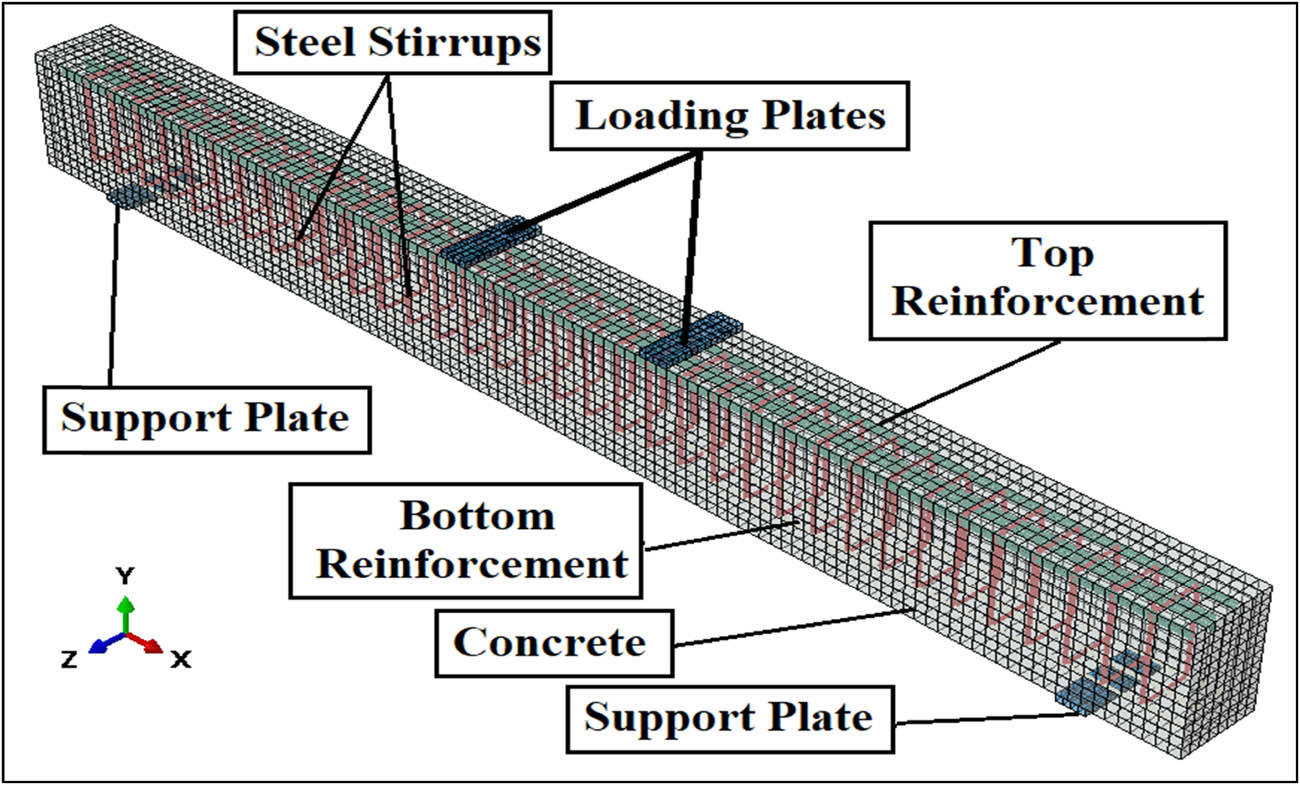
Finite element meshed model.
3.2 Support boundary condition and loads
The RC beam is prevented from moving in the Y direction on one side, and both the X and Y directions on the other, with a uniform force applied to the two plates as shown in Figure 5.

Support boundary conditions and load.
4 Numerical parametric study
The monotonic flexural behavior of RC beam specimens is calculated using 24 simply supported RC beams numerical models in this work. The dimensions of these specimens were (300 mm × 460 mm × 4,100 mm) as illustrated in Figures 2 and 3. Three types of steel with different stress–strain characteristics (i.e., TS/YS ratio) as illustrated in Table 1 and different collapse mechanisms (compressive, balance, and tensile) used as variables are used in this investigations. The collapse mechanism of RC beams is represented by applying load till crushing occurs. The numerical load, deflection, mode of failure, failure concrete strain, and bottom steel strain at failure are recorded. The collapsed conditions are calculated according to ACI-318M-19 [2], the tension-controlled (
The 24 numerical specimens are divided into 7 groups. First group focuses on the validation of our numerical model with experimental results [12]. While groups 2, 3, and 4 investigate the behavior of singly reinforced beams with different YSs. Also, groups 5, 6, and 7 are focused to investigate the effect of compression reinforcement ratio
Numerical parametric study
| Group no. | Specimen ID | Bar type | Specified reinforcements | Collapsed condition | Remarks | |||
|---|---|---|---|---|---|---|---|---|
| Top bars | Bottom bars |
|
|
|||||
| 1 | B1C2 | Grade 420 | Two No. 5 | Four No. 9 |
|
0.155 | Tension-controlled | Validation |
| B2S2 | SD685 | Two No. 4 | Three No. 8 |
|
0.155 | Tension-controlled | Validation | |
| B3A2 | A1035 | Two No. 4 | Three No. 8 |
|
0.155 | Tension-controlled | Validation | |
| 2 | B4G | Grade 420 | N/A | Six No. 9 | 1.2
|
0 | Compression-controlled | |
| B5G | Grade 420 | N/A | Five No. 9 |
|
0 | Balanced | ||
| B6G | Grade 420 | N/A | Four No. 9 |
|
0 | Tension-controlled | ||
| B7G | Grade 420 | N/A | Two No. 5 |
|
0 | Tension-controlled | ||
| 3 | B8S | SD685 | N/A | Four No. 8 | 1.2
|
0 | Compression-controlled | |
| B9S | SD685 | N/A | Three No. 8 |
|
0 | Balanced | ||
| B10S | SD685 | N/A | Two No. 8 |
|
0 | Tension-controlled | ||
| B11S | SD685 | N/A | Two No. 4 |
|
0 | Tension-controlled | ||
| 4 | B12 A | A1035 | N/A | Four No. 8 | 1.2
|
0 | Compression-controlled | |
| B13 A | A1035 | N/A | Three No. 8 |
|
0 | Balanced | ||
| B14 A | A1035 | N/A | Two No. 8 |
|
0 | Tension-controlled | ||
| B15 A | A1035 | N/A | Two No. 4 |
|
0 | Tension-controlled | ||
| 5 | B16G | Grade 420 | Three No. 5 | Four No. 9 |
|
0.25 | ||
| B17G | Grade 420 | Two No. 9 | Four No. 9 |
|
0.5 | |||
| B18G | Grade 420 | Three No. 9 | Four No. 9 |
|
0.75 | |||
| 6 | B19S | SD685 | Three No. 4 | Two No. 8 |
|
0.25 | ||
| B20S | SD685 | Five No. 4 | Two No. 8 |
|
0.5 | |||
| B21S | SD685 | Seven No.4 | Two No. 8 |
|
0.75 | |||
| 7 | B22 A | A1035 | Three No. 4 | Two No. 8 |
|
0.25 | ||
| B23 A | A1035 | Five No. 4 | Two No. 8 |
|
0.5 | |||
| B24 A | A1035 | Seven No. 4 | Two No. 8 |
|
0.75 | |||
5 Numerical results and discussions
5.1 Validation of numerical results
The load against mid span–displacement curves from the FE analysis of experimental specimens [12] in group 1 are presented in Table 5 and Figures 6–8. On the graphs, it appears that the level of ultimate and yield load, in addition to a significant loss of stiffness owing to flexural collapse after exceeding ultimate displacement, are all correctly replicated. The degree of error between FE and the experimental test that is illustrated in Table 5 ranges from 5 to 10%. In other words, the FE analysis adequately validates the flexural behavior of the experimental test with three types of steel with different stress–strain (TS/YS) ratio.
Numerical results of experimental specimens
| Specimen ID | Reinforcement grade | Experimental ultimate load (kN) | Numerical ultimate load (kN) | Error of load % | Experimental ultimate deflection (mm) | Numerical ultimate deflection (mm) | Error of deflection % |
|---|---|---|---|---|---|---|---|
| B1C1 | Grade 420 | 473.6 | 506.7 | 7+ | 68.1 | 64.7 | −5 |
| B2S1 | SD685 | 454.2 | 499.5 | 10+ | 73.7 | 67 | −9 |
| B3A1 | A1035 | 520.6 | 565.9 | 9+ | 68.3 | 61.5 | −10 |

Numerical and experimental load–displacement curve of specimen B1C1.

Numerical and experimental load–displacement curve of specimen B2S2.

Numerical and experimental load–displacement curve of specimen B3A1.
On the other hand, the experimental test result curves is less stiff than FE models results. Micro-cracks that decrease the stiffness of the RC element may induce higher stiffness in FE models. Although FE models do not include them, they are known to exist in real-world concrete [24]. Furthermore, certain unknown environmental conditions might have affected the rigidity of the experimental specimen. Figures 9–11 show damage occurrences at collapse level for both numerical and experimental tests in terms of concrete plastic strain (CPS). It is verified that the FE model accurately depicts the experimental damage distribution in the test members. The numerical results of all specimens are presented in Table 6.

Damage (CPS) for specimen B1C1.

Damage (CPS) for specimen B2S1.

Damage (CPS) for specimen B3A1.
Numerical results
| Group no. | Specimen ID | Bar type | Specified reinforcements | Ultimate load (kN) | Ultimate displacement (mm) | Failure concrete strain (CPS) (mm/mm) | Bottom steel strain at failure (mm/mm) | Yield strain ε y (%) | ||
|---|---|---|---|---|---|---|---|---|---|---|
| Top bars | Bottom bars |
|
||||||||
| 1 | B1C1 | G 420 | 2#5 | 4#9 |
|
506.7 | 64.7 | 0.0226 | 0.0062 | >ε y = 0.0024 |
| B2S1 | SD685 | 2#4 | 3#8 |
|
499.5 | 67.0 | 0.0261 | 0.0051 | >ε y = 0.0038 | |
| B3A1 | A1035 | 2#4 | 3#8 |
|
565.9 | 61.5 | 0.0199 | 0.0041 | <ε y = 0.0067 | |
| 2 | B4G | G 420 | N/A | 6#9 | 1.2 ρ b | 492.3 | 18.4 | 0.0045 | 0.0012 | <ε y = 0.0024 |
| B5G | G 420 | N/A | 5#9 | ρ b | 482.6 | 22.2 | 0.0049 | 0.0021 | ||
| B6G | G 420 | N/A | 4#9 |
|
435.9 | 72.9 | 0.0260 | 0.0083 | >ε y = 0.0024 | |
| B7G | G 420 | N/A | 2#5 |
|
384.6 | 79.0 | 0.0251 | 0.0135 | ||
| 3 | B8S | SD685 | N/A | 4#8 | 1.2 ρ b | 500.5 | 28.5 | 0.0054 | 0.0031 | <ε y = 0.0038 |
| B9S | SD685 | N/A | 3#8 | ρ b | 419.8 | 25.5 | 0.0053 | 0.0036 | ||
| B10S | SD685 | N/A | 2#8 |
|
389.9 | 65.1 | 0.0209 | 0.0069 | >ε y = 0.0038 | |
| B11S | SD685 | N/A | 2#4 |
|
304.9 | 47.1 | 0.0077 | 0.0072 | ||
| 4 | B12A | A1035 | N/A | 4#8 | 1.2 ρ b | 451.4 | 46.2 | 0.0132 | 0.0029 | <ε y = 0.0067 |
| B13A | A1035 | N/A | 3#8 | ρ b | 409.2 | 35.5 | 0.0081 | 0.0028 | ||
| B14A | A1035 | N/A | 2#8 |
|
386.5 | 45.5 | 0.0093 | 0.0072 | >ε y = 0.0067 | |
| B15A | A1035 | N/A | 2#4 |
|
341.0 | 56.3 | 0.0128 | 0.0096 | ||
| 5 | B16G | G 420 | 3#5 | 4#9 |
|
574.4 | 33.0 | 0.0085 | 0.0067 | >ε y = 0.0024 |
| B17G | G 420 | 2#9 | 4#9 |
|
615.1 | 25.3 | 0.0045 | 0.0038 | ||
| B18G | G 420 | 3#9 | 4#9 |
|
656.4 | 25.1 | 0.0051 | 0.0043 | ||
| 6 | B19S | SD685 | 3#4 | 3#8 |
|
533.3 | 38.9 | 0.0063 | 0.0031 | <ε y = 0.0038 |
| B20S | SD685 | 5#4 | 3#8 |
|
508.7 | 30.7 | 0.0046 | 0.0034 | ||
| B21S | SD685 | 7#4 | 3#8 |
|
553.8 | 27.5 | 0.0053 | 0.0035 | ||
| 7 | B22A | A1035 | 3#4 | 3#8 |
|
584.5 | 73.1 | 0.0204 | 0.0061 | <ε y = 0.0067 |
| B23A | A1035 | 5#4 | 3#8 |
|
604.6 | 41.6 | 0.0064 | 0.0042 | ||
| B24A | A1035 | 7#4 | 3#8 |
|
363.8 | 35.2 | 0.0055 | 0.0042 | ||
5.2 Load and displacement
Figures 12–17 show the load against mid span–displacement curves from the FE analysis of all specimens in groups 2–7. For single reinforced specimens in groups 2, 3, and 4 as illustrated in Figures 12–14 and the results in Table 6.

Load–displacement curve of Group 2.

Load–displacement curve of Group 3.

Load–displacement curve of Group 4.
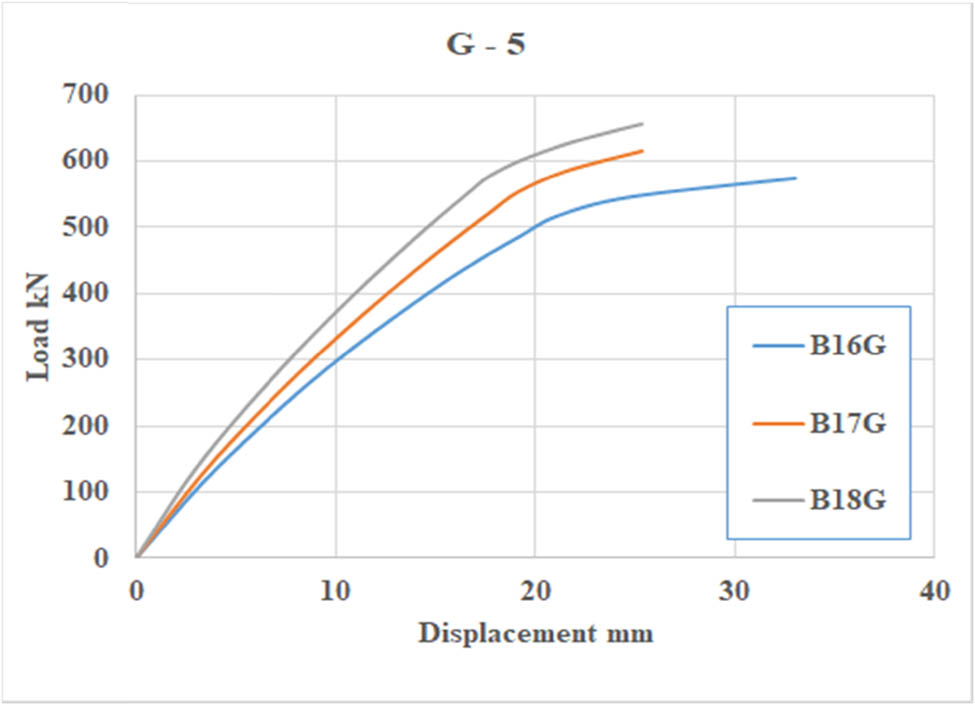
Load–displacement curve of Group 5.

Load–displacement curve of Group 6.

Load–displacement curve of Group 7.
Specimens with

Load capacity for specimens with single reinforcement.

Ultimate displacement for specimens with single reinforcement.

Load capacity for specimens with double reinforcement.

Ultimate displacement for specimens with double reinforcement.
5.3 Failure concrete strain and flexural (bottom) steel strain at failure
As shown in Table 6, the FE findings of failure concrete strain at extreme fiber in the compression zone at mid span demonstrate that the concrete strain is greater than 0.003 for all beam specimens. This finding agrees with the provisions of ACI-318-19 [2]. The strain of flexural rebar at failure for single reinforced specimens in groups 2, 3, and 4 is less than the yield strain for higher reinforcement ratios (1.2
While specimens in Groups 6 and 7 (reinforcement Grade SD685 and A1035, respectively) is less than yield strain. As a result, it can be concluded that as the TS/YS ratio decreases, so does the tensile stress and strain increase of flexural rebar, resulting in more ductile behavior of the beam.
5.4 Visualization of damage (CPS)
From Figures 22–24 for specimens in Groups 2, 3, and 4, it can be seen that at the stage of final collapse, CPS for specimens with higher reinforcement ratios (1.2

Damage (plastic strain) for Group 2.

Damage (plastic strain) for Group 3.

Damage (plastic strain) for Group 4.
As shown in Figures 25–27 for specimens in Groups 5–7, higher CPS can be seen in tension zone. Because compression reinforcement increases the capacity, the destruction process in the area of tensile zone will be more visible for varied TS/YS ratios. Also, even after the concrete failed, these bars were able to withstand a certain amount of load, preventing the members from completely failing [26,27].

Damage (plastic strain) for Group 5.

Damage (plastic strain) for Group 6.

Damage (plastic strain) for Group 7.
5.5 Effect of varied TS/YS ratios on the behavior of beam specimens
For specimens reinforced with 1.2

Load–displacement curve for specimens with 1.2

Load–displacement curve for specimens with
For specimens reinforced with

Load–displacement curve for specimens with ρ max.

Load–displacement curve for specimens with ρ min.
Figures 32–34 illustrate that the use of compression reinforcement with different percentages increases flexural strength (load carrying capacity) for the three types of reinforcement.

Load–displacement curve for specimens with ρ top /ρ bot = 0.25.

Load–displacement curve for specimens with ρ top /ρ bot = 0.5.

Load–displacement curve for specimens with ρ top /ρ bot = 0.75.
6 Conclusion
An effort has been made in the current work to illustrate the effect of HSSR on the flexural behavior of RC beams reinforced with three types of steel with different stress–strain characteristics (i.e., TS/YS ratios). This investigation was performed numerically using ABAQUS software. The following are the important concluding remarks for this work:
(1) The FE analysis adequately validates the flexural behavior of the experimental test [10] with three types of HSSR including different stress–strain (TS/YS) ratios.
(2) The ductile failure behavior of single reinforced specimens with
(3) The use of compression reinforcement increases load capacity and decreases the displacement.
(4) Brittle failure of beams occurs as the yield stress of compression reinforcement increases.
(5) The FE findings of failure concrete strain at extreme fiber in the compression zone at mid span show that the concrete strain is more than 0.003 for all beam specimens. This conclusion agrees with the provisions of ACI-318-19.
(6) Similar to the behavior seen for beams with varying stress–strain (TS/YS) ratios, as the tensile reinforcement ratio increases, so does the concrete compressive stress and strain at the compression zone, resulting in brittle failure of the beam.
(7) It may be deduced that when the TS/YS ratio reduces, the tensile stress and strain of flexural rebar increases, resulting in the beam becoming more ductile. Previous findings by Youcef and Chemrouk [8], Charif et al. [13], and Duy and Jack [15] support this.
(8) Extending the technique given to model the complex RC framework performance with HSSR under cyclic stress can create models that are suitable for modeling this complex behavior.
-
Conflict of interest: Authors state no conflict of interest.
References
[1] ASTM A706/A706M. Standard Specification for Deformed and Plain Low-Alloy Steel Bars for Concrete Reinforcement; 2016.Search in Google Scholar
[2] ACI Committee 318. Building code requirements for structural concrete (ACI 318-14) and commentary. Farmington Hills, MI: American Concrete Institute; 2019. p. 391.Search in Google Scholar
[3] Al-Haddad M. Curvature ductility of RC beams under low and high strain rates. ACI Struct J. 1995;92(5):526–34.10.14359/903Search in Google Scholar
[4] Al-Haddad M. Permissible maximum ratio of Saudi reinforcing bars for design of RC beamsFinal research report No 24/424. King Saud University; 2006. p. 29.Search in Google Scholar
[5] Mast RF, Dawood M, Rizkalla SH, Zia P. Flexural strength design of concrete beams reinforced with high strength steel bars. ACI Struct J. 2008 Sept–Oct;105(5):570–77.10.14359/19940Search in Google Scholar
[6] Sumpter MS, Rizkalla SH, Zia P. Behavior of high-performance steel as shear reinforcement for concrete beams. ACI Struct J. ASCE. 2009 Mar–Apr;106(2):171–7.10.14359/56355Search in Google Scholar
[7] Zhou KJH, Ho JCM, Su RKL. Flexural strength and deformability design of reinforced concrete beams. The twelfth east asia-pacific conference on structural engineering and construction. Proc Eng. 2011;14:1399–407.10.1016/j.proeng.2011.07.176Search in Google Scholar
[8] Youcef SIY, Chemrouk M. Curvature ductility factor of rectangular sections reinforced concrete beams. World academy of science. Eng Technol. 2012;6:11–20.Search in Google Scholar
[9] Harries KA, Shahrooz BM, Soltani A. Flexural crack widths in concrete girders with high-strength reinforcement. J Bridge EngASCE. 2012 Sept–Oct;17(5):804–12.10.1061/(ASCE)BE.1943-5592.0000306Search in Google Scholar
[10] Soltani A, Harries KA, Shahrooz BM. Crack opening behavior of concrete reinforced with high strength reinforcing steel. Int J Concr Struct Mater. 2013;7(4):253–64.10.1007/s40069-013-0054-zSearch in Google Scholar
[11] Shahrooz BM, Reis JM, Wells EL, Miller RA, Harries KA, Russell HG. Flexural members with high-strength reinforcement: Behavior and code implications. J Bridge Eng. 2014;19(5):04014003.10.1061/(ASCE)BE.1943-5592.0000571Search in Google Scholar
[12] Giduquio MB, Cheng MY, Wibowo LS. High-strength flexural reinforcement in reinforced concrete flexural members under monotonic loading. ACI Struct J. 2015;112(6):793–804.10.14359/51688057Search in Google Scholar
[13] Charif A, Shehab MM, Iqbal Khan M. Flexural behavior of beams reinforced with steel bars exceeding the nominal yield strength. Lat Am J Solids Struct. 2016;13(5):945–63.10.1590/1679-78251683Search in Google Scholar
[14] Aldabagh S, Abed F, Yehia S. Effect of types of concrete on flexural behavior of beams reinforced with high-strength steel bars. ACI Struct J. 2018;115(2):351–64.10.14359/51701105Search in Google Scholar
[15] Duy VT, Jack PM. Special moment frames with high-strength reinforcement- part 1: beams. ACI Struct J. 2020 Mar 1;117(2):239–53.10.14359/51721318Search in Google Scholar
[16] Xianhua Y, Yulong Z, Junfeng G, Lielie L, Haichao L, Ruicong H, et al. Experimental study and reliability analysis of flexural capacity of RC beams reinforced with 600 MPa grade steel. Adv Civil Eng. 2020(4):1–26.10.1155/2020/8899630Search in Google Scholar
[17] Lim M, Lee C. Flexural performance of reinforced concrete members with steel bars. Appl Sci. 2021 Jan;11(10):4512.10.3390/app11104512Search in Google Scholar
[18] ASTM A615/A615M-18e1. Standard specification for deformed and plain carbon-steel bars for concrete reinforcement; 2020.Search in Google Scholar
[19] Hibbitt, Karlsson, Sorensen Inc. ABAQUS theory manual, user manual and example manual. Version 6.8, Providence, RI; 2008.Search in Google Scholar
[20] Lee J, Fenves GL. Plastic-damage model for cyclic loading of concrete structures. J Eng Mech. 1998;124(8):892.10.1061/(ASCE)0733-9399(1998)124:8(892)Search in Google Scholar
[21] Lubliner J, Oliver J, Oller S, Oñate E. A plastic damage model for concrete. Int J Solids Structure. 1989;25(3):299–326.10.1016/0020-7683(89)90050-4Search in Google Scholar
[22] CEB-FIB. The fib model code for concrete structures 2010. Case Postale 88. Switzerland: CH-1015 Lausanne; 2010.Search in Google Scholar
[23] Hordijk DA. Tensile and tensile fatigue behaviour of concrete – experiments, modelling and analyses. Heron. 1992;37(1):1–79.Search in Google Scholar
[24] Mohamed AR, Shoukry MS, Saeed JM. Prediction of the behavior of RC deep beams with web openings using the finite element method. Alex Eng J. 2014;53:329–39.10.1016/j.aej.2014.03.001Search in Google Scholar
[25] Thusoo S, Obara T, Kono S, Miyahara K. Design models for steel encased high-strength precast concrete piles under axial-flexural loads. Eng Structure. 2021;228:111465.10.1016/j.engstruct.2020.111465Search in Google Scholar
[26] Rangan BV, Sarker PK. Bending stiffness of concrete flexural members reinforced with high strength steel. ACI Specif Publ. 2001;203:143–56.Search in Google Scholar
[27] El-Hacha R, El-Agroudy H, Rizkalla SH Bond characteristic of high-strength steel reinforcement. ACI Struct J. 2006; 103:771–81.10.14359/18227Search in Google Scholar
© 2022 the author(s), published by De Gruyter
This work is licensed under the Creative Commons Attribution 4.0 International License.
Articles in the same Issue
- Regular Articles
- Performance of a horizontal well in a bounded anisotropic reservoir: Part I: Mathematical analysis
- Key competences for Transport 4.0 – Educators’ and Practitioners’ opinions
- COVID-19 lockdown impact on CERN seismic station ambient noise levels
- Constraint evaluation and effects on selected fracture parameters for single-edge notched beam under four-point bending
- Minimizing form errors in additive manufacturing with part build orientation: An optimization method for continuous solution spaces
- The method of selecting adaptive devices for the needs of drivers with disabilities
- Control logic algorithm to create gaps for mixed traffic: A comprehensive evaluation
- Numerical prediction of cavitation phenomena on marine vessel: Effect of the water environment profile on the propulsion performance
- Boundary element analysis of rotating functionally graded anisotropic fiber-reinforced magneto-thermoelastic composites
- Effect of heat-treatment processes and high temperature variation of acid-chloride media on the corrosion resistance of B265 (Ti–6Al–4V) titanium alloy in acid-chloride solution
- Influence of selected physical parameters on vibroinsulation of base-exited vibratory conveyors
- System and eco-material design based on slow-release ferrate(vi) combined with ultrasound for ballast water treatment
- Experimental investigations on transmission of whole body vibration to the wheelchair user's body
- Determination of accident scenarios via freely available accident databases
- Elastic–plastic analysis of the plane strain under combined thermal and pressure loads with a new technique in the finite element method
- Design and development of the application monitoring the use of server resources for server maintenance
- The LBC-3 lightweight encryption algorithm
- Impact of the COVID-19 pandemic on road traffic accident forecasting in Poland and Slovakia
- Development and implementation of disaster recovery plan in stock exchange industry in Indonesia
- Pre-determination of prediction of yield-line pattern of slabs using Voronoi diagrams
- Urban air mobility and flying cars: Overview, examples, prospects, drawbacks, and solutions
- Stadiums based on curvilinear geometry: Approximation of the ellipsoid offset surface
- Driftwood blocking sensitivity on sluice gate flow
- Solar PV power forecasting at Yarmouk University using machine learning techniques
- 3D FE modeling of cable-stayed bridge according to ICE code
- Review Articles
- Partial discharge calibrator of a cavity inside high-voltage insulator
- Health issues using 5G frequencies from an engineering perspective: Current review
- Modern structures of military logistic bridges
- Retraction
- Retraction note: COVID-19 lockdown impact on CERN seismic station ambient noise levels
- Special Issue: Trends in Logistics and Production for the 21st Century - Part II
- Solving transportation externalities, economic approaches, and their risks
- Demand forecast for parking spaces and parking areas in Olomouc
- Rescue of persons in traffic accidents on roads
- Special Issue: ICRTEEC - 2021 - Part II
- Switching transient analysis for low voltage distribution cable
- Frequency amelioration of an interconnected microgrid system
- Wireless power transfer topology analysis for inkjet-printed coil
- Analysis and control strategy of standalone PV system with various reference frames
- Special Issue: AESMT
- Study of emitted gases from incinerator of Al-Sadr hospital in Najaf city
- Experimentally investigating comparison between the behavior of fibrous concrete slabs with steel stiffeners and reinforced concrete slabs under dynamic–static loads
- ANN-based model to predict groundwater salinity: A case study of West Najaf–Kerbala region
- Future short-term estimation of flowrate of the Euphrates river catchment located in Al-Najaf Governorate, Iraq through using weather data and statistical downscaling model
- Utilization of ANN technique to estimate the discharge coefficient for trapezoidal weir-gate
- Experimental study to enhance the productivity of single-slope single-basin solar still
- An empirical formula development to predict suspended sediment load for Khour Al-Zubair port, South of Iraq
- A model for variation with time of flexiblepavement temperature
- Analytical and numerical investigation of free vibration for stepped beam with different materials
- Identifying the reasons for the prolongation of school construction projects in Najaf
- Spatial mixture modeling for analyzing a rainfall pattern: A case study in Ireland
- Flow parameters effect on water hammer stability in hydraulic system by using state-space method
- Experimental study of the behaviour and failure modes of tapered castellated steel beams
- Water hammer phenomenon in pumping stations: A stability investigation based on root locus
- Mechanical properties and freeze-thaw resistance of lightweight aggregate concrete using artificial clay aggregate
- Compatibility between delay functions and highway capacity manual on Iraqi highways
- The effect of expanded polystyrene beads (EPS) on the physical and mechanical properties of aerated concrete
- The effect of cutoff angle on the head pressure underneath dams constructed on soils having rectangular void
- An experimental study on vibration isolation by open and in-filled trenches
- Designing a 3D virtual test platform for evaluating prosthetic knee joint performance during the walking cycle
- Special Issue: AESMT-2 - Part I
- Optimization process of resistance spot welding for high-strength low-alloy steel using Taguchi method
- Cyclic performance of moment connections with reduced beam sections using different cut-flange profiles
- Time overruns in the construction projects in Iraq: Case study on investigating and analyzing the root causes
- Contribution of lift-to-drag ratio on power coefficient of HAWT blade for different cross-sections
- Geotechnical correlations of soil properties in Hilla City – Iraq
- Improve the performance of solar thermal collectors by varying the concentration and nanoparticles diameter of silicon dioxide
- Enhancement of evaporative cooling system in a green-house by geothermal energy
- Destructive and nondestructive tests formulation for concrete containing polyolefin fibers
- Quantify distribution of topsoil erodibility factor for watersheds that feed the Al-Shewicha trough – Iraq using GIS
- Seamless geospatial data methodology for topographic map: A case study on Baghdad
- Mechanical properties investigation of composite FGM fabricated from Al/Zn
- Causes of change orders in the cycle of construction project: A case study in Al-Najaf province
- Optimum hydraulic investigation of pipe aqueduct by MATLAB software and Newton–Raphson method
- Numerical analysis of high-strength reinforcing steel with conventional strength in reinforced concrete beams under monotonic loading
- Deriving rainfall intensity–duration–frequency (IDF) curves and testing the best distribution using EasyFit software 5.5 for Kut city, Iraq
- Designing of a dual-functional XOR block in QCA technology
- Producing low-cost self-consolidation concrete using sustainable material
- Performance of the anaerobic baffled reactor for primary treatment of rural domestic wastewater in Iraq
- Enhancement isolation antenna to multi-port for wireless communication
- A comparative study of different coagulants used in treatment of turbid water
- Field tests of grouted ground anchors in the sandy soil of Najaf, Iraq
- New methodology to reduce power by using smart street lighting system
- Optimization of the synergistic effect of micro silica and fly ash on the behavior of concrete using response surface method
- Ergodic capacity of correlated multiple-input–multiple-output channel with impact of transmitter impairments
- Numerical studies of the simultaneous development of forced convective laminar flow with heat transfer inside a microtube at a uniform temperature
- Enhancement of heat transfer from solar thermal collector using nanofluid
- Improvement of permeable asphalt pavement by adding crumb rubber waste
- Study the effect of adding zirconia particles to nickel–phosphorus electroless coatings as product innovation on stainless steel substrate
- Waste aggregate concrete properties using waste tiles as coarse aggregate and modified with PC superplasticizer
- CuO–Cu/water hybrid nonofluid potentials in impingement jet
- Satellite vibration effects on communication quality of OISN system
- Special Issue: Annual Engineering and Vocational Education Conference - Part III
- Mechanical and thermal properties of recycled high-density polyethylene/bamboo with different fiber loadings
- Special Issue: Advanced Energy Storage
- Cu-foil modification for anode-free lithium-ion battery from electronic cable waste
- Review of various sulfide electrolyte types for solid-state lithium-ion batteries
- Optimization type of filler on electrochemical and thermal properties of gel polymer electrolytes membranes for safety lithium-ion batteries
- Pr-doped BiFeO3 thin films growth on quartz using chemical solution deposition
- An environmentally friendly hydrometallurgy process for the recovery and reuse of metals from spent lithium-ion batteries, using organic acid
- Production of nickel-rich LiNi0.89Co0.08Al0.03O2 cathode material for high capacity NCA/graphite secondary battery fabrication
- Special Issue: Sustainable Materials Production and Processes
- Corrosion polarization and passivation behavior of selected stainless steel alloys and Ti6Al4V titanium in elevated temperature acid-chloride electrolytes
- Special Issue: Modern Scientific Problems in Civil Engineering - Part II
- The modelling of railway subgrade strengthening foundation on weak soils
- Special Issue: Automation in Finland 2021 - Part II
- Manufacturing operations as services by robots with skills
- Foundations and case studies on the scalable intelligence in AIoT domains
- Safety risk sources of autonomous mobile machines
- Special Issue: 49th KKBN - Part I
- Residual magnetic field as a source of information about steel wire rope technical condition
- Monitoring the boundary of an adhesive coating to a steel substrate with an ultrasonic Rayleigh wave
- Detection of early stage of ductile and fatigue damage presented in Inconel 718 alloy using instrumented indentation technique
- Identification and characterization of the grinding burns by eddy current method
- Special Issue: ICIMECE 2020 - Part II
- Selection of MR damper model suitable for SMC applied to semi-active suspension system by using similarity measures