Field tests of grouted ground anchors in the sandy soil of Najaf, Iraq
-
Nadher H. Al-Baghdadi
 and
Balqees A. Ahmed
and
Balqees A. Ahmed

Abstract
This article presents test results documentation for four grouted ground anchors embedded in sandy soil. Three anchors were trial, while one was a working anchor. One trial anchor is instrumented with eight resistance-type strain gauges glued on the corrugated pipe and embedded within the grouted body. An acceptance test was made for all anchors to determine the working load. Acceptance criteria suggested by the Post-Tensioning Institute were applied, and the working anchor did not pass the creep criterion, so it was taken out of service. The strain measurements indicated that the compression stresses were generated along the free length, while the tension stresses were generated along the bonded length. The transition point, which is the point with zero axial stress within the grouted body, was located at a distance of 10–12% of the bonded length, measured from the proximal end of the bonded length. The skin friction distribution along the grouted body was nonuniform, and it had a peak at the transition point. The maximum measured value of the skin friction is almost compatible with the estimated one by Fujita’s formula. The skin friction developed along the free length indicates a significant contribution of the free length to the pullout capacity.
1 Introduction
Grouted ground anchors are structural members that aim to transfer the applied tension load to the soil layers beneath or behind the structure. Grouted anchors are widely used in retaining structures, dams, and underground structures. The ultimate uplift capacity of the grouted anchor is affected by many factors, like ground condition, the properties of anchor material, installation process, and the anchor type.
One of the most reliable methods of estimating the ultimate pullout capacity of the grouted anchor is the field test [1]. For the previous reason, the field test plays a significant role in the design process of the grouted ground anchors.
Few instrumented field tests are available in the literature, most of these tests are for grouted anchors installed in clayey soils, while a limited number of tests are related to sandy soils [2,3].
The present research work documents four field tests of grouted ground anchors, three of which were trial anchors and one of these anchors was a working anchor. One of the three trial anchors was instrumented with eight strength-type strain gauges along the anchor length. The load transfer mechanism was observed through strain measurements along the grouted body in both free and bonded lengths.
The present research work aims to contribute to the literature on grouted ground anchor field tests in granular soils and also to make a better understanding of the load transfer mechanism of grouted anchors.
2 Subsoil conditions
The construction site is located in An-Najaf city in the middle of Iraq, 160 km south of Baghdad. An-Najaf region is a plateau with 60–55 m attitude, with gradual, and flat slopes from all directions [4]. Tertiary and quarterly deposits form the layers of the An-Najaf region [5].
Generally, An-Najaf soil consists of 50–85% sand, clayey, and silty clayey thin layers often exist at different depths. Dense, very dense, and cemented sand form the dominant soil types within this region [6].
Figure 1 shows the soil profile of the test site and the corrected values of standard penetration test (SPT) along with depth. It is noticed that the SPT values are more than 50 blows for most layers within the soil profile. The water table is located 1 m below the ground surface. Before tests were conducted, the water table had been lowered to 9 m below the ground surface. The angle of internal friction and cohesion of the soil layers are also listed in Figure 1.

Soil profile and corrected SPT (N) values for the test site.
3 Ground anchors properties and installation
Permanent grouted ground anchors were used to resist the uplift pressure subjected to the newly constructed underpass. Four anchors were tested, three of these anchors were trial anchors (pre-design anchors), while one of these anchors was a working anchor. The trial anchors were installed at natural ground level, while the working anchor was installed 7 m below the ground surface at an excavation level.
All ground anchors’ tendons consist of four strands with seven wires each. The total area of the used strand is 560 mm2, and the average ultimate strength is 1,150 MPa.
Boreholes were bored using a hollow core continuous flight auger. Cement grout with w/c = 0.45 [7] was used during boring as a boring liquid to stabilize the borehole from collapse. All the boreholes’ diameters were 0.15 m. The grouting pressure used in both grouting phases (the drilling phase and the grouting phase) was 10 kPa.
Double-side corrugated pipes with 7.5 cm outer diameter and 6.2 cm inner diameter have been used as corrosion protection [1,7]. Corrugation in pipes creates an interlocking effect between grout and pipe, which helps for load transfer between both the outer and inner sides of the grout. Figure 2 shows the corrugated pipe. Spacers and centralizers have been used inside the corrugated pipe to make an interlock between the strand and grout. Outside the corrugated pipe, only centralizers have been used to center the anchor inside the borehole (Figure 3). Plastic pipes were used to sheathe the strand along the free length; adhesive tape was used to seal the end of the pipe at the beginning of the bonded length; and also, grease was injected into the plastic sheathing pipe for two reasons: (i) to reduce the friction between the strand and the pipe, and (ii) for corrosion protection. Grout injection pipes were used both inside and outside the corrugated sheath, with a diameter of 2.5 cm. The grout injection process has been made after the insertion of an anchor inside the already grout-filled borehole to fill the inside of the corrugated pipe and also to ensure that there are no air bubbles or boring residual materials.

Corrugated pipe.

Grouted ground anchor section.
The lengths of ground anchors and bonded lengths are listed in Table 1.
Total length and bonded length of grouted anchors
| Anchor no. | Status | Total length (m) | Bonded length (m) | Design load (ton) | Max test load (ton) |
|---|---|---|---|---|---|
| 1 | Trial | 10.6 | 7 | 30 | 40 |
| 2 | Trial | 12.9 | 7 | 30 | 40 |
| 3 | Trial | 13.5 | 7.5 | 30 | 40 |
| 309 | Working | 13.5 | 7.5 | 52 | 62.4 |
4 Ground anchors instrumentation
For ground anchor no. 1, eight resistance-type strain gauges were used to measure the strain in the grouted body. Strain gauges were installed on the outer side of the corrugated pipe, after treating the sticking zone with epoxy, Figure 4. The spacings of strain gauges measured from the ground surface are 1.5, 3.6, 5.5, 7, 8, 9, and 10 m, as shown in Figure 5. Concrete-type strain gauges with model PL-60-11, manufactured by Tokyo Measuring Instruments Laboratory Co., have been used. The reason for installing the strain gauges on the corrugated pipe instead of installing them on the steel strand is to measure the strain inside the grouted body even if debonding has occurred between the strand and the grout. As stated previously in the location of the strain gauges, two of the strain gauges are installed in the free-length part, and one of them is installed at the point of intersection between the free length and the bonded length. Most of the installed strain gauges have been damaged during anchor installation for the rest of the anchors.
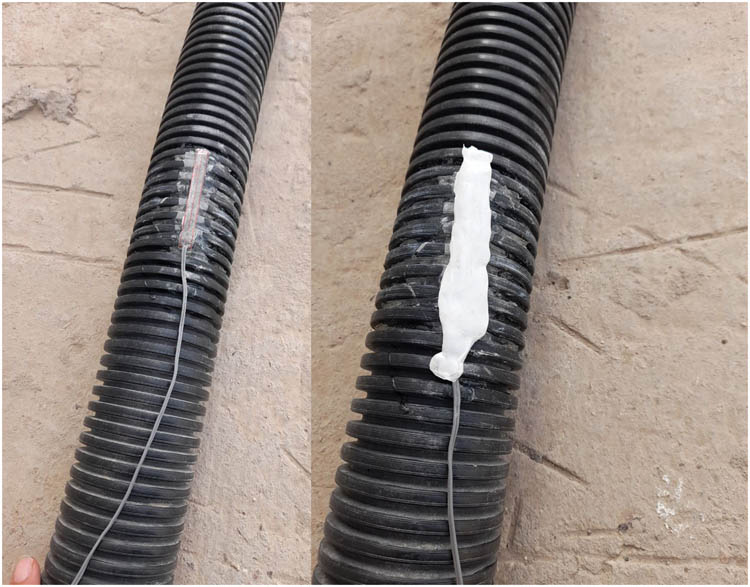
Strain gauge glued on the outside of corrugated pipe.

Strain gauges location along the anchor length for anchor 1.
5 Pullout test procedure
A “performance test” was carried out, according to ref. [7], for all tested anchors. A multistrand hydraulic jack was used. A analog dial gauge with 0.01 mm accuracy was used to measure the tendon displacements at the head of the anchor. Figure 6 shows the test frame and pullout jack. The test procedure consists of six loading–unloading cycles, and each cycle starts and finishes with an “alignment load,” which is typically equal to 5% of the design load. Every loading cycle consists of several loading steps with displacement recording. Load-holding time at each loading step is not more than 1 min until the recorded displacement becomes constant. At the end of loading, cycle displacement is recorded with 10 min of load-holding time, or until the recorded displacement becomes constant, this part of the test is called the creep test. The maximum applied load at the last sixth cycle of the test is equal to 1.33 times the design load. The design load has been chosen as 30 ton for the first three trial anchors and 52 ton for working anchor no. 309, as listed in Table 1. The design load of each tested anchor was chosen according to the chart suggested by Ostermayer and Scheele [8] for cohesionless soils (Figure 7). The factor of safety is taken as equal to 2 according to ref. [7].

Testing frame and pullout jack.
![Figure 7
Carrying capacity of anchors in non-cohesive soils, after [8].](/document/doi/10.1515/eng-2022-0359/asset/graphic/j_eng-2022-0359_fig_007.jpg)
Carrying capacity of anchors in non-cohesive soils, after [8].
6 Tests results
6.1 Load–displacement
According to ref. [7], load–displacement charts are for all four tested ground anchors presented in Figures 8–11.

Load–displacement curve for anchor 1.
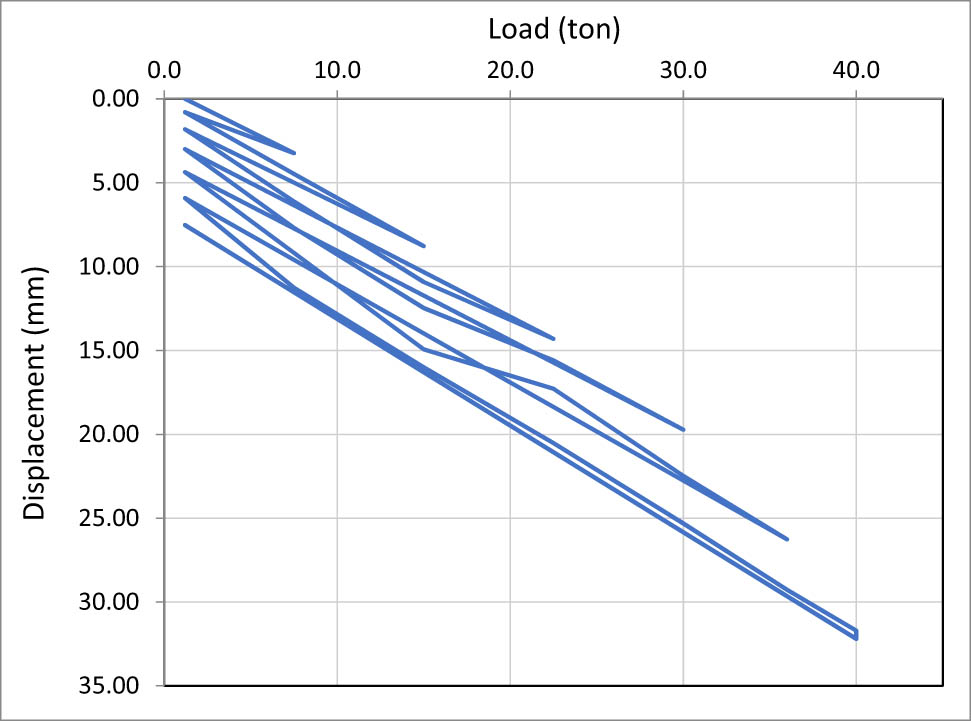
Load–displacement curve for anchor 2.

Load–displacement curve for anchor 3.

Load–displacement curve for anchor 309.
Figures 12–15 present the measured elastic movements of the anchor’s head vs two elastic movements; the lower bound is calculated according to 80% of the actual free length, and the upper bound is calculated according to 100% of the actual free length plus half of the bonded length, for the tested anchors 1, 2, 3, and 309, respectively.

Load–elastic and plastic displacements for anchor 1.

Load–elastic and plastic displacements for anchor 2.

Load–elastic and plastic displacements for anchor 3.

Load–elastic and plastic displacements for anchor 309.
The measured elastic movement is calculated by subtracting the residual movement (plastic) from the total movement for each loading cycle. According to the following equation, the theoretical elastic movement is calculated based on the theory of elasticity using the actual free length:
where
The creep part of the performance test, which is 10 min displacement recording while holding the load of the last loading cycle constant, is presented in Figure 16 of all tested anchors, Figure 16 also shows the creep part of anchor 309 for the third, fourth, and fifth loading cycle, because the measured displacement keeps increasing until holding time reaches 10 min.

Creep part of the performance test for anchors 1, 2, 3, and 309 and for the third and fourth loading cycles.
6.2 Strain measurement along with anchor 1
Strain measurements along the grouted body of anchor 1 are presented in Figure 17. The strains are measured at the end of each loading cycle according to the strain gauge locations, as presented in Figure 5. The method of strain-dependent modulus, suggested by Fellenius [9], has been used to convert the measured strains to stresses. This method assumes that the secant modulus of elasticity of the pile embedded in the soil is a second-order polynomial equation, as shown in equation (2). The parameters A and B of this equation could be determined by plotting the tangent modulus of elasticity of each strain measurement point along with the pile vs the measured strain for each load increment as shown in Figure 18, where A represents the slope of the best fitting line and B represents the ordinate intercept. The tangent modulus, plotted in Figure 18, is calculated by equation (3), where the stress value is calculated by the quotient of an applied force divided by the sum of the area of the grout, the equivalent area of the tendon for the bonded length, and only the area of the grout for the free length, as presented in equations (4) and (5). The values of parameters A and B are presented in Table 2.

Measured strains along the grouted body of anchor 1, starting from the ground surface.

Tangent modulus diagram.
Secant modulus of elasticity parameters
| Parameter | Value |
|---|---|
| A | –0.001278285 |
| B | 5 |
Stresses along the grouted body of the ground anchor, of every loading step, are calculated and presented in Figure 19. Using areas in equations (4) and (5), the forces in the grouted body have been calculated and presented in Figures 20 and 21.

Stresses along the grouted body of anchor 1, starting from the ground surface.

Location of the transition point as a percent of the bonded length.

Forces along the grouted body of anchor 1, starting from the ground surface.
Skin friction stress along the ground anchor has been obtained by using equation (6) and presented in Figure 22 with a maximum value of 173.6 kPa at an applied load of 40 ton, 392.7 kN.
where σ skin represents the skin friction stress, F g represents the force of the grouted body, ⅰ is the number of loading steps, L is the distance from the anchor head to the measurement point, and ј is the number of measurement points starting from the anchor head. The diameter of the anchor has been assumed to be the same diameter as the borehole, i.e., no enlargement has occurred due to grout injection. Figure 23 shows the mobilization of skin friction along anchor depth vs load application.

Skin friction stress along anchor length.

Mobilized skin friction at mid-distance between the measurement points.
7 Discussion
7.1 Evaluation of load–displacement results
According to the Post-Tensioning Institute [7], two acceptance criteria have been used to evaluate the test results of ground anchors. These criteria are apparent free length and creep movement.
Apparent free length criterion:
The apparent free length is calculated based on the measured elastic movement of the anchor head by using equation (1). The measured elastic movement of the last loading cycle is substituted in the variable
The calculated apparent free length should be greater than 80% of the actual free length measured from the stressing point. The maximum limit of the calculated apparent free length is the total stressing length plus one-half of the bonded length. The lower limit prevents load transfer through friction between the strand and sheathing tube, making the free length transfer the load beyond the potential slip surface. The upper limit of the apparent free length prevents the debonding between the strand and the grout for more than half of the bonded length.
All the tested anchors have passed through these two conditions, as shown in Figures 12–15.
Creep movement criteria:
Creep movement shall not exceed 1 mm during the 10-min load-holding time; if not, the load-holding time will be extended to 60 min, and the creep movement shall not exceed 2 mm.
Figure 16 shows the creep movement of all the tested anchors on a semi-log scale. The creep movement for the three trial anchors does not exceed 1 mm during the 10-min load-holding time of the last (sixth) load cycle with 40 tons applied load.
The creep movement of anchor no. 309 in the fourth loading cycle meets the requirements of the creep criterion with an applied load of 52 tons. The creep movement of the fifth loading cycle with an applied load of 62.4 tons exceeds both the upper limits of 10- and 60-min load-holding times. A decision has been made to put this anchor out of service. It is obvious from Figure 16 that the slopes of the three trial anchors are very similar, while it is different from the slope line belonging to anchor no. 309, which is due to the different soil layers that the anchor’s body is embedded in.
From the behavior of anchor 309, it could be concluded that the safe working load is 39 tons, which could be obtained by dividing the load of the last accepted loading cycle, 52 tons, by the magnification load factor of the acceptance test 1.33.
7.2 Interpretation of measured strain
According to the measured strain distribution along the entire length of the grouted body for anchor 1, as shown in Figure 17, there is no significant value of strain measured along the free length for a distance equal to 1.5 m measured from the anchor head, and this distance represents 40% of the free length. The measured strain becomes negligible at a distance of 1.6 m from the anchor toe, and this distance represents 23% of the bonded length.
During the second loading cycle, the measured strains along the bonded length, which are tension strains, exceed the cracking strain of the grout (100 με) [10,11]. Full debonding between strand and grout may not occur due to interlock and bonding of the residual stress between the strand and the grout.
Figure 19 depicts the developed stress in the grouted body, which shows two peaks starting from the second loading cycle; one of these peaks represents compression stress in the free length part, and the other peak is a tension stress peak in the bonded length part. There is a point with zero stress between these two peaks for each loading cycle. Assuming straight-line distribution between the two peaks, the locations of this point have not changed after the cracking strain has been reached, i.e., after the second loading cycle.
The transition point is the point with zero axial stress within the grouted body that lies between the compression stress zone, which is usually developed along the free length, and the tension stress zone, which is usually developed along the bonded length. The location of the transition point has been determined using linear interpolation between the measurements of the installed strain gauges 2 and 3, as shown in Figure 5. As can be seen from Figure 20, the location of the transition point has been shifted from the proximal end toward the distal end of the bonded length by 10–12%. The relocation of the transition point indicates that full debonding has occurred between the tendon and the grout, along with the specified percent of the bonded length.
The mobilized skin friction along the ground anchor length, presented in Figure 22, shows a significant contribution to the free length in pullout capacity. During the first loading cycle, most of the mobilized skin friction is along the free length, while it is mobilized along the bonded length for the rest of the loading cycles. The peak mobilized skin friction is located at a distance equal to 4.55 m measured from the anchor head, which represents 27% of the bonded length. More strain gauges need to be installed in this region to locate the peak point of mobilized skin friction accurately. Maximum mobilized skin friction is 173.6 kPa, which is about one-half the estimated value by using the method suggested in ref. [12], which is 339.89 kPa. This is because the tested anchor has not reached failure. The following equation presents Fujita’s formula, and the used SPT was 50 as the limit of the formula.
where
As shown in Figure 23, the mobilized skin friction in the free length part, i.e., depth 2.25 m, increases with a constant slope (straight line), while it increases at a decreasing rate along the middle part of the bonded length, specifically at depths 4.55, 6.25, and 7.5 m. At the end part of the bonded length, i.e., at a depth of 8.5 m, the mobilized skin friction increases at a constant rate, i.e., straight line, but with a slope lesser than the free length part.
8 Conclusion
This article describes the behavior of four grouted ground anchors under the suitability test. All anchors were installed vertically in a granular-dominated soil profile to resist the uplift force subjected to a newly constructed underpass. One of these anchors, e.g., anchor no. 1, was instrumented with eight strength-type strain gauges. For all the anchors, the failure load has not been reached during the test. The following points are concluded from the test results of ground anchors:
The measured stress along the entire length of the ground anchor exhibits a non-uniform distribution. While known tension stresses were developed along the bonded length, compression stresses were developed along the unbonded length. Compression stresses were also developed along the first part of the bonded length, approximately up to 10–12% of the bonded length from the proximal end, due to complete debonding between the strand and the grouted body.
No stress was measured at both the first 40% of the unbonded length and the last 20% of the bonded length. Obviously, these percentages could be changed according to the applied load.
The mobilized skin friction was non-uniformly distributed along both the unbonded and bonded lengths. The skin friction along the unbonded length has a significant contribution to the anchor’s pullout capacity, which shall be considered in the interpretation of pullout capacity according to the bonded length capacity.
-
Conflict of interest: Authors state no conflict of interest.
References
[1] BS EN 1537:2013. Execution of special geotechnical works – Ground Anchors. The British Standards Institution; 2013.Search in Google Scholar
[2] Smet J, Huybrechts N, Van Lysebetten G, Verstraelen J, François S. Optical fiber strain measurements and numerical modelling of load tests on grouted anchors. J Geotech Geoenviron Eng. 2019;145(12):04019103.10.1061/(ASCE)GT.1943-5606.0002167Search in Google Scholar
[3] De Sousa A, Costa Y, da Silva Florencio C. Load transfer on instrumented prestressed ground anchors on sandy soil. Ibracon Struct Mater J. 2021;14(6):e14612.10.1590/s1983-41952021000600012Search in Google Scholar
[4] Yousif BF. The use of remote sensing techniques in the classification of Al-Najaf soil. M.Sc. Thesis, Building and Construction Eng. Dept. University of Technology; 2004.Search in Google Scholar
[5] Jassim SZ, Goff JC. GEOLOGY OF IRAQ, Published by Dolin, Prague and Moravian Museum Brno, Czech Republic; 2006.Search in Google Scholar
[6] Al-Baghdadi N. Geotechnical mapping of An-Najaf City, Iraq. J Univ Babylon. 2016;24(4):962–79.Search in Google Scholar
[7] PTI DC35.1-14. Recommendations for Prestressed Rock and Soil Anchors. USA: Post-Tensioning Institute; 2014.Search in Google Scholar
[8] Ostermayer H, Scheele F. Research on ground anchors in non-cohesive soils. Rev Francaise de Geotechnique. 1978;3:92–7.10.1051/geotech/1978003092Search in Google Scholar
[9] Fellenius BH. From strain measurements to load in an instrumented pile. Geotech N Mag. 2001;19(1):35–8.Search in Google Scholar
[10] Leonhardt F. Cracks and crack control in concrete structures. Proceedings of the International Association for Bridge and Structural Engineering (IABSE). Zurich, Switzerland: 1987. p. 109.10.15554/pcij.07011988.124.145Search in Google Scholar
[11] Briaud JL, Powers WF, Weatherby DE. Should grouted anchors have short tendon bond length? J Geotech Geoenviron Eng. 1998;124(2):110–8.10.1061/(ASCE)1090-0241(1998)124:2(110)Search in Google Scholar
[12] Fujita K, Ueda K, Kusabka M. A method to predict the load-displacement relationship of ground anchors. Rev Francaise de Geotechnique. 1978;3:58–62.10.1051/geotech/1978003058Search in Google Scholar
© 2022 the author(s), published by De Gruyter
This work is licensed under the Creative Commons Attribution 4.0 International License.
Articles in the same Issue
- Regular Articles
- Performance of a horizontal well in a bounded anisotropic reservoir: Part I: Mathematical analysis
- Key competences for Transport 4.0 – Educators’ and Practitioners’ opinions
- COVID-19 lockdown impact on CERN seismic station ambient noise levels
- Constraint evaluation and effects on selected fracture parameters for single-edge notched beam under four-point bending
- Minimizing form errors in additive manufacturing with part build orientation: An optimization method for continuous solution spaces
- The method of selecting adaptive devices for the needs of drivers with disabilities
- Control logic algorithm to create gaps for mixed traffic: A comprehensive evaluation
- Numerical prediction of cavitation phenomena on marine vessel: Effect of the water environment profile on the propulsion performance
- Boundary element analysis of rotating functionally graded anisotropic fiber-reinforced magneto-thermoelastic composites
- Effect of heat-treatment processes and high temperature variation of acid-chloride media on the corrosion resistance of B265 (Ti–6Al–4V) titanium alloy in acid-chloride solution
- Influence of selected physical parameters on vibroinsulation of base-exited vibratory conveyors
- System and eco-material design based on slow-release ferrate(vi) combined with ultrasound for ballast water treatment
- Experimental investigations on transmission of whole body vibration to the wheelchair user's body
- Determination of accident scenarios via freely available accident databases
- Elastic–plastic analysis of the plane strain under combined thermal and pressure loads with a new technique in the finite element method
- Design and development of the application monitoring the use of server resources for server maintenance
- The LBC-3 lightweight encryption algorithm
- Impact of the COVID-19 pandemic on road traffic accident forecasting in Poland and Slovakia
- Development and implementation of disaster recovery plan in stock exchange industry in Indonesia
- Pre-determination of prediction of yield-line pattern of slabs using Voronoi diagrams
- Urban air mobility and flying cars: Overview, examples, prospects, drawbacks, and solutions
- Stadiums based on curvilinear geometry: Approximation of the ellipsoid offset surface
- Driftwood blocking sensitivity on sluice gate flow
- Solar PV power forecasting at Yarmouk University using machine learning techniques
- 3D FE modeling of cable-stayed bridge according to ICE code
- Review Articles
- Partial discharge calibrator of a cavity inside high-voltage insulator
- Health issues using 5G frequencies from an engineering perspective: Current review
- Modern structures of military logistic bridges
- Retraction
- Retraction note: COVID-19 lockdown impact on CERN seismic station ambient noise levels
- Special Issue: Trends in Logistics and Production for the 21st Century - Part II
- Solving transportation externalities, economic approaches, and their risks
- Demand forecast for parking spaces and parking areas in Olomouc
- Rescue of persons in traffic accidents on roads
- Special Issue: ICRTEEC - 2021 - Part II
- Switching transient analysis for low voltage distribution cable
- Frequency amelioration of an interconnected microgrid system
- Wireless power transfer topology analysis for inkjet-printed coil
- Analysis and control strategy of standalone PV system with various reference frames
- Special Issue: AESMT
- Study of emitted gases from incinerator of Al-Sadr hospital in Najaf city
- Experimentally investigating comparison between the behavior of fibrous concrete slabs with steel stiffeners and reinforced concrete slabs under dynamic–static loads
- ANN-based model to predict groundwater salinity: A case study of West Najaf–Kerbala region
- Future short-term estimation of flowrate of the Euphrates river catchment located in Al-Najaf Governorate, Iraq through using weather data and statistical downscaling model
- Utilization of ANN technique to estimate the discharge coefficient for trapezoidal weir-gate
- Experimental study to enhance the productivity of single-slope single-basin solar still
- An empirical formula development to predict suspended sediment load for Khour Al-Zubair port, South of Iraq
- A model for variation with time of flexiblepavement temperature
- Analytical and numerical investigation of free vibration for stepped beam with different materials
- Identifying the reasons for the prolongation of school construction projects in Najaf
- Spatial mixture modeling for analyzing a rainfall pattern: A case study in Ireland
- Flow parameters effect on water hammer stability in hydraulic system by using state-space method
- Experimental study of the behaviour and failure modes of tapered castellated steel beams
- Water hammer phenomenon in pumping stations: A stability investigation based on root locus
- Mechanical properties and freeze-thaw resistance of lightweight aggregate concrete using artificial clay aggregate
- Compatibility between delay functions and highway capacity manual on Iraqi highways
- The effect of expanded polystyrene beads (EPS) on the physical and mechanical properties of aerated concrete
- The effect of cutoff angle on the head pressure underneath dams constructed on soils having rectangular void
- An experimental study on vibration isolation by open and in-filled trenches
- Designing a 3D virtual test platform for evaluating prosthetic knee joint performance during the walking cycle
- Special Issue: AESMT-2 - Part I
- Optimization process of resistance spot welding for high-strength low-alloy steel using Taguchi method
- Cyclic performance of moment connections with reduced beam sections using different cut-flange profiles
- Time overruns in the construction projects in Iraq: Case study on investigating and analyzing the root causes
- Contribution of lift-to-drag ratio on power coefficient of HAWT blade for different cross-sections
- Geotechnical correlations of soil properties in Hilla City – Iraq
- Improve the performance of solar thermal collectors by varying the concentration and nanoparticles diameter of silicon dioxide
- Enhancement of evaporative cooling system in a green-house by geothermal energy
- Destructive and nondestructive tests formulation for concrete containing polyolefin fibers
- Quantify distribution of topsoil erodibility factor for watersheds that feed the Al-Shewicha trough – Iraq using GIS
- Seamless geospatial data methodology for topographic map: A case study on Baghdad
- Mechanical properties investigation of composite FGM fabricated from Al/Zn
- Causes of change orders in the cycle of construction project: A case study in Al-Najaf province
- Optimum hydraulic investigation of pipe aqueduct by MATLAB software and Newton–Raphson method
- Numerical analysis of high-strength reinforcing steel with conventional strength in reinforced concrete beams under monotonic loading
- Deriving rainfall intensity–duration–frequency (IDF) curves and testing the best distribution using EasyFit software 5.5 for Kut city, Iraq
- Designing of a dual-functional XOR block in QCA technology
- Producing low-cost self-consolidation concrete using sustainable material
- Performance of the anaerobic baffled reactor for primary treatment of rural domestic wastewater in Iraq
- Enhancement isolation antenna to multi-port for wireless communication
- A comparative study of different coagulants used in treatment of turbid water
- Field tests of grouted ground anchors in the sandy soil of Najaf, Iraq
- New methodology to reduce power by using smart street lighting system
- Optimization of the synergistic effect of micro silica and fly ash on the behavior of concrete using response surface method
- Ergodic capacity of correlated multiple-input–multiple-output channel with impact of transmitter impairments
- Numerical studies of the simultaneous development of forced convective laminar flow with heat transfer inside a microtube at a uniform temperature
- Enhancement of heat transfer from solar thermal collector using nanofluid
- Improvement of permeable asphalt pavement by adding crumb rubber waste
- Study the effect of adding zirconia particles to nickel–phosphorus electroless coatings as product innovation on stainless steel substrate
- Waste aggregate concrete properties using waste tiles as coarse aggregate and modified with PC superplasticizer
- CuO–Cu/water hybrid nonofluid potentials in impingement jet
- Satellite vibration effects on communication quality of OISN system
- Special Issue: Annual Engineering and Vocational Education Conference - Part III
- Mechanical and thermal properties of recycled high-density polyethylene/bamboo with different fiber loadings
- Special Issue: Advanced Energy Storage
- Cu-foil modification for anode-free lithium-ion battery from electronic cable waste
- Review of various sulfide electrolyte types for solid-state lithium-ion batteries
- Optimization type of filler on electrochemical and thermal properties of gel polymer electrolytes membranes for safety lithium-ion batteries
- Pr-doped BiFeO3 thin films growth on quartz using chemical solution deposition
- An environmentally friendly hydrometallurgy process for the recovery and reuse of metals from spent lithium-ion batteries, using organic acid
- Production of nickel-rich LiNi0.89Co0.08Al0.03O2 cathode material for high capacity NCA/graphite secondary battery fabrication
- Special Issue: Sustainable Materials Production and Processes
- Corrosion polarization and passivation behavior of selected stainless steel alloys and Ti6Al4V titanium in elevated temperature acid-chloride electrolytes
- Special Issue: Modern Scientific Problems in Civil Engineering - Part II
- The modelling of railway subgrade strengthening foundation on weak soils
- Special Issue: Automation in Finland 2021 - Part II
- Manufacturing operations as services by robots with skills
- Foundations and case studies on the scalable intelligence in AIoT domains
- Safety risk sources of autonomous mobile machines
- Special Issue: 49th KKBN - Part I
- Residual magnetic field as a source of information about steel wire rope technical condition
- Monitoring the boundary of an adhesive coating to a steel substrate with an ultrasonic Rayleigh wave
- Detection of early stage of ductile and fatigue damage presented in Inconel 718 alloy using instrumented indentation technique
- Identification and characterization of the grinding burns by eddy current method
- Special Issue: ICIMECE 2020 - Part II
- Selection of MR damper model suitable for SMC applied to semi-active suspension system by using similarity measures