Quantify distribution of topsoil erodibility factor for watersheds that feed the Al-Shewicha trough – Iraq using GIS
-
Saleem Mohmood Imariq


Abstract
Soil functions such as water storage, soil filtration, and reducing reservoir life due to sediment load are directly affected by the process of “soil erosion.” The Universal Soil Loss Equation was adopted to predict the erodibility factor for watersheds feeding the Al-Shewicha trough. The K-average factor’s determined value was 0.156, indicating that the K-factor had substantial variability. The K-factor for erodibility values was linked to the high sand content in the topsoil of the study area because of the high sand content of the topsoil. The topsoil is coarse-textured and then permeable. ArcGIS (geographic information system) was used to obtain the distribution of soil types as well as the erodibility factor distribution.
1 Introduction
Erosion of the topsoil layer has adverse effects. The loss of soil loss in the catchment is of great importance, being a significant threat to physical resources. Soil erosion poses threats to other soil functions such as water storage, soil filtration and transformation, and agricultural productivity [1,2]. Also, the negative impact of soil erodibility is to increase the sedimentary load of floodwater, which causes the reservoir’s life to be reduced and retrogression of downstream water quality [3,4,5]. Based on the preceding, the need arose to focus land management on controlling the soil loss of watersheds by preventing unscientific deforestation and agricultural practices. The soil’s natural susceptibility to being detached and translocated by erosion processes like splash erosion, surface runoff, or both is regarded as resistivity of the soil to rainfall and runoff erosivity. It is also known as the K-factor (soil erodibility factor) [6,7,8]. Because a wide range of physical factors influence soil erosion susceptibility, chemical and mechanical soil qualities, and hydrological processes, the idea of how to quantify the K-factor of such parameters is challenging [6,9,10,11]. Due to the importance of the topic, many researchers have studied soil erosion. Much previous research has addressed using a rainfall simulator to explain the relationship between precipitation and soil erosion [12,13,14]. This research aimed to determine erodible soil constant for watersheds feeding the Al-Shewicha trough (Figure 1) as a preliminary step to study sediment discharge of these watersheds.

Seasonal collected water in the Al-Shewicha trough after sitting of sediment load, Wasit Province, Iraq.
2 Study area
The study area site is located between “509374 E and 659374 E, and between 3603825 N and 3803825 N.” The area is described as plain land, mountains, and hilly regions. The Al-Shewicha trough is a flat area having a minimum elevation of +10.0 m from m.s.l. Six basins flow into the Al-Shewicha trough, as shown in Figures 2 and 3 [Shamkhi et al. [15]]. The drainage basins had varying topographic relief. In the Al-Shewicha marsh, the mean elevation of all watersheds ranges from 1,837 to 10 m. The basin's area is equal to 13,290 km2. These watersheds are shared between Iraq and Iran’s Islamic Republic, which is considered a humid area for the winter season (Figure 2).
![Figure 2
Location map of the study area with stream networks [15].](/document/doi/10.1515/eng-2022-0328/asset/graphic/j_eng-2022-0328_fig_002.jpg)
Location map of the study area with stream networks [15].
![Figure 3
The six basins flow into the Al-Shewicha trough [15].](/document/doi/10.1515/eng-2022-0328/asset/graphic/j_eng-2022-0328_fig_003.jpg)
The six basins flow into the Al-Shewicha trough [15].
The research area’s average annual rainfall was calculated to be around “325 and 233 mm, respectively; these basins “are categorized as semi-rainfall zones. The maximum annual runoff for basins 1 and 2 were 330.5 and 271.2 mm, respectively, as shown in Figures 4 and 5 [16].
![Figure 4
Annual runoff of basin 1 [16].](/document/doi/10.1515/eng-2022-0328/asset/graphic/j_eng-2022-0328_fig_004.jpg)
Annual runoff of basin 1 [16].
![Figure 5
Annual runoff of basin 2 [16].](/document/doi/10.1515/eng-2022-0328/asset/graphic/j_eng-2022-0328_fig_005.jpg)
Annual runoff of basin 2 [16].
3 Methods and data
3.1 Data sources
The elevation model in digital form of the research area from the Shuttle Radar Topographic Mission was used in this work, with a horizontal spatial resolution of 30 m. It is a raster representation of the elevation of the surface topography in XYZ directions. The image was re-projected in a regional format (WGS 1984 UTM Zone 38). The Food and Agriculture Organization (FAO) global soil map of the world was used to classify the soils. The national land cover database 2011 was used to differentiate the land cover of watersheds.
3.2 Soil erodibility factor (K)
Soil erodibility expresses the resistance of soil to both detachment and transport. The “Universal Soil Loss Equation” (USLE) is an empirical equation to predict the longtime erosion of average yearly soil loss due to runoff.
Where A is the estimated rate of soil erosion loss per year, R is the rainfall-runoff erosivity factor, K is the soil erodibility factor, LS is length of the slope and the steepness factor, C vegetation cover and P support practice factor [17]. The factor of erodibility of the soil (K) is the criterion of soil susceptibility to runoff erosion [18]. The K-factor is dependent on many soil properties such as soil texture, permeability, and organic matter content, which reverberate the soil impedance to erosion [10]. It is extracted depending on the soil properties using the universal equation for soil loss USLE monograph, which was notified by Wischmeier and Smith in 1978 [17], then amended by ref. [19] and [20]. The monograph shown in Figure 6 includes the percentages of silts, very fine sand, sand, organic materials, soil structure, and permeability.
![Figure 6
The monograph to extract soil erodibility factor [21].](/document/doi/10.1515/eng-2022-0328/asset/graphic/j_eng-2022-0328_fig_006.jpg)
The monograph to extract soil erodibility factor [21].
The silt percentage content in topsoil is the most influential factor in predicting soil erodibility due to high runoff. There is an inverse relation between clay percentage content in topsoil. The erodibility factor of the soil ranged from 0.05 to 0.2. The erodibility factor of the clay soil is ranged from 0.05 to 0.2. In general, the soil’s erodibility factor ranges from 0.02 to 0.69 [5,6,21,22].
The K-factor can be predicted in the SI unit using equation (1).
where
where
4 Results and analysis
Soil erodibility is the sign of the ingrained resistance of soil particles to the segregating and transporting power of rainfall. The sand, silt, clay, and organic matter percentages data for the watershed were obtained depending on United Nations-FAO (UN-FAO, 2007) data to classify the topsoil type of study area utilizing ArcGIS (geographic information system) 10.2 software, as demonstrated in Table 1 and Figures 7–10.
The percentage of various types of study area topsoil
| Symbols | Sand % topsoil | Silt% topsoil | Clay % topsoil | OC % topsoil |
|---|---|---|---|---|
| I | 58.7 | 16.13 | 24.2 | 0.97 |
| Jc | 39.35 | 39.54 | 20.46 | 0.65 |
| Rc | 63.5 | 18.44 | 17.3 | 0.76 |
| Xk | 48.7 | 29.06 | 21.6 | 0.64 |
| Yk | 63.5 | 17.54 | 18.7 | 0.26 |
| Yy | 49 | 10.57 | 40.3 | 0.13 |
| Zo | 43.2 | 24 | 32.4 | 0.4 |

Sand percentage distribution of study area topsoil.

Silt percentage distribution of study area topsoil.

Clay percentage distribution of study area topsoil.

Organic matter content percentage distribution of study area topsoil.
Erodibility K-factor for the topsoil of the study was calculated using equations (2)–(6), as presented in Table 2. Table 3 shows the percentage area of each type of topsoil. The resulting data from Table 2 in addition to data from Table 3 were utilized to produce a spatial distribution map of erodibility K-factor as demonstrated in Figure 11 for the study area using ArcGIS. The K-factor varied from 0.125 to 0.177, with an average of 0.156. The erodibility K-factor values are reasonable, reflecting the high percentage of sand in the topsoil of the study area. So, the topsoil is coarse-textured and then permeable. The results coincided with [15].
Calculation of erodibility factor for case study topsoil
| Symbols | Sand % topsoil | Silt % topsoil | Clay % topsoil | Organic matter % topsoil | FCS and | f ci–si | f orge | f hisand | K-factor |
|---|---|---|---|---|---|---|---|---|---|
| I | 58.7 | 16.13 | 24.2 | 0.97 | 0.2 | 0.76 | 0.993 | 0.994 | 0.15 |
| Jc | 39.35 | 39.54 | 20.46 | 0.65 | 0.201 | 0.882 | 0.996 | 1.00 | 0.177 |
| Rc | 63.5 | 18.44 | 17.3 | 0.76 | 0.20 | 0.82 | 0.996 | 0.986 | 0.161 |
| Xk | 48.7 | 29.06 | 21.6 | 0.64 | 0.203 | 0.846 | 0.998 | 1.00 | 0.169 |
| Yk | 63.5 | 17.54 | 18.7 | 0.26 | 0.2 | 0.804 | 1.00 | 0.986 | 0.1585 |
| Yy | 49 | 10.57 | 40.3 | 0.13 | 0.20 | 0.624 | 1.00 | 1.00 | 0.127 |
| Zo | 43.2 | 24 | 32.4 | 0.4 | 0.20 | 0.774 | 1.00 | 1.00 | 0.155 |
Percntage area of each type of topsoil
| Soil unit symbol | Area (km2) | % of area |
|---|---|---|
| I | 3607.8 | 27.15 |
| Jc | 1,138 | 8.56 |
| Rc | 3,175 | 23.89 |
| Wr | 14 | 0.11 |
| Xk | 33.8 | 0.25 |
| Yk | 2118.7 | 15.94 |
| Yy | 372.7 | 2.80 |
| Zo | 2,830 | 21.29 |
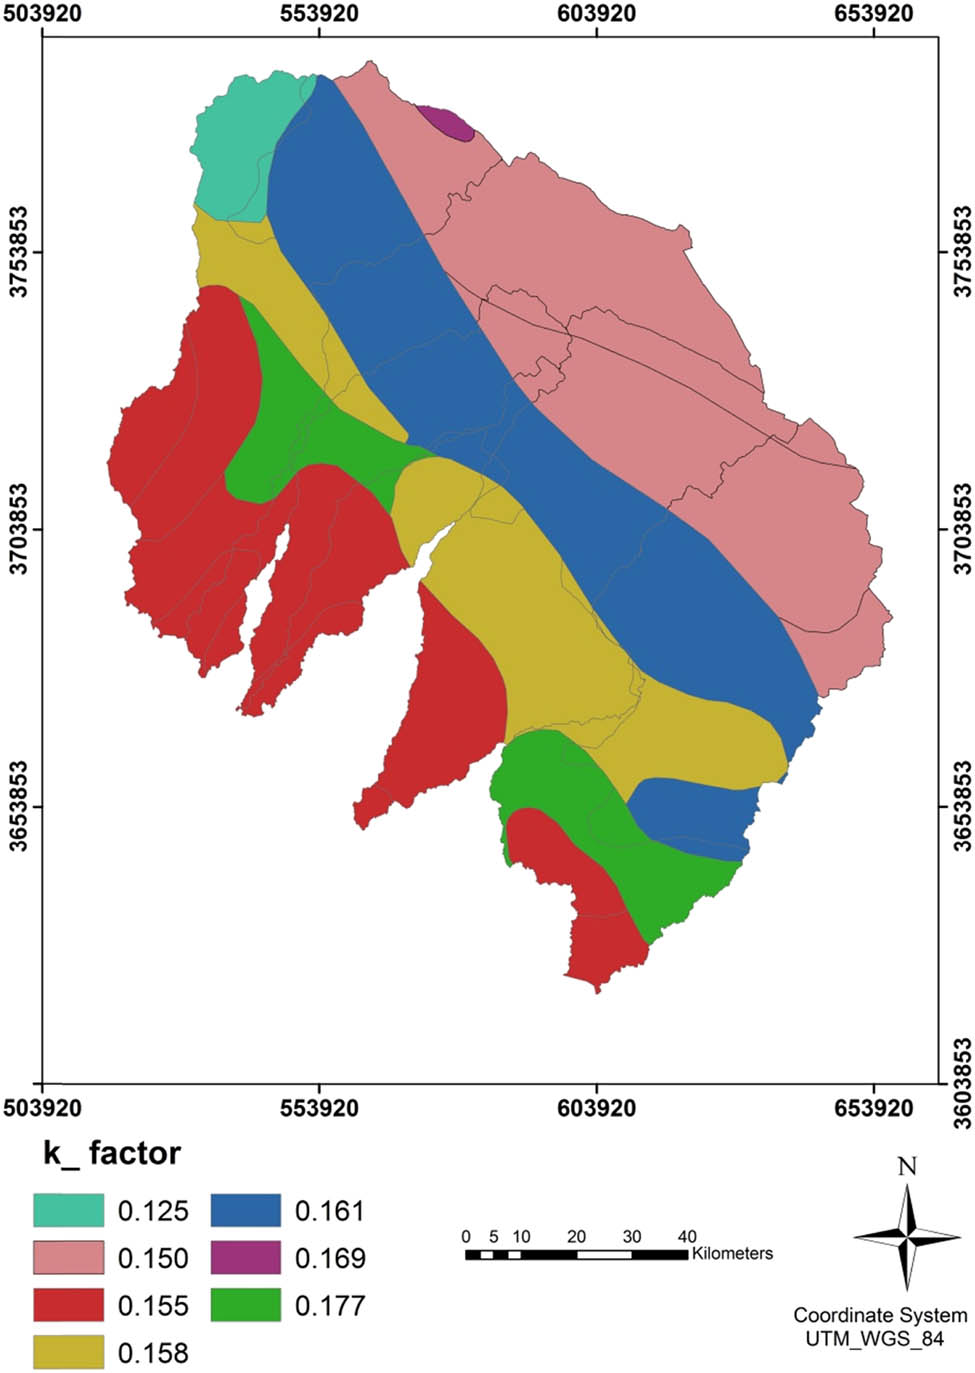
Erodibility K-factor distribution of study area.
5 Conclusion
Calculating the K-factor is crucial. The K-spatial factor’s distribution for six watersheds supplying the Al-Shewicha trough was successfully estimated in this study. The K-factor had an average computed value of 0.156, indicating that the K-factor had substantial variability. The high percentage of sand in the topsoil of the study area is reflected in the erodibility K-factor readings.
Acknowledgments
This research was supported by the University of Wasit, Iraq.
References
[1] Stefanidis S, Alexandridis V, Chatzichristaki C, Stefanidis P. Assessing soil loss by water erosion in a typical Mediterranean ecosystem of northern Greece under current and future rainfall erosivity. Water. 2021;13:2002. 10.3390/w13152002.Suche in Google Scholar
[2] Happ M. Impacts of land-cover change and high rainfall on soil erosion among three farms in Cerro Punta, Chiriquí, Panamá. Independent Study Project (ISP) Collection; 2014. p. 2002. https://digitalcollections.sit.edu/isp_collection/2002.Suche in Google Scholar
[3] Dargahi B. Reservoir sedimentation. In: Bengtsson L, Hirschy RW, Fairbridge RW, (eds). Encyclopedia of Lakes and Reservoirs. Encyclopedia of Earth Sciences Series. Dordrecht: Springer; 2012. 10.1007/978-1-4020-4410-6_215.Suche in Google Scholar
[4] Mousavi S, Namin A, Shokrluc A, Sadatinejad S, Mahmoudi H. Mapping soil erosion and sediment yield susceptibility using RUSLE model (A Case Study, Ilam Dam Watershed-Upper part, Iran). Int J Geosci Environ Plan. 2016;1(3):109–24.Suche in Google Scholar
[5] Al Rammahi AH, Khassaf SI. Estimation of soil erodibility factor in RUSLE equation for Euphrates river watershed using GIS. Int J Geomate. 2018;14(46):164–9. 10.21660/2018.46.87788.Suche in Google Scholar
[6] Addis HK, Klik A. Predicting the spatial distribution of soil erodibility factor using USLE nomograph in an agricultural watershed, Ethiopia. Int Soil Water Conserv Res. 2015;3:3282–90.10.1016/j.iswcr.2015.11.002Suche in Google Scholar
[7] Koirala P, Thakuri S, Joshi S, Chauhan R. Estimation of soil erosion in Nepal using a RUSLE modeling and geospatial tool. Geosciences. 2019;9:147. 10.3390/geosciences9040147.Suche in Google Scholar
[8] York SA, Oche CY. Effects of rainfall intensity and slope angle on splash erosion in Makurdi, Benue State. Glob J Pure Appl Sci. 2012;183&4:151–62. 10.4314/gjpas.v18i3-4.6.Suche in Google Scholar
[9] Jain SK, Singh VP. Developments in water science. 2003;51:681–741. 10.1016/S0167-5648(03)80066-7.Suche in Google Scholar
[10] Lin B-S, Chen C-K, Thomas K, Hsu C-K, Ho H-C. Improvement of the K-factor of USLE and soil erosion estimation in Shihmen reservoir watershed. Sustainability. 2019;11:355. 10.3390/su11020355.Suche in Google Scholar
[11] Salumbo A. A review of soil erosion estimation methods. Agric Sci. 2020;11:667–91. 10.4236/as.2020.118043.Suche in Google Scholar
[12] Szabó JA, Center C, Keller B, Hatvani IG, Szalai Z, Dobos E, et al. The use of various rainfall simulators in the determination of the driving forces of changes in sediment concentration and clay enrichment. Water. 2020;12:2856. 10.3390/w12102856.Suche in Google Scholar
[13] Nolan SC, van Vliet LJP, Goddard TW, Flesch TK. Estimating storm erosion with a rainfall simulator. Can J Soil Sci. 1997;77:669–76.10.4141/S96-079Suche in Google Scholar
[14] Hamed Y, Albergel J, Pépin Y, Asseline J, Nasri S, Zante PK, et al. Comparison between rainfall simulator erosion and observed reservoir sedimentation in an erosion-sensitive semiarid catchment. 2002;50(1):1–16. 10.1016/S0341-8162(02)00089-9.Suche in Google Scholar
[15] Shamkhi MS, Azeez JM, Abdul-Sahib A. Morphologic and Engineering Characteristics of Watersheds (A Case Study: East Wasit Watersheds that Feed the Al-Shewicha Trough—Iraq). IOP Conf. Series: Materials Science and Engineering. Vol. 870, No. 1, 2020. p. 012115. 10.1088/1757-899X/870/1/012115.Suche in Google Scholar
[16] Shamkhi MS, Jasim NA, Abdul-Sahib A, Aldefae AH. Estimation of Runoff for Badra and Tersikh Watersheds for Water Harvesting. J Green Eng. 2020;10:9.Suche in Google Scholar
[17] Wischmeier WH, Smith DD. Predicting rainfall-erosion losses—a guide to conservation planning. AH-537. U.S. Dept. Agr. Washington, D.C: 1978.Suche in Google Scholar
[18] López-García EM, Torres-Trejo E, López-Reyes L, Flores-Domínguez ÁD, Peña-Moreno RD, López-Olguín JF. Estimation of soil erosion using USLE and GIS in the locality of Tzicatlacoyan, Puebla, México. Soil Water Res. 2020;15:9–17.10.17221/165/2018-SWRSuche in Google Scholar
[19] Renard KG, Foster GR, Weenies GA, McCool DK, Yoder DC. Predicting Soil Erosion by Water: A Guide to Conservation. Planning with the Revised Universal Soil Loss Equation (RUSLE). Agric. Handbook, 703. U.S. Department of Agriculture. Washington, D.C: 1997.Suche in Google Scholar
[20] Foster GR. Draft: Science Documentation. Revised Universal Soil Loss Equation version 2 (RUSLE2)USDA-Agricultural Research Service. Washington, DC: 2005.Suche in Google Scholar
[21] UN-FAO (2007). This website is designed to source soil data and knowledge on soils’ different components and parts, http://www.fao.org/soils-portal/en/.Suche in Google Scholar
[22] Sharpley AN, Williams JR. Epic “Erosion/Productivity Impact Calculator: 1. Model Documentation. U.S. Department of Agriculture Technical Bulletin. Vol. 1768, 1990. p. 235.Suche in Google Scholar
© 2022 the author(s), published by De Gruyter
This work is licensed under the Creative Commons Attribution 4.0 International License.
Artikel in diesem Heft
- Regular Articles
- Performance of a horizontal well in a bounded anisotropic reservoir: Part I: Mathematical analysis
- Key competences for Transport 4.0 – Educators’ and Practitioners’ opinions
- COVID-19 lockdown impact on CERN seismic station ambient noise levels
- Constraint evaluation and effects on selected fracture parameters for single-edge notched beam under four-point bending
- Minimizing form errors in additive manufacturing with part build orientation: An optimization method for continuous solution spaces
- The method of selecting adaptive devices for the needs of drivers with disabilities
- Control logic algorithm to create gaps for mixed traffic: A comprehensive evaluation
- Numerical prediction of cavitation phenomena on marine vessel: Effect of the water environment profile on the propulsion performance
- Boundary element analysis of rotating functionally graded anisotropic fiber-reinforced magneto-thermoelastic composites
- Effect of heat-treatment processes and high temperature variation of acid-chloride media on the corrosion resistance of B265 (Ti–6Al–4V) titanium alloy in acid-chloride solution
- Influence of selected physical parameters on vibroinsulation of base-exited vibratory conveyors
- System and eco-material design based on slow-release ferrate(vi) combined with ultrasound for ballast water treatment
- Experimental investigations on transmission of whole body vibration to the wheelchair user's body
- Determination of accident scenarios via freely available accident databases
- Elastic–plastic analysis of the plane strain under combined thermal and pressure loads with a new technique in the finite element method
- Design and development of the application monitoring the use of server resources for server maintenance
- The LBC-3 lightweight encryption algorithm
- Impact of the COVID-19 pandemic on road traffic accident forecasting in Poland and Slovakia
- Development and implementation of disaster recovery plan in stock exchange industry in Indonesia
- Pre-determination of prediction of yield-line pattern of slabs using Voronoi diagrams
- Urban air mobility and flying cars: Overview, examples, prospects, drawbacks, and solutions
- Stadiums based on curvilinear geometry: Approximation of the ellipsoid offset surface
- Driftwood blocking sensitivity on sluice gate flow
- Solar PV power forecasting at Yarmouk University using machine learning techniques
- 3D FE modeling of cable-stayed bridge according to ICE code
- Review Articles
- Partial discharge calibrator of a cavity inside high-voltage insulator
- Health issues using 5G frequencies from an engineering perspective: Current review
- Modern structures of military logistic bridges
- Retraction
- Retraction note: COVID-19 lockdown impact on CERN seismic station ambient noise levels
- Special Issue: Trends in Logistics and Production for the 21st Century - Part II
- Solving transportation externalities, economic approaches, and their risks
- Demand forecast for parking spaces and parking areas in Olomouc
- Rescue of persons in traffic accidents on roads
- Special Issue: ICRTEEC - 2021 - Part II
- Switching transient analysis for low voltage distribution cable
- Frequency amelioration of an interconnected microgrid system
- Wireless power transfer topology analysis for inkjet-printed coil
- Analysis and control strategy of standalone PV system with various reference frames
- Special Issue: AESMT
- Study of emitted gases from incinerator of Al-Sadr hospital in Najaf city
- Experimentally investigating comparison between the behavior of fibrous concrete slabs with steel stiffeners and reinforced concrete slabs under dynamic–static loads
- ANN-based model to predict groundwater salinity: A case study of West Najaf–Kerbala region
- Future short-term estimation of flowrate of the Euphrates river catchment located in Al-Najaf Governorate, Iraq through using weather data and statistical downscaling model
- Utilization of ANN technique to estimate the discharge coefficient for trapezoidal weir-gate
- Experimental study to enhance the productivity of single-slope single-basin solar still
- An empirical formula development to predict suspended sediment load for Khour Al-Zubair port, South of Iraq
- A model for variation with time of flexiblepavement temperature
- Analytical and numerical investigation of free vibration for stepped beam with different materials
- Identifying the reasons for the prolongation of school construction projects in Najaf
- Spatial mixture modeling for analyzing a rainfall pattern: A case study in Ireland
- Flow parameters effect on water hammer stability in hydraulic system by using state-space method
- Experimental study of the behaviour and failure modes of tapered castellated steel beams
- Water hammer phenomenon in pumping stations: A stability investigation based on root locus
- Mechanical properties and freeze-thaw resistance of lightweight aggregate concrete using artificial clay aggregate
- Compatibility between delay functions and highway capacity manual on Iraqi highways
- The effect of expanded polystyrene beads (EPS) on the physical and mechanical properties of aerated concrete
- The effect of cutoff angle on the head pressure underneath dams constructed on soils having rectangular void
- An experimental study on vibration isolation by open and in-filled trenches
- Designing a 3D virtual test platform for evaluating prosthetic knee joint performance during the walking cycle
- Special Issue: AESMT-2 - Part I
- Optimization process of resistance spot welding for high-strength low-alloy steel using Taguchi method
- Cyclic performance of moment connections with reduced beam sections using different cut-flange profiles
- Time overruns in the construction projects in Iraq: Case study on investigating and analyzing the root causes
- Contribution of lift-to-drag ratio on power coefficient of HAWT blade for different cross-sections
- Geotechnical correlations of soil properties in Hilla City – Iraq
- Improve the performance of solar thermal collectors by varying the concentration and nanoparticles diameter of silicon dioxide
- Enhancement of evaporative cooling system in a green-house by geothermal energy
- Destructive and nondestructive tests formulation for concrete containing polyolefin fibers
- Quantify distribution of topsoil erodibility factor for watersheds that feed the Al-Shewicha trough – Iraq using GIS
- Seamless geospatial data methodology for topographic map: A case study on Baghdad
- Mechanical properties investigation of composite FGM fabricated from Al/Zn
- Causes of change orders in the cycle of construction project: A case study in Al-Najaf province
- Optimum hydraulic investigation of pipe aqueduct by MATLAB software and Newton–Raphson method
- Numerical analysis of high-strength reinforcing steel with conventional strength in reinforced concrete beams under monotonic loading
- Deriving rainfall intensity–duration–frequency (IDF) curves and testing the best distribution using EasyFit software 5.5 for Kut city, Iraq
- Designing of a dual-functional XOR block in QCA technology
- Producing low-cost self-consolidation concrete using sustainable material
- Performance of the anaerobic baffled reactor for primary treatment of rural domestic wastewater in Iraq
- Enhancement isolation antenna to multi-port for wireless communication
- A comparative study of different coagulants used in treatment of turbid water
- Field tests of grouted ground anchors in the sandy soil of Najaf, Iraq
- New methodology to reduce power by using smart street lighting system
- Optimization of the synergistic effect of micro silica and fly ash on the behavior of concrete using response surface method
- Ergodic capacity of correlated multiple-input–multiple-output channel with impact of transmitter impairments
- Numerical studies of the simultaneous development of forced convective laminar flow with heat transfer inside a microtube at a uniform temperature
- Enhancement of heat transfer from solar thermal collector using nanofluid
- Improvement of permeable asphalt pavement by adding crumb rubber waste
- Study the effect of adding zirconia particles to nickel–phosphorus electroless coatings as product innovation on stainless steel substrate
- Waste aggregate concrete properties using waste tiles as coarse aggregate and modified with PC superplasticizer
- CuO–Cu/water hybrid nonofluid potentials in impingement jet
- Satellite vibration effects on communication quality of OISN system
- Special Issue: Annual Engineering and Vocational Education Conference - Part III
- Mechanical and thermal properties of recycled high-density polyethylene/bamboo with different fiber loadings
- Special Issue: Advanced Energy Storage
- Cu-foil modification for anode-free lithium-ion battery from electronic cable waste
- Review of various sulfide electrolyte types for solid-state lithium-ion batteries
- Optimization type of filler on electrochemical and thermal properties of gel polymer electrolytes membranes for safety lithium-ion batteries
- Pr-doped BiFeO3 thin films growth on quartz using chemical solution deposition
- An environmentally friendly hydrometallurgy process for the recovery and reuse of metals from spent lithium-ion batteries, using organic acid
- Production of nickel-rich LiNi0.89Co0.08Al0.03O2 cathode material for high capacity NCA/graphite secondary battery fabrication
- Special Issue: Sustainable Materials Production and Processes
- Corrosion polarization and passivation behavior of selected stainless steel alloys and Ti6Al4V titanium in elevated temperature acid-chloride electrolytes
- Special Issue: Modern Scientific Problems in Civil Engineering - Part II
- The modelling of railway subgrade strengthening foundation on weak soils
- Special Issue: Automation in Finland 2021 - Part II
- Manufacturing operations as services by robots with skills
- Foundations and case studies on the scalable intelligence in AIoT domains
- Safety risk sources of autonomous mobile machines
- Special Issue: 49th KKBN - Part I
- Residual magnetic field as a source of information about steel wire rope technical condition
- Monitoring the boundary of an adhesive coating to a steel substrate with an ultrasonic Rayleigh wave
- Detection of early stage of ductile and fatigue damage presented in Inconel 718 alloy using instrumented indentation technique
- Identification and characterization of the grinding burns by eddy current method
- Special Issue: ICIMECE 2020 - Part II
- Selection of MR damper model suitable for SMC applied to semi-active suspension system by using similarity measures