Effect of heat-treatment processes and high temperature variation of acid-chloride media on the corrosion resistance of B265 (Ti–6Al–4V) titanium alloy in acid-chloride solution
-
Roland Tolulope Loto


Abstract
Corrosion resistance of untreated (B265TiN), quenched (B265TiQ), and annealed (B265TiA) B265 titanium alloy was studied in 2–10 M H2SO4 + 10% NaCl solution at 30, 70, and 95°C by potentiodynamic polarization, potentiostatic measurement, open circuit potential measurement, and optical microscopy. B265TiN was the most resistant of the alloys to general corrosion at 30°C with values between 0.094 and 3.782 mm/year. B265TiQ exhibited the highest corrosion rate values (0.210–23.399 mm/year). Its plots show significant increase in cathodic slope. At 70 and 95°C, B265TiN exhibited the lowest corrosion rate in 2 and 6 M H2SO4 + 10% NaCl solution, while B265TiQ exhibited the corresponding highest values. Optical characterization shows B265TiN, B265TiQ, and B265TiA alloys are highly resistant to corrosion in 2 M H2SO4 + 10% NaCl at 30°C compared to 10 M H2SO4 + 10% NaCl, where marginal deterioration occurred on B265TiN, significant degradation on B265TiQ, and localized degradation on B265TiA. The extent of degradation increased at 70 and 95°C. B265TiN exhibited the highest resistance to metastable pits formation compared to B265TiQ and B265TiA. Potentiostatic values at 70°C shows high temperature exposure of Ti alloy to accelerated corrosion. Metastable pit initiation values at 70°C are significantly greater. Open circuit potential measurement at 30°C shows B265TiN demonstrated least vulnerability to corrosion with stable oxide formation at 2 M and 6 M H2SO4 + 10% NaCl, and B265TiQ was least vulnerable at 10 M H2SO4 + 10% NaCl. At 70°C, B265TiQ was least vulnerable to corrosion with unstable oxide formation at 2 M and 6 M H2SO4 + 10% NaCl compared to B265TiN at 10 M H2SO4 + 10% NaCl.
1 Introduction
Titanium is a nonmagnetic low-density (60% of stainless steel density) alloy with excellent heat conduction properties. Its coefficient of thermal expansion is below that of steel and aluminum. The mechanical properties of titanium can be significantly modified through alloying and other manufacturing processes [1]. Their melting points are higher than those of steels, but the optimal relevant temperature range for structural applications is as low as 400°C to about 600°C with respect to composition. Mechanical properties are the primary performance characteristic for titanium applications. Biocompatibility is the most important factor in medicine. However, in industry, corrosion resistance is the most important requirement. Though the economic consequence for use of titanium alloys is (a) higher than ferrous and non-ferrous alloys in the short term, (b) the long-term operational cost is lower, and (c) the productive lifespan and service reliability are longer coupled with marginal maintenance cost. Increased metallic production capacity and efficiency, more efficient processing technologies, extensive market base, and unlimited demand have significantly lowered the cost of titanium alloys [2]. Titanium alloys are extensively utilized in aviation, chemical manufacturing [3,4,5], pharmaceutical [6,7,8,9,10,11,12], petrochemical [13,14], desalination, nuclear and energy generation, heat exchangers, geothermal [15], mining, and biomedical industries [16,17,18]. Titanium exhibits higher corrosion resistance than stainless steels in neutral chloride and oxidizing acid conditions. The corrosion resistance of titanium is on account of a stable and protective resistant oxide film whose nature strongly depends on environmental factors. The protective oxide evolves instantaneously on titanium surface when exposed to aqueous conditions [19,20,21,22,23,24,25,26,27,28,29,30,31,32,33]. The oxide remains resistive to general and localized corrosion in most oxidizing and neutral conditions without the need for corrosion inhibitors like ferrous and aluminum alloys though they are vulnerable in reducing media [34,35]. This can be mitigated through coating of the titanium alloy. Research on the corrosion study of laser cladded Ti–6Al–4V alloy in dilute NaCl, H2SO4 and HCl solutions showed that the coating displayed a more noble corrosion behavior compared to the untreated alloy [36]. They have weak corrosion resistance in acidified fluids [37,38,39,40,41]. Generally, the oxide is in the form of TiO2, though it consists of other precipitates of titanium oxides at the metal interface (TiO2, Ti2O3, and TiO) [42,43].
High-temperature application of titanium alloys tends to advance the evolution of a chemically stable, resistant, and crystalline covering of TiO. Titanium alloys are utilized as the liner and interior components of steam sterilizers during the high-pressure and temperature acid filtration of nickel laterite ores where they are prone to astringent conditions of acidity, temperature, and pressure [44]. Ti–6Al–2Sn–4Zr–2Mo alloy proves to be more corrosion resistant than Ti–6Al–4V [45]. Yang et al. [46] studied the effect of solution and aging treatments on the microstructure and the corrosion resistance of laser solid formed Ti–6Al–4V titanium alloy and found that aging treated Ti–6Al–4V showed corrosion resistance in 3.5 wt% NaCl solution showed corrosion resistance which was slightly better than the as-deposited Ti–6Al–4V. Rotating parts in jet-engine blades and gas turbine are currently made of titanium alloys which combine high strength and stable metallurgical structure for high temperature performance. Titanium alloys exhibit good potential for high temperature utilization in turbine parts owing to their good oxidation properties [47,48,49,50,51]. The corrosion behaviors of titanium alloy in high temperature applications vary with environments. In extractive metallurgy, titanium alloys are subjected to the deprecating action of reducing acids. According to Yue et al. [52], B265 titanium alloy reacted poorly in high Cl− solution concentration and acidic environments containing Cl− ions. Blanco-Pinzon et al. [53] stated that B265 titanium alloy was vulnerable to corrosion in H2SO4 solution in the absence of alloying elements of Pd and Ni. High temperature usage of titanium alloys in reducing environments subjects them to operating conditions which modify the physical, mechanical, and metallurgical properties, and strongly influences their corrosion resistance. Increased use of Ti alloys in extractive metallurgy and other high temperature applications has prompted research into their corrosion resistance properties in sulfuric acid solutions. B265 titanium is the most applicable titanium alloy among the αβ titanium alloys. Its corrosion resistance in HCl, H2SO4 and NaCl media at room and elevated temperatures from different production and manufacturing techniques have been researched into by other authors [54,55,56,57,58,59,60,61,62,63,64]. In contribution to the study of corrosion resistance of titanium alloys, this article studies the effect of heat-treatment processes and high temperature variation of acid-chloride media on the corrosion resistance of B265 (Ti–6Al–4V) titanium alloy.
2 Experimental methods
2.1 Materials preparation
B265 titanium alloy (B265TiN) obtained from the University of Johannesburg, Johannesburg, South Africa was analyzed with Phenom ProX Scanning Electron Microscope (Model No. MVE0224651193) at the Central Laboratory, Covenant University. The nominal (wt%) content of B265TiN alloy is shown in Table 1. B265TiN was cut by using a hacksaw into 15 specimens with dimensions of 1 cm × 1 cm × 0.5 cm (length × breadth × thickness). A total of 10 B265TiN specimens underwent annealing and quenching heat treatment process in a muffle furnace after heating the steel to 600°C and maintained at that temperature for 30 min. Annealed B265TiN (B265TiA) was gradually chilled in air, while quenched B265TiN (B265TiQ) was chilled in deionized H2O. The temperature within the muffle furnace was sustained with a control dial at accuracy ±10°C and connected to a thermocouple (K-Type). A Cu wire was attached to B265TiN, B265TiQ, and B265TiA specimens with soldering iron, and the specimens were embedded in pre-hardened acrylic resin mounts. The exposed area of the embedded specimens (1 cm × 1 cm) were thereafter grinded with emery paper with 80, 120, 220, 600, and 1,000 grit sizes according to ASTMG59-97 [65]. B265TiN was then burnished with 6 µm diamond polishing solution and later sanitized with deionized H2O and C3H6O in accordance with ASTM G1-03 [66].
Nominal (wt%) constituent of B265 titanium alloy
| Element | V | Al | Fe | O | C | N | H | Y | Ti |
| % composition | 4 | 6 | 0.3 | 0.2 | 0.08 | 0.05 | 0.015 | 0.005 | 89.35 |
2.2 Test solution
Standard grade recrystallized NaCl (obtained from Loba Chemie Pvt. Ltd, India) was prepared into volume concentrations of 10% in 400 mL of 2, 4, 6, 8, and 10 M H2SO4 solution by adding 40 g NaCl into a beaker and filling up to 400 mL of the required dilute H2SO4 solution concentration. Dilute H2SO4 was prepared from conventional grade reagent of the acid (98%, purchased from Sigma-Aldrich, USA).
2.3 Electrochemical test
Potentiodynamic polarization tests were performed at 30, 70, and 95°C with a ternary electrode configuration (working electrode, Ag/AgCl reference electrode, and Pt wire counter electrode) within a transparent beaker containing the acid-chloride electrolyte (placed on a portable heating device) using Digi-Ivy 2311 electrochemical workstation (plugged to a computer). Fisherbrand accumet glass body Ag/AgCl reference electrode was used for high temperature electrochemical test. The temperature of the heating device was thermostatically controlled. Polarization curves were drawn at sweep rate of 0.0015 V/s from −1.4 to +0.75 V according to ASTM G102-89(2015) [67]. Corrosion current density (C D, A/cm2) and corrosion potential (C P, V) values were determined by the Tafel extrapolation method. Corrosion rate (C R) was computed from the equation below:
where E Q represents the specimen equivalent weight (g). 0.00327 represents constant for corrosion rate calculation in mm/year [68]. Open circuit potential measurement (OCP) was executed at 0.05 V/s step potential for 3,000 s to analyze the active-passive transition behavior and the thermodynamic stability of B265TiN, B265TiQ, and B265TiA alloys in 2 M H2SO4 + 10% NaCl, 6 M H2SO4 + 10% NaCl, and 10 M H2SO4 + 10% NaCl solutions at 30 and 70°C [69].
2.4 Optical microscopy characterization
Optical representative images of B265TiN, B265TiQ, and B265TiA alloy surfaces in 2 M H2SO4 + 10% NaCl and 10 M H2SO4 + 10% NaCl solutions at 30°C, 2 M H2SO4 + 10% NaCl and 6 M H2SO4 + 10% NaCl solutions at 70°C, and 2 M H2SO4 + 10% NaCl and 6 M H2SO4 + 10% NaCl solutions at 95°C were studied and compared using Omax microscope.
3 Results and discussion
3.1 Potentiodynamic polarization studies
Corrosion resistance of B265TiN, B265TiQ, and B265TiA titanium alloys were studied by potentiodynamic polarization method at 30°C. Potentiodynamic plots of B265TiN, B265TiQ, and B265TiA corrosion in 2, 4, 6, 8, and 10 M H2SO4 solution at 10% NaCl concentration are displayed in Figure 1(a)–(c). Table 2 shows the polarization data retrieved from the plots for B265TiN, B265TiQ, and B265TiA alloys. Data for B265TiN in Table 2 shows that increase in H2SO4 concentration results in proportionate increase in B265TiN corrosion. Corrosion rate of B265TiN in 2 M H2SO4 + 10% NaCl concentration is 0.094 mm/year which corresponds to corrosion current density of 8.07 × 10⁻⁶ A/cm2 and polarization resistance of 3,184 Ω. B265TiN Corrosion rate value from 2–6 M H2SO4 + 10% NaCl concentration are well below 1 mm/year signifying strong resistance of B265TiN to corrosion within the acid-chloride media. The reaction of B265TiN in the electrolyte generally proceeds according to equation (2), where B265TiN alloy is oxidized to Ti3+ and passes into the electrolyte. Simultaneously, electrolytic transport of H+ ions from the electrolyte to the metal exterior occurs leading to the formation of atomic hydrogen and subsequently H2 gas according to equation (3) below;

Potentiodynamic plots of (a) B265TiN, (b) B265TiQ, and B265TiA alloys in 2–10 M H2SO4 solution at 10% NaCl concentration.
Potentiodynamic polarization output for B265TiN, B265TiQ, and B265TiA in 2–10 M H2SO4 + 10% NaCl at 30°C
| Specimen | H2SO4 Conc. (M)/10% NaCl | B265 Corrosion rate (mm/year) | Corrosion current (A) | Corrosion current density (A/cm2) | Corrosion potential (V) | Polarization resistance, R p (Ω) | Cathodic potential, B c | Anodic potential, B a |
|---|---|---|---|---|---|---|---|---|
| B265TiN | ||||||||
| A | 2 | 0.094 | 8.07 × 10⁻⁶ | 8.07 × 10⁻⁶ | −0.523 | 3184.00 | −6.92 | 4.327 |
| B | 4 | 0.350 | 3.02 × 10⁻⁵ | 3.02 × 10⁻⁵ | −0.580 | 851.10 | −9.74 | 4.079 |
| C | 6 | 0.760 | 6.55 × 10⁻⁵ | 6.55 × 10⁻⁵ | −0.640 | 392.30 | −6.048 | 5.782 |
| D | 8 | 2.390 | 2.06 × 10⁻⁴ | 2.06 × 10⁻⁴ | −0.699 | 124.70 | −6.941 | 5.237 |
| E | 10 | 13.782 | 1.19 × 10⁻³ | 1.19 × 10⁻³ | −0.647 | 21.63 | −7.184 | 4.408 |
| B265TiQ | ||||||||
| A | 2 | 0.210 | 1.81 × 10⁻⁵ | 1.81 × 10⁻⁵ | −0.491 | 2097.00 | −8.009 | 2.148 |
| B | 4 | 0.569 | 4.91 × 10⁻⁵ | 4.91 × 10⁻⁵ | −0.595 | 523.30 | −9.568 | 4.933 |
| C | 6 | 4.452 | 3.84 × 10⁻⁴ | 3.84 × 10⁻⁴ | −0.524 | 66.94 | −5.448 | 4.630 |
| D | 8 | 4.618 | 3.98 × 10⁻⁴ | 3.98 × 10⁻⁴ | −0.677 | 64.54 | −7.238 | 4.419 |
| E | 10 | 23.399 | 2.02 × 10⁻³ | 2.02 × 10⁻³ | −0.648 | 12.74 | −7.848 | 4.150 |
| B265TiA | ||||||||
| A | 2 | 0.135 | 1.16 × 10⁻⁵ | 1.16 × 10⁻⁵ | −0.461 | 2211.00 | −6.905 | 1.140 |
| B | 4 | 0.443 | 3.82 × 10⁻⁵ | 3.82 × 10⁻⁵ | −0.467 | 695.00 | −6.54 | 1.075 |
| C | 6 | 3.336 | 2.88 × 10⁻⁴ | 2.88 × 10⁻⁴ | −0.568 | 89.33 | −11.980 | 1.429 |
| D | 8 | 4.726 | 4.07 × 10⁻⁴ | 4.07 × 10⁻⁴ | −0.661 | 63.06 | −6.951 | 4.063 |
| E | 10 | 18.735 | 1.62 × 10⁻³ | 1.62 × 10⁻³ | −0.631 | 15.91 | −8.141 | 4.091 |
Corrosion resistance of B265TiN is primarily on account of the evolution of TiO2 on the alloy surface [70,71], according to the equation (4). B265TiN reacts with dissolved O2 to produce the strong adherent oxide layer on its surface.
Corrosion rate of B265TiN at 8 M H2SO4 + 10% NaCl concentration is 2.390 mm/year, while at 10 M H2SO4 + 10% NaCl concentration, B265TiN underwent severe surface deterioration with corrosion rate output of 13.782 mm/year. This value correlates with corrosion current density of 1.19 × 10⁻³ and polarization resistance of 21.63 Ω. The significantly low polarization resistance value at 2 M H2SO4 + 10% NaCl concentration in contrast to the extremely high value at 10 M H2SO4 + 10% NaCl concentration is an indication of the extent to which the TiO2 formed on B265TiN alloy has thinned out and got damaged from the constant attack of the anionic species [72]. Observation of the cathodic portion of the polarization plots in Figure 1(a) exhibits significant increase in cathodic polarization slope and decrease in cathodic reaction time due to accelerated H2 evolution and O2 reduction reactions. The corrosion potential shift of the combined anodic-cathodic polarization plots shows that the corrosion reaction mechanisms are dominated by cathodic processes. This observation stems from the increase in
The Cl2 in equation (5) transports through breakages on TiO2 and reacts with the substrate B265TiN [74,75]. Cl− anions contribute to the breakdown of the protective oxide (equations (6) and (11)). The greater reactivity of HCl compared to Cl2 ensures accelerated deterioration of the alloy surface, thus, more substrate metal is consumed and released into the solution, resulting in higher corrosion rate.
Quenching and annealing heat-treatment strongly influence the microstructure and metallurgical properties of B265TiN alloy which in effect influences the corrosion resistance of the alloy [76,77,78,79]. Heat-treatment had marginal influence on the general corrosion resistance of B265TiQ and B265TiA at 2 M and 4 M H2SO4 + 10% NaCl concentrations. Corrosion rate increased to 0.210 and 0.569 mm/year for B265TiQ, and 0.135 and 0.443 mm/year for B265TiA. At 6 M and 8 M H2SO4 + 10% NaCl concentrations, the margin of difference in corrosion rate for B265TiQ and B265TiA has increased further, compared to the corresponding value for B265TiN. Heat-treatment strongly influences the properties and strength of TiO2 formed on B265TiQ and B265TiA alloys which invariably influences their interaction with anionic species from the electrolyte [80]. At 10 M H2SO4 + 10% NaCl concentration, corrosion rate of B265TiQ and B265TiA alloys culminated at 23.399 and 18.735 mm/year compared to 13.782 mm/year for B265TiN. The slopes of the cathodic reaction mechanisms for B265TiQ and B265TiA (Figure 1b and c) are significantly higher than the corresponding slopes for B265TiN (Figure 1a) due to increased cathodic reaction mechanisms during potential scanning. Corrosion potential of the heat-treated alloys is substantially influenced by the strength of the protective oxide [81]. The corrosion potential of the potentiodynamic plots for B265TiA shifted to lower potential due to dominant cathodic reaction process compared to the corresponding values for B265TiQ. The redox reaction mechanism counterbalanced each other for B265TiQ with respect to variation in H2SO4 concentration, while the corrosion potentials of B265TiA were marginally lower than the values for B265TiN.
Corrosion resistance of B265TiN, B265TiQ, and B265TiA alloys were further subjected to analysis in hot acid-chloride media (2 M and 6 M H2SO4 + 10% NaCl concentration) at 70 and 95°C. Figure 2a–c shows the potentiodynamic polarization plots of the anodic-cathodic reaction mechanisms of B265TiN, B265TiQ, and B265TiA alloys in 2 M and 6 M H2SO4 + 10% NaCl concentration at 70°C, while Figure 3a and b shows the corresponding polarization plots at 95°C. Tables 3 and 4 show the polarization data obtained at 70 and 95°C. Observation of Table 3 shows B265TiN exhibited the lowest corrosion rate values at 70oC for all the acid-chloride concentrations studied with values of 4.979 and 16.090 mm/year. Corrosion potential of the polarization plots for B265TiN in Figure 2a shifted from −0.516 V (2 M H2SO4 + 10% NaCl) to −0.566 V in Figure 3a (6 M H2SO4 + 10% NaCl) due to increased destruction of TiO2 on its surface and dominant cathodic processes. The polarization resistance of B265TiN (at 2 M and 6 M H2SO4 + 10% NaCl) are 59.87 and 18.52 Ω, respectively, which is a strong indication of the corrosion resistance properties of the protective oxide. B265TiQ exhibited the highest corrosion rates with corresponding values of 17.912 and 35.812 mm/year at polarization resistance of 16.64 and 8.32 Ω. Change in corrosion potential of the polarization plots (Figures 2b and 3b) with respect to electrolyte concentration was marginal from −0.585 to −0.589 V in the cathodic direction. At 95°C, corrosion rate of B265TiN, B265TiQ, and B265TiA in 2 M H2SO4 + 10% NaCl media visibly increased to 11.937, 20.824, and 15.302 mm/year compared to their values at 70°C. Their corresponding values in 6 M H2SO4 + 10% NaCl at 70oC exhibited corrosion rates of 14.304, 92.888 and 40.336 mm/year. These observations are due to the increased agitation of the anionic corrosive species at temperature above room temperature. The slopes of the polarization plots (Figures 2 and 3) are significantly higher than the corresponding values at 30oC ambient temperature. Comparison of the corrosion potentials of B265TiN, B265TiQ, and B265TiA at 70 and 95°C in 2 M H2SO4 + 10% NaCl shows visible potential shift in the anodic direction for two reasons (i) increased general surface degeneration in the presence of agitated corrosive species [82], and (ii) greater evolution of oxide complexes on the alloy surface which do not protect the alloy but are by products of chemical reactions at the metal-solution interface. The corresponding values in 6 M H2SO4 + 10% NaCl show significant decrease in corrosion potential values for B265TiN, B265TiQ, and B265TiA alloys in the cathodic direction. Nevertheless, results show heat treatments, increase in
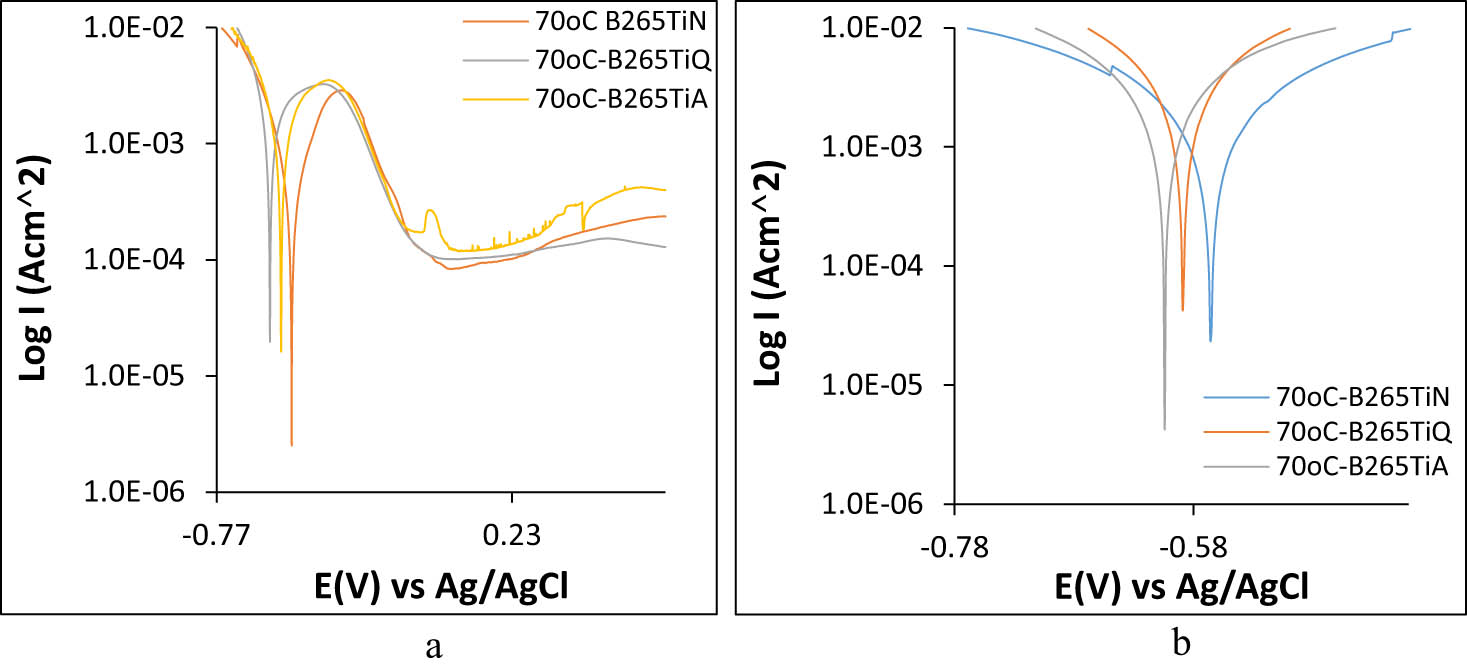
Potentiodynamic plots of B265TiN, B265TiQ, and B265TiA corrosion in (a) 2 M H2SO4 + 10% NaCl at 70°C and (b) 6 M H2SO4 + 10% NaCl at 70°C.

Potentiodynamic plots of B265TiN, B265TiQ, and B265TiA corrosion in (a) 2 M H2SO4 + 10% NaCl at 95°C and (b) 6 M H2SO4 + 10% NaCl at 95°C.
Potentiodynamic polarization data for B265TiN, B265TiQ, and B265TiA in 2 M H2SO4 + 10% NaCl and 6 M H2SO4 + 10% NaCl at 70 and 95°C
| B265 Specimen | Temp. (°C) | B265 Corrosion rate (mm/year) | Corrosion current (A) | Corrosion current density (A/cm2) | Corrosion potential (V) | Polarization resistance, R p (Ω) | Cathodic potential, B c | Anodic potential, B a |
|---|---|---|---|---|---|---|---|---|
| 2 M H 2 SO 4 + 10% NaCl | ||||||||
| N | 70 | 4.979 | 4.29 × 10⁻⁴ | 4.29 × 10⁻⁴ | −0.516 | 59.87 | −8.343 | 7.768 |
| Q | 70 | 17.912 | 1.54 × 10⁻³ | 1.54 × 10⁻³ | −0.585 | 16.64 | −7.010 | 2.624 |
| A | 70 | 13.608 | 1.17 × 10⁻³ | 1.17 × 10⁻³ | −0.547 | 21.91 | −6.903 | 3.622 |
| N | 95 | 11.937 | 1.03 × 10⁻³ | 1.03 × 10⁻³ | −0.549 | 26.22 | −9.351 | 2.136 |
| Q | 95 | 20.824 | 1.80 × 10⁻³ | 1.80 × 10⁻³ | −0.633 | 14.31 | −8.219 | 2.497 |
| A | 95 | 15.302 | 1.32 × 10⁻³ | 1.32 × 10⁻³ | −0.591 | 19.48 | −5.001 | 6.012 |
| 6 M H 2 SO 4 + 10% NaCl | ||||||||
| N | 70 | 16.090 | 1.39 × 10⁻³ | 1.39 × 10⁻³ | −0.566 | 18.52 | −3.378 | 5.904 |
| Q | 70 | 35.812 | 3.09 × 10⁻³ | 3.09 × 10⁻³ | −0.589 | 8.32 | −4.703 | 5.162 |
| A | 70 | 26.485 | 2.28 × 10⁻³ | 2.28 × 10⁻³ | −0.604 | 11.25 | −5.693 | 4.821 |
| N | 95 | 14.304 | 1.23 × 10⁻³ | 1.23 × 10⁻³ | −0.465 | 20.84 | −6.363 | 8.683 |
| Q | 95 | 92.888 | 8.01 × 10⁻³ | 8.01 × 10⁻³ | −0.577 | 3.21 | −1.647 | 8.233 |
| A | 95 | 40.336 | 3.48 × 10⁻³ | 3.48 × 10⁻³ | −0.475 | 7.39 | −0.642 | 4.273 |
Potentiostatic data for B265TiN, B265TiQ, and B265TiA metastable pitting activity and passivation behavior in 2–10 M H2SO4 + 10% NaCl at 30°C
| H2SO4 Conc./10% NaCl | Corrosion potential (V) | Metastable pitting initiation potential (V) | Metastable pitting initiation current (A) | Passivation current (A) | Passivation potential (V) | Metastable pitting -passivation potential range (V) | Metastable pitting -passivation current range (A) | Metastable pitting tendency (V) |
|---|---|---|---|---|---|---|---|---|
| B265TiN | ||||||||
| 10 M | −0.523 | −0.430 | 4.20 × 10⁻³ | 4.72 × 10⁻⁵ | −0.010 | 0.420 | 4.15 × 10⁻³ | 0.093 |
| 8 M | −0.580 | −0.450 | 1.20 × 10⁻³ | 2.08 × 10⁻⁵ | −0.070 | 0.380 | 1.18 × 10⁻³ | 0.130 |
| 6 M | −0.640 | −0.410 | 5.70 × 10⁻⁴ | 4.46 × 10⁻⁵ | −0.130 | 0.280 | 5.25 × 10⁻⁴ | 0.230 |
| 4 M | −0.699 | −0.460 | 1.00 × 10⁻⁴ | 2.01 × 10⁻⁵ | −0.190 | 0.270 | 7.99 × 10⁻⁵ | 0.239 |
| 2 M | −0.647 | −0.370 | 2.88 × 10⁻⁵ | 1.79 × 10⁻⁵ | −0.190 | 0.180 | 1.09 × 10⁻⁵ | 0.277 |
| B265TiQ | ||||||||
| 10 M | −0.491 | −0.470 | 6.40 × 10⁻³ | 4.79 × 10⁻⁵ | 0.010 | 0.480 | 6.35 × 10⁻³ | 0.021 |
| 8 M | −0.595 | −0.480 | 1.50 × 10⁻³ | 2.08 × 10⁻⁵ | −0.010 | 0.470 | 1.48 × 10⁻³ | 0.115 |
| 6 M | −0.524 | −0.430 | 3.80 × 10⁻⁴ | 3.25 × 10⁻⁵ | −0.160 | 0.270 | 3.48 × 10⁻⁴ | 0.094 |
| 4 M | −0.677 | −0.460 | 1.60 × 10⁻⁴ | 2.18 × 10⁻⁶ | −0.170 | 0.290 | 1.58 × 10⁻⁴ | 0.217 |
| 2 M | −0.648 | −0.390 | 2.89 × 10⁻⁵ | 1.08 × 10⁻⁵ | −0.170 | 0.220 | 1.81 × 10⁻⁵ | 0.258 |
| B265TiA | ||||||||
| 10 M | −0.461 | −0.490 | 5.90 × 10⁻³ | 5.43 × 10⁻⁵ | −0.010 | 0.480 | 5.85 × 10⁻³ | 0.029 |
| 8 M | −0.467 | −0.510 | 1.30 × 10⁻³ | 2.79 × 10⁻⁵ | −0.080 | 0.430 | 1.27 × 10⁻³ | 0.043 |
| 6 M | −0.568 | −0.480 | 5.30 × 10⁻⁴ | 4.03 × 10⁻⁵ | −0.160 | 0.320 | 4.90 × 10⁻⁴ | 0.088 |
| 4 M | −0.661 | −0.380 | 2.31 × 10⁻⁵ | 4.47 × 10⁻⁶ | −0.170 | 0.210 | 1.86 × 10⁻⁵ | 0.281 |
| 2 M | −0.631 | −0.300 | 1.37 × 10⁻⁵ | 3.63 × 10⁻⁶ | −0.170 | 0.130 | 1.01 × 10⁻⁵ | 0.331 |
3.2 Potentiostatic studies
Potentiostatic data for B265TiN, B265TiQ, and B265TiA alloys at 30°C in 2–10 M H2SO4 + 10% NaCl are displayed in Table 4, while Table 5 depicts the potentiostatic data for B265TiN, B265TiQ, and B265TiA alloys at 70°C in 2 M H2SO4 + 10% NaCl solution. The potentiodynamic plots in Figures 1a–c and 2a displayed significant metastable pitting activity and passivation behavior after anodic polarization. The metastable pitting activity is on account of the nucleation and growth of transient corrosion pits during potential scanning. The pits result from the partial breakdown of TiO2 on the alloy surface under high electric potential especially at sites of flaws and non-metallic inclusions. The metastable pits which grow due to discharge of the dissolving metallic cations from within the pit for a very short time interval eventually collapse after formation of resistant TiO2 on the alloy surface at the passive region [83,84]. The potentiodynamic plot configuration shows that metastable pits nucleate at regions with high potentiostatic current values, while time dependent decrease and collapse of the pits occur with the decrease in the potentiostatic current value [85,86]. The decrease in the potentiostatic current value is synonymous with the growth of TiO2 on the alloy surface until stable passivation is attained. Metastable pit initiation current and potential in Table 4 represents the current (A) and potential (V) value of the estimated region at which transient corrosion pits nucleate [87,88]. Passivation current and potential represents the current (A) and potential value (V) at which TiO2 repassivates on the Ti alloy surface and sufficiently prevents anodic polarization. Generally, the higher the
Potentiostatic data for B265TiN, B265TiQ, and B265TiA metastable pitting activity and passivation behavior in 2 M H2SO4 + 10% NaCl at 70°C
| Titanium specimen | Corrosion potential (V) | Metastable pitting initiation potential (V) | Metastable pitting initiation current (A) | Passivation current (A) | Passivation potential (V) | Metastable pitting -passivation potential range (V) | Metastable pitting -passivation current range (A) | Metastable pitting tendency (V) |
|---|---|---|---|---|---|---|---|---|
| B265TiN | −0.516 | −0.350 | 2.90 × 10⁻³ | 8.36 × 10⁻⁵ | 0.01 | 0.360 | 2.82 × 10⁻³ | 0.170 |
| B265TiQ | −0.585 | −0.400 | 3.30 × 10⁻³ | 1.04 × 10⁻⁴ | −0.02 | 0.380 | 3.20 × 10⁻³ | 0.190 |
| B265TiA | −0.547 | −0.380 | 3.50 × 10⁻³ | 1.74 × 10⁻⁴ | −0.11 | 0.270 | 3.33 × 10⁻³ | 0.170 |
The potentiostatic values for B265TiN, B265TiQ, and B265TiA alloys at 70°C from 2 M H2SO4 + 10% NaCl solution show increased temperature of aqueous environments exposes Ti alloy to accelerated corrosion and localized deterioration compared to corrosion at ambient room temperature (30°C). The metastable pit initiation values (current and potential) for the alloys at 70°C are significantly greater than their counterpart values at 30°C in 2 M H2SO4 + 10% NaCl solution. At 70°C, the metastable pitting initiation current values for B265TiN, B265TiQ, and B265TiA alloys are 2.9 × 10⁻³ A, 3.3 × 10⁻³ A, and 3.5 × 10⁻³ A compared to 2.88 × 10⁻⁵ A, 2.89 × 10⁻⁵ A and 1.37 × 10⁻⁵ A at 30°C. The corresponding potential values show similar trend. High temperature exposes the alloys to the onset of pit formation due to temporary breakdown and passivation of the TiO2 on the alloy surface. Similarly, passivation occurred at higher current and lower potentials which signifies weaker or thinner protective oxide at 70°C compared to 30°C. The metastable pitting-passivation potential range values confirm this assertion as they tend to be significantly larger than the corresponding values at 30°C. This shows extended waiting time before collapse of the transient pits or invariable formation of more stable transient pits. The metastable pitting tendency for the alloys at 70°C agrees with the assertion earlier mention for the parameter at 30°C.
3.3 Optical microscopic studies
Optical representative images for B265TiN, B265TiQ, and B265TiA alloys (mag. ×40 and ×100) prior to and subsequently after corrosion test are displayed in Figures 4–11. Figure 4 displays the representative images for B265TiN, B265TiQ, and B265TiA prior to corrosion. Figures 5–7 display the images of B265TiN, B265TiQ, and B265TiA alloys after corrosion test in 2 M H2SO4 + 10% NaCl and 10 M H2SO4 + 10% NaCl at 30°C, respectively. Figures 8 and 9 show the images for B265TiN, B265TiQ, and B265TiA alloys after corrosion test in 2 M H2SO4 + 10% NaCl and 6 M H2SO4 + 10% NaCl at 70°C, while Figures 10 and 11 show the images for B265TiN, B265TiQ, and B265TiA alloys after corrosion test in 2 M H2SO4 + 10% NaCl and 6 M H2SO4 + 10% NaCl at 95°C, respectively. Observation of Figures 5a and 6a and and 7a shows B265TiN, B265TiQ, and B265TiA alloys are highly resistant to corrosion in 2 M H2SO4 + 10% NaCl due to the resistant TiO2 oxide on the alloy surface [89]. The

Optical representative images for B265TiN, B265TiQ, and B265TiA alloy before corrosion test.

Optical images of B265TiN after corrosion test in (a) 2 M H2SO4 + 10% NaCl and (b) 10 M H2SO4 + 10% NaCl at 30°C.

Optical images of B265TiQ after corrosion test in (a) 2 M H2SO4 + 10% NaCl and (b) 10 M H2SO4 + 10% NaCl at 30°C.

Optical images of B265TiA after corrosion test in (a) 2 M H2SO4 + 10% NaCl and (b) 10 M H2SO4 + 10% NaCl at 30°C.

Optical images of (a) B265TiN, (b) B265TiQ, and (c) B265TiA after corrosion test in 2 M H2SO4 + 10% NaCl at 70°C.

Optical images of (a) B265TiN, (b) B265TiQ, and (c) B265TiA after corrosion test in 6 M H2SO4 + 10% NaCl at 70°C.

Optical images of (a) B265TiN, (b) B265TiQ, and (c) B265TiA after corrosion test in 2 M H2SO4 + 10% NaCl at 95°C.

Optical images of (a) B265TiN, (b) B265TiQ, and (c) B265TiA after corrosion test in 6 M H2SO4 + 10% NaCl at 95°C.
Figures (8a and b) and (9a and b) (from 2 M H2SO4 + 10% NaCl and 6 M H2SO4 + 10% NaCl at 70°C) exhibited severe morphological deterioration at significantly higher degree compared to the images studied earlier at 30°C. This is due to the entropy of the electrolyte, increased agitation of the corrosive species, and their electrochemical interaction with the alloy surface resulting in the thinning out and eventual breakage of the protective TiO2. However, the extent of degradation in Figures 8c and 9c contrasts the observation in Figures (8a and b) and (9a and b). B265TiA (Figures 8c and 9c) appears more resistant to corrosion at 70°C compared to B265TiN and B265TiQ (Figures (8a) and (b) and (9a) and (b)). Annealing heat treatment results in metallurgical features where morphological degradation is minimal. This is more evident in Figure 9c where the metallurgical phases are visible. Similar observation occurred for the alloy in Figures 10a–c and 11a–c.
3.4 Open circuit potential measurement analysis
The active-passive transition behavior and the thermodynamic properties of B265TiN, B265TiQ, and B265TiA alloys in the acid-chloride media were further studied by OCP measurement and presented in Figures 12–14. Figure 12a and b shows the OCP plots of B265TiN, B265TiQ, and B265TiA alloys in 2 M H2SO4 + 10% NaCl solution at 30 and 70°C, while Figures 13(a) and (b) and 14(a) and (b) show the OCP plots of B265TiN, B265TiQ, and B265TiA alloys in 6M H2SO4 + 10% NaCl and 6M H2SO4 + 10% NaCl solutions, respectively, at 30 and 70°C. Generally, the configuration of the OCP plots in Figures 12a and 13a and and 14a substantially contrast the plots in Figures 12b and 13b and and 14b due to the agitated reaction of the

OCP plots of B265TiN, B265TiQ, and B265TiA alloy corrosion in 2 M H2SO4 + 10% NaCl solution at (a) 30°C and (b) 70°C.

OCP plots of B265TiN, B265TiQ, and B265TiA alloy corrosion in 6 M H2SO4 + 10% NaCl solution at (a) 30°C and (b) 70°C.

OCP plots of B265TiN, B265TiQ, and B265TiA alloy corrosion in 10 M H2SO4 + 10% NaCl solution at (a) 30°C and (b) 70°C.
In Figure 14a, the high concentration of the
The plots in Figures 12b and 13b and and 14b significantly vary from their counterparts in Figures 12a, 13a, and 14a as earlier mentioned. While B265TiN and B265TiA in Figure 12b were generally thermodynamically stable with respect to exposure time, their OCP plots were more electronegative than their counterparts in Figure 12a due to reasons mentioned earlier. High temperature exposes the alloy to accelerated deterioration of the alloy surface. However, the behavior of B265TiQ (Figure 12b) contrast the behavior of the other alloys despite significant potential transients and active-passive transition behaviors. The plot of the alloy visibly progressed to electropositive values signifying the evolution of a resistant protective oxide on the alloy exterior. The potential transients show that the protective oxide is highly reactive in the presence of the corrosive species and not thermodynamically stable despite being sufficient and thick enough to reduce the reaction processes causing corrosion [99,100]. In Figure 13b, the protective oxide on B265TiQ alloys proves to be the most resistant being the most electropositive. Its potential initiated at 0.646 V (0 s) and attained an approximate peak electropositive potential at 1251.21 s (−0.579 V) before marginally decreasing to −0.609 V at 3,000 s. This behavior occurred at 6 M
It is observed that the potential transient for B265TiQ in Figure 13b is much widely spaced compared to Figure 12b due to significant failure and repassivation of the protective oxide [101]. At 6 M
4 Conclusion
Untreated B265 titanium alloy exhibited strong resistance to general corrosion at room and elevated temperatures when compared with the quenched and annealed alloy. The quenched alloy was the most vulnerable to corrosion. The potentiodynamic polarization behavior of the alloy shows cathodic reaction mechanisms dominated the redox electrochemical process. The surface morphology of the untreated and heat-treated titanium alloys displayed strong resistance to corrosive degradation in low electrolyte concentration at room temperature. However, from the highest electrolyte concentration, significant general surface degradation was visible for quenched titanium alloy and degradation along grain boundaries for annealed titanium alloy. The extent of degradation was significantly higher in electrolyte at high temperature. The alloys displayed significant metastable pitting activity and passivation behavior with the untreated steel being the most resistant to metastable pits formation. Plots from open circuit potential measurement depict untreated titanium alloy was generally the least vulnerable to corrosion with stable oxide formation at room temperature and comparative low concentration of the electrolyte. Quenched titanium alloy exhibited the least vulnerability to corrosion with highly unstable oxide at higher temperature of the electrolyte.
Acknowledgement
The authors acknowledge the support of Covenant University towards the execution and success of this research.
-
Conflict of interest: Author declare no conflict of interest.
References
[1] Lütjering G, Williams JC. Beta alloys. Berlin: Springer; 2007.Search in Google Scholar
[2] Adam G, Zhang DL, Liang J, Macrae I. A novel process for lowering the cost of titanium. AMR. 2007;147(52):29–30. 10.4028/www.scientific.net/amr.29-30.147.Search in Google Scholar
[3] Fattah-Alhosseini A, Vakili-Azghandi M, Sheikhi M, Keshavarz MK. Passive and electrochemical response of friction stir processed pure titanium. J Alloys Compd. 2017;704:499–508.10.1016/j.jallcom.2017.02.095Search in Google Scholar
[4] Boyer RR. An overview on the use of titanium in the aerospace industry. Mater Sci Eng. 1996;A213:103–14.10.1016/0921-5093(96)10233-1Search in Google Scholar
[5] Yamada M. An overview on the development of titanium alloys for non-aerospace application in Japan. Mater Sci Eng. 1996;A213:8–15.10.1016/0921-5093(96)10241-0Search in Google Scholar
[6] Yaya K, Khelfaoui Y, Malki B, Kerkar M. Numerical simulations study of the localized corrosion resistance of AISI 316l stainless steel and pure titanium in a simulated body fluid environment. Corros Sci. 2011;53:3309–14.10.1016/j.corsci.2011.06.006Search in Google Scholar
[7] Khan MA, Williams RL, Williams DF. In-vitro corrosion and wear of titanium alloys in the biological environment. Biomaterials. 1996;17:2117–26.10.1016/0142-9612(96)00029-4Search in Google Scholar
[8] Barril S, Mischler S, Landolt D. Influence of fretting regimes on the tribocorrosion behaviour of Ti6Al4V in 0.9 wt% sodium chloride solution. Wear. 2004;254:963–72.10.1016/j.wear.2003.11.003Search in Google Scholar
[9] Duisabeau L, Combrade P, Forest B. Environmental effect on fretting of metallic materials for orthopaedic implants. Wear. 2004;256:805–16.10.1016/S0043-1648(03)00522-2Search in Google Scholar
[10] Shevchenko N, Pham MT, Maitz MF. Studies of surface modified NiTi alloy. Appl Surf Sci. 2004;235:126–31.10.1016/j.apsusc.2004.05.273Search in Google Scholar
[11] Johansson BI, Bergman B. Corrosion of titanium and amalgam couples: Effect of fluoride, area, size, surface preparation and fabrication procedures. Dent Mater. 1995;11:41–6.10.1016/0109-5641(95)80007-7Search in Google Scholar
[12] Long M, Rack HJ. Titanium alloys in total joint replacement – a materials science perspective. Biomaterials. 1998;19:1621–39.10.1016/S0142-9612(97)00146-4Search in Google Scholar
[13] Leyens C, Peters M. Titanium and titanium alloys: fundamentals and applications. New York: Wiley; 2003.10.1002/3527602119Search in Google Scholar
[14] Schutz RW. Defining the corrosion performance window grade 28 Titanium. San Diego, California: NACE Corrosion; 2003.Search in Google Scholar
[15] Thomas R. Titanium in the geothermal industry. Geothermics. 2003;32:679–87.10.1016/j.geothermics.2003.08.004Search in Google Scholar
[16] Contu F, Elsener B, Böhni H. Serum effect on the electrochemical behaviour of titanium, Ti6Al4V and Ti6Al7Nb alloys in sulphuric acid and sodium hydroxide. Corros Sci. 2004;46:2241–54.10.1016/j.corsci.2004.01.005Search in Google Scholar
[17] Narayanan R, Seshadri SK. Point defect model and corrosion of anodic oxide coatings on Ti–6Al–4V. Corros Sci. 2008;50:1521–9.10.1016/j.corsci.2008.02.023Search in Google Scholar
[18] Tamilselvi S, Raman V, Rajendran N. Evaluation of corrosion behavior of surface modified Ti–6Al–4V ELI alloy in hanks solution. J Appl Electrochem. 2010;40:285–93.10.1007/s10800-009-9972-5Search in Google Scholar
[19] Kaminaka H, Abe M, Matsumoto S, Kimura K, Kamio H. Characteristics and applications of high corrosion resistant titanium alloys. Nippon Steel & Sumitomo Metal Technical Report No. 106; 2004. https://www.nipponsteel.com/en/tech/report/nssmc/pdf/106-07.pdf.Search in Google Scholar
[20] Krawiec H, Vignal V, Loch J, Erazmus-Vignal P. Influence of plastic deformation on the microstructure and corrosion behaviour of Ti–10Mo–4Zr and Ti–6Al–4V alloys in the Ringer’s solution at 37°C. Corros Sci. 2015;96:160–70.10.1016/j.corsci.2015.04.006Search in Google Scholar
[21] Browne M, Gregson PJ. Surface modification of titanium alloy implants. Biomaterials. 1994;15:894–8.10.1016/0142-9612(94)90113-9Search in Google Scholar
[22] Ban S, Hasegaw J, Maruno S. Electrochemical corrosion behaviour of hydroxyapatite-glass-titanium composite. Biomaterials. 1991;12:205–9.10.1016/0142-9612(91)90201-KSearch in Google Scholar
[23] Khan MA, Williams RL, Williams DF. Conjoint corrosion and wear in titanium alloys. Biomaterials. 1991;20:765–72.10.1016/S0142-9612(98)00229-4Search in Google Scholar
[24] Fekry AM, El-Sherif RM. Electrochemical corrosion behavior of magnesium and titanium alloys in simulated body fluid. Electrochim Acta. 2009;54:7280–5.10.1016/j.electacta.2009.07.047Search in Google Scholar
[25] Cheng Y, Hu J, Zhang C, Wang Z, Hao Y, Gao B. Corrosion behavior of novel Ti-24Nb-4Zr-7.9Sn alloy for dental implant application in vitro. J Biomed Mater Res Part B. 2013;101B:287–94.10.1002/jbm.b.32838Search in Google Scholar
[26] Peláz-Abellán E, Rocha-Sousa L, Műller WD, Guastaldi AC. Electrochemical stability of anodic titanium oxide films grown at potentials higher than 3V in a simulated physiological solution. Corros Sci. 2007;49:1645–55.10.1016/j.corsci.2006.08.010Search in Google Scholar
[27] Mansfeld F, Tsai R, Shih H, Litrle B, Ray R, Wagne P. An electrochemical and surface analytical study of stainless steels and titanium exposed to natural seawater. Corros Sci. 1992;33:445–56.10.1016/0010-938X(92)90073-CSearch in Google Scholar
[28] Laboulais JN, Matab AA, Borrásb VA, Muñoza AI. Electrochemical characterization and passivation behaviour of new beta-titanium alloys (Ti35Nb10Ta-xFe). Electrochim Acta. 2017;227:410–8.10.1016/j.electacta.2016.12.125Search in Google Scholar
[29] Simka W, Kaczmarek M, Baron-Wiecheć A, Nawrat G, Marciniak J, Źak J. Electropolishing and passivation of NiTi shape memory alloy. Electrochim Acta. 2010;55:2437–41.10.1016/j.electacta.2009.11.097Search in Google Scholar
[30] El Hadad AA, Barranco V, Jimenez-Morales A, Hickman GJ, Galván JC, Perry CC. Triethylphosphite as a network forming agent enhances in vitro biocompatibility and corrosion protection of hybrid organic–inorganic sol–gel coatings for Ti6Al4V alloys. J Mater Chem B. 2014;2:7955–63.10.1039/C4TB01175ASearch in Google Scholar
[31] Çomakli O, Yetim F. Tribological and electrochemical behavior of Ag2O/ZnO/NiO nanocomposite coating on commercial pure titanium for biomedical applications. Ind Lubr Tribol. 2019;71:1166–76.10.1108/ILT-11-2018-0414Search in Google Scholar
[32] Çomakli O, Yazici M, Yetim T, Yetim AF, Çelik A. Effect of Ti amount on wear and corrosion properties of Ti-doped Al2O3 nanocomposite ceramic coated CP titanium implant material. Ceram Int. 2018;44:7421–8.10.1016/j.ceramint.2018.01.046Search in Google Scholar
[33] Çomakli O, Yazici M, Kovaci H, Yetim T, Yetim AF, Çelik A. Tribological and electrochemical properties of TiO2 films produced on Cp-Ti by sol-gel and SILAR in bio-simulated environment. Surf Coat Technol. 2018;352:513–21.10.1016/j.surfcoat.2018.08.056Search in Google Scholar
[34] Loto CA, Loto CA, Joseph OO, Loto RT. Adsorption and inhibitive properties of Camellia Sinensis for aluminium alloy in HCI. Int J Elect Sci. 2014;9(7):3637–49.10.1016/S1452-3981(23)08037-9Search in Google Scholar
[35] Loto CA, Loto CA, Loto RT, Popoola API. Synergistic effect of tobacco and kola tree extracts on the corrosion inhibition of mild steel in acid chloride. Int J Elect Sci. 2011;6(9):3830–43.10.1016/S1452-3981(23)18292-7Search in Google Scholar
[36] Nabhani M, Razavi RS, Barekat M. Corrosion study of laser cladded Ti–6Al–4V alloy in different corrosive environments. Eng Fail Anal. 2019;97:234–41.10.1016/j.engfailanal.2019.01.023Search in Google Scholar
[37] Al-Mayouf AM, Al-Swayih AA, Al-Mobarak NA. Effect of potential on the corrosion behavior of a new titanium alloy for dental implant applications in fluoride media. Mater Corros. 2004;55:88–94.10.1002/maco.200303697Search in Google Scholar
[38] Chambers B, Venkatesh A, Mishael S. Performance of tantalum-surface alloy on stainless steel and multiple corrosion resistant alloys in laboratory evaluation of deep well acidizing environments. Houston: NACE Corrosion; 2011.Search in Google Scholar
[39] Su Z, Bühl M, Zhou W. Dissociation of water during formation of anodic aluminum oxide. J Am Chem Soc. 2009;131:8697.10.1021/ja902267bSearch in Google Scholar
[40] Kane RD, Srinivasan S, Craig B, Yap KM. A comprehensive study of Ti alloys for high pressure (HPHT) wells. Dallas: NACE Corrosion; 2015.Search in Google Scholar
[41] Schutz RW, Jena BC. Sour service test qualification of a new high-strength Ti alloy-UNS R55400. Dallas: NACE Corrosion; 2015.Search in Google Scholar
[42] Diamanti MV, Codeluppi S, Cordioli A, Pedeferri MP. Effect of thermal oxidation on titanium oxides’ characteristics. J Exp Nanosci. 2009;4(4):365–72.10.1080/17458080902769937Search in Google Scholar
[43] Davis JR. Alloying – understanding the basics. ASM International; 2003. p. 425.Search in Google Scholar
[44] Vaughan J, Alfantazi A. Corrosion of titanium and its alloys in sulfuric acid in the presence of chlorides. J Electrochem Soc. 2006;153(1):B6–B12.10.1149/1.2126580Search in Google Scholar
[45] Jaquez-Muñoz J, Gaona-Tiburcio C, Lira-Martinez A, Zambrano-Robledo P, Maldonado-Bandala E, Samaniego-Gamez O, et al. Susceptibility to pitting corrosion of Ti-CP2, Ti-6Al-2Sn-4Zr-2Mo, and Ti–6Al–4V alloys for aeronautical applications. Metals. 2021;11(7):1002.10.3390/met11071002Search in Google Scholar
[46] Yang X, Dong X, Li W, Feng W, Xu Y. Effect of solution and aging treatments on corrosion performance of laser solid formed Ti–6Al–4V alloy in a 3.5 wt% NaCl solution. J Mater Res Techn. 2020;9(2):1559–68.10.1016/j.jmrt.2019.11.082Search in Google Scholar
[47] Lipsitt HA. Titanium aluminides – an overview. Materials Research Society Symposium Proceedings. Vol. 39; 1984. p. 351–65.10.1557/PROC-39-351Search in Google Scholar
[48] Banerjee D. Ti3Al and its alloys. Intermetallic compounds, principles and practice. Vol. 2. Chichester, England: John Wiley; 1995. p. 91–131.Search in Google Scholar
[49] Huang S, Chesnutt JC. TiAl and its alloys. Intermetallic compounds, principles and practice. Vol. 2. Chichester, England: John Wiley; 1995. p. 73–90.Search in Google Scholar
[50] Yamaguchi M, Inui H. Al3Ti and its L12 variation. Intermetallic compounds, principles and practice. Vol. 2. Chichester, England: John Wiley & Sons Ltd; 1995. p. 73–90.Search in Google Scholar
[51] Djanarthany S, Viala J-C, Bouix J. An overview of monolithic titanium aluminides based on Ti3Al and TiAl. Mats Chem Phys. 2001;72(3):301–19.10.1016/S0254-0584(01)00328-5Search in Google Scholar
[52] Yue TM, Yu JK, Mei Z, Man HC. Excimer laser surface treatment of Ti–6Al–4V alloy for corrosion resistance enhancement. Mater Lett. 2002;52:206–12.10.1016/S0167-577X(01)00395-0Search in Google Scholar
[53] Blanco-Pinzon C, Liu Z, Voisey K, Bonilla FA, Skeldo P, Thompson GE, et al. Excimer laser surface alloying of titanium with nickel and palladium for increased corrosion resistance. Corros Sci. 2005;47:1251–69.10.1016/j.corsci.2004.06.030Search in Google Scholar
[54] Krýsa J, Mráz R, Roušar I. The corrosion rate of titanium in H2SO4. Mats. Chem Phys. 1997;48(1):64–7.10.1016/S0254-0584(97)80079-XSearch in Google Scholar
[55] Bodunrin MO, Chown LH, Merwe JW, Alaneme KK. Corrosion behaviour of Ti-Al-xV-yFe experimental alloys in 3.5 wt% NaCl and 3.5 M H2SO4. Mater Corros. 2018;69(6):770–80.10.1002/maco.201709709Search in Google Scholar
[56] Mogoda A, Ahmad Y, Badawy W. Corrosion behaviour of Ti–6Al–4V alloy in concentrated hydrochloric and sulphuric acids. J Appl Electrochem. 2004;34:873–8.10.1023/B:JACH.0000040447.26482.bdSearch in Google Scholar
[57] Chih CY, Chen JR, Tsai WT. Selective dissolution of Ti–6Al–4V titanium alloy in mixed HCl + H2SO4 solution. Atlanta, Georgia: NACE Corrosion; 2009.Search in Google Scholar
[58] Falodun OE, Obadele BA, Oke SR, Maja ME, Ige OO, Olubambi PA. Corrosion behaviour of spark plasma sintered Ti–6Al–4V with Nano-TiN addition in different media. IEEE 9th International Conference on Mechanical and Intelligent Manufacturing Technologies; 2018. p. 60–310.1109/ICMIMT.2018.8340421Search in Google Scholar
[59] Ciszak C, Popa L, Brossard J-M, Monceau D, Chevalier S. NaCl induced corrosion of Ti–6Al–4V alloy at high temperature. Corros Sci. 2016;110:91–104.10.1016/j.corsci.2016.04.016Search in Google Scholar
[60] Yang J, Yang H, Yu H, Wang Z, Zeng X. Corrosion behavior of additive manufactured Ti–6Al–4V alloy in NaCl solution. Metall Mater Trans A. 2017;48:3583–93.10.1007/s11661-017-4087-9Search in Google Scholar
[61] Abdeen DH, Palmer BR. Corrosion evaluation of Ti–6Al–4V parts produced with electron beam melting machine. Rapid Prototyp J. 2017;2(22):322–9.10.1108/RPJ-09-2014-0104Search in Google Scholar
[62] Dai N, Zhang LC, Zhang J, Chen Q, Wu M. Corrosion behavior of selective laser melted Ti–6Al–4V alloy in NaCl solution. Corros Sci. 2017;102:484–9.10.1016/j.corsci.2015.10.041Search in Google Scholar
[63] Ramiresand I, Guastaldi AC. Electrochemical study of the corrosion of TiPd and Ti–6Al–4V electrodes in sodium chloride solutions. Biomecánica. 2001;9(1):61–5.10.5821/sibb.v9i1.1664Search in Google Scholar
[64] Atapour M, Pilchak A, Frankel GS, Williams JC, Fathi MH, Shamanian M. Corrosion behavior of Ti–6Al–4V with different thermomechanical treatments and microstructures. Corrosion. 2010;66(6):065004–9.10.5006/1.3452400Search in Google Scholar
[65] ASTM G59-97. Standard test method for conducting potentiodynamic polarization resistance measurements; 2014. http://www.astm.org/Standards/G31 [Accessed 06/04/21].Search in Google Scholar
[66] ASTM G1-03. Standard practice for preparing, cleaning, and evaluating corrosion test specimens; 2011. http://www.astm.org/Standards/G1 [Accessed 06/04/21].Search in Google Scholar
[67] ASTM G102-89. Standard practice for calculation of corrosion rates and related information from electrochemical measurements; 2015. http://www.astm.org/Standards/G102.htm [Accessed 06/04/21].Search in Google Scholar
[68] Basics of corrosion measurements. http://www.che.sc.edu/faculty/popov/drbnp/ECHE789b/Corrosion%20Measurements.pdf [Accessed 06/04/21].Search in Google Scholar
[69] Loto RT, Loto CA, Popoola API, Kupolati W. Corrosion inhibition effect of N, N-diphenylthiourea on the electrochemical characteristics of mild steel in dilute acidic environments. J Chem Soc Pakistan. 2016;38(2):222–33.Search in Google Scholar
[70] Zhang XD, Bonniwell P, Fraser HL, Baeslack III WA, Evans DJ, Ginter T, et al. Effect of heat treatment and silicon addition on the microstructure development of Ti–6Al–2Cr–2Mo–2Sn–2Zr alloy. Mater Sci Eng A. 2003;343(1–2):210–26.10.1016/S0921-5093(02)00381-7Search in Google Scholar
[71] Raj B, Mudali UK. Materials development and corrosion problems in nuclear fuel reprocessing plants. Prog Nucl Energy. 2006;48(4):283–313.10.1016/j.pnucene.2005.07.001Search in Google Scholar
[72] Cotolan N, Pop A, Marconi D, Ponta O, Muresan LM. Corrosion behaviour of TiO2-coated Ti-6Al-7Nb surfaces obtained by anodic oxidation in sulphuric or acetic acid. Mater Corros. 2015;66(7):635–42.10.1002/maco.201407687Search in Google Scholar
[73] Shu YH, Wang FH, Wu WT. Corrosion behavior of Ti60 alloy coated with a solid NaCl deposit in O2 plus water vapor at 500–700°C. Oxid Met. 1999;52:463–73.10.1023/A:1018864216554Search in Google Scholar
[74] Shu YH, Wang F, Wu WT. Synergistic effect of NaCl and water vapor on the corrosion of 1Cr-11Ni-2W-2Mo-V steel at 500–700°C. Oxid Met. 1999;51:97–110.10.1023/A:1018854202982Search in Google Scholar
[75] Shu YH, Wang FH, Wu WT. Corrosion behavior of pure Cr with a solid NaCl deposit in O2 plus water vapour. Oxid Met. 2000;54:457–71.10.1023/A:1004690518225Search in Google Scholar
[76] Dini C, Costa RC, Sukotjo C, Takoudis CG, Mathew MT, Barão VAR. Progression of bio-tribocorrosion in implant dentistry, Front. Mech Eng. 2020;6:1–14.10.3389/fmech.2020.00001Search in Google Scholar
[77] Zhang L, Chen L. A review on biomedical titanium alloys: Recent progress and prospect. Adv Eng Mater. 2019;21:1801215.10.1002/adem.201801215Search in Google Scholar
[78] Noronha Oliveira M, Schunemann WVH, Mathew MT, Henriques B, Magini RS, Teughels W, et al. Can degradation products released from dental implants affect peri-implant tissues? J Periodontal Res. 2017;6:1–11.10.1111/jre.12479Search in Google Scholar PubMed
[79] Mombelli A, Hashim D, Cionca N. What is the impact of titanium particles and biocorrosion on implant survival and complications? A critical review. Clin Oral Implant Res. 2018;29(18):37–53.10.1111/clr.13305Search in Google Scholar PubMed
[80] Zhang LC, Chen LY, Wang L. Surface modification of titanium and titanium alloys: technologies, developments, and future interests. Adv Eng Mater. 2020;22:1901258.10.1002/adem.201901258Search in Google Scholar
[81] Bourikas K, Hiemstra T, Van Riemsdijk WH. Ion pair formation and primary charging behavior of titanium oxide (Anatase and Rutile). Langmuir. 2001;17:749–56.10.1021/la000806cSearch in Google Scholar
[82] Mischler S. Triboelectrochemical techniques and interpretation methods in tribocorrosion: a comparative evaluation. Tribol Int. 2008;41:573–83.10.1016/j.triboint.2007.11.003Search in Google Scholar
[83] He X. Electrochemical behavior and passivity of titanium grades 7 and 29 under immersion conditions, U.S. Nuclear Regulatory Commission Contract NRC–02–07–006. San Antonio, Texas: Center for Nuclear Waste Regulatory Analyses; 2011.Search in Google Scholar
[84] Pistorius PC, Burstein GT. Metastable pitting corrosion of stainless steel and the transition to stability. Philos Trans Royal Soc. 1992;341:531–59. 10.1098/rsta.1992.0114.Search in Google Scholar
[85] Tian W, Du N, Li S, Chen S, Wu Q. Metastable pitting corrosion of 304 stainless steel in 3.5% NaCl solution. Corros Sci. 2014;85:372–9.10.1016/j.corsci.2014.04.033Search in Google Scholar
[86] Cheng YF, Wilmott M, Luo JL. Transition criterion of metastable pitting towards stability for carbon steel in chloride solutions. Brit Corr J. 1999;34(4):280–4.10.1179/000705999101500978Search in Google Scholar
[87] Loto RT. Comparative study of the pitting corrosion resistance, passivation behavior and metastable pitting activity of NO7718, NO7208 and 439L super alloys in chloride/sulphate media. J Mater Res Technol. 2019;8(1):623–9.10.1016/j.jmrt.2018.05.012Search in Google Scholar
[88] Loto RT, Loto CA. Comparative assessment of the pitting corrosion resistance and passivation behaviour of 439L ferritic and 904L austenitic stainless steels for application in extreme process environments. J Bio Tribo Corr. 2019;5:57. 10.1007/s40735-019-0249-1.Search in Google Scholar
[89] Gittens RA, Scheideler L, Rupp F, Hyzy SL, Geis-Gerstorfer J, Schwartz Z, et al. A review on the wettability of dental implant surfaces II: Biological and clinical aspects. Acta Biomater. 2014;10:2907–18.10.1016/j.actbio.2014.03.032Search in Google Scholar PubMed PubMed Central
[90] Virtanen S. Degradation of Titanium and Its Alloys. In: Eliaz N, editor. Degradation of implant materials. New York, NY: Springer; 2012. 10.1007/978-1-4614-3942-4_2.Search in Google Scholar
[91] Brauns E, Schwenk W. Contribution to the kinetics of pitting corrosion on passive chromium-nickel steels. Mater Corros. 1961;12:73–80.10.1002/maco.19610120202Search in Google Scholar
[92] Schwenk W. Theory of stainless steel pitting. Corrosion. 1964;20(4):129t–137t.10.5006/0010-9312-20.4.129tSearch in Google Scholar
[93] Bond AP, Lizlovs AZ. Anodic polarization of austenitic stainless steels in chloride media. J Electrochem Soc. 1968;115(11):1130.10.1149/1.2410923Search in Google Scholar
[94] Forchhammer P, Engell HJ. Investigations into pitting corrosion on passive austenitic chromium-nickel steels in neutral chloride solutions. Mater Corros. 1969;20:1–12.10.1002/maco.19690200103Search in Google Scholar
[95] Hisamatsu Y, Yoshii T, Matsumra Y. Localized corrosion, NACE-3. Houston: NACE; 1974. p. 427.Search in Google Scholar
[96] Sato N. Anodic breakdown of passive films on metals. J Electrochem Soc. 1982;129:255–9.10.1149/1.2123808Search in Google Scholar
[97] Williams DE, Fleischmann M, Stewart J, Brooks T. Some characteristics of the initiation phase of pitting corrosion of stainless steel. Mater Sci Forum. 1986;8:151–66.10.4028/www.scientific.net/MSF.8.151Search in Google Scholar
[98] Frankel GS, Stockert L, Hunkeler F, Böhni H. Metastable pitting of stainless steel. Corrosion. 1987;43:429–36.10.5006/1.3583880Search in Google Scholar
[99] Jaquez-Munoz JM, Gaona-Tiburcio C, Cabral-Miramontes J, Nieves-Mendoza D, Maldonado-Bandala E, Olguin-Coca J, et al. Electrochemical noise analysis of the corrosion of titanium alloys in NaCl and H2SO4 solutions. Metals. 2021;11:105.10.3390/met11010105Search in Google Scholar
[100] Cui J, Yu D, Long Z, Xi B, He X, Pei Y. Application of electrochemical noise (EN) technology to evaluate the passivation performances of adsorption and film-forming type corrosion inhibitors. J Electroanal Chem. 2019;855:113584.10.1016/j.jelechem.2019.113584Search in Google Scholar
[101] Pistorius PC, Burstein GT. Metastable pitting corrosion of stainless steel and the transition to stability. Philos Trans Royal Soc. 1992;341:531–59. 10.1098/rsta.1992.0114.Search in Google Scholar
© 2022 Roland Tolulope Loto, published by De Gruyter
This work is licensed under the Creative Commons Attribution 4.0 International License.
Articles in the same Issue
- Regular Articles
- Performance of a horizontal well in a bounded anisotropic reservoir: Part I: Mathematical analysis
- Key competences for Transport 4.0 – Educators’ and Practitioners’ opinions
- COVID-19 lockdown impact on CERN seismic station ambient noise levels
- Constraint evaluation and effects on selected fracture parameters for single-edge notched beam under four-point bending
- Minimizing form errors in additive manufacturing with part build orientation: An optimization method for continuous solution spaces
- The method of selecting adaptive devices for the needs of drivers with disabilities
- Control logic algorithm to create gaps for mixed traffic: A comprehensive evaluation
- Numerical prediction of cavitation phenomena on marine vessel: Effect of the water environment profile on the propulsion performance
- Boundary element analysis of rotating functionally graded anisotropic fiber-reinforced magneto-thermoelastic composites
- Effect of heat-treatment processes and high temperature variation of acid-chloride media on the corrosion resistance of B265 (Ti–6Al–4V) titanium alloy in acid-chloride solution
- Influence of selected physical parameters on vibroinsulation of base-exited vibratory conveyors
- System and eco-material design based on slow-release ferrate(vi) combined with ultrasound for ballast water treatment
- Experimental investigations on transmission of whole body vibration to the wheelchair user's body
- Determination of accident scenarios via freely available accident databases
- Elastic–plastic analysis of the plane strain under combined thermal and pressure loads with a new technique in the finite element method
- Design and development of the application monitoring the use of server resources for server maintenance
- The LBC-3 lightweight encryption algorithm
- Impact of the COVID-19 pandemic on road traffic accident forecasting in Poland and Slovakia
- Development and implementation of disaster recovery plan in stock exchange industry in Indonesia
- Pre-determination of prediction of yield-line pattern of slabs using Voronoi diagrams
- Urban air mobility and flying cars: Overview, examples, prospects, drawbacks, and solutions
- Stadiums based on curvilinear geometry: Approximation of the ellipsoid offset surface
- Driftwood blocking sensitivity on sluice gate flow
- Solar PV power forecasting at Yarmouk University using machine learning techniques
- 3D FE modeling of cable-stayed bridge according to ICE code
- Review Articles
- Partial discharge calibrator of a cavity inside high-voltage insulator
- Health issues using 5G frequencies from an engineering perspective: Current review
- Modern structures of military logistic bridges
- Retraction
- Retraction note: COVID-19 lockdown impact on CERN seismic station ambient noise levels
- Special Issue: Trends in Logistics and Production for the 21st Century - Part II
- Solving transportation externalities, economic approaches, and their risks
- Demand forecast for parking spaces and parking areas in Olomouc
- Rescue of persons in traffic accidents on roads
- Special Issue: ICRTEEC - 2021 - Part II
- Switching transient analysis for low voltage distribution cable
- Frequency amelioration of an interconnected microgrid system
- Wireless power transfer topology analysis for inkjet-printed coil
- Analysis and control strategy of standalone PV system with various reference frames
- Special Issue: AESMT
- Study of emitted gases from incinerator of Al-Sadr hospital in Najaf city
- Experimentally investigating comparison between the behavior of fibrous concrete slabs with steel stiffeners and reinforced concrete slabs under dynamic–static loads
- ANN-based model to predict groundwater salinity: A case study of West Najaf–Kerbala region
- Future short-term estimation of flowrate of the Euphrates river catchment located in Al-Najaf Governorate, Iraq through using weather data and statistical downscaling model
- Utilization of ANN technique to estimate the discharge coefficient for trapezoidal weir-gate
- Experimental study to enhance the productivity of single-slope single-basin solar still
- An empirical formula development to predict suspended sediment load for Khour Al-Zubair port, South of Iraq
- A model for variation with time of flexiblepavement temperature
- Analytical and numerical investigation of free vibration for stepped beam with different materials
- Identifying the reasons for the prolongation of school construction projects in Najaf
- Spatial mixture modeling for analyzing a rainfall pattern: A case study in Ireland
- Flow parameters effect on water hammer stability in hydraulic system by using state-space method
- Experimental study of the behaviour and failure modes of tapered castellated steel beams
- Water hammer phenomenon in pumping stations: A stability investigation based on root locus
- Mechanical properties and freeze-thaw resistance of lightweight aggregate concrete using artificial clay aggregate
- Compatibility between delay functions and highway capacity manual on Iraqi highways
- The effect of expanded polystyrene beads (EPS) on the physical and mechanical properties of aerated concrete
- The effect of cutoff angle on the head pressure underneath dams constructed on soils having rectangular void
- An experimental study on vibration isolation by open and in-filled trenches
- Designing a 3D virtual test platform for evaluating prosthetic knee joint performance during the walking cycle
- Special Issue: AESMT-2 - Part I
- Optimization process of resistance spot welding for high-strength low-alloy steel using Taguchi method
- Cyclic performance of moment connections with reduced beam sections using different cut-flange profiles
- Time overruns in the construction projects in Iraq: Case study on investigating and analyzing the root causes
- Contribution of lift-to-drag ratio on power coefficient of HAWT blade for different cross-sections
- Geotechnical correlations of soil properties in Hilla City – Iraq
- Improve the performance of solar thermal collectors by varying the concentration and nanoparticles diameter of silicon dioxide
- Enhancement of evaporative cooling system in a green-house by geothermal energy
- Destructive and nondestructive tests formulation for concrete containing polyolefin fibers
- Quantify distribution of topsoil erodibility factor for watersheds that feed the Al-Shewicha trough – Iraq using GIS
- Seamless geospatial data methodology for topographic map: A case study on Baghdad
- Mechanical properties investigation of composite FGM fabricated from Al/Zn
- Causes of change orders in the cycle of construction project: A case study in Al-Najaf province
- Optimum hydraulic investigation of pipe aqueduct by MATLAB software and Newton–Raphson method
- Numerical analysis of high-strength reinforcing steel with conventional strength in reinforced concrete beams under monotonic loading
- Deriving rainfall intensity–duration–frequency (IDF) curves and testing the best distribution using EasyFit software 5.5 for Kut city, Iraq
- Designing of a dual-functional XOR block in QCA technology
- Producing low-cost self-consolidation concrete using sustainable material
- Performance of the anaerobic baffled reactor for primary treatment of rural domestic wastewater in Iraq
- Enhancement isolation antenna to multi-port for wireless communication
- A comparative study of different coagulants used in treatment of turbid water
- Field tests of grouted ground anchors in the sandy soil of Najaf, Iraq
- New methodology to reduce power by using smart street lighting system
- Optimization of the synergistic effect of micro silica and fly ash on the behavior of concrete using response surface method
- Ergodic capacity of correlated multiple-input–multiple-output channel with impact of transmitter impairments
- Numerical studies of the simultaneous development of forced convective laminar flow with heat transfer inside a microtube at a uniform temperature
- Enhancement of heat transfer from solar thermal collector using nanofluid
- Improvement of permeable asphalt pavement by adding crumb rubber waste
- Study the effect of adding zirconia particles to nickel–phosphorus electroless coatings as product innovation on stainless steel substrate
- Waste aggregate concrete properties using waste tiles as coarse aggregate and modified with PC superplasticizer
- CuO–Cu/water hybrid nonofluid potentials in impingement jet
- Satellite vibration effects on communication quality of OISN system
- Special Issue: Annual Engineering and Vocational Education Conference - Part III
- Mechanical and thermal properties of recycled high-density polyethylene/bamboo with different fiber loadings
- Special Issue: Advanced Energy Storage
- Cu-foil modification for anode-free lithium-ion battery from electronic cable waste
- Review of various sulfide electrolyte types for solid-state lithium-ion batteries
- Optimization type of filler on electrochemical and thermal properties of gel polymer electrolytes membranes for safety lithium-ion batteries
- Pr-doped BiFeO3 thin films growth on quartz using chemical solution deposition
- An environmentally friendly hydrometallurgy process for the recovery and reuse of metals from spent lithium-ion batteries, using organic acid
- Production of nickel-rich LiNi0.89Co0.08Al0.03O2 cathode material for high capacity NCA/graphite secondary battery fabrication
- Special Issue: Sustainable Materials Production and Processes
- Corrosion polarization and passivation behavior of selected stainless steel alloys and Ti6Al4V titanium in elevated temperature acid-chloride electrolytes
- Special Issue: Modern Scientific Problems in Civil Engineering - Part II
- The modelling of railway subgrade strengthening foundation on weak soils
- Special Issue: Automation in Finland 2021 - Part II
- Manufacturing operations as services by robots with skills
- Foundations and case studies on the scalable intelligence in AIoT domains
- Safety risk sources of autonomous mobile machines
- Special Issue: 49th KKBN - Part I
- Residual magnetic field as a source of information about steel wire rope technical condition
- Monitoring the boundary of an adhesive coating to a steel substrate with an ultrasonic Rayleigh wave
- Detection of early stage of ductile and fatigue damage presented in Inconel 718 alloy using instrumented indentation technique
- Identification and characterization of the grinding burns by eddy current method
- Special Issue: ICIMECE 2020 - Part II
- Selection of MR damper model suitable for SMC applied to semi-active suspension system by using similarity measures