Switching transient analysis for low voltage distribution cable
-
Sanhita Mishra
 ,
Sarat Chandra Swain
,
Sarat Chandra Swain

Abstract
Low voltage cable is primarily connected from the transmission system to several household applications. It is quite common that switching transient in the power system during the energization of the high voltage and low voltage cables have a very crippling effect on the cable as well as the power system components. Hence, an experiment has been performed in the laboratory with a low voltage cable-connected motor system. The experimental results have been validated in the simulation platform, and they are capable of predicting the transient behavior during power cable energization. The effect of transients on power cables during the energization of devices has been investigated in this study in the form of voltage, current, and frequency. Discrete wavelet transform is implemented for the decomposition of the transient current. The generated approximation signal is used to quantify the severity during switching transient condition.
1 Introduction
The power distribution network faces many challenging tasks due to rapid urbanization and huge demand for reliable, uninterrupted power supply. Unavailability of space and frequent occurrence of faults in overhead transmission system like hindrances majorly help in replacing overhead lines with underground (UG) cables. Nowadays, UG cable networks have become an essential element for smart cities and smart-grids. As the distribution systems are majorly dependent upon low voltage grid, continuous monitoring of low voltage cable is important for the proper protection of the power system. Besides, the integration of renewable sources with the distribution system, power quality improvement, and reliability study of low voltage cables creates a new platform to do further research in the field of UG cables. The low voltage power cables [1] are mostly considered as multi-conductor transmission lines. They experience very slow incipient fault as well as fast transients which not only reduces the efficiency of the cable but also creates severe power quality issues. The transients in UG cables are majorly induced due to load switching, faults, capacitor switching, transformer energization, etc. A specific reason behind the transients must be studied so that proper countermeasures can be taken care of in the future. A typical cable comprises many semiconducting and metallic layers, this causes significant changes in the current and voltage signals during transient disturbances. The authors of refs. [2,3] have classified switching transients into three main distinguishable groups. Energization, de-energization, and reclosure. Energization and de-energization [3,4] of the system elements like cable line, transformer, reactor, switches, and breaker create switching transient and multiple re-strikes in voltage and current waveform. The overvoltage reduces the reflection coefficient at the output terminal of the cable and thereby affect the voltage wavefront during transient conditions.
So in ref. [5], the authors have measured the peak switching overvoltage of a cable-connected motor system through experimental validation. Thirty percent of the rated voltage is mostly considered as overvoltage. Besides, flashover also causes a momentary outage because of the tripping of protective devices. Cable system parameters such as cable metallic sheath and jacket thickness, ferromagnetic shielding, and mechanical thermal effect also have a great influence on transient voltage waveform [6]. The authors in ref. [7] presented transmission cable system modeling and protection to avoid the temporary overvoltage. However, for transient studies, accurate modeling of UG cable is essential. Both series impedance and shunt admittance calculation are essential factors for electromagnetic transient modeling in UG cable. There are several methods for accurate calculation of impedance in UG cable. Ametani and Fuse [8] presented a numerical method for impedance and admittance calculation of the cable having an arbitrary cross-section. Habib and Kordi implemented modal analysis [9] for evaluating per unit parameter of an arbitrary cross-sectioned cable. Besides, the finite element analysis method (FEM) has been introduced in ref. [10] for impedance matrix formation of a three-core cable. Further improvisation has been made by Shafieipour et al. with the implementation of a novel method-of-moment [11] for parameter calculation of several structured cables. A comparative study has also been performed with FEM. The traveling wave phenomena [12] is also one of the methods used by many researchers in designing a basic model to analyze transients in UG cables.
Even though low voltage (LV) power cables are at low risk for their transient issues in comparison to medium voltage and high voltage cables, still, modeling of such cable and their transients are needed to be detected as quickly as possible. So, it is a challenging task to model and analyze the switching transient phenomena with a LV cable. It not only helps the power engineer for doing power quality assessment but also for studying fault analysis, proper circuit breaker operation, protection of electronic devices, and health monitoring of the network. Hence, in this study, switching LV cable-connected motor system has been modeled. Severity quantification of the switching transient has been performed by determining the detailed and approximate coefficient of the current signal implementing discrete wavelet transform (DWT).
Recent methods frequently rely on various techniques for extracting useful features from electrical signals. Besides, insulation breakdown, stress, cable aging, incipient fault, and switching transients like abnormalities should be continuously monitored before the permanent failure of the cable occurs. Several researchers have already presented many methods for detecting the incipient fault which is considered as small magnitude fault current, persists for one-fourth cycle to four cycles. Still, such fault needs to be detected as quickly as possible, so in ref. [13], the authors have mentioned CUSUM and ADALINE for incipient fault detection in a cable. The main features of ADALINE are online training which is based on input change, it has major advantages of high precision and high speed. But during switching [14] operation of a cable-connected system, circuit breaker opening or closing mainly causes overvoltage which might damage the power equipment as energy stored in inductance and capacitance interfaced with electrostatic and magnetic energy, respectively, and these electromagnetic forces produce extreme heat generation. When the current flows through the power cable, a time-varying magnetic field is developed and creates an induced current in the metallic conductor as well as metallic sheath. The conductors allow the alternating magnetic field for inducing eddy current which will ultimately heat up the UG cable. Besides, the resistance of the cable conductor is also one of the reasons for the generation of heat in the cable, which can be further studied for future analysis. This exemplifies the importance of transient studies [15,16,17] in power systems. Hossien Heydari et al. [18] used finite element analysis on the 20 kV side, 63 kV/20 kV for EMI mitigation for a LV cable due to switching effect. Feature extraction is an essential method for analyzing various transient signals. There are many applications of DWT in various fields, few of them are highlighted below. DWT [20,21] and fast Discrete S transform [19] are widely used methods to extract essential features from the current and voltage signals. The Fourier analysis is a commonly used signal processing tool that has been used to discover and diagnose problems in UG power cables [22]. DWT in ref. [23] is used as a motivational tool for the researcher where high-frequency components are being considered. For extracting important information from electrical signals, modern techniques mainly rely on numerous transformations. In addition, Patcharoen and Ngaopitakkul [24] implemented DWT for detection and discrimination of capacitor switching and inrush current under various conditions. Furthermore, the authors in ref. [25] suggested hybrid wavelet transform and a modular neural network-based fault detector, classifier, and locator with single-end data for six-phase lines. Besides, in ref. [26], a hybrid artificial neural network-DWT has been implemented to localize the fault in combined overhead line and UG cable. In ref. [27], the author has presented a brief review of various methods used for the detection and classification of faults in the transmission line. In addition, the application of DWT is highly appreciated for the health monitoring of UG cables even if it is difficult to decide the best mother wavelet for transient analysis. Furthermore, an improvised technique based on empirical wavelet transformation and a multi-layer perception extreme learning machine is suggested in ref. [28] to successfully identify complicated power quality disturbance for the categorization of power quality. The model employs a multi-resolution approach of DWT to extract classification features. So this DWT helps in the decomposition and reconstruction of various transient signals. However, the application of DWT in ref. [29] has also been proved as one of the best methods for the detection of fault in an induction motor. In ref. [30], nine power quality disturbances are detected and classified using DWT with multi-resolution signal decomposition. Further improvisation is made by the authors in ref. [31], implementing extension neural network and DWT with Parseval’s theorem for analyzing power quality. In many literature, DWT has been implemented for feature extraction and detection. Hence, further analysis is done by Radhakrishnan et al. [32] for extracting features from various power quality disturbances of a grid-connected photo voltaic system.
Though the above-reported literature is very rich and most of the authors have practically demonstrated the importance of modeling and various applications of DWT, but to the best of our knowledge, very few papers have modeled a LV cable. Generally, the time-dependent model is of two types lumped parameter model and the distributed parameter model. In the present problem, distributed parameter model has been applied to evaluate the result. Based on the distribution parameter theory, the cable has been modeled and impedance calculation of the LV four-core cable has also been significantly discussed in this article.
For the protection of any system, a real-time model is always helpful for analysis, design, and control. In this study, an experimental setup has been developed with a LV cable-connected induction motor system and the transient current signature has been validated in the simulation platform. Besides, DWT has been implemented for determining the detailed as well as approximate coefficient for further quantifying the severity of switching transient phenomena. Section 2 describes the research method. Section 3 represents the modeling of LV cable system. Section 4 represents the experimental setup and Section 5 represents the result analysis. Section 6 represents the conclusion of the work.
2 Research method
The cable under test having PVC insulation consists of four sector-shaped aluminum [1] conductors. The cable is shielded by aluminum strips. As per the diagram shown in Figure 1, it has been mathematically modeled based on distributed parameter theory. The formation of high-frequency voltage and current has the results of energizing a low voltage UG cable leading to the short and long-term breakdown of insulation. To protect the UG cable from all the hazards it is necessary to evaluate the performance of this high-frequency voltage and current. From the literature survey, it is found that the behavior of the transient voltage and current is being affected by several factors.

Four core sector-shaped cable.
Transients in the UG cable depend upon the closing of the circuit breaker as well as the closing contact of power frequency voltage. This means that if the circuit breaker was closed except the zero-crossing point, then it produces a high transient current. Higher the rating of the current level, higher the chances of failure of insulation and nearby components present in the UG cable. Therefore, determination of peak value and its coordination among the protection scheme is a great challenge from the power quality evaluation point of view. Statistical, as well as dynamic, modeling of these power cables is necessary for calculating accurate frequency-dependent values. The detailed methodology for the analysis of transient phenomena occurring in an UG cable is shown in Figure 2 as a process flow chart.
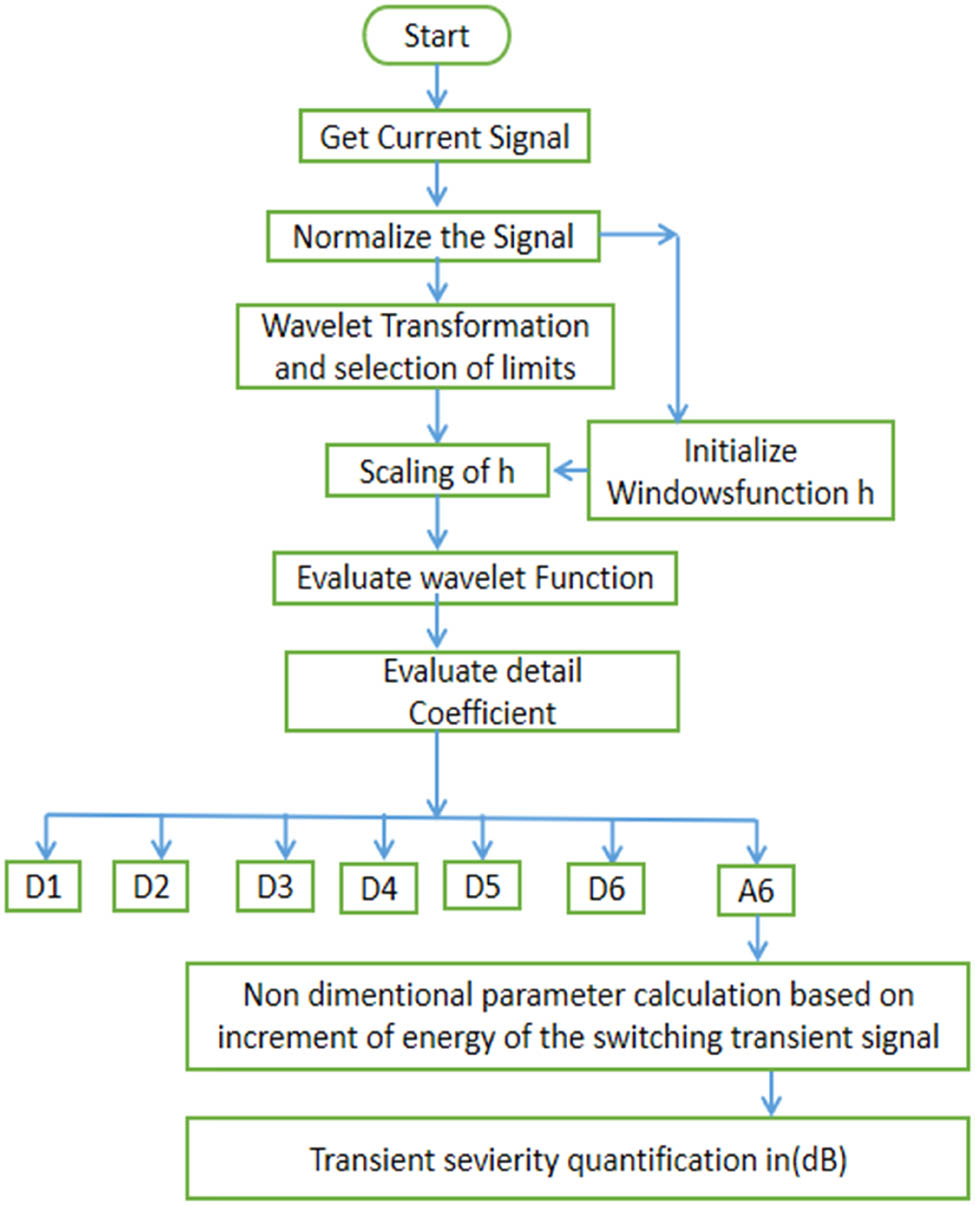
Process flow chart for transient analysis using DWT for an underground cable.
In the present study, emphasis has been given to successfully evaluate the transient phenomena occurring in an UG cable with the help of DWT. This results in a successful design of power system components and its protection system related to UG cables. There are various types of UG cable model presented in refs. [34,35,36]. The detailed modeling of the UG cable has been illustrated in Section 3.
A detailed analysis can be initiated after capturing the signal from the UG cable. After successful initialization of the windows function, the DWT will evaluate the scaling of “h” followed by the calculation of DWT coefficients. Here in this present work, coefficients were evaluated from frequency range of 19.53–1,250 Hz.
3 Mathematical modeling
In Figure 3, cores P, Q, R, and N represent four cores [33], that is, three cores and one neutral wire, and G represents the armor of the cable. Here CPG depicts the capacitance between conductor P and armor. Similarly, there exists capacitance between each conductor and the armor. Also, there exists a mutual capacitance between the individual conductors. So the mathematical model [35,36,37,38,11] helps in calculation and formation of impedance and admittance matrix of the cable used in this system. R, L, C, and G symbolize resistance, inductance, conductance, and capacitance, respectively. V(l, t) and i(l, t) are calculated based upon the time t and distance l considered from sending end to the receiving end.

Mathematical modeling of four-core cable.
The current flow and the voltage drop across the core of each conductor (n = P, Q, R, N, and G) can be calculated by considering the physical and geometrical property of the cable used in the experiment. There exists mutual inductance between conductors n and s, which is represented as
The above four equations can be represented in a simplified form as presented in equation (5).
where
In the same way the admittance matrix or the capacitance matrix can be presented as shown in equation (8). From the above description, Z matrix of a four-core PVC cable can be represented as:
where
4 Experimental setup
An experimental setup has been designed with a four-core, PVC insulated, flat shaped armored cable with circular solid aluminum conductor having length of 50 m with rated voltage of 1.1 kV. The experimental setup is presented in Figure 4. A 400 V supply is connected with 10 mm2, four-core, PVC insulated armored cable having approximate AC resistance of 3.95 ohm/km, approximate capacitance of 0.6 microfarad/km, and approximate reactance of 0.091 ohm/km with rated current of 46 A. To avoid unnecessary damage to the system proper protection has been taken care of using relay and circuit breaker. We also have used a 3-phase, 1 HP, 50 Hz, 415 V squirrel cage induction motor as a load to examine switching transient. The digital storage oscilloscope (DSO) used in the experiment is specified as 4 channel isolated Tektronix TPSn2014B. Figure 4 shows the experimental setup to determine the inrush transient current during switching of the cable-connected motor system. A standard circuit mentioned in ref. [5] has been considered as a bench marking model for modeling our setup. Modification has been done with the model parameters and the setup as mentioned in ref. [5], for conducting the experiment mentioned in this study. Real-time data has been implemented in the simulation platform to validate the model.

Experimental setup consisting of motor load and cable.
Figure 5 shows the transient current waveform as captured through DSO and its simulated signal compared to real-time signal is shown in Figure 6. The simulation model used to validate the real-time current signal is presented in Figure 7. All R, L, and C parameters and motor data have been implemented in the simulation model to validate the result. During the switching operation [38] of a circuit such as a breaker opening or closing mainly, concerned energy stored in inductance and capacitance interfaced with electrostatic and magnetic energy, respectively. Flashover generally causes a momentary outage because of the tripping of protective devices, if there is an insulation failure, then it may cause permanent damage to the equipment. Hence, it is highly necessary to have a clear understanding of the circuit during the transient period so that necessary steps can be taken for avoiding and minimizing the damaging effect for the transient condition.

Current waveform captured through DSO.

Simulated signal and real-time signal validation.
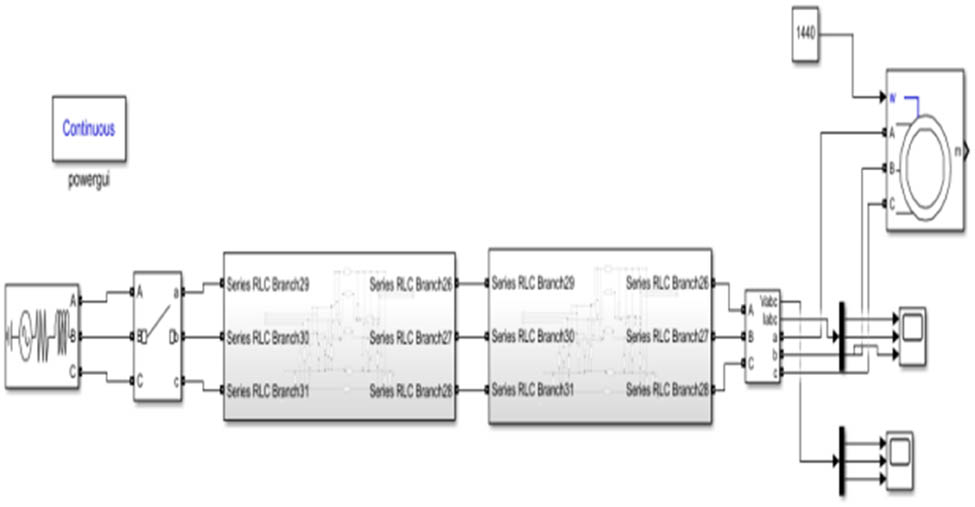
Simulated model of cable-connected motor system.
To study the effect on switching transients of a cable-connected motor system, application of wavelet transform has been focused. This DWT mainly selects the suitable wavelet for switching transient and extracts its high-frequency component. For extracting the frequency component, each wavelet signal is connected with a frequency band and f s (in samples per second) is the sampling rate used. The detail signal D i contains the signal components with frequencies in the interval. So DWT helps in selecting a very high frequency for mother wavelet to avoid overlapping between close bands.
5 Result analysis
This study is focused to capture the current signature to analyze the impact of switching transient. The current signal generated with the cable-connected motor system is decomposed using DWT for further analysis. The DWT is a powerful tool that represents the non-stationary signal in terms of time-frequency with perfect time resolution. DWT acts as a filter bank with multiple decomposition levels. Both low pass and high pass filter compositions are presented at each level with detailed and approximate coefficients. Hence, appropriate choice of mother wavelet and calculation of decomposition level helps in the filtering process. A lot of research have already been done in studying various wavelet functions such as Mexican, Morlet, Daubechies, biorthogonal, Gaussian, Hat, Meyer, Coiflet, etc. Many trails have been implemented with several wavelet functions, and for this switching transient analysis Daubechies44 outperforms other wavelet functions. So Daubechies44 has been used as mother wavelet for the present work. The number of decomposition levels is mainly calculated using equation (12).
where

Reconstruction of the signal from the detail coefficients for transient current.
where i
k
represents the kth sample of the given current signal and for the approximation signal, a parameter
Frequency band for wavelet signal
| Level | Signals | Frequency band for
|
|---|---|---|
| D1 | Detail signals | 625–1,250 Hz |
| D2 | 312.5–625 Hz | |
| D3 | 156.25–312.5 Hz | |
| D4 | 78.12–156.25 Hz | |
| D5 | 39.06–78.12 Hz | |
| D6 | 19.53–39.06 Hz | |
| A6 | Approximation signal | 0–19.53 Hz |
Calculation of degree of severity level
| Test | Transient current | Test | Steady state current |
|---|---|---|---|
| Wavelet signal | A6 | Wavelet signal | A6 |
| N b | 0 | N b | 599 |
| N s | 598 | N s | 2,000 |
| Transient current | 1,179.4 dB | Steady-state current | 205.119 dB |
6 Conclusion
This article presents an experimental analysis of a LV cable-connected motor system. The experimental result has been validated in the simulation platform by proper modeling of the cable. Decomposition of the transient current signature has been performed by the application of DWT. The approximate signal is used to evaluate a non-dimensional parameter based on the increment of energy of the wavelet signal. This non-dimensional parameter quantifies the severity of the transient disturbance. It has been proved that it is highly case sensitive according to the analysis. The accuracy in the output result depends upon the accuracy in the Matlab Simulink model and the available input data. However, there are certain situations in the real-time problem where data are very limited, therefore an assumption has been made for evaluating the critical accuracy in the modeling. Accurate circuit breaker rating and the relay operation can be performed by proper quantification of the severity parameter. Various transients can be generated in the LV cable and DWT can be used as a feature extraction tool for classifying the transients. As per the nature of the transients, a proper protection method can be adopted to avoid unnecessary damage to the system.
Acknowledgements
The authors would like to thank the school of electrical engineering, KIIT University for providing the necessary laboratory facility and library for successful modeling and testing of the proposed system.
-
Conflict of interest: Authors state no conflict of interest.
-
Data availability statement: The authors confirm that the data supporting the findings of this study are available within the article and its supplementary materials.
References
[1] Kruizinga B, Wouters PAAF, Steennis EF. High frequency modeling of a shielded four-core low voltage underground power cable. IEEE Trans Dielectr Electr Insulation. 2015;22(2):649–56. 10.1109/TDEI.2015.7076759.Search in Google Scholar
[2] Bak CL, da Silva FF. High voltage AC underground cable systems for power transmission – a review of the Danish experience, part 1. Electr Power Syst Res. 2016;140:984–94.10.1016/j.epsr.2016.05.034Search in Google Scholar
[3] Rahimi S, Wiechowski W, Randrup M, Ostergaard J, Nielsen AH. Identification of problems when using long high voltage AC cable in transmission system I: switching transient problems. 2008 IEEE/PES Transmission and Distribution Conference and Exposition. 2008. p. 1–7, 10.1109/TDC.2008.4517183.Search in Google Scholar
[4] Gole A, Camm EH, Marz MB, Degeneff RC, O’Leary RP, Natarajan R, et al. Modeling guidelines for switching transients report prepared by the switching transients task force of the IEEE Modeling and analysis of system transients working group; 1998.Search in Google Scholar
[5] Agrawal MS, Cdr LT, Anand A. Switching transients in cable connected motor system. IIT Kanpur, U.P, India: NPSC; 1998. p. 446–52.Search in Google Scholar
[6] Alatawneh N. Effects of cable insulations’ physical and geometrical parameters on sheath transients and insulation losses. Int J Electr Power Energy Syst. 2019;110:95–106.10.1016/j.ijepes.2019.02.047Search in Google Scholar
[7] LethBak C, Faria da Silva F. High voltage AC underground cable systems for power transmission – a review of the Danish experience: part 2. Electr Power Syst Res. 2016;140:995–1004.10.1016/j.epsr.2016.05.035Search in Google Scholar
[8] Ametani A, Fuse I. Approximate method for calculating impedance of multiconductor with arbitrary cross-section. Electr Eng Jpn. 1992;112(2):117–23.10.1002/eej.4391120213Search in Google Scholar
[9] Habib S, Kordi B. Calculation of multiconductor underground cables high-frequency per-unit-length parameters using electromagnetic modal analysis. IEEE Trans Power Delivery. 2013;28(1):276–84. 10.1109/TPWRD.2012.2224382.Search in Google Scholar
[10] Hafner A, Luz M, Carpes Jr W. Impedance and admittance calculations of a three-core power cable by the finite element method. Cavtat, Croatia: International Conference on Power Systems; 2015. 10.13140/RG.2.1.4873.5848. Search in Google Scholar
[11] Shafieipour M, Chen Z, Menshov A, De Silva J, Nal Okhmatovski V. Efficiently computing the electrical parameters of cables with arbitrary cross-sections using the method-of-moments. Electr Power Syst Res. 2018;162:37–49.10.1016/j.epsr.2018.04.013Search in Google Scholar
[12] Walling RA, Melchior RD, McDermott BA. Measurement of cable switching transients in underground distribution systems. IEEE Trans Power Delivery. 1995;10(1):534–9.10.1109/61.368357Search in Google Scholar
[13] Jannati M, Vahidi B, Hosseinian SH. Incipient faults monitoring in underground medium voltage cables of distribution systems based on a two-step strategy. IEEE Trans Power Delivery. 2019;34(4):1647–55. 10.1109/TPWRD.2019.2917268.Search in Google Scholar
[14] Daud MZ, Ciufo P, Perera S. A study on the suitability of cable models to simulate switching transients in a 132 kV underground cable. Australian J Electr Electron Eng. 2013;10(1):45–54.10.7158/E11-037.2013.10.1Search in Google Scholar
[15] Bollen MHJ, Styvaktakis E, Yu-Hua Gu I. Categorization and analysis of power system transients. IEEE Trans Power Delivery. 2005;20(3):2298–306. 10.1109/TPWRD.2004.843386.Search in Google Scholar
[16] Chakraborty S, Chatterjee A, Kumar Goswami S. A sparse representation based approach for recognition of power system transients. Eng Appl Artif Intell. 2014;30:137–44. 10.1016/j.engappai.2014.01.009, ISSN 0952 1976.Search in Google Scholar
[17] Pramanik M, Routray A, Mitra P. Accurate real-time estimation of power system transients using constrained symmetric strong tracking square-root cubature kalman filter. IEEE Access. 2019;7:165692–5709.10.1109/ACCESS.2019.2951309Search in Google Scholar
[18] Heydari H, Abbasi V, Faghihi F. Impact of switching-induced electromagnetic interference on low-voltage cables in substations. IEEE Trans Electromagnetic Compatibility. 2009;51(4):937–44. 10.1109/TEMC.2009.2028236.Search in Google Scholar
[19] Krishnanand KR, Dash PK. A new real-time fast discrete s-transform for cross-differential protection of shunt-compensated power systems. IEEE Trans Power Delivery. 2013;28(1):402–10. 10.1109/TPWRD.2012.2221749.Search in Google Scholar
[20] Chakraborty A, Mandal R. A novel technique employing DWT-based envelope analysis for detection of power system transients. 2017 International Conference on Energy, Communication. Data Analytics and Soft Computing (ICECDS); 2017. p. 346–50, 10.1109/ICECDS.2017.8390084.Search in Google Scholar
[21] Osipov Dmitry. Applications of wavelet transform for analysis of electrical transients in power systems: the review. Przegląd Elektrotech. 2016;1.4:164–7, Print.10.15199/48.2016.04.35Search in Google Scholar
[22] Pandey A, Younan NH. Underground cable fault detection and identification via Fourier analysis. 2010 International Conference on High Voltage Engineering and Application. New Orleans, LA: 2010. p. 618–21, 10.1109/ICHVE.2010.5640779.Search in Google Scholar
[23] Guillen D, Idárraga-Ospina G, Cortés C. A new adaptive mother wavelet for electromagnetic transient analysis. J Electr Eng. 2016;67:48–55.10.1515/jee-2016-0007Search in Google Scholar
[24] Patcharoen T, Ngaopitakkul A. Transient inrush current detection and classification in 230 kV shunt capacitor bank switching under various transient-mitigation methods based on discrete wavelet transform. IET Generation, Transm Distrib. 2018;12(15):3718–25.10.1049/iet-gtd.2018.0018Search in Google Scholar
[25] Koley E, Verma K, Ghosh S. An improved fault detection classification and location scheme based on wavelet transform and artificial neural network for six phase transmission line using single end data only. SpringerPlus. 2015;4(1):551. 10.1186/s40064-015-1342.Search in Google Scholar
[26] Ray P, Arya SR, Mishra DP. Intelligence scheme for fault location in a combined overhead transmission line & underground cable. Int J Emerg Electr Power Syst. 2018;19(5):1–18. 10.1515/ijeeps-2017-0277.Search in Google Scholar
[27] Mishra DP, Ray P. Fault detection, location and classification of a transmission line. Neural Comput Appl. 2018;30(5):1377–424. 10.1007/s00521-017-3295-y.Search in Google Scholar
[28] Wang J, Xu Z, Che Y. Power quality disturbance classification based on DWT and multilayer perceptron extreme learning machine. Appl Sci. 2019;9(11):2315.10.3390/app9112315Search in Google Scholar
[29] Rudra Narayan Dash B, Subudhi, Das S. Induction motor stator inter-turn fault detection using wavelet transform technique. 2010 5th International Conference on Industrial and Information Systems; 2010. p. 436–41, 10.1109/ICIINFS.2010.5578663.Search in Google Scholar
[30] Kamthekar PR, Munje RK, Kushare BE. Detection and classification of power quality events using DWT and MSD. 2017 International Conference on Innovative Mechanisms for Industry Applications (ICIMIA); 2017.10.1109/ICIMIA.2017.7975591Search in Google Scholar
[31] Lu S-D, Sian H-W, Wang M-H, Liao R-M. Application of extension neural network with discrete wavelet transform and Parseval’s theorem for power quality analysis. Appl Sci (Basel). 2019;9(11):2228.10.3390/app9112228Search in Google Scholar
[32] Radhakrishnan P, Ramaiyan K, Vinayagam A, Veerasamy V. A stacking ensemble classification model for detection and classification of power quality disturbances in PV integrated power network. Meas (Lond). 2021;175(109025):109025.10.1016/j.measurement.2021.109025Search in Google Scholar
[33] De Paula H, de Andrade DA, Chaves MLR, Domingos JL, de Freitas MAA. Methodology for cable modeling and simulation for high-frequency phenomena studies in PWM motor drives. IEEE Trans Power Electron. 2008;23(2):744–52. 10.1109/TPEL.2007.915759.Search in Google Scholar
[34] Marti JR. Accurate modelling of frequency-dependent transmission lines in electromagnetic transient simulations. IEEE Trans Power Appar Syst. 1982;PAS-101(1):147–57. 10.1109/TPAS.1982.317332.Search in Google Scholar
[35] Aloui T, Ben Amar F, Abdallah HH. Modeling and simulation of a HV shielded underground three-phase cable in both normal and default states: Application to the 150kV connection between Taparoura, Sidimansour and Tyna substations in Sfax-Tunisia. Electr Power Syst Res. 2016;141:91–9.10.1016/j.epsr.2016.07.010Search in Google Scholar
[36] Hafner AA, Caballero PT, Monteiro JH, Costa EC, Kurokawa S, Luz MV, et al. Modeling of power cables with arbitrary cross section: from parameter calculation to electromagnetic transients simulation. J Control Autom Electr Syst. 2017;28:405–17. 10.1007/s40313-017-0308-0.Search in Google Scholar
[37] Shafieipour M, Silva JD, Kariyawasam A, Menshov A, Okhmatovski V. Fast computation of the electrical parameters of sector-shaped cables using single-source integral equation and 2D moment-method discretization. 2017.Search in Google Scholar
[38] Faria da Silva F, Leth Bak C. Electromagnetic transients in power cables. London, Heidelberg, New York Dordrecht: Springer; 2013. 10.1007/978-1-4471-5236-1.Search in Google Scholar
© 2022 Sanhita Mishra et al., published by De Gruyter
This work is licensed under the Creative Commons Attribution 4.0 International License.
Articles in the same Issue
- Regular Articles
- Performance of a horizontal well in a bounded anisotropic reservoir: Part I: Mathematical analysis
- Key competences for Transport 4.0 – Educators’ and Practitioners’ opinions
- COVID-19 lockdown impact on CERN seismic station ambient noise levels
- Constraint evaluation and effects on selected fracture parameters for single-edge notched beam under four-point bending
- Minimizing form errors in additive manufacturing with part build orientation: An optimization method for continuous solution spaces
- The method of selecting adaptive devices for the needs of drivers with disabilities
- Control logic algorithm to create gaps for mixed traffic: A comprehensive evaluation
- Numerical prediction of cavitation phenomena on marine vessel: Effect of the water environment profile on the propulsion performance
- Boundary element analysis of rotating functionally graded anisotropic fiber-reinforced magneto-thermoelastic composites
- Effect of heat-treatment processes and high temperature variation of acid-chloride media on the corrosion resistance of B265 (Ti–6Al–4V) titanium alloy in acid-chloride solution
- Influence of selected physical parameters on vibroinsulation of base-exited vibratory conveyors
- System and eco-material design based on slow-release ferrate(vi) combined with ultrasound for ballast water treatment
- Experimental investigations on transmission of whole body vibration to the wheelchair user's body
- Determination of accident scenarios via freely available accident databases
- Elastic–plastic analysis of the plane strain under combined thermal and pressure loads with a new technique in the finite element method
- Design and development of the application monitoring the use of server resources for server maintenance
- The LBC-3 lightweight encryption algorithm
- Impact of the COVID-19 pandemic on road traffic accident forecasting in Poland and Slovakia
- Development and implementation of disaster recovery plan in stock exchange industry in Indonesia
- Pre-determination of prediction of yield-line pattern of slabs using Voronoi diagrams
- Urban air mobility and flying cars: Overview, examples, prospects, drawbacks, and solutions
- Stadiums based on curvilinear geometry: Approximation of the ellipsoid offset surface
- Driftwood blocking sensitivity on sluice gate flow
- Solar PV power forecasting at Yarmouk University using machine learning techniques
- 3D FE modeling of cable-stayed bridge according to ICE code
- Review Articles
- Partial discharge calibrator of a cavity inside high-voltage insulator
- Health issues using 5G frequencies from an engineering perspective: Current review
- Modern structures of military logistic bridges
- Retraction
- Retraction note: COVID-19 lockdown impact on CERN seismic station ambient noise levels
- Special Issue: Trends in Logistics and Production for the 21st Century - Part II
- Solving transportation externalities, economic approaches, and their risks
- Demand forecast for parking spaces and parking areas in Olomouc
- Rescue of persons in traffic accidents on roads
- Special Issue: ICRTEEC - 2021 - Part II
- Switching transient analysis for low voltage distribution cable
- Frequency amelioration of an interconnected microgrid system
- Wireless power transfer topology analysis for inkjet-printed coil
- Analysis and control strategy of standalone PV system with various reference frames
- Special Issue: AESMT
- Study of emitted gases from incinerator of Al-Sadr hospital in Najaf city
- Experimentally investigating comparison between the behavior of fibrous concrete slabs with steel stiffeners and reinforced concrete slabs under dynamic–static loads
- ANN-based model to predict groundwater salinity: A case study of West Najaf–Kerbala region
- Future short-term estimation of flowrate of the Euphrates river catchment located in Al-Najaf Governorate, Iraq through using weather data and statistical downscaling model
- Utilization of ANN technique to estimate the discharge coefficient for trapezoidal weir-gate
- Experimental study to enhance the productivity of single-slope single-basin solar still
- An empirical formula development to predict suspended sediment load for Khour Al-Zubair port, South of Iraq
- A model for variation with time of flexiblepavement temperature
- Analytical and numerical investigation of free vibration for stepped beam with different materials
- Identifying the reasons for the prolongation of school construction projects in Najaf
- Spatial mixture modeling for analyzing a rainfall pattern: A case study in Ireland
- Flow parameters effect on water hammer stability in hydraulic system by using state-space method
- Experimental study of the behaviour and failure modes of tapered castellated steel beams
- Water hammer phenomenon in pumping stations: A stability investigation based on root locus
- Mechanical properties and freeze-thaw resistance of lightweight aggregate concrete using artificial clay aggregate
- Compatibility between delay functions and highway capacity manual on Iraqi highways
- The effect of expanded polystyrene beads (EPS) on the physical and mechanical properties of aerated concrete
- The effect of cutoff angle on the head pressure underneath dams constructed on soils having rectangular void
- An experimental study on vibration isolation by open and in-filled trenches
- Designing a 3D virtual test platform for evaluating prosthetic knee joint performance during the walking cycle
- Special Issue: AESMT-2 - Part I
- Optimization process of resistance spot welding for high-strength low-alloy steel using Taguchi method
- Cyclic performance of moment connections with reduced beam sections using different cut-flange profiles
- Time overruns in the construction projects in Iraq: Case study on investigating and analyzing the root causes
- Contribution of lift-to-drag ratio on power coefficient of HAWT blade for different cross-sections
- Geotechnical correlations of soil properties in Hilla City – Iraq
- Improve the performance of solar thermal collectors by varying the concentration and nanoparticles diameter of silicon dioxide
- Enhancement of evaporative cooling system in a green-house by geothermal energy
- Destructive and nondestructive tests formulation for concrete containing polyolefin fibers
- Quantify distribution of topsoil erodibility factor for watersheds that feed the Al-Shewicha trough – Iraq using GIS
- Seamless geospatial data methodology for topographic map: A case study on Baghdad
- Mechanical properties investigation of composite FGM fabricated from Al/Zn
- Causes of change orders in the cycle of construction project: A case study in Al-Najaf province
- Optimum hydraulic investigation of pipe aqueduct by MATLAB software and Newton–Raphson method
- Numerical analysis of high-strength reinforcing steel with conventional strength in reinforced concrete beams under monotonic loading
- Deriving rainfall intensity–duration–frequency (IDF) curves and testing the best distribution using EasyFit software 5.5 for Kut city, Iraq
- Designing of a dual-functional XOR block in QCA technology
- Producing low-cost self-consolidation concrete using sustainable material
- Performance of the anaerobic baffled reactor for primary treatment of rural domestic wastewater in Iraq
- Enhancement isolation antenna to multi-port for wireless communication
- A comparative study of different coagulants used in treatment of turbid water
- Field tests of grouted ground anchors in the sandy soil of Najaf, Iraq
- New methodology to reduce power by using smart street lighting system
- Optimization of the synergistic effect of micro silica and fly ash on the behavior of concrete using response surface method
- Ergodic capacity of correlated multiple-input–multiple-output channel with impact of transmitter impairments
- Numerical studies of the simultaneous development of forced convective laminar flow with heat transfer inside a microtube at a uniform temperature
- Enhancement of heat transfer from solar thermal collector using nanofluid
- Improvement of permeable asphalt pavement by adding crumb rubber waste
- Study the effect of adding zirconia particles to nickel–phosphorus electroless coatings as product innovation on stainless steel substrate
- Waste aggregate concrete properties using waste tiles as coarse aggregate and modified with PC superplasticizer
- CuO–Cu/water hybrid nonofluid potentials in impingement jet
- Satellite vibration effects on communication quality of OISN system
- Special Issue: Annual Engineering and Vocational Education Conference - Part III
- Mechanical and thermal properties of recycled high-density polyethylene/bamboo with different fiber loadings
- Special Issue: Advanced Energy Storage
- Cu-foil modification for anode-free lithium-ion battery from electronic cable waste
- Review of various sulfide electrolyte types for solid-state lithium-ion batteries
- Optimization type of filler on electrochemical and thermal properties of gel polymer electrolytes membranes for safety lithium-ion batteries
- Pr-doped BiFeO3 thin films growth on quartz using chemical solution deposition
- An environmentally friendly hydrometallurgy process for the recovery and reuse of metals from spent lithium-ion batteries, using organic acid
- Production of nickel-rich LiNi0.89Co0.08Al0.03O2 cathode material for high capacity NCA/graphite secondary battery fabrication
- Special Issue: Sustainable Materials Production and Processes
- Corrosion polarization and passivation behavior of selected stainless steel alloys and Ti6Al4V titanium in elevated temperature acid-chloride electrolytes
- Special Issue: Modern Scientific Problems in Civil Engineering - Part II
- The modelling of railway subgrade strengthening foundation on weak soils
- Special Issue: Automation in Finland 2021 - Part II
- Manufacturing operations as services by robots with skills
- Foundations and case studies on the scalable intelligence in AIoT domains
- Safety risk sources of autonomous mobile machines
- Special Issue: 49th KKBN - Part I
- Residual magnetic field as a source of information about steel wire rope technical condition
- Monitoring the boundary of an adhesive coating to a steel substrate with an ultrasonic Rayleigh wave
- Detection of early stage of ductile and fatigue damage presented in Inconel 718 alloy using instrumented indentation technique
- Identification and characterization of the grinding burns by eddy current method
- Special Issue: ICIMECE 2020 - Part II
- Selection of MR damper model suitable for SMC applied to semi-active suspension system by using similarity measures