Pre-determination of prediction of yield-line pattern of slabs using Voronoi diagrams
-
 und
und

Abstract
The article presents a new method of predicting the yield-lines of statically loaded slabs, based on roof geometry (straight skeletons) and Voronoi diagrams for a polygon. A surprising analogy was found between the layout of the plate’s yield-lines and the edge lines of the embankments created as a result of the free falling of loose material onto the plate-shaped polygon. According to the proposed method, the yield-lines have the shape not only of segment lines, but also parabolas (in 3D interpretation also hyperbolas). The method proposed here is purely geometric and can be used to pre-determine the shape of the yield-lines. It allows to predict the shape of the grid of the yield-lines for plates with various support methods, including point support. In addition, the method is relatively simple and can be implemented in the standard CAD software environment. However, the method requires knowledge of descriptive geometry in the field of roof skeletons design (straight skeletons) and roofs with restriction.
1 Introduction
Voronoi diagrams are widely used in many fields such as anthropology, astronomy, archaeology, biology, cartography, chemistry, crystallography, ecology, forestry, geography, geology, linguistics, marketing, metallography, meteorology, operations research, physics, physiology, remote sensing, statistics, urban planning, and architecture. Voronoi diagrams can be used to understand the structure of the universe in astronomy, estimate the precipitation process in meteorology, and locate public schools in urban planning [1]. The last spectacular applications of Voronoi diagrams include a description of the natural fracture pattern of basalt rocks [2], recently in the study of the microstructure of materials, route planning for unmanned vehicles, in goods loading management, in modelling the range of anisotropic transmitters, archaeological reconstructions, and representation of ligand-binding sites in proteins [3,4,5,6,7,8]. However, the use of Voronoi diagrams in the design of a solid waste landfill with a given basis can be found in the paper [9].
Geometrical studies on roof (straight skeleton) geometry [10,11,12] and geometric embankments (on the Voronoi diagrams for a polygon) [9,13] have pointed out the authors’ attention to similarities with yield-lines of statically loaded slabs. The authors verified their observations with photographs of a laboratory series of destroyed slabs. Sawczuk and Jaeger [14] made a series of experiments to confirm the use of limit-bearing capacity theory In recent years, this topic has been devoted to work [15,16,17,18,19,20,21,22,23]. The authors of this article compared their results with the result obtained by discontinuity layout optimisation (DLO) procedure [15]. The comparison is highly promising, considering the simplicity of the method presented here. It would be interesting to check the experimental destruction of the slab with the shape and nature of support described in the work [15]. The approach presented here refers to the results obtained in the work of Wüst and Wagner [24]. The method proposed here is purely geometric and can be used to pre-determine the shape of the yield-lines. It allows you to predict the yield-lines of the polygon plate with any differentiated (segment line, point) way of support. In addition, the support does not have to cover all sides of the polygon. It is also worth noting that Wüst and Wagner used straight skeletons, but called it differently ([24], Figures 8, 17, and 20). However, the Authors of the paper [24] do not use Voronoi diagrams. The predicted yield-lines have only the shape of straight sections [24]. Already from the geometric form of the slab and from the geometry of the support, the shape of the yield-lines can be derived. It is a relatively simple tool when it comes to the software used. In addition, it is possible to accurately read the coordinates defining the predicted yield-lines of the slab.
The aim of this article is to present a new method of predicting the yield-lines of statically loaded slabs, based on roof geometry (straight skeletons) and Voronoi diagrams for a polygon.
2 Methodology
The following research plan was adopted in the article. First, the assumptions defining the kinematic mechanism leading to the determination of the geometry of the yield-lines were formulated (Section 3). Then, the relationships between the concept of a geometric roof as a polyhedral surface, a geometric embankment over a polygon as a surface being the sum of a polyhedral surface and surface fragments of rotating cones, and a model of the actual embankment resulting from the behaviour of loose material freely falling onto a flat polygon are discussed. The methods of creating embankments were presented: geometric in the AutoCAD environment, and real in the laboratory (Section 4). In order to demonstrate the above mentioned relationships, the geometric structure of the roof with constraints is given (Subsection 4.1), the essence of the process of the formation of the yield-line (Section 5) and the method of geometric and laboratory modelling of the yield-line (Section 6) are discussed. Then, the created geometric models of the crease lines were visually compared with the available photos of the damaged plates (Section 7). For greater reliability, geometrical (AutoCAD) and laboratory models of the yield-lines were presented for several examples of plates with complex support (Section 8), including geometric and laboratory models for the example of a slab, the yield-lines of which were obtained by the DLO method. A special comparative visual analysis was performed on the plate and yield-line model obtained by the DLO method and the geometric and laboratory models obtained with the methods proposed in this article (Figures 18 and 19).
3 Geometric basics of yield-lines theory of slabs
The theory (method) of yield-lines was created from the synthesis in the lines of plastic joints of the layouts of yield-lines observed in reinforced concrete slabs.
The theory is based on the following assumptions [25]:
Plastic deformations in the plate are concentrated in the yield-lines forming the grid of destruction. The grid of destruction becomes a kinematically admissible mechanism.
The yield-lines connect unformed parts of the board that are moving as rigid bodies.
The bending moment on the boundary line reaches the limit value. For a homogeneous polygonal slab, the authors additionally formulate the following two principles.
In the kinematic mechanism, the rigid parts of the plate rotate around the segments of the support lines (i.e. sides of the polygon) or around the segment lines going through support points (i.e. vertices of the concave angles of the polygon) and perpendicular to the bisectrices of the concave angles. In the second case, the rigid parts of the plate adopt an elastic conical shape.
The yield-lines between two rotating rigid parts of the kinematic mechanism are composed of points equally distant from the support elements (rotation axes of the rigid parts of the mechanism).
The condition 5 is assumed similar to the simple beam – uniformly distributed load. The beam fixed at both ends – uniformly distributed load has the largest bending moment in the midpoint. In this case, the plastic deformation of the concrete beam will focus at the midpoint. Thus, naturally the yield-line of the slab will be placed on the symmetry line of the respective support segment lines. If one of the rigid parts is flat and the other is conical, then the symmetry line is a parabola. If both rigid parts have conical surface, then the symmetry line is a hyperbola (in the orthogonal projection as a straight line) (Figure 3).
The consquence of the adopted assumptions 4 and 5 is the straight-line or parabolic shape of the yield-lines. More generally, assumptions 4 and 5 imply a Voronoi diagram for the polygon as the shape of yield-lines. In the case of a convex polygon, it is a roof, i.e. a straight skeleton (Figure 2).
The hypothetical mechanism of slab behaviour adopted here has its precise implementation in the case of the mechanics of loose materials, namely, it is an analogue of the shape that creates loose material falling freely on a given base (polygon). Hence, when interpreting the yield-lines, the embankment shape is simultaneously illustrated. The ridge line of the embankment indicates the topology of the yield-line pattern. It can be said that the deformed plate has the shape of an inverted embankment (flat “sunken” roof) with very small angles of inclination to the horizontal plane.
4 Geometry of roofs and Voronoi diagrams for a polygon
Roofs discussed in this article are defined as polyhedral surfaces on the basis of two assumptions: (1) all eaves of a roof form a planar (simply connected or k-connected) polygon called the base of the roof, (2) every hipped roof end makes the same angle with the (horizontal) plane which contains the base. Thus, every roof, and equivalently the orthographic projection of this roof onto a plane (parallel to the base), is uniquely defined by its base. Then, it is a straight skeleton, the edges are the axis of symmetry of the respective sides of the polygon. The orthographic projection of the roof, i.e. the skeleton of the roof (in the literature since 1995) called the straight skeleton [10] as the object that can be unequivocally generated from a polygon, was known in descriptive geometry for a very long time [11]. The skeleton of a roof in recent years has been the object of interest of many authors dealing with computational geometry [26,27,28,29,30,31,32,33]. The rectangular projection of the roof is obtained as a chain of segments (polygonal chains) containing bisecting lines of angles of the polygon. The straight skeleton of a polygon is defined by a continuous shrinking process: edges of the polygon are moved inwards parallel to themselves at a constant speed. The straight skeleton may be computed by simulating the shrinking process by which it is defined [10]. In three-dimensional terms, the roof is formed of polygons inclined at the same angle to the base. The structure of roof geometry is closely related to Voronoi diagrams [11,13,34].
Assuming that 〈M, d〉 is an arbitrary metric space and Λ1, Λ2,…, Λ n are n subsets (sites) of M, the Voronoi diagram is defined as follows. For any point X ∈ M, d(X, Λ i ) denotes the distance from the point X to the site Λ i . The region of dominance of Λ i over Λ j is defined by
The Voronoi region for Λ
i
is defined by V(Λ
i
) =
![Figure 1
Voronoi diagrams: (a) a Voronoi diagram for a set of points and (b) a Voronoi diagram for a polygon and a Voronoi region for a side of a polygon [34].](/document/doi/10.1515/eng-2022-0376/asset/graphic/j_eng-2022-0376_fig_001.jpg)
Voronoi diagrams: (a) a Voronoi diagram for a set of points and (b) a Voronoi diagram for a polygon and a Voronoi region for a side of a polygon [34].
For a convex polygon, a straight skeleton coincides with the Voronoi diagram. Elements forming it are bisectors of the polygon angles (Figures 2 and 5, and Table 1). For concave polygon, parabolic arcs appear in addition to the line segments (Figure 5). Parabolic arcs are common parts of planes forming the roof and the surface of the right circular cones. These cones have their vertices at the vertices of the concave angles of the polygon. The angle of opening of these cones is equal to the inclination angle of planes. Then, as common parts of the planes and the surface of the cone, parabolas and, as parts of the two cones, hyperbole are obtained. These conical surfaces and planes model the behaviour of bulk material with an angle of internal friction equal to the angle of opening of the cone [13]. The effect of the embankment formation experiment is illustrated in Figures 2 and 3. The geometric model of the embankment (geometric embankment with visible parabolic arcs and hyperbolic arc) is found in Table 2. A projection of a geometric embankment is presented in Table 2 in the right column and a natural embankment – an experimental effect in Figure 3. Tables 1 and 2 contain the roof skeleton and the associated Voronoi diagram – the objects in the right columns as well as the geometric roof and the geometric embankment – objects in the left columns (Figure 4).

Roof (top view – straight skeleton) over a convex polygon, coinciding with the Voronoi diagram for a polygon, realised with 3D commands: EXTRUDE, TAPER FACES in the AutoCAD software environment in 2013 (source: own edition).
Roof and roof plan – accepted terminology (source: own edition)
| The roof in 3D | Orthogonal projection on the plane of the roof base |
|---|---|

|

|
| A polyhedral surface (or a solid) | Roof skeleton, roof projection, or straight skeleton |
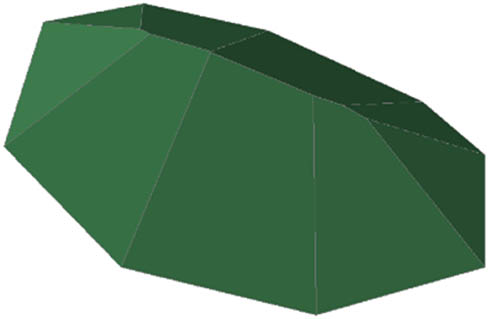
Roof (a straight skeleton) over the convex polygon from Figure 1 in 3D visualisation, realised with 3D commands: EXTRUDE, TAPER FACES in the AutoCAD software environment in 2013.
Embankment and Voronoi diagram – adopted terminology (source: own edition)
| Embankment in 3D | Orthogonal projection on the base plane of the embankment |
|---|---|

|

|
| A solid containing flat walls and surfaces of a circular cone | Voronoi diagram for the embankment base polygon |

Embankment obtained experimentally resting on the polygon (source: own edition).
AutoCAD versions starting from the AutoCAD version v.12 and, with some break, later starting from the AutoCAD version in 2007, allow automatically build a roof in the form of a 3D solid (Figure 5). The creation of the embankment is also possible, but requires manual control or development of a suitable application.
![Figure 5
Top view (horizontal projection) of the embankment obtained experimentally resting on a polygon with four concave angles, including two facing each other. The spine line is made up of line segments: ab, bc, ef, jl, and op; parabolic arcs: cd, de, fh, ij, lm, mn, and no (fg, jk – parabolic arcs as parts of corner edges); straight line segment (hyperbolic arc in 3D) hi, a thin line indicates the roof – a straight skeleton [13].](/document/doi/10.1515/eng-2022-0376/asset/graphic/j_eng-2022-0376_fig_005.jpg)
Top view (horizontal projection) of the embankment obtained experimentally resting on a polygon with four concave angles, including two facing each other. The spine line is made up of line segments: ab, bc, ef, jl, and op; parabolic arcs: cd, de, fh, ij, lm, mn, and no (fg, jk – parabolic arcs as parts of corner edges); straight line segment (hyperbolic arc in 3D) hi, a thin line indicates the roof – a straight skeleton [13].
The terminology and meaning of the concepts of roofs and geometric embankments adopted in the work are presented in Tables 1 and 2, and (Photo 1).
![Photo 1
Experimental embankment resting on a polygon with four concave angles, including two opposite each other [13].](/document/doi/10.1515/eng-2022-0376/asset/graphic/j_eng-2022-0376_fig_021.jpg)
Experimental embankment resting on a polygon with four concave angles, including two opposite each other [13].
![Figure 6
Designing a roof with constraints by immersion in an ordinary roof and trimming using Boolean operations (stages of roof design in AutoCAD software environment): (r) roof base and water outflow directions, (r1) roof base extension (immersion in an ordinary roof); (r2) the base of a new auxiliary ordinary roof; (r3) design of an ordinary roof (straight skeleton); (r4) truncation by performing Boolean operations; and (r5) projection roof design with restrictions; five views of the roof model project [11].](/document/doi/10.1515/eng-2022-0376/asset/graphic/j_eng-2022-0376_fig_006.jpg)
Designing a roof with constraints by immersion in an ordinary roof and trimming using Boolean operations (stages of roof design in AutoCAD software environment): (r) roof base and water outflow directions, (r1) roof base extension (immersion in an ordinary roof); (r2) the base of a new auxiliary ordinary roof; (r3) design of an ordinary roof (straight skeleton); (r4) truncation by performing Boolean operations; and (r5) projection roof design with restrictions; five views of the roof model project [11].
In Voronoi diagrams, for the polygon, line segments and parabolas are obtained as dividing lines [11,13]. Why is there no hyperbola appearing in a 3D model (Table 2, Figure 5)? Well, a hyperbola (i.e. hyperbolic arc) being a component of the ridge line in embankment models lies in a plane perpendicular to the horizontal plane. Thus, the horizontal projection of the hyperbolic arc, i.e. the top view, is the line segment (Figure 5).
4.1 Roofs with restrictions
Roofs with restrictions (also called “roofs with neighbours”) constitute a special type of roof. It is assumed that certain sides of the polygon of the roof base or parts thereof cannot be eaves. These line segments in the drawings are marked with a double line (Figure 6). In practice, this means that water cannot flow down towards the side (given edge or part of the side) (Figure 6). In order to properly drain the water, additional hipped roof ends (and thus eaves) must be introduced after marking the direction of water drainage. The water in a given plane runs perpendicular to the contours of this plane. Each eave is a contour line of a hipped roof end. Thus, water flows perpendicular to the eaves. The direction of the water flow forces the adoption of new eaves perpendicular to the straight line defining this direction (runoff) (Figure 6(r1)). Taking into account the new eaves, the polygon of the base of the roof is expanded (Figures 6r1-r2). After solving the regular roof (Figure 6r3) and applying the Boolean operation - intersection (Figure 6r4), the final solution is obtained (Figure 6r5).
![Figure 7
Diagrams of the main scratches in rectangular, triangular, and trapezoidal slabs supported along the perimeter (own edition on the basis of ref. [36], Figure 2-23).](/document/doi/10.1515/eng-2022-0376/asset/graphic/j_eng-2022-0376_fig_007.jpg)
Diagrams of the main scratches in rectangular, triangular, and trapezoidal slabs supported along the perimeter (own edition on the basis of ref. [36], Figure 2-23).
5 Yield-lines
Mechanics specialists have long started discussion on each case of yield-lines (e.g. rectangular plate) with a sketch of the roof ridge (orthogonal projection) (Figures 7 and 8). Why not use the Voronoi diagram lines if the essence of them lies in many structures of the reality that surrounds us? Even an approximate determination of the topology of the yield-lines will definitely facilitate their thorough examination by another method.
![Figure 8
Arrangement of the yield-line of a homogeneously loaded plate (own edition on the basis of ref. [37], Figure 5.117).](/document/doi/10.1515/eng-2022-0376/asset/graphic/j_eng-2022-0376_fig_008.jpg)
Arrangement of the yield-line of a homogeneously loaded plate (own edition on the basis of ref. [37], Figure 5.117).
Exceeding the limit state of a statically loaded slab takes place in reality during building breakdowns and construction disasters or laboratory experiments. Then, the destruction of the reinforced concrete slab is carried out along the expected yield-lines [36,38]. To calculate the reaction of supports of rectangular boards, with a uniformly distributed load as load sharing lines, hypothetical boundaries very close to the shape of the hipped roof edge are assumed ([37], p. 15, Figure 5.19). Thus, whenever in static analysis and construction calculations the yield-lines are used, everywhere there is a sketch of hypothetical, expected yield-lines resembling the edges of flat roofs [14,25,36,37,39]. This prompted the author of a monograph on roofs [11] to address this issue as an important application of roof geometry. This study proposes a method for assisting in the determination of the expected yield-lines of slabs loaded uniformly, using Voronoi diagrams. There is an extension of the results obtained at work [11] based on the geometry of roofs with different slope angles (Figure 9).
![Figure 9
The yield-lines of a homogeneous slab loaded uniformly (supported along the perimeter and centrally with a circular cross-section), analysed in the paper ([14], p. 498): (a) and (b) lines determined by the limit-load method; and (c) yield-lines of the slab obtained as a result of the experiment.](/document/doi/10.1515/eng-2022-0376/asset/graphic/j_eng-2022-0376_fig_009.jpg)
The yield-lines of a homogeneous slab loaded uniformly (supported along the perimeter and centrally with a circular cross-section), analysed in the paper ([14], p. 498): (a) and (b) lines determined by the limit-load method; and (c) yield-lines of the slab obtained as a result of the experiment.
Koźniewski, through the application of mathematical theory of roofs [11], showed the possibility of obtaining a similar shape of the yield-lines in supported slab (Figure 10). He verified his solutions using two methods: the method of the power balance of external loads and internal forces based on the roof skeleton line as a yield-line and determining the load distribution by means of the bending surface by the double sine series with reference to the one-point support. As a central support, he adopted the square described on the circle (Figure 10c), which facilitated the use of the power balance method. In the first case, the results of the load absorbed by the pole differed by 2.1%, and in the second one the point support took over a load differing 0.5%.
![Figure 10
Scheme of the slab loaded uniformly and three ways of obtaining yield-lines (a) (freely supported along the circumference and centrally located column with a circular cross-section), analysed in the paper [14], dimensions of the slab is in cm; (b) yield-lines created as a result of experimental destruction of the slab; (c) expected yield-lines obtained as the edges of the natural roof solution ([11], p. 166); and (d) layout of yield-lines obtained as a result of calculations using the method of the power balance of external loads and internal forces on the basis of the natural roof ridge lines ([11], p. 170).](/document/doi/10.1515/eng-2022-0376/asset/graphic/j_eng-2022-0376_fig_010.jpg)
Scheme of the slab loaded uniformly and three ways of obtaining yield-lines (a) (freely supported along the circumference and centrally located column with a circular cross-section), analysed in the paper [14], dimensions of the slab is in cm; (b) yield-lines created as a result of experimental destruction of the slab; (c) expected yield-lines obtained as the edges of the natural roof solution ([11], p. 166); and (d) layout of yield-lines obtained as a result of calculations using the method of the power balance of external loads and internal forces on the basis of the natural roof ridge lines ([11], p. 170).
The results obtained were the starting point for the research presented later in this section. The yield-lines, obtained with the help of roof theory, matched quite well in relation to the experimental destruction of the slab in the aspect of numerical results of taking over loads by a supporting pole. However, visually the skeleton lines of the roof slightly differed from the yield-lines created as a result of the slab’s destruction (Figure 10d). Anyway, straightforward schemes of solutions adopted in the monograph [14] also differed considerably. The research carried out in 2012 on the shape of the embankment obtained from homogeneous bulk material, based on any flat figure [13], led to the conclusion that the obtained embankment shape has a Voronoi-shaped projection of a polygon inscribed in a given figure (single- or multiple-connected). CAD technology (e.g. AutoCAD) allows you to create such Voronoi diagrams in 3D representation for a given figure in the base (Figures 11a, 12c–17c, 14d–17d, 18c, and 19d).
![Figure 11
(on the left) “Embankment” model as a model of the inverted slab with the base defined in the drawing, the ridge lines have the shape of sections and parabola; (on the right) a visual comparison of empirically obtained test lines [14] with boundary lines of Voronoi diagrams for a rectangle with a centrally located circular hole (the line is a rectangular projection of the “embankment” edge) (source: own edition).](/document/doi/10.1515/eng-2022-0376/asset/graphic/j_eng-2022-0376_fig_011.jpg)
(on the left) “Embankment” model as a model of the inverted slab with the base defined in the drawing, the ridge lines have the shape of sections and parabola; (on the right) a visual comparison of empirically obtained test lines [14] with boundary lines of Voronoi diagrams for a rectangle with a centrally located circular hole (the line is a rectangular projection of the “embankment” edge) (source: own edition).
![Figure 12
Analysis of the yield-lines of a rectangular slab 1 based on three edges: (a) the result of the theoretical analysis of slab 1 ([14], p. 495), (b) yield-lines of the destroyed slab 1 ([14], p. 495), (c) the model of the Voronoi diagram (source: own edition), (d) the model of the Voronoi diagram with different inclination angles (source: own edition).](/document/doi/10.1515/eng-2022-0376/asset/graphic/j_eng-2022-0376_fig_012.jpg)
Analysis of the yield-lines of a rectangular slab 1 based on three edges: (a) the result of the theoretical analysis of slab 1 ([14], p. 495), (b) yield-lines of the destroyed slab 1 ([14], p. 495), (c) the model of the Voronoi diagram (source: own edition), (d) the model of the Voronoi diagram with different inclination angles (source: own edition).
![Figure 13
Analysis of the yield-lines of a rectangular slab 2 based on three edges and half the length of the fourth edge: (a) the result of the theoretical analysis of slab 2 ([14], p. 477), (b) yield-lines of the destroyed slab 2 ([14], p. 477), (c) the model of the Voronoi diagram (source: own edition), and (d) the model of the Voronoi diagram with the same inclination angles (source: own edition).](/document/doi/10.1515/eng-2022-0376/asset/graphic/j_eng-2022-0376_fig_013.jpg)
Analysis of the yield-lines of a rectangular slab 2 based on three edges and half the length of the fourth edge: (a) the result of the theoretical analysis of slab 2 ([14], p. 477), (b) yield-lines of the destroyed slab 2 ([14], p. 477), (c) the model of the Voronoi diagram (source: own edition), and (d) the model of the Voronoi diagram with the same inclination angles (source: own edition).

Model of embankment associated with a roof with constraints along two edges of the base, shaping the expected yield-lines of a slab supported by two edges: (a) slab supporting scheme, (b) (photo) laboratory model of the embankment in a top view (Voronoi diagram), (c) geometric model in the top view (Voronoi diagram), and (d) axonometry of the inverted geometric model of the embankment illustrating the method of supporting the slab (source: own edition).

Embankment model associated with a roof with two yards, shaping the expected yield-lines of the slab freely supported circumferentially on the edges and on two columns: (a) slab supporting scheme, (b) (photo) laboratory model of the embankment in a top view (Voronoi diagram), (c) a geometric model in a top view (Voronoi diagram), and (d) axonometry of the inverted geometric model of the embankment illustrating the method of supporting the slab (source: own edition).

Embankment model associated with a roof with one yard, shaping the expected yield-lines of the slab freely supported circumferentially on the edges and on one column: (a) slab supporting scheme, (b) (photo) laboratory model of the embankment in a top view (Voronoi diagram), (c) a geometric model in a top view (Voronoi diagram), and (d) axonometry of the inverted geometric model of the embankment illustrating the method of supporting the slab (source: own edition).

Embankment model associated with a roof with full limitation with five trigger points, shaping the expected yield-lines of the slab freely supported by points in five places: (a) slab supporting scheme (five columns), (b) (photo) laboratory model of the embankment in a top view (Voronoi diagram), (c) a geometric model in a top view (Voronoi diagram), and (d) axonometry of the inverted geometric model of the embankment illustrating the method of supporting the slab (source: own edition).
![Figure 18
Drawing marks indicating how to find the expected yield-lines of the slab using the method discussed in the article “Automatic yield-line analysis of slabs using discontinuity layout optimisation” [15]: (a) designation of the slab supporting scheme adopted in the article [15], (b) (photo) laboratory model of the embankment in a top view (Voronoi diagram), (c) designation with double lines for the roof with neighbours (embankment) solution, and (d) expected yield-lines obtained by the Voronoi diagram method (source: own edition).](/document/doi/10.1515/eng-2022-0376/asset/graphic/j_eng-2022-0376_fig_018.jpg)
Drawing marks indicating how to find the expected yield-lines of the slab using the method discussed in the article “Automatic yield-line analysis of slabs using discontinuity layout optimisation” [15]: (a) designation of the slab supporting scheme adopted in the article [15], (b) (photo) laboratory model of the embankment in a top view (Voronoi diagram), (c) designation with double lines for the roof with neighbours (embankment) solution, and (d) expected yield-lines obtained by the Voronoi diagram method (source: own edition).
![Figure 19
A model of the embankment associated with the roof, shaping the expected lines of the slab breaks discussed in the article: “Automatic yield-line analysis of slabs using discontinuity layout optimisation” [15]: (a) slab supporting scheme, (b) (photo) laboratory model of the embankment in a top view (Voronoi diagram), (c) expected yield-lines obtained by the Voronoi diagram method, and (d) axonometry of the inverted geometric model of the embankment illustrating the method of supporting the slab.](/document/doi/10.1515/eng-2022-0376/asset/graphic/j_eng-2022-0376_fig_019.jpg)
A model of the embankment associated with the roof, shaping the expected lines of the slab breaks discussed in the article: “Automatic yield-line analysis of slabs using discontinuity layout optimisation” [15]: (a) slab supporting scheme, (b) (photo) laboratory model of the embankment in a top view (Voronoi diagram), (c) expected yield-lines obtained by the Voronoi diagram method, and (d) axonometry of the inverted geometric model of the embankment illustrating the method of supporting the slab.
6 The procedure of identifying the yield-lines by means of the 3D model of the “geometric embankment”
To construct the model, any polygonal outline of the slab is accepted: (1) if it is supported along a line segment of the boundary line, in the model this line segment is the eaves of the roof – graphically a single line (in the laboratory model, the bulk material slides freely); (2) if there is no support at a particular section, then there is a limitation on this section – graphically, the double line is assumed (the bulk material is blocked by the wall); (3) if there is a point support, then there is a trigger point – a top of the cone with an angle of opening equal to the slope of the roof slopes is assumed (the material slides over the circular cone).
Modelling of the expected yield-lines of slab is understood as follows. The embankment obtained in laboratory conditions is (by nature) a 3D object. Similarly, the geometric “embankment” constructed as a virtual geometric model in the AutoCAD software environment is also a 3D solid. However, only the top views of these objects will be interesting (Figures 14b–17b, 14c–17c, and 19b and c). From the point of view of orthographic projection theory (Monge), the geometric “embankment” will be horizontal projections of objects created in the laboratory and virtually. The two-dimensional (2D) objects thus obtained are Voronoi diagrams for: a polygon, and a multi-connected domain (i.e. a polygon with openings of different shapes), or for any set of figures (line segments, points, circles) limited to a polygon (or more generally an area) constituting the perimeter of the slab.
However, in order to show only the method of supporting the slab, the geometric model was reversed and supplemented with appropriate support elements: pillars, walls (Figures 14d–17d and 19d). The axonometric interpretation of the inverted model (3D) of the geometric embankment should not be treated as a faithful model (3D) of the “destroyed” slab (Figures 14d–18d). The edges (including ridge lines) of the inverted model (in axonometric terms), including the aforementioned agreement, illustrate the expected lines of the edges of the slab under consideration (Figures 11a, 12c–17c, and 19c).
In cases where orthotropic plate reinforcement is used, the condition mentioned in Section 4 does not have to be met. Then, the analysis of the bending of statically loaded slabs in such situations leads to roof geometry with different slope angles [11]. Let us assume that a plastically orthotropic slab has the dimensions a and b with the edges on the axes Ox and Oy of the coordinate system, with the boundary bending points M
x
and M
y
. Let us denote Λ =
![Figure 20
The lines of the elevations of an orthotropic rectangular slab loaded uniformly (own edition based on [14]).](/document/doi/10.1515/eng-2022-0376/asset/graphic/j_eng-2022-0376_fig_020.jpg)
The lines of the elevations of an orthotropic rectangular slab loaded uniformly (own edition based on [14]).
Then,
Therefore, in the examples discussed in Section 8, two ways of modelling the yield-lines are presented (Figures 12c and d, 13c and d).
7 Analysis of the yield-lines of rectangular slabs with different support geometry
This section presents models – geometric solutions of predicted yield-lines for examples of laboratory destroyed plates. The models were made using the method proposed in this article. In order to make a comparative analysis, examples of slabs with the pattern and support geometry adopted in the monograph were considered [14]. The individual figures contain the result of the theoretical analysis, the photograph of slab destruction, and the geometrical model.
8 Models of selected embankments obtained on the basis of roofs
This section presents models – geometric solutions of the predicted yield-lines in correspondence with laboratory obtained solids of embankments. This is an illustration on the examples of the theory presented in Section 3 and the considerations in Sections 4–7.
Figures 14–17 and 19 show various cases of shaping (modelling) embankments in the aspect of predicting the yield-lines of slab. Figure 19 is a comparative drawing; it stands out from the others by the presence of the model presented in the paper [15].
9 Conclusion
Comparing the method presented in this work with reference to the method and type of the slab discussed in ref. [15] indicates a high similarity of both results. It seems that before applying any method of determining the yield-lines for a given slab, it is worth starting with the construction of the Voronoi diagram.
This method has been verified on many examples of experimental damage to the plates and far-reaching similarity has been noticed everywhere. In addition, the solution to the problem presented by the method is done using standard AutoCAD software working on any notebook. The task can be performed by the student after completing the first semester in the field of descriptive geometry.
Visual comparative analysis of the models constructed by the authors with the results of research on a natural scale and/or numerical calculations contained in the literature indicates a very good agreement of the obtained Voronoi diagrams for a polygon with yield-lines. Due to the knowledge of the theory of Voronoi diagrams, a more difficult to determine shape of the expected scratches of a slab (e.g. the ceiling of an exploited building) is possible. It will also be helpful in analysing the reinforcement of complex-shaped slabs when designing a building.
The proposal for the computer creation (in the CAD software environment) of embankment models is a good general geometric method of predicting the yield-lines. These lines are precisely defined in the CAD software environment. In the AutoCAD coordinate system, it is possible to read the coordinates of the points that make up these lines.
The results of the research presented in the article are an interesting development of geometric theory in the field of structural mechanics, also in the field of potential applications in the diagnostics of structures (e.g. for detecting yield-lines of ceiling slabs). After a properly developed computer application (e.g. for a mobile phone), on the basis of a photograph of the object’s geometry, it is possible to read the places where the scratches appear, without carrying out complicated calculations, often requiring high-power computers.
The method presented here can be used to recognize a completely preliminary scheme of the yield-line shape of the tested slab. In the case of a significant demand for frequent use of this method, it would be advisable to automate the procedure presented here by developing a suitable application, e.g. in AutoLISP in the AutoCAD software environment.
-
Funding information: This work was performed within the framework of grant Bialystok University of Technology WZ/WB-IIL/4/2022 and financed by the Ministry of Science and Higher Education of the Republic of Poland.
-
Author contributions: E.K. and M.O. developed algorithms for creating computer geometric models, made computer models and drawings, carried out experiments with the creation of embankments, and wrote the article. All authors gave final approval for publication.
-
Conflict of interest: The authors have no competing interest.
-
Ethical statement: This work did not involve any active collection of human data.
-
Data availability statement. This work contains experimental data (as photographs) from the book “Sawczuk A., Jaeger T. (1963): Grenztragfähigkeits-Theorie der Platten (Limit State Theory of Plates), Springer-Verlag, Berlin” and the article “Gilbert M., He L., Smith C. C., Le C. V. (2014): Automatic yield-line analysis of slabs using discontinuity layout optimization. Proc R Soc A, 470 (2168), 20140071.”
References
[1] Okabe A, Boots B, Sugihara K, Chiu SN. Spatial tessellations: concepts and applications of voronoi diagrams. 2nd edn. Chichester: John Wiley & Sons Ltd; 2000.10.1002/9780470317013Suche in Google Scholar
[2] Meng Q, Yan L, Chen Y, Zhang Q. Generation of numerical models of anisotropic columnar jointed rock mass using modified centroidal Voronoi diagrams. Symmetry. 2018;10(11):618. 10.3390/sym10110618.Suche in Google Scholar
[3] Löbl MC, Zhai L, Jahn JP, Ritzmann J, Huo Y, Wieck AD, et al. Correlations between optical properties and Voronoi-cell area of quantum dots. Phys Rev B. 2019;100(15):155402. ISSN 2469-9950. S2CID 119443529. 10.1103/physrevb.100.155402.Suche in Google Scholar
[4] Lopez C, Zhao CL, Magniol S, Chiabaut N, Leclercq L. Microscopic simulation of cruising for parking of trucks as a measure to manage freight loading zone. Sustainability-Basel. 2019;11(5):1276. 10.3390/su11051276.Suche in Google Scholar
[5] Singh K, Sadeghi F, Correns M, Blass T. A microstructure based approach to model effects of surface roughness on tensile fatigue. Int J Fatigue. 2019;129:105229. 10.1016/j.ijfatigue.2019.105229.S2CID 202213370.Suche in Google Scholar
[6] Niu H, Savvaris A, Tsourdos A, Ji Z. Voronoi-visibility roadmap-based path planning algorithm for unmanned surface vehicles. J Navig. 2019;72(4):850–74. 10.1017/S0373463318001005.67908628.Suche in Google Scholar
[7] Hölscher T, Krömker S, Mara H. Der Kopf Sabouroff in Berlin: Zwischen archäologischer Beobachtung und geometrischer Vermessung (The head of Sabouroff in Berlin: between archaeological observation and geometric measurement). Gedenkschrift für Georgios Despinis. Griechenland, German; 2020.Suche in Google Scholar
[8] Feinstein J, Shi W, Ramanujam J, Brylinski M. Bionoi: A Voronoi diagram-based representation of ligand-binding sites in proteins for machine learning applications. Methods Mol Biol. 2021;2266:299–312. 10.1007/978-1-0716-1209-5_17.Suche in Google Scholar PubMed
[9] Koźniewski E, Orłowski M. Volume optimization of solid waste landfill using Voronoi diagram geometry. Open Eng. 2019;9:307–11. 10.1515/eng-2019-0040.Suche in Google Scholar
[10] Aichholzer O, Alberts D, Aurenhammer F, Gartner B. A novel type of skeleton for polygons. J Univers Comput Sci. 1995;1(12):752–61.10.1007/978-3-642-80350-5_65Suche in Google Scholar
[11] Koźniewski E. Geometria dachów. Teoria i zastosowanie [Geometry of Roofs. Theory and Applications]. Wydawnictwo Politechniki Białostockiej. Białystok: Polish; 2007.Suche in Google Scholar
[12] Koźniewski E, Banaszak K. Roof geometry in buiding design. Open Eng. 2020;10(1):839–45. 10.1515/eng-2020-094.Suche in Google Scholar
[13] Koźniewski E, Koźniewski M, Orłowski M, Owerczuk J. Geometric methods for designing an embankment with a natural slope. J Biul Pol Soc Geometry Eng Graph. 2013;25:49–56. https://journals.indexcopernicus.com/search/article?.articleId = 1143757 (access: 5-09-2022).Suche in Google Scholar
[14] Sawczuk A, Jaeger T. Grenztragfähigkeits-theorie der platten [Limit State Theory of Plates]. Berlin, German: Springer-Verlag; 1963.10.1007/978-3-662-11905-1Suche in Google Scholar
[15] Gilbert M, He L, Smith CC, Le CV. Automatic yield-line analysis of slabs using discontinuity layout optimization. Proc R Soc A. 2014;470(2168):20140071.10.1098/rspa.2014.0071Suche in Google Scholar PubMed PubMed Central
[16] Bleyer J, De Buhan P. Lower bound static approach for the yield design of thick plates. Int J Numer Meth Eng. 2014;100(11):814–33.10.1002/nme.4776Suche in Google Scholar
[17] He L, Gilbert M. Automatic rationalization of yield-line patterns identified using discontinuity layout optimization. Int J Solids Struct. 2016;84:27–39.10.1016/j.ijsolstr.2015.12.014Suche in Google Scholar
[18] He L, Gilbert M, Shepherd M. Automatic yield-line analysis of practical slab configurations via discontinuity layout optimization. J Struct Eng. 2017;143(3):04017036. 10.1061/(ASCE)ST.1943-541X.0001700.Suche in Google Scholar
[19] Mahlis M, Shoeib AE, Sherif A, Abd Elnaby SM. The effect of cutting openings on the behavior of two-way solid loaded slabs. Structures. 2018;16:137–149. 10.1016/j.istruc.2018.09.002.Suche in Google Scholar
[20] Wang Y, Zhang YJ, Long BY, Ma S, Zhang SH, Yuan GL. Analytical method for ultimate state of two-way concrete slabs based on steel strain difference. Eng Mech. 2019;36:104–18. 10.6052/j.issn.1000-4750.2017.11.0801.Suche in Google Scholar
[21] Wang Y, Wu JC, Li LZ, Zhang YJ, Chen ZX, Song W, et al. Behavior of reinforced concrete continuous two-way slabs subjected to different span fires. Eng Mech. 2020;37:55–72. 10.6052/j.issn.1000-4750.2019.08.0440.Suche in Google Scholar
[22] Wang Y, Wang G, Huang Z, Li L, Bu Y, Zhong B, et al. Numerical modelling of in-plane restrained concrete two-way slabs subjected to fires. Fire Saf J. 2021;121:103307. 10.1016/j.firesaf.2021.103307.Suche in Google Scholar
[23] Zhu S, Dong Y, Ye S, Zhang D, Duan J. Limit carrying capacity calculation of two-way slabs with three simply supported edges and one clamped edge under fire. Appl Sci. 2022;12:1561. 10.3390/app12031561.Suche in Google Scholar
[24] Wüst J, Wagner W. Systematic prediction of yield-line configurations for arbitrary polygonal plates. Eng Struct. 2008;30(7):2081–93.10.1016/j.engstruct.2008.01.005Suche in Google Scholar
[25] Wojewódzki W. Nośność graniczna płyt [Limit load carrying capacity of plates]. Oficyna Wydawnicza Politechniki Warszawskiej. Warszawa: Polish; 2006.Suche in Google Scholar
[26] Felkel P, Obdržalek Š. Straight skeleton computation. Spring Conference on Computer Graphics. Budmerice; Slovakia: 1998. p. 210–18.Suche in Google Scholar
[27] Huber S. The Topology of Skeletons and Offsets. 34th European Workshop on Computational Geometry. Berlin; Germany: 2018. p. 21–3. https://conference.imp.fu-berlin.de/eurocg18/download/paper_17.pdf (access: 5-09-2022).Suche in Google Scholar
[28] Held M, Palfrader P. Skeletal structures for modeling generalized chamfers and fillets in the presence of complex miters. Comput Aided Des Appl. 2019;16(4):620–7. 10.14733/cadaps.2019.620-627.Suche in Google Scholar
[29] Held M, Palfrader P. Step-by-step straight skeletons. 36th International Symposium on Computational Geometry (SoCG 2020), LIPIcs, 164, Schloss Dagstuhl–Leibniz-Zentrum für Informatik. Vol. 76. Zürich, Switzerland: 2020. p. 1–76. 10.4230/LIPIcs.SoCG.2020.76.Suche in Google Scholar
[30] Held M, Palfrader P. On modeling coverage areas of anisotropic transmitters by Voronoi-like structures based on star-shaped distance measures. Comput Aided Des Appl. 2022;19(5):967–76. 10.14733/cadaps.2022.967-976.Suche in Google Scholar
[31] Eder G, Held M, Jasonarson S, Mayer P, Palfrader P. Salzburg database of polygonal data: Polygons and their generators. Data Brief. 2020;31:105984. 10.1016/j.dib.2020.105984.Suche in Google Scholar PubMed PubMed Central
[32] Eder G, Held M, Palfrader P. Implementing straight skeletons with exact arithmetic: Challenges and experiences. Comput Geom. 2021;96. 10.1016/j.comgeo.2021.101760.Suche in Google Scholar
[33] Irhan B. A universal predictor-corrector type incremental algorithm for the construction of weighted straight skeletons based on the notion of deforming polygon. Comput Aided Des Appl. 2021;19(1):103–31. 10.14733/cadaps.2022.103-131.Suche in Google Scholar
[34] Koźniewski E. A static moment for a polygon and its applications. Omsk Sci Bull Ser Aviation-Rocket Power Eng. 2018;2(1):9–16. 10.25206/2588-0373-2018-2-1-9-16.Suche in Google Scholar
[35] Hoff KE, Keyser J, Lin M, Manocha D, Culver T. Fast computation of generalized voronoi diagrams using graphics hardware. 1999. http://graphics.ethz.ch/Downloads/Seminar_Arbeiten/2000/demmenegger_SW.pdf (access: 5.09.2022).10.1145/336154.336226Suche in Google Scholar
[36] Mitzel A, Stachurski W, Suwalski J. Awarie konstrukcji betonowych i murowych [Failures of concrete and masonry structures]. Arkady: Warszawa; 1975 (Polish).Suche in Google Scholar
[37] Starosolski W. Konstrukcje żelbetowe według Eurokodu 2 i norm związanych [Reinforced concrete structures according to Eurocode 2 and related standards]; Tom 2. Wydawnictwo Naukowe PWN: Warszawa; 2011 (Polish).Suche in Google Scholar
[38] Kennedy G, Goodchild C. Practical Yield Line Design. British Cement Association; 2003.Suche in Google Scholar
[39] Johansen KW. Yield-line formulae for slabs. Cement and Concrete Association. London: Taylor & Francis; 1972.10.1201/9781482272321Suche in Google Scholar
© 2022 Edwin Koźniewski and Marcin Orłowski, published by De Gruyter
This work is licensed under the Creative Commons Attribution 4.0 International License.
Artikel in diesem Heft
- Regular Articles
- Performance of a horizontal well in a bounded anisotropic reservoir: Part I: Mathematical analysis
- Key competences for Transport 4.0 – Educators’ and Practitioners’ opinions
- COVID-19 lockdown impact on CERN seismic station ambient noise levels
- Constraint evaluation and effects on selected fracture parameters for single-edge notched beam under four-point bending
- Minimizing form errors in additive manufacturing with part build orientation: An optimization method for continuous solution spaces
- The method of selecting adaptive devices for the needs of drivers with disabilities
- Control logic algorithm to create gaps for mixed traffic: A comprehensive evaluation
- Numerical prediction of cavitation phenomena on marine vessel: Effect of the water environment profile on the propulsion performance
- Boundary element analysis of rotating functionally graded anisotropic fiber-reinforced magneto-thermoelastic composites
- Effect of heat-treatment processes and high temperature variation of acid-chloride media on the corrosion resistance of B265 (Ti–6Al–4V) titanium alloy in acid-chloride solution
- Influence of selected physical parameters on vibroinsulation of base-exited vibratory conveyors
- System and eco-material design based on slow-release ferrate(vi) combined with ultrasound for ballast water treatment
- Experimental investigations on transmission of whole body vibration to the wheelchair user's body
- Determination of accident scenarios via freely available accident databases
- Elastic–plastic analysis of the plane strain under combined thermal and pressure loads with a new technique in the finite element method
- Design and development of the application monitoring the use of server resources for server maintenance
- The LBC-3 lightweight encryption algorithm
- Impact of the COVID-19 pandemic on road traffic accident forecasting in Poland and Slovakia
- Development and implementation of disaster recovery plan in stock exchange industry in Indonesia
- Pre-determination of prediction of yield-line pattern of slabs using Voronoi diagrams
- Urban air mobility and flying cars: Overview, examples, prospects, drawbacks, and solutions
- Stadiums based on curvilinear geometry: Approximation of the ellipsoid offset surface
- Driftwood blocking sensitivity on sluice gate flow
- Solar PV power forecasting at Yarmouk University using machine learning techniques
- 3D FE modeling of cable-stayed bridge according to ICE code
- Review Articles
- Partial discharge calibrator of a cavity inside high-voltage insulator
- Health issues using 5G frequencies from an engineering perspective: Current review
- Modern structures of military logistic bridges
- Retraction
- Retraction note: COVID-19 lockdown impact on CERN seismic station ambient noise levels
- Special Issue: Trends in Logistics and Production for the 21st Century - Part II
- Solving transportation externalities, economic approaches, and their risks
- Demand forecast for parking spaces and parking areas in Olomouc
- Rescue of persons in traffic accidents on roads
- Special Issue: ICRTEEC - 2021 - Part II
- Switching transient analysis for low voltage distribution cable
- Frequency amelioration of an interconnected microgrid system
- Wireless power transfer topology analysis for inkjet-printed coil
- Analysis and control strategy of standalone PV system with various reference frames
- Special Issue: AESMT
- Study of emitted gases from incinerator of Al-Sadr hospital in Najaf city
- Experimentally investigating comparison between the behavior of fibrous concrete slabs with steel stiffeners and reinforced concrete slabs under dynamic–static loads
- ANN-based model to predict groundwater salinity: A case study of West Najaf–Kerbala region
- Future short-term estimation of flowrate of the Euphrates river catchment located in Al-Najaf Governorate, Iraq through using weather data and statistical downscaling model
- Utilization of ANN technique to estimate the discharge coefficient for trapezoidal weir-gate
- Experimental study to enhance the productivity of single-slope single-basin solar still
- An empirical formula development to predict suspended sediment load for Khour Al-Zubair port, South of Iraq
- A model for variation with time of flexiblepavement temperature
- Analytical and numerical investigation of free vibration for stepped beam with different materials
- Identifying the reasons for the prolongation of school construction projects in Najaf
- Spatial mixture modeling for analyzing a rainfall pattern: A case study in Ireland
- Flow parameters effect on water hammer stability in hydraulic system by using state-space method
- Experimental study of the behaviour and failure modes of tapered castellated steel beams
- Water hammer phenomenon in pumping stations: A stability investigation based on root locus
- Mechanical properties and freeze-thaw resistance of lightweight aggregate concrete using artificial clay aggregate
- Compatibility between delay functions and highway capacity manual on Iraqi highways
- The effect of expanded polystyrene beads (EPS) on the physical and mechanical properties of aerated concrete
- The effect of cutoff angle on the head pressure underneath dams constructed on soils having rectangular void
- An experimental study on vibration isolation by open and in-filled trenches
- Designing a 3D virtual test platform for evaluating prosthetic knee joint performance during the walking cycle
- Special Issue: AESMT-2 - Part I
- Optimization process of resistance spot welding for high-strength low-alloy steel using Taguchi method
- Cyclic performance of moment connections with reduced beam sections using different cut-flange profiles
- Time overruns in the construction projects in Iraq: Case study on investigating and analyzing the root causes
- Contribution of lift-to-drag ratio on power coefficient of HAWT blade for different cross-sections
- Geotechnical correlations of soil properties in Hilla City – Iraq
- Improve the performance of solar thermal collectors by varying the concentration and nanoparticles diameter of silicon dioxide
- Enhancement of evaporative cooling system in a green-house by geothermal energy
- Destructive and nondestructive tests formulation for concrete containing polyolefin fibers
- Quantify distribution of topsoil erodibility factor for watersheds that feed the Al-Shewicha trough – Iraq using GIS
- Seamless geospatial data methodology for topographic map: A case study on Baghdad
- Mechanical properties investigation of composite FGM fabricated from Al/Zn
- Causes of change orders in the cycle of construction project: A case study in Al-Najaf province
- Optimum hydraulic investigation of pipe aqueduct by MATLAB software and Newton–Raphson method
- Numerical analysis of high-strength reinforcing steel with conventional strength in reinforced concrete beams under monotonic loading
- Deriving rainfall intensity–duration–frequency (IDF) curves and testing the best distribution using EasyFit software 5.5 for Kut city, Iraq
- Designing of a dual-functional XOR block in QCA technology
- Producing low-cost self-consolidation concrete using sustainable material
- Performance of the anaerobic baffled reactor for primary treatment of rural domestic wastewater in Iraq
- Enhancement isolation antenna to multi-port for wireless communication
- A comparative study of different coagulants used in treatment of turbid water
- Field tests of grouted ground anchors in the sandy soil of Najaf, Iraq
- New methodology to reduce power by using smart street lighting system
- Optimization of the synergistic effect of micro silica and fly ash on the behavior of concrete using response surface method
- Ergodic capacity of correlated multiple-input–multiple-output channel with impact of transmitter impairments
- Numerical studies of the simultaneous development of forced convective laminar flow with heat transfer inside a microtube at a uniform temperature
- Enhancement of heat transfer from solar thermal collector using nanofluid
- Improvement of permeable asphalt pavement by adding crumb rubber waste
- Study the effect of adding zirconia particles to nickel–phosphorus electroless coatings as product innovation on stainless steel substrate
- Waste aggregate concrete properties using waste tiles as coarse aggregate and modified with PC superplasticizer
- CuO–Cu/water hybrid nonofluid potentials in impingement jet
- Satellite vibration effects on communication quality of OISN system
- Special Issue: Annual Engineering and Vocational Education Conference - Part III
- Mechanical and thermal properties of recycled high-density polyethylene/bamboo with different fiber loadings
- Special Issue: Advanced Energy Storage
- Cu-foil modification for anode-free lithium-ion battery from electronic cable waste
- Review of various sulfide electrolyte types for solid-state lithium-ion batteries
- Optimization type of filler on electrochemical and thermal properties of gel polymer electrolytes membranes for safety lithium-ion batteries
- Pr-doped BiFeO3 thin films growth on quartz using chemical solution deposition
- An environmentally friendly hydrometallurgy process for the recovery and reuse of metals from spent lithium-ion batteries, using organic acid
- Production of nickel-rich LiNi0.89Co0.08Al0.03O2 cathode material for high capacity NCA/graphite secondary battery fabrication
- Special Issue: Sustainable Materials Production and Processes
- Corrosion polarization and passivation behavior of selected stainless steel alloys and Ti6Al4V titanium in elevated temperature acid-chloride electrolytes
- Special Issue: Modern Scientific Problems in Civil Engineering - Part II
- The modelling of railway subgrade strengthening foundation on weak soils
- Special Issue: Automation in Finland 2021 - Part II
- Manufacturing operations as services by robots with skills
- Foundations and case studies on the scalable intelligence in AIoT domains
- Safety risk sources of autonomous mobile machines
- Special Issue: 49th KKBN - Part I
- Residual magnetic field as a source of information about steel wire rope technical condition
- Monitoring the boundary of an adhesive coating to a steel substrate with an ultrasonic Rayleigh wave
- Detection of early stage of ductile and fatigue damage presented in Inconel 718 alloy using instrumented indentation technique
- Identification and characterization of the grinding burns by eddy current method
- Special Issue: ICIMECE 2020 - Part II
- Selection of MR damper model suitable for SMC applied to semi-active suspension system by using similarity measures