Contribution of lift-to-drag ratio on power coefficient of HAWT blade for different cross-sections
-
Muhammad A. R. Yass
 ,
Raghad Majeed Rasheed
,
Raghad Majeed Rasheed

Abstract
The aim of this study is to integrate the best lift-to-drag ratio zone to chief the highest power coefficient for horizontal axis wind turbine (HAWT) blade. Different cross-section, symmetrical, unsymmetrical, and supercritical airfoils (NACA 0012, NACA 4412, and Eppler 417) are used. FORTRAN code (f.90) was built to calculate aerodynamic data and the power coefficient based on Blade Element Momentum theory. This article deals selection of the most effective zone from the lift-to-drag ratio versus blade radius curve that gives the best incidence angle distribution. The results show a good performance that leads to approximated equal lift-to-drag distribution along the blade radius that indicates the highest power coefficient of at least 15% increases. The highest values of the power coefficient of NACA 0012, NACA 4412, and Eppler 417 were 0.476, 0.4966, and 0.482, respectively. The lift-to-drag ratio distribution zones were the most specific method of generating the maximum power coefficient for the HAWT blade. Important results and conclusion were found for further blade design.
| Symbols | Description | Unit | |
|---|---|---|---|
| a | Axial factor | — | |
| á | Angular factor | — | |
| C D | Drag coefficient | — | |
| C L | Lift coefficient | — | |
| C P | Power coefficient | — | |
| P | Power | (W) | |
| r | Blade radius | (m) | |
| U | Flow velocity | (m/s) | |
| λ | Tip speed ratio | — | |
|
|
Angle between wind and quarter chord of a vertical axis airfoil | (deg) | |
| Ω | Angular velocity of the wind turbine rotor | (rad/s) | |
| ρ | Air density | (kg/m3) | |
| σ | Rotor solidity | — | |
| α | Angle of attack | (deg) | |
|
|
Efficiency | — | |
| φ | Angle of relative wind | (deg) | |
| υ | kinematic viscosity | (m2/s) | |
| ω | Angular velocity of the wind | (rad/s) | |
|
|
Pitch angle | (deg) | |
| V | Flow velocity in Y axis | (m/s) | |
| F | Force | N | |
| I | Incidence angle | (deg) | |
| R | Rotor radius | (m) | |
1 Introduction
The aerodynamic efficiency of an airfoil is defined by highest lift-to-drag ratio which is created by the specific angle of attack and the value of this angle differs from airfoil to airfoil depending on its behavior [1]. Lift-to-drag ratio depends on zero drag, aspect ratio, and span efficiency and is independent of weight. The usage of airfoil in wind turbine has not been much restricted than in airplane wing because wind turbine operates at low speed than airplane [2].
Various experimental and theoretical research studies have been carried out on the performance of wind turbine blades. ref. [3] studied a system for evaluating aerodynamic performance characteristics using two groups of NACA airfoils and airfoils used were five-digit series NACA (63-221, 65-415; 23012,23021) and four-digit series NACA (2,421, 2,412, 4,412, 4,424) for three blades HAWT. The airfoils used from root to tip in each blade were the same. A computer program was created to automate the entire procedure. Their results show that the airfoil elementary power coefficient of NACA 4412 and NACA 23012 was higher than other airfoils. Ref. [4] suggested a stable and aerodynamic design using NACA 4412 profile of (800 mm) long blade with a power of (600 Watt) with mini-HAWT. The distributions of the length chord and twist angle of the preliminary blade model are calculated. A reasonable compromise was provided between high efficiency and good stared. The blades were developed using MATLAB programming. The optimized blade chord decreases by 24%, and the thickness decreases by 44%. The optimized blade’s power level was increased significantly to 30% relative to that of the standard blade. Ref. [5] explained a design and optimization of a small blade of HAWT using self-code. The blades were fabricated using NACA 4412, NACA 2412, and NACA 1812 with wind speeds of 5 m/s, which was the most prominent wind speed prevailing in the Indian peninsula. The self-created code based on Blade Element Momentum (BEM) theory was generated an optimum blade profile that operates at high efficiency using multiple airfoils. Twist angle distribution, chord distribution, and other parameters for different airfoil sections along the blade are determined through the proposed code. The 4.46 m rotor diameter was used to achieve a power coefficient of 0.490 and produced a power output of 0.56 kW. The result of the blade analysis achieved using Q-blade software showed a reliable agreement with the proposed code and performance analysis of the wind turbine. The power coefficient acquired through MATLAB code was 0.490, and this value was very close to that obtained by using Q-blade (0.514). In addition, the difference in the output power between the two values was only 28.58 W. The goal of the study investigated by ref. [6] was to compare the aerodynamic behavior of the lift coefficient, drag coefficient, and lift–drag ratio and to observe the airfoil efficiency at different angles of attack (−15° to 15°). The contrast of six airfoils S809, S835, NACA 63415, NACA 63215, FX 63-137, and FX76-100 was performed with softwares XFOIL and FLUENT to select the maximum lift-to-drag ratio and to determine their aerodynamic coefficients by BEM theory. The FLUENT results showed that the maximum C l/C d for FX63-137 was 115.08 and occurred at an optimum angle of attack (AOA) of 4°. The maximum C l was 1.66, which at optimum AOA 14° for the FX63-137 airfoil. In addition, the lift coefficient was 0.893 at an optimum AOA of 0°. The other airfoils have 0.18–0.35 lift coefficient. The XFOIL results showed that the maximum C l/C d for FX63-137 was 102.5 and occurred at an optimum AOA of 4°. The maximum C l = 1.81 at AOA of 14° for the same airfoil. The highest lift coefficient was 0.903 at 0°. The FLUENT and XFOIL results proved the best aerodynamic performance possess by FX63-137 airfoil at high values of Reynolds number. Ref. [7] presented a way for the definition of aerodynamic performance characteristics of HAWTs. The twist of the blade was calculated based on BEM theory. The optimal power coefficient determined at the blade was twisted according to a program that achieves upon the variation of the l lift and drag coefficients with AOA. The results show that the optimum angle of attack and optimum twist angle of the blade enhances the performance of the wind turbine. The airfoils NACA 4410 and NACA 2415 were taken into study for the valuation of this proposed approach.
Ref. [8] the optimum AOA for (NACA0012, NACA2412) airfoils to find the lift-to-drag ratio was numerically considered. The lift coefficient varies linearly at the same range of angle of attack. Optimum values of lift coefficient were reached if the angle of attack increases. There was a region of lift coefficient where the drag coefficient has its lowest value referred to as stall. Good agreement data were get with the experimental AOA between −5 and 5°. NACA 2412 has a higher power output than the NACA 0012 [9]. A calculation model was presented based on the SCADA data and the aerodynamic theory. Two methods were proposed for the calculation of the power coefficient: one was based on statistical data and the other was based on real-time data. The calculation result for a two-wind turbine showed that the maximum power coefficient was 0.593 if the wind speed directly measured was used during the Maximum Power Point Tracking (MPPT). The power coefficient was reduced to 0.397 after wind speed correction. The power coefficient was time-varying even in the region of MPPT When using the real-time data. The wind rotor rotational speed regulation was delayed due to the wind rotor moment of inertia, and the wind speed was time-varying. Ref. [10] studied and analyzed lift and drag performances of NACA 0015 airfoil numerical and experimentally by measuring the forces every two degrees from 0° to 20° at low Reynolds numbers (Re). The numerical analysis was performed using the CFD program, which was FLUENT. The experiment test was led in low-speed wind tunnel. The numerical results were compared with the experiment and show that the stall angle consisted of turbulence occurring next to the airfoil [11]. The performances and behaviors of the multi-cross-section HAWT blade design with and without fences were addressed. The supercritical airfoils (FX66-S-196 V, FX63-137 S, and SG6043) were used. The same dimensions of the single-cross-section NACA4412 blade were used to compare the behaviors and overall performances. Numerical analyses were performed with a self-code (F.90) and CFD based on BEM theory. The multi-cross-section blades show an approximately 8% increase in power coefficient compared with the single-cross-section blade. The boundary layer theory was used to design the fences, and their positions were determined experimentally. The increase in total power coefficient was about 16% when using fences with high flutter stability.
In this article, we studied the behaviors and performances of different cross-sections blade. The symmetrical, unsymmetrical, and supercritical airfoils (NACA 0012, NACA 4412, and Eppler 417) were taken into consideration for evaluating this proposed approach. The study deals selection of the most effective zone from the lift-to-drag ratio versus blade radius curve that gives the best incidence angle distribution. The lift-to-drag ratio versus the angle of attack curve is divided into 3, 4, and 5 zones and then studied the distribution of each zone along the blade radius for all selected airfoils. The number of zones is dependent on the distribution of lift-to-drag ratio through a range of angles of attack. The study was based on choosing the lift-to-drag distribution zone along the blade radius to achieve the highest power coefficient. The calculation of design and optimization was performed using the F.90 code and QBlade software based on BEM theory.
1.1 Best lift-to-drag ratio
Blade element efficiency occurs at r and r + dr, and this ratio can be defined [12]
The aerodynamic force dR and its resultants dF u and dF v where it rotate or rotor axis, dP u is power contribution of element by rotor, and d P t is wind contribution to blade element [13].
By putting,
The aerodynamic efficiency is as much higher as tan ε is lower. At the limit, if tan ε was equal to zero, the efficiency would be equal to the unity. Actually, the value of tan ε depends on the incidence angle value [14].
1.2 Local power coefficient
The maximum power able of being extracted from the wind flow passing inside the annulus (r, r + dr) is given by the equation [11]:
This value corresponds to a local power coefficient:
λ Being equal to ωr /V 1.
For maximum value of power coefficient or ideal turbine, consider CD = 0 then [15]
After simplification the above equation, there follows:
From which, it is found that:
Putting this value of h in the equation of the power coefficient Cp leads to:
For a given value of λ, the power coefficient has a maximum when:
The calculations show that the maximum is obtained for a value of k which satisfies the equation [16].
This equation can be written as:
Substituting for k value, in the previous equation gives, after dividing by
From which there follows:
At each value of
λ
, it is possible to determine
2 Analyses and discussion
The aerodynamic point of view for all HAWT blades is the selection of the airfoil that is capturing the wind energy more effectively. The L/D ratio was the technical point of selecting the airfoil and it depend on the value of angles. The equal distribution of the L/D ratio along the wind turbine blade gives the maximum power coefficient that can be established by the selection of different angles at the blade section.
Three airfoils were selected symmetrical (NACA-0012) (Figures 1 and 2), unsymmetrical (NACA-4412) (Figures 3 and 4), and super critical (Eppler-417) (Figures 5 and 6).

NACA 0012 airfoil geometry.

Lift & drag for NACA 0012.

NACA 4412 airfoil geometry.

Lift & drag for NACA 4412.

Eppler 417 airfoil geometry.

Lift & drag for Eppler 417.
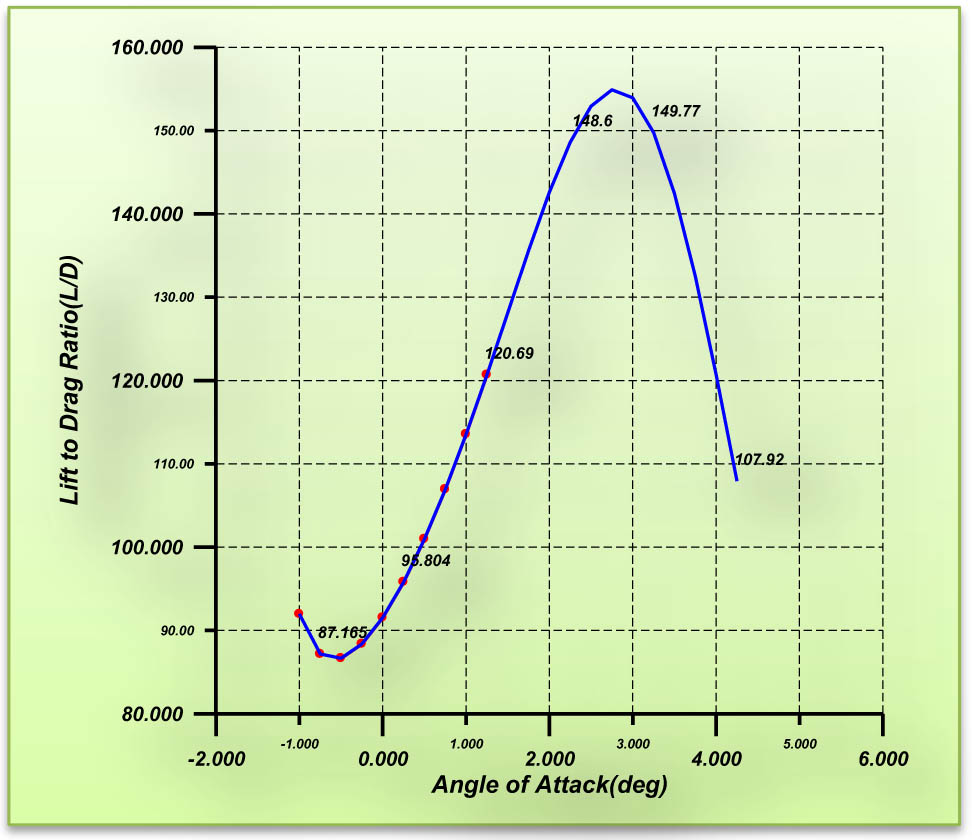
Different zones of angle of attack were selected for each airfoil to know which zone gives approximately equal L/D distributed with the angle of attack along the blade section (Figures 7–9). All these angle-of-attack zones were selected and analyzed to calculate the power coefficient as shown in Figures 10–17 and Table 1 for NACA-0012, Figures 18–27 and Table 2 for NACA-4412, and Figures 28–37,38,39 and Table 3 for Eppler-417. The comparison between the current study and the previous study is shown in Table 4.

NACA 0012 zone selected.

NACA 4412 zone selected.

Eppler 417 zone selected.

Zone (A) for NACA 0012.

Zone (B) for NACA 0012.

Zone (C) for NACA 0012.

Zone (D) for NACA 0012.

Power coefficient (CP) for zone (A) NACA 0012.
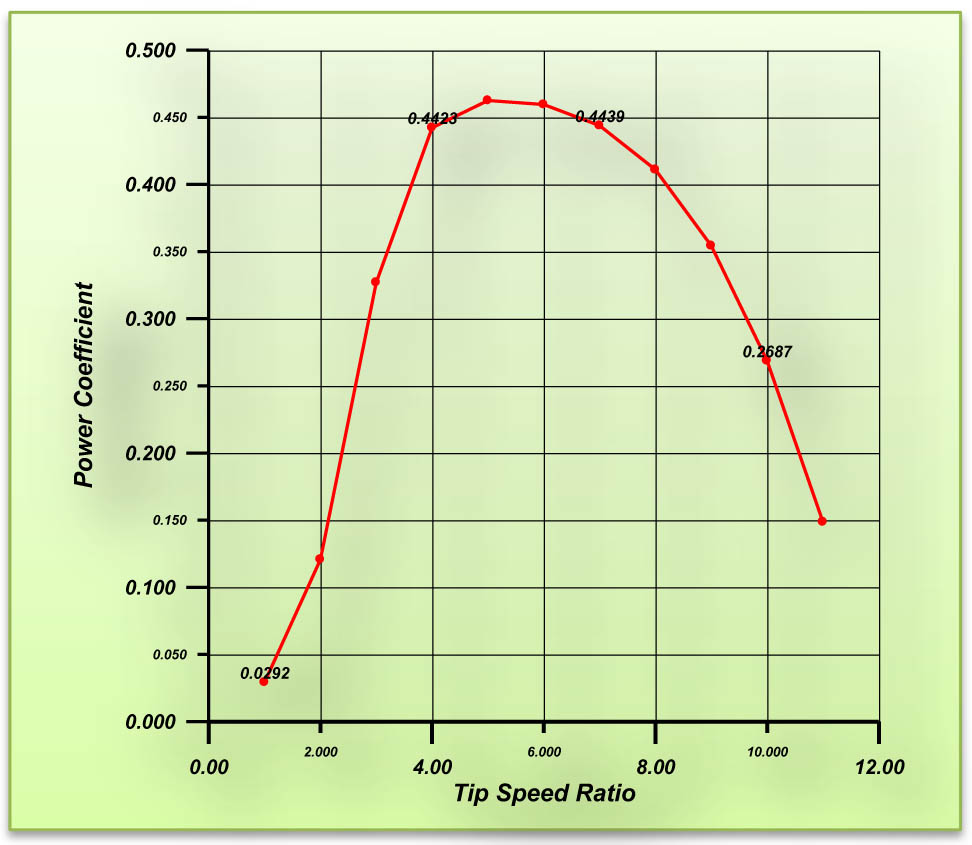
power coefficient (CP) for zone (B) for NACA 0012.

Power coefficient (CP) for zone (C) for NACA 0012.

Power coefficient (Cp) for zone (D) for NACA 0012.
NACA 0012 data
| r | LD zone (A) | L/D zone (B) | L/D zone (C) | LD zone (D) | ALO | CP zone (A) | CP zone (B) | CP zone (C) | CP zone (D) |
|---|---|---|---|---|---|---|---|---|---|
| 0.107 | 43.89952 | 68.64226 | 78.18008 | 77.73189 | 1 | 0.0208 | 0.0292 | 0.0176 | 0.0132 |
| 0.214 | 39.50274 | 66.48779 | 77.63682 | 78.17361 | 2 | 0.0651 | 0.1206 | 0.0683 | 0.0507 |
| 0.321 | 34.79645 | 64.08402 | 76.92907 | 78.52108 | 3 | 0.0911 | 0.327 | 0.1785 | 0.1277 |
| 0.428 | 29.77832 | 61.42086 | 76.04659 | 78.76679 | 4 | 0.1045 | 0.4423 | 0.3555 | 0.2826 |
| 0.535 | 24.44765 | 58.48864 | 74.97893 | 78.90287 | 5 | 0.1181 | 0.4625 | 0.4399 | 0.4073 |
| 0.642 | 18.80558 | 55.27829 | 73.71545 | 78.92104 | 6 | 0.1258 | 0.4595 | 0.4705 | 0.4608 |
| 0.749 | 12.85522 | 51.78145 | 72.24538 | 78.81268 | 7 | 0.125 | 0.4439 | 0.47 | 0.4764 |
| 0.856 | 6.60174 | 47.99068 | 70.55791 | 78.56881 | 8 | 0.1112 | 0.411 | 0.4549 | 0.4576 |
| 0.963 | 0.05249 | 43.89952 | 68.64226 | 78.18008 | 9 | 0.0745 | 0.3543 | 0.4288 | 0.3971 |
| 1.07 | −6.78295 | 39.50274 | 66.48779 | 77.63682 | 10 | 0.0225 | 0.2687 | 0.3924 | 0.3641 |

Zone (A) for NACA 4412.

Zone (B) for NACA 4412.

Zone (C) for NACA 4412.

Zone (D) for NACA 4412.

Zone (E) for NACA 4412.

Power coefficient for zone (A) NACA 4412.

Power coefficient for zone (B) NACA 4412.

Power coefficient for zone (C) NACA 4412.

Power coefficient for zone (D) NACA 4412.

Power coefficient for zone (E) NACA 4412.
NACA 4412 data
| r | L/D zone (A) | L/D zone (B) | L/D zone (C) | L/D zone (D) | L/D zone (E) | ALO | CP zone (A) | CP zone( B) | CP zone (C) | CP zone (D) | CP zone (E) |
|---|---|---|---|---|---|---|---|---|---|---|---|
| 0.107 | 127.0555 | 132.9032 | 127.8518 | 115.6428 | 84.72221 | 1 | −0.0111 | −0.0112 | −0.0125 | −0.0133 | −0.0148 |
| 0.214 | 125.1248 | 131.8051 | 129.9954 | 119.1474 | 88.41953 | 2 | 0.0486 | 0.0312 | 0.0121 | 0.0062 | −0.0039 |
| 0.321 | 123.0828 | 130.4361 | 131.7064 | 122.3853 | 92.24059 | 3 | 0.2461 | 0.187 | 0.1028 | 0.0845 | 0.0566 |
| 0.428 | 120.9619 | 128.8391 | 132.9705 | 125.3025 | 96.15593 | 4 | 0.4047 | 0.3631 | 0.2931 | 0.2672 | 0.2089 |
| 0.535 | 118.7907 | 127.0555 | 133.7857 | 127.8518 | 100.129 | 5 | 0.473 | 0.4514 | 0.4234 | 0.3961 | 0.3689 |
| 0.642 | 116.5936 | 125.1248 | 134.1619 | 129.9954 | 104.1164 | 6 | 0.4878 | 0.4863 | 0.4758 | 0.472 | 0.4631 |
| 0.749 | 114.3915 | 123.0828 | 134.1196 | 131.7064 | 108.0684 | 7 | 0.49 | 0.4927 | 0.4966 | 0.4964 | 0.4913 |
| 0.856 | 112.2018 | 120.9619 | 133.6881 | 132.9705 | 111.93 | 8 | 0.487 | 0.4901 | 0.4807 | 0.4683 | 0.4139 |
| 0.963 | 110.0385 | 118.7907 | 132.9032 | 133.7857 | 115.6428 | 9 | 0.4736 | 0.4837 | 0.4269 | 0.3896 | 0.2253 |
| 1.07 | 107.9129 | 116.5936 | 131.8051 | 134.1619 | 119.1474 | 10 | 0.4438 | 0.4713 | 0.4153 | 0.3214 | 0.1774 |
Zone (A) for Eppler 417.

Zone (B) for Eppler 417.

Zone (C) for Eppler 417.

Zone (D) for Eppler 417.

Zone (E) for Eppler 417.

Zone (F) for Eppler 417.

Power coefficient for zone (A) Eppler.

Power coefficient for zone (B) Eppler.

Power coefficient for zone (C) Eppler 417.

Power coefficient for zone (D) Eppler.
NACA 0012 data
| r | L/D zone (A) | L/D zone (B) | L/D zone (C) | L/D zone (D) | L/D zone (E) | L/D zone (F) | ALO | CP zone (A) | CP zone (B) | CP zone (C) | CP zone (D) | CP zone (E) | CP zone (F) |
|---|---|---|---|---|---|---|---|---|---|---|---|---|---|
| 0.107 | 120.6863 | 148.6024 | 149.7731 | 142.473 | 132.5301 | 107.9224 | 1 | −0.0135 | −0.0119 | −0.0117 | −0.0118 | −0.012 | −0.0123 |
| 0.214 | 113.5424 | 142.6 | 153.9455 | 149.7731 | 142.473 | 120.7183 | 2 | 0.0618 | 0.0297 | 0.0159 | 0.0134 | 0.0111 | 0.0069 |
| 0.321 | 106.9214 | 135.59 | 154.8998 | 153.9455 | 149.7731 | 132.5301 | 3 | 0.216 | 0.1685 | 0.1544 | 0.1461 | 0.1385 | 0.124 |
| 0.428 | 100.9702 | 128.1397 | 152.9302 | 154.8998 | 153.9455 | 142.473 | 4 | 0.2581 | 0.2395 | 0.2499 | 0.2394 | 0.2295 | 0.2106 |
| 0.535 | 95.80402 | 120.6863 | 148.6024 | 152.9302 | 154.8998 | 149.7731 | 5 | 0.4288 | 0.3166 | 0.262 | 0.312 | 0.2606 | 0.31 |
| 0.642 | 91.54546 | 113.5424 | 142.6 | 148.6024 | 152.9302 | 153.9455 | 6 | 0.4456 | 0.4539 | 0.4112 | 0.401 | 0.3871 | 0.3746 |
| 0.749 | 88.37979 | 106.9214 | 135.59 | 142.6 | 148.6024 | 154.8998 | 7 | 0.4636 | 0.4797 | 0.4645 | 0.4639 | 0.3991 | 0.4583 |
| 0.856 | 86.65945 | 100.9702 | 128.1397 | 135.59 | 142.6 | 152.9302 | 8 | 0.4778 | 0.4784 | 0.482 | 0.4667 | 0.4647 | 0.4589 |
| 0.963 | 87.16521 | 95.80402 | 120.6863 | 128.1397 | 135.59 | 148.6024 | 9 | 0.4606 | 0.4709 | 0.47 | 0.4676 | 0.4635 | 0.4455 |
| 1.07 | 91.96774 | 91.54546 | 113.5424 | 120.6863 | 128.1397 | 142.6 | 10 | 0.4274 | 0.4562 | 0.4629 | 0.4558 | 0.4497 | 0.4178 |
Compare the proposed results with previous works
| Comparison | Airfoils | Reynolds Number | Power coefficient cp |
|---|---|---|---|
| Present study | NACA 4412 | 1 × 10⁶ | 0.4966 |
| NACA 0012 | 1 × 10⁶ | 0.476 | |
| EPPLER 417 | 1 × 10⁶ | 0.482 | |
| [17] | NACA 4412 | 1 × 10⁵ | 0.49 |
| [18] | NACA 0012 | 1.76 × 10⁶ | 0.48 |
For NACA-0012, the highest value of power coefficient was at zone (D) (CP = 0.476 at λ = 7), for NACA-4412 the highest power coefficient was at zone (c) (CP = 0.04966 at λ = 7), and for Eppler-417 the highest value of power coefficient was at zone (c) (CP = 0.482 at λ = 7).

Power coefficient for zone (E) Eppler 417.

Power coefficient for zone (F) Eppler 417.
3 Conclusion and future works
The symmetrical, unsymmetrical, and supercritical airfoils (NACA 0012, NACA 4412, and Eppler 417) were taken into consideration for evaluating this proposed approach. The lift-to-drag ratio was distributed along the blade radius after choosing an effective zone that achieved an optimum power coefficient. The theoretical analyses yield the following conclusions.
Best windmill blade airfoil selection should be at a high L/D ratio and lowest angle of attack.
Popper distribution of L/D ratio generates the equal force on the blade section which integrates a stable blade and reduces variation.
Equal distribution of L/D ratio on blade radius increased power coefficient by about 15% of other distribution.
Proper distribution gives the best selection of working angles of attack at the blade section.
Minimize the overall loss of wind turbine power.
The future work could be extended to several other NACA and NREL profiles. The evaluation of profiles could be extended to an entire blade. The blade could be evaluated with a mixture of multi sections profiles over the entire blade.
-
Conflict of interest: The authors declare that they have no known competing financial interests or personal relationships that could have appeared to influence the work reported in this study.
References
[1] Bak C, Gaunaa M, Andersen P, Buhl T, Hansen P, Clemmensen K, et al. Wind tunnel test on wind turbine airfoil with adaptive trailing edge geometry. 45th AIAA Aerospace Sciences Meeting and Exhibit; 2007. p. 1016.10.2514/6.2007-1016Search in Google Scholar
[2] Hull DG. Fundamentals of airplane flight mechanics. Berlin, Heidelberg: Springer; Vol. 19, 2007. https://doi.org/10.1007/978-3-540-46573-7.10.1007/978-3-540-46573-7Search in Google Scholar
[3] Tenguria N, Mittal ND, Ahmed S. Evaluation of performance of horizontal axis wind turbine blades based on optimal rotor theory. J Urban Env Eng. 2011;5(1):15–23.10.4090/juee.2011.v5n1.015023Search in Google Scholar
[4] Kale SA, Varma RN. Aerodynamic design of a horizontal axis micro wind turbine blade using NACA 4412 profile. Int J Renew Energy Res. 2014;4(1):69–72.Search in Google Scholar
[5] Javed F, Javed S, Bilal T, Rastogi V. Design of multiple airfoil HAWT blade using MATLAB programming. IEEE Int. Conf. Renew. Energy Res. Appl; 2016. p. 425–30.10.1109/ICRERA.2016.7884373Search in Google Scholar
[6] Saad MMM, Bin Mohd S, Zulkafli MF, Shibani WME. Numerical analysis for comparison of aerodynamic characteristics of six airfoils. AIP Conf. Proc. 2017;1831(1):20004.10.1063/1.4981145Search in Google Scholar
[7] Rajakumar S, Ravindran D. Iterative approach for optimising coefficient of power, coefficient of lift and drag of wind turbine rotor. Renew Energy. 2012;38(1):83–93.10.1016/j.renene.2011.07.006Search in Google Scholar
[8] Oukassou K, El Mouhsine S, El Hajjaji A, Kharbouch B. Comparison of the power, lift and drag coefficients of wind turbine blade from aerodynamics characteristics of Naca0012 and Naca2412. Procedia Manuf. 2019;32:983–90.10.1016/j.promfg.2019.02.312Search in Google Scholar
[9] Dai J, Liu D, Wen L, Long X. Research on power coefficient of wind turbines based on SCADA data. Renew Energy. 2016;86:206–15.10.1016/j.renene.2015.08.023Search in Google Scholar
[10] Şahin İ, Acir A. Numerical and experimental investigations of lift and drag performances of NACA 0015 wind turbine airfoil. Int J Mater Mech Manuf. 2015;3(1):22–5.10.7763/IJMMM.2015.V3.159Search in Google Scholar
[11] Muheisen AH, Yass MAR, Irthiea IK. Enhancement of horizontal wind turbine blade performance using multiple airfoils sections and fences. J King Saud Univ - Eng Sci. 2021. 10.1016/j.jksues.2021.02.014.Search in Google Scholar
[12] Hau E. Wind Turbines: Fundamentals. Technol. Appl. Econ. Ed. Berlin Heidelb.; 2006. p. 23–65.10.1007/3-540-29284-5Search in Google Scholar
[13] Schepers JG, Brand AJ, Bruining A, Hand M, Infield D, Madsen H, et al. Final report of IEA Annex XVIII: enhanced field rotor aerodynamics database. Energy Res. Cent. Netherlands, ECN-C-02-016, Febr; 2002.Search in Google Scholar
[14] Jonkman JM. Modeling of the UAE Wind Turbine for Refinement of FAST {_} AD. National Renewable Energy Lab., Golden, CO (US); 2003.10.2172/15005920Search in Google Scholar
[15] Xu J, Han Z, Yan X, Song W. Aerodynamic design of megawatt wind turbine blades with NPU-WA airfoils. IOP Conf. Ser. Earth Environ. Sci. 2020:495(1):12018.10.1088/1755-1315/495/1/012018Search in Google Scholar
[16] Bakırcı M, Yılmaz S. Theoretical and computational investigations of the optimal tip-speed ratio of horizontal-axis wind turbines. Eng Sci Technol an Int J. 2018;21(6):1128–42.10.1016/j.jestch.2018.05.006Search in Google Scholar
[17] Said A, Islam M, Mohiuddin AKM, Idres M. Performance analysis of a small capacity horizontal axis wind turbine using QBlade. Int J Recent Technol Eng. 2019;7(6):153–7.Search in Google Scholar
[18] Douvi DC, Douvi EC, Margaris DP. Computational study of NACA 0012 airfoil in air-sand particle two-phase flow at reynolds Number of Re = 1.76 × 10 6. Int J N Technol Res(IJNTR). 2019;5:101–8.10.31871/IJNTR.5.4.18Search in Google Scholar
© 2022 the author(s), published by De Gruyter
This work is licensed under the Creative Commons Attribution 4.0 International License.
Articles in the same Issue
- Regular Articles
- Performance of a horizontal well in a bounded anisotropic reservoir: Part I: Mathematical analysis
- Key competences for Transport 4.0 – Educators’ and Practitioners’ opinions
- COVID-19 lockdown impact on CERN seismic station ambient noise levels
- Constraint evaluation and effects on selected fracture parameters for single-edge notched beam under four-point bending
- Minimizing form errors in additive manufacturing with part build orientation: An optimization method for continuous solution spaces
- The method of selecting adaptive devices for the needs of drivers with disabilities
- Control logic algorithm to create gaps for mixed traffic: A comprehensive evaluation
- Numerical prediction of cavitation phenomena on marine vessel: Effect of the water environment profile on the propulsion performance
- Boundary element analysis of rotating functionally graded anisotropic fiber-reinforced magneto-thermoelastic composites
- Effect of heat-treatment processes and high temperature variation of acid-chloride media on the corrosion resistance of B265 (Ti–6Al–4V) titanium alloy in acid-chloride solution
- Influence of selected physical parameters on vibroinsulation of base-exited vibratory conveyors
- System and eco-material design based on slow-release ferrate(vi) combined with ultrasound for ballast water treatment
- Experimental investigations on transmission of whole body vibration to the wheelchair user's body
- Determination of accident scenarios via freely available accident databases
- Elastic–plastic analysis of the plane strain under combined thermal and pressure loads with a new technique in the finite element method
- Design and development of the application monitoring the use of server resources for server maintenance
- The LBC-3 lightweight encryption algorithm
- Impact of the COVID-19 pandemic on road traffic accident forecasting in Poland and Slovakia
- Development and implementation of disaster recovery plan in stock exchange industry in Indonesia
- Pre-determination of prediction of yield-line pattern of slabs using Voronoi diagrams
- Urban air mobility and flying cars: Overview, examples, prospects, drawbacks, and solutions
- Stadiums based on curvilinear geometry: Approximation of the ellipsoid offset surface
- Driftwood blocking sensitivity on sluice gate flow
- Solar PV power forecasting at Yarmouk University using machine learning techniques
- 3D FE modeling of cable-stayed bridge according to ICE code
- Review Articles
- Partial discharge calibrator of a cavity inside high-voltage insulator
- Health issues using 5G frequencies from an engineering perspective: Current review
- Modern structures of military logistic bridges
- Retraction
- Retraction note: COVID-19 lockdown impact on CERN seismic station ambient noise levels
- Special Issue: Trends in Logistics and Production for the 21st Century - Part II
- Solving transportation externalities, economic approaches, and their risks
- Demand forecast for parking spaces and parking areas in Olomouc
- Rescue of persons in traffic accidents on roads
- Special Issue: ICRTEEC - 2021 - Part II
- Switching transient analysis for low voltage distribution cable
- Frequency amelioration of an interconnected microgrid system
- Wireless power transfer topology analysis for inkjet-printed coil
- Analysis and control strategy of standalone PV system with various reference frames
- Special Issue: AESMT
- Study of emitted gases from incinerator of Al-Sadr hospital in Najaf city
- Experimentally investigating comparison between the behavior of fibrous concrete slabs with steel stiffeners and reinforced concrete slabs under dynamic–static loads
- ANN-based model to predict groundwater salinity: A case study of West Najaf–Kerbala region
- Future short-term estimation of flowrate of the Euphrates river catchment located in Al-Najaf Governorate, Iraq through using weather data and statistical downscaling model
- Utilization of ANN technique to estimate the discharge coefficient for trapezoidal weir-gate
- Experimental study to enhance the productivity of single-slope single-basin solar still
- An empirical formula development to predict suspended sediment load for Khour Al-Zubair port, South of Iraq
- A model for variation with time of flexiblepavement temperature
- Analytical and numerical investigation of free vibration for stepped beam with different materials
- Identifying the reasons for the prolongation of school construction projects in Najaf
- Spatial mixture modeling for analyzing a rainfall pattern: A case study in Ireland
- Flow parameters effect on water hammer stability in hydraulic system by using state-space method
- Experimental study of the behaviour and failure modes of tapered castellated steel beams
- Water hammer phenomenon in pumping stations: A stability investigation based on root locus
- Mechanical properties and freeze-thaw resistance of lightweight aggregate concrete using artificial clay aggregate
- Compatibility between delay functions and highway capacity manual on Iraqi highways
- The effect of expanded polystyrene beads (EPS) on the physical and mechanical properties of aerated concrete
- The effect of cutoff angle on the head pressure underneath dams constructed on soils having rectangular void
- An experimental study on vibration isolation by open and in-filled trenches
- Designing a 3D virtual test platform for evaluating prosthetic knee joint performance during the walking cycle
- Special Issue: AESMT-2 - Part I
- Optimization process of resistance spot welding for high-strength low-alloy steel using Taguchi method
- Cyclic performance of moment connections with reduced beam sections using different cut-flange profiles
- Time overruns in the construction projects in Iraq: Case study on investigating and analyzing the root causes
- Contribution of lift-to-drag ratio on power coefficient of HAWT blade for different cross-sections
- Geotechnical correlations of soil properties in Hilla City – Iraq
- Improve the performance of solar thermal collectors by varying the concentration and nanoparticles diameter of silicon dioxide
- Enhancement of evaporative cooling system in a green-house by geothermal energy
- Destructive and nondestructive tests formulation for concrete containing polyolefin fibers
- Quantify distribution of topsoil erodibility factor for watersheds that feed the Al-Shewicha trough – Iraq using GIS
- Seamless geospatial data methodology for topographic map: A case study on Baghdad
- Mechanical properties investigation of composite FGM fabricated from Al/Zn
- Causes of change orders in the cycle of construction project: A case study in Al-Najaf province
- Optimum hydraulic investigation of pipe aqueduct by MATLAB software and Newton–Raphson method
- Numerical analysis of high-strength reinforcing steel with conventional strength in reinforced concrete beams under monotonic loading
- Deriving rainfall intensity–duration–frequency (IDF) curves and testing the best distribution using EasyFit software 5.5 for Kut city, Iraq
- Designing of a dual-functional XOR block in QCA technology
- Producing low-cost self-consolidation concrete using sustainable material
- Performance of the anaerobic baffled reactor for primary treatment of rural domestic wastewater in Iraq
- Enhancement isolation antenna to multi-port for wireless communication
- A comparative study of different coagulants used in treatment of turbid water
- Field tests of grouted ground anchors in the sandy soil of Najaf, Iraq
- New methodology to reduce power by using smart street lighting system
- Optimization of the synergistic effect of micro silica and fly ash on the behavior of concrete using response surface method
- Ergodic capacity of correlated multiple-input–multiple-output channel with impact of transmitter impairments
- Numerical studies of the simultaneous development of forced convective laminar flow with heat transfer inside a microtube at a uniform temperature
- Enhancement of heat transfer from solar thermal collector using nanofluid
- Improvement of permeable asphalt pavement by adding crumb rubber waste
- Study the effect of adding zirconia particles to nickel–phosphorus electroless coatings as product innovation on stainless steel substrate
- Waste aggregate concrete properties using waste tiles as coarse aggregate and modified with PC superplasticizer
- CuO–Cu/water hybrid nonofluid potentials in impingement jet
- Satellite vibration effects on communication quality of OISN system
- Special Issue: Annual Engineering and Vocational Education Conference - Part III
- Mechanical and thermal properties of recycled high-density polyethylene/bamboo with different fiber loadings
- Special Issue: Advanced Energy Storage
- Cu-foil modification for anode-free lithium-ion battery from electronic cable waste
- Review of various sulfide electrolyte types for solid-state lithium-ion batteries
- Optimization type of filler on electrochemical and thermal properties of gel polymer electrolytes membranes for safety lithium-ion batteries
- Pr-doped BiFeO3 thin films growth on quartz using chemical solution deposition
- An environmentally friendly hydrometallurgy process for the recovery and reuse of metals from spent lithium-ion batteries, using organic acid
- Production of nickel-rich LiNi0.89Co0.08Al0.03O2 cathode material for high capacity NCA/graphite secondary battery fabrication
- Special Issue: Sustainable Materials Production and Processes
- Corrosion polarization and passivation behavior of selected stainless steel alloys and Ti6Al4V titanium in elevated temperature acid-chloride electrolytes
- Special Issue: Modern Scientific Problems in Civil Engineering - Part II
- The modelling of railway subgrade strengthening foundation on weak soils
- Special Issue: Automation in Finland 2021 - Part II
- Manufacturing operations as services by robots with skills
- Foundations and case studies on the scalable intelligence in AIoT domains
- Safety risk sources of autonomous mobile machines
- Special Issue: 49th KKBN - Part I
- Residual magnetic field as a source of information about steel wire rope technical condition
- Monitoring the boundary of an adhesive coating to a steel substrate with an ultrasonic Rayleigh wave
- Detection of early stage of ductile and fatigue damage presented in Inconel 718 alloy using instrumented indentation technique
- Identification and characterization of the grinding burns by eddy current method
- Special Issue: ICIMECE 2020 - Part II
- Selection of MR damper model suitable for SMC applied to semi-active suspension system by using similarity measures