Car reliability analysis based on periodic technical tests
-
Paweł Dziedziak
 ,
Tomasz Szczepański
,
Tomasz Szczepański

Abstract
This article presents the results of the analysis of data from 500 vehicle control stations concerning periodic tests of passenger cars in the number of 2 million. Based on the collected data, a database of vehicles has been prepared to cover technical information, such as model, mass, engine capacity and maximum power. This information has been summarized with the exploitation data such as age of the car, distance traveled, the area in which the vehicle was most frequently used, the use for business or private purposes, and intensity of operation that was measured by the ratio of kilometers traveled to the age of the car. This information constituted a set of factors affecting the reliability of the car. Information about reliability itself was the results of control tests, including occurring defects and their significance. The occurring defects were codified, which allowed their allocation to particular categories describing car systems, such as steering, braking and driving. While the significance of the fault resulted from the test result: positive (minor defects) or negative (important defects). This article presents a factor and the correlation analysis of the database, which assesses which construction and operating factors have a significant impact on damages occurring in individual car systems.
1 Introduction
Vehicle defects are a common problem related to, among others, road safety, logistics and transport economics. Hence, the possibility of predicting faults, even in statistical terms, can be very helpful in the rational management of car operation. This topic is often taken up in scientific papers on the reliability of technical objects [1,2,3,4].
However, there are a number of problems here, including difficulty in selecting a research sample that is representative enough to draw conclusions of a general nature. It is worth noting that the reliability of such complex objects, which are vehicles for road traffic, depends on a relatively large number of factors – not only from the design features of the vehicles themselves but also from the road conditions in which they operate, as well as from the manner of use imposed by the driver. This necessitates the multifactor analysis, which makes the selection of a research sample difficult. Consequently, the available research samples may be too small. On their basis, the methodology of the statistical analysis can be tested, but the conclusions drawn from such analysis are significantly limited [5,6,7,8].
One of the biggest challenges in the reliability analysis is forecasting the occurrence of faults in vehicles. All estimated calculations in this respect not only lead to increased road safety but also lead to improved traffic organization and minimized costs related to road transport [2,8,9]. The literature on the subject has many statistical and probabilistic tools that allow for an estimated prognosis of the occurrence of defects. To maximize the accuracy of these tools, a relatively large statistical sample is needed, which faces the difficulties discussed earlier [5,6,15]. It is worth following at least a few new studies into how to predict vehicle faults and faults in general.
Reference [10] presents a model of the car operation system in the form of a stationary stochastic process. It allows to determine probabilistic indicators of the current and border readiness of the system. The semi-Markov process was used to model the vehicle operation system. On the example of a sample of police cars, experimental tests of the intensity of the use of the fleet and the vehicle uptime were carried out, and it was shown that the tested transport system is characterized by a satisfactory, stationary readiness factor.
Reference [9] compares the operational efficiency of city buses at different stages of their useful life. Based on the research, the operational efficiency characteristics were determined. The new division of the time of use proposed in the work made it possible to determine the most rational limit of vehicle use until the end of its operation.
Reference [11] presents methods and applications of stochastic modeling for simple damage streams of vehicles, the model of which is the Poisson process. Evaluation of the parameters of the damage processes of individual parts of vehicles is performed based on the operational database of a homogeneous fleet of vehicles operated for 5 years. The operational database is dynamically updated with new events over time.
The comparisons of readiness based on the Markov model with continuous time carried out in the previous study [12] showed differences between the model with and without the failure of occurrence interval. Furthermore, when considering the threshold values, it is important to balance the maintenance costs and lifetime of multistate components.
In ref. [13], the method of dynamic evaluation of fuzzy operational readiness (availability) of a multi-state system operating in the mode of minor damage and repairs was investigated. In this study, the theory of fuzzy sets was used. The fuzzy Markov model with discrete time and fuzzy transition probability matrix was used to analyze the fuzzy probability of the state of each element at any discrete time.
The publication [7] focuses on the assessment of the dynamics of the rotor production line, which is part of the electric motor production system. It is assumed that degradation is a heterogeneous Markov process with continuous time. Application research was carried out based on the life cycle data of seven stations. In addition, operating parameters were developed for both individual workstations and the whole system.
Reference [14] presents an analysis of the costs of work and maintenance of fleets. An optimization model was proposed that combines the traditional life cycle cost analysis and the Monte Carlo simulation model.
Research of this type is carried out in the form of theoretical considerations or based on a database covering a selected fleet of vehicles. As a result, such a database is limited in size.
Recently, however, there is the possibility of using a database of unprecedented coverage, storing information about the technical condition of cars in the country. This information is obtained from vehicle control stations. New research material available can be used to predict reliability features. Importantly, the number of entries in the database corresponds to the number of periodic vehicle tests, which in Poland reaches 40 million a year. This is the solution to the problem of insufficient data set size. The presented database operates within the CEPIK 2.0 system, which has been working since the beginning of 2018. So far, the material collected in this database has not been used for scientific analysis. The research presented here will propose an algorithm analyzing data from periodic vehicle diagnostic tests, which was used to predict defects in cars.
The following information is available in the CEPIK 2.0 database:
Selected vehicle technical data, such as curb weight, axle loads, engine type, fuel.
Selected vehicle registration data, including place and date of registration and place and date of first registration.
Date and place of the diagnostic test.
Information on the detected defects, including information about the successful or unsuccessful result of diagnostic tests, information about the observed major malfunctions, remarks regarding minor malfunctions.
Other information such as road course, manufacturer and model of the vehicle.
The aforementioned data constitute comprehensive information not only about the current state of the vehicle but also about its history and conditions of use. For example, a combination of first place and current registration information shows whether cars were imported into the country as a used vehicle. The place of registration allows to conclude about the geographical area in which the car is most often used. The test location will allow conclusions about the specifics of driving, climate or the character of the local road infrastructure. The date of the first registration combined with the road course of the car allows to draw conclusions regarding the intensity of use. Some assumptions can also be made on the basis of engine capacity and power because the dynamic driving capabilities of the vehicle can be reflected in the nature of its actual operation. The manufacturer and the model as well as selected technical parameters can inform about design features that affect reliability. Some of the aforementioned information may have a relatively small correlation, for example, high engine power does not always mean a dynamic way of driving. However, in a sufficiently large statistical sample, it will be relatively easy to verify this type of relationship.
This article will present the results of preliminary tests showing the methodology of data analysis and preliminary results, covering a research sample with 10,000 diagnostic tests.
2 Analyzed material and test method
Centralna Ewidencja Pojazdów i Kierowców (The Central Register of Vehicles and Drivers), shortcut: CEPIK, is a database in which information about vehicles registered in the country as well as drivers and candidates for drivers is stored. The second, extended version of this database, which entered into force in 2019, also includes information on periodic technical inspections of vehicles. Therefore, it is possible to use this information to analyze the reliability of vehicles.
Technical inspection data are sent to CEPIK by vehicle inspection stations. In this dissertation, the data on periodic tests coming directly from the control stations were used. These are the same data that are sent to the central database. This direct way of obtaining the results of experimental research in this study was the most advantageous because CEPIK, as a newly introduced IT system, still contains some errors. Information provided directly by vehicle inspection stations was divided into the so-called data packages, which facilitated their processing and possible elimination of errors at the IT level.
The amount of information on periodic technical inspections available for research purposes includes about 1,000,000 tests each year, which come from nearly 1,000 vehicle inspection stations. They contain data on all diagnostic tests performed in the country. For practical reasons, it was decided to limit this number due to the technical possibilities of data processing.
Data from vehicle control stations were collected in a database. Each entry in the database represented one diagnostic test, described by the following features:
Order number
Test date
Initial characters of vehicle registration number
Vehicle producer
Vehicle type and model
Vehicle identification number (VIN)
Date of first registration in the country
Date of first registration in general
Vehicle type
Vehicle category
Type of fuel
Type of test performed (periodic or additional)
Test result (positive or negative)
Date of next test
Defects found (in the form of a list of fault codes)
Vehicle road course
Based on this information, the derived information has been determined, such as
The age of the car expressed in years (based on the difference between the date of the test and the date of first registration)
Information about the fact of importing the vehicle from abroad (based on the discrepancy between the date of the first registration and the date of the first registration in the country)
Information on the significance of the faults (based on the code describing the faults found)
Intensity of use (as the quotient of road course expressed in kilometers and the age of the car expressed in years, thanks to which the average annual mileage is determined)
The database prepared in this way was equipped with a filtering tool. For discontinuous changing features (e.g., the type of vehicle), the filter allows to choose the interesting value. For constantly changing features, the filter allows you to select a range of interesting values. In this way, it was possible to create histograms and their analysis in the form of searching for correlations between selected vehicle features and the frequency of the identified defects during diagnostic tests. The results of this analysis are presented in Section 3.
The analyzed research sample included a total of 10,3016 vehicles, divided into the following types:
9,157 passenger cars, which is 88.8% of the total
1,010 trucks, which is 9.8% of the total
94 motorcycles, which is 0.9% of the total
19 special cars, which is 0.2% of the total
18 mopeds, which is 0.2% of the total
7 other motor vehicles, which is 0.1% of the total
Among the vehicles mentioned, 62.7% are vehicles powered by gasoline and 37.3% powered by diesel oil. Forty-nine percent of all vehicles were purchased domestically, and 51% were purchased abroad (the so-called individual imports).
In the analyzed sample, 2019 defects were found. The majority (1,758) were significant defects, causing a negative result of the diagnostic test. The remaining 261 faults were marked as small, without causing a negative result.
The analysis of the results consists of three steps:
Analysis of the road mileage of vehicles
Analysis of the relative age of vehicles
Analysis of the intensity of vehicle use
The following elements were used in the first two stages:
Histogram for the selected field of analysis
Failure frequency for all analyzed vehicles
Failure frequency for vehicles divided into vehicle fuel type
Failure frequency for vehicles divided by their origin.
The last stage was limited to:
Histogram for the vehicle operation intensity
Failure frequency for all analyzed vehicles
In this case, a more detailed analysis of the intensity of exploitation was abandoned because the preliminary analysis showed a relatively small correlation between the frequency of faults and the intensity of exploitation. Therefore, this area of analysis is considered less important for the presented research.
The calculations were made in the MS Excel. The described database was copied to the program sheet in a tabular form. For the calculations, both formulas built into the program package as well as own formulas were used.
The next lines of the sheet corresponded to the cars from the database. Conversely, the following columns of the sheet contained the appropriate vehicle parameters:
Entry number
Vehicle brand (e.g., FIAT)
Vehicle type and model (e.g., Punto)
Type of vehicle (e.g., passenger)
Type of fuel
Test result (positive or negative)
Fault number
Defect number decoding (major faults, minor faults or no faults)
Vehicle mileage
Vehicle age in the country
Overall age of the vehicle
Information on the origin (imported or purchased in the country)
Intensity of use
The fault codes were, for example, as follows: UD: 4.2.1.c), where the second character indicated the significance of the fault. Formula (1) categorizes the defects into major or minor defects:
The information about the origin of the vehicle used the following formula:
The intensity of use was calculated as the ratio of the vehicle mileage to its age.
Above the following columns:
Vehicle type
Type of fuel
Test result
Fault decoding
The origin of the vehicle
there was a place to enter the desired values against which the database was filtered.
Also above the following columns:
Vehicle mileage
Overall age of the vehicle
Intensity of use
there was a place to enter the desired value ranges against which the database was filtered.
To perform the filtering operation, the database table contained one more column containing information whether a given vehicle met the filtering criteria. If the criteria are met, the value 1 appears in the cell, otherwise the value 0. The following formula is used to verify that the filtering criteria are met:
Above the column with the assessment of meeting the filtering criteria, there were cells that calculate
the sum of the values in the column (which was the sum of the vehicles meeting the filtering criteria) and
percentage of the number of eligible vehicles out of all vehicles.
The filtering tool prepared in this way allowed to find the following information from the database:
The number of vehicles in a given age range, mileage or intensity of use (information for creating histograms)
The number of vehicles with defects in a given age range, mileage or intensity of use
Combinations of the aforementioned filter criteria with the fuel type or vehicle origin criterion applied simultaneously.
Data for the dependencies presented in the charts were prepared using the aforementioned tool. The assumed values of age or mileage ranges and additional assumptions for filtering the results were recorded in a tabular form, and then, these data were entered into the filtering tool and the result was recorded in the created table. Based on this, it was possible to prepare charts.
The tools built into MS Excel were used to approximate the dependencies such as:
Setting a trend line
Displaying the trendline equation
Calculation of the coefficient of determination R 2
3 Research results
Figure 1 shows the histogram of a road vehicle course. It shows that the majority of vehicles subjected to a diagnostic test at a vehicle control station was within the range of 100,000–250,000 km.

Histogram of road mileages of tested vehicles.
For each road course from Figure 1, the frequency of faults was determined as the share of the number of faults relative to the number of cars in a given range. The frequency of faults in the function of the road course is shown in Figure 2.
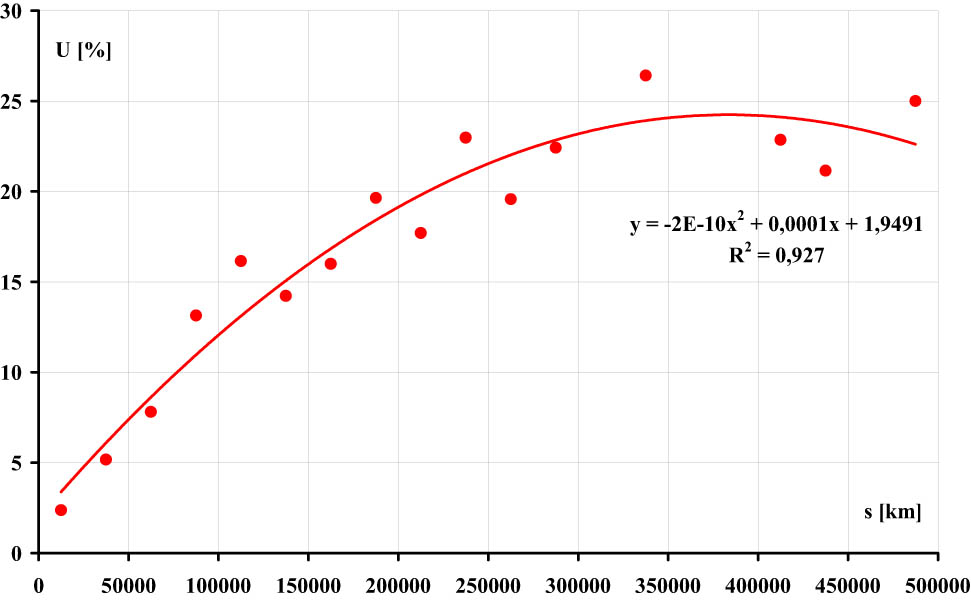
Dependence of the frequency of vehicle faults on the road mileage.
As shown in graphs in Figures 1 and 2, the share of defects in the vehicles tested increases, almost in the whole range, along with the road course. This is in line with expectations because this share corresponds to the probability of occurrence of faults, which increases with the generalized operating time of the vehicle (in this case, the generalized operating time is the road course). At the same time, the uncertainty of the result increases with the value of the road course (deviation of results relative to the regression line increases). This phenomenon is associated with a decrease in the number of vehicles in subsequent ranges of the road course.
Figure 3 shows the relationship between the share of vehicles with faults among vehicles in a given road range: for vehicles fueled with gasoline (red line) and diesel (black line). In both cases, the percentage value of the share reaches 25%, while for gasoline-powered cars, the function increases slightly earlier (with lower road course values) and then decreases (with high road course values and small numbers of vehicles taken into account in the research). Meanwhile, for diesel cars, the share of faults remains relatively low (around 5%) up to a road course value of 200,000 km, followed by a sharp jump in the share of faults to the value of 20–25%. For the subsequent values of the waveform, this level remains at an almost constant value.

Dependence of the share of vehicles with faults on the mileage of vehicles powered by petrol (red line) and diesel (black line).
Figure 4 presents the dependence of the share of vehicles with faults among vehicles in a given road course range: for preused vehicles (red line) and purchased in the country (black line). It should be noted that the share of defects in the tested vehicles reaches higher values for vehicles purchased domestically. It reaches 30% for routes over 200,000 km and 40% over 400,000 km. Meanwhile, vehicles purchased abroad rarely have a fault share above 20%. The exceptions are vehicles with low mileage, below 50,000 km, for which the share of defects in imported vehicles clearly exceeds that of vehicles purchased domestically.

Dependence of the share of vehicles with faults among vehicles in a given mileage range for vehicles purchased domestically (black line) and imported (red line).
Figure 5 shows the histogram of the age of the vehicles analyzed. Its shape is similar to the histogram of the waveform (from Figure 1), which seems understandable. Figure 6 presents the dependence of the share of vehicles with faults among vehicles in a given age range.

Vehicle age histogram.

Dependence of vehicle share with faults among vehicles in a given age range.
It is worth noting that vehicles older than 10 years have a relatively constant value of the share of defects at the level of 15%. Compared with the analogous relationship, but in the field of road course (Figure 2), it can be stated that the probability of faults is less correlated with the age of the vehicle than with its road range.
Figure 7 shows the relationship between the share of vehicles with faults among vehicles in a given age range for vehicles powered by gasoline (red line) and diesel oil (black line). Both relationships show a relatively high agreement, in both value and their distribution in the field of care age.

Dependence of the share of vehicles with faults among vehicles in a given age range for gasoline-powered vehicles (red line) and diesel fuel (black line).
Figure 8 shows the dependence of the share of vehicles with faults among vehicles in a given age range for vehicles purchased domestically (black line) and imported (red line). The differences in the values and the shape of these functions are similar to those of analogous functions in the road course domain (Figure 4), although in this case, they are less visible. Similarly, cars bought domestically have higher levels of faults.

Dependence of the share of vehicles with faults among vehicles in a given age range for vehicles purchased domestically (black line) and imported (red line).
An additional area has also been prepared in which the occurrence of defects is worth considering. It is the intensity of vehicle use, expressed in the average annual road course. Figure 9 shows the histogram of vehicle use intensity. The histogram shows that the most common average annual road course is between 5,000 and 20,000 km. In turn, the intensity of exploitation over 25,000 km per year is relatively rare.
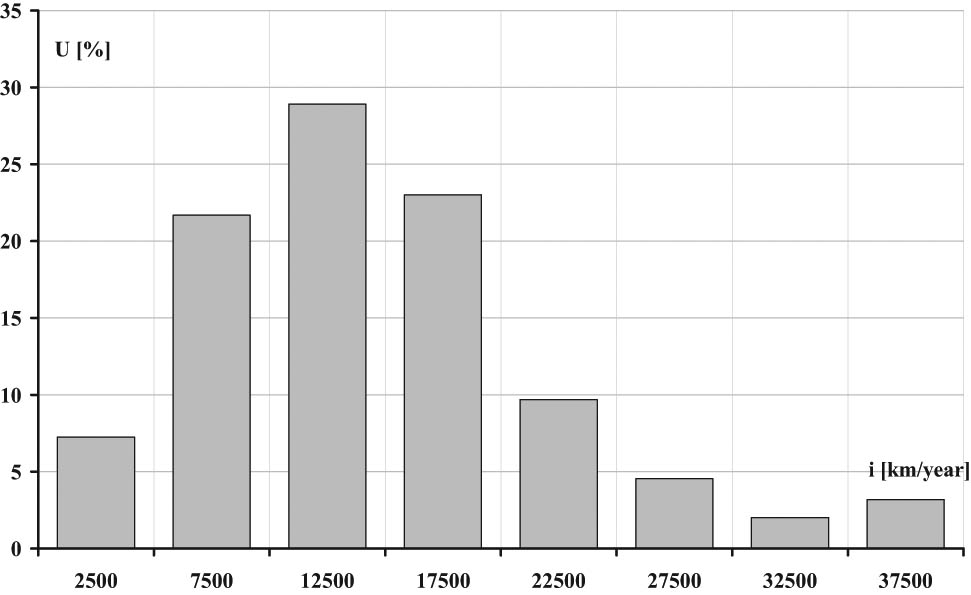
Histogram of vehicle use intensity.
Figure 10 shows the dependence of the frequency of faults on the intensity of operation. This function does not seem to be significantly correlated with the intensity of operation because the function visible on the graph increases initially and decreases after exceeding the value of 20,000 km. This means that the probability of occurrence of defects will be influenced by the road course of the vehicle and its age rather than by the intensity of use.

Dependence of the share of vehicles with faults among vehicles in a given range of intensity of exploitation.
An analysis of the most common defects was also carried out. The following is a list of faults whose share among the total number of faults exceeded 1%:
Excessive wear of the pivot, pivot bearings or rocker pins
Excessive looseness in steering rod joints (joints)
Damage to the light source illuminating the rear registration plate
The brake does not work on one side or the vehicle pulls excessively to the side
The shock absorber is damaged and shows large leaks or damage
Excessive leakage of any fluid that may threaten the environment or the safety of other road users
No clear border of light and shadow of the passing beam
Damage to the “stop” light source
Excessive corrosion affecting the rigidity of the chassis structure or the frame and components attached thereto
The SRS self-diagnostic indicator indicates any type of failure in the airbag system
The tire tread depth not in accordance with the requirements of the regulation on technical conditions
Damage to the light source of the front, rear and side position lamps or marker lamps
The emission of gaseous pollutants exceeds the maximum values specified in the regulation on technical conditions petrol engine
No continuous increase in braking force (sticking) in the service brake system
Efficiency less than the minimum values contained in the regulation on technical conditions in the service brake system
The light beam does not hit the license plate surface
Excessive delay in the operation of the brakes on any wheel in the service brake system
Lack of required braking performance in the parking braking system
The OBD system displays emission related fault codes (gasoline engine)
Insufficient braking force on at least one wheel of the auxiliary (emergency) braking system (if present as a separate system)
Damage or cracking of the suspension spring
Damage to the light source illuminating the registration plate
The condition of the brake pipes may cause breakdown or breakage
Clearly leaking exhaust system (in the context of noise)
Insufficient braking force on at least one wheel in the service brake system
Insecure attachment of a front, side, rear position lamp or end-outline marker lamp
A warning indicator indicates a defective antilock braking system (ABS)
No light, source of light or damage to it (applies to driving beam or passing beam)
Efficiency less than the minimum values contained in the regulation on technical conditions in the auxiliary (emergency) braking system (if present as a separate system)
Exceeding the value of gaseous emissions, referred to in the Regulation on technical conditions (compression-ignition engine)
Uncertain attachment or poor condition of the floor in the vehicle
Damage to the reversing light source
Excessive wear of brake pads or linings
The brakes do not work on one side in the parking braking system
Excessive wear of steering joints connection
The convergence value of wheel alignment exceeds the permissible limits for a given type of vehicle
No document issued by the transport technical inspection and a data plate on the tank or cylinder, confirming its efficiency
Cracks or discoloration of the glass or transparent pane or plastic (if allowed)
Defective front, side, rear position lamp or end-outline lamp
No emission control device installed, modification of the device or clearly incorrect operation (gasoline engine)
Leaks affecting the measurement of exhaust emissions (gasoline engine)
The aforementioned faults are listed in order from most to least frequent. As it can be seen, they can be divided into several categories, referring, for example, to individual vehicle systems, such as braking system, steering system or vehicle lighting. Defects corresponding to legal irregularities were also registered, such as the lack of a document issued by the transport technical inspection.
4 Summary
The presented test results are compatible with expectations and indicate that the frequency of defects increases with the age of the car and its road course. The degree of correlation of this relationship increases significantly with the size of the test sample, expressed in the number of vehicles subjected to the diagnostic test. This confirms the credibility of the test results.
The frequency of faults among the vehicles tested in the considered groups is more strongly correlated with the mileage of vehicles than with their age.
In the field of the intensity of operation, the occurrence of faults in vehicles reaches the highest values for average intensity of 15,000–20,000 km/year.
Comparison of the occurrence of faults in petrol- and diesel-fueled vehicles indicates a higher failure rate of gasoline vehicles in the field of the vehicle road course, but this phenomenon is not observed in the field of vehicle age.
Comparison of the occurrence of defects in vehicles purchased domestically and purchased abroad and imported indicates a higher failure rate of vehicles purchased domestically in the case of vehicles with a mileage of over 100,000 km.
These observations show that the operating time is not the only significant factor conditioning the occurrence of vehicle defects. Both construction and functional factors are also important. The impact of these factors on faults will be analyzed in further research planned by the authors.
-
Conflict of interest: Authors state no conflict of interest.
References
[1] Dziedziak P. Problematyka merytoryczno-prawna związana z badaniami technicznymi w kontekście funkcjonowania Biura Patronatu ITS nad SKP – wybrane zagadnienia (Substantive and legal issues related to technical research in the context of the functioning of the MTI Patronage Office over SKP – selected issues). Wydawnictwo Konferencyjne Badania Techniczne w Świetle Obowiązujących Przepisów; 2013.Search in Google Scholar
[2] Jędra I. Wpływ wieku samochodu na bezpieczeństwo w transporcie drogowym (Influence of car age on safety in road transport). Autobusy Technika Eksploatacja Systemy Transportowe; 2017 Dec.Search in Google Scholar
[3] Kowalski M, Magott J, Nowakowski T, Werbinska-Wojciechowska S. Analysis of transportation system with the use of Petri nets. Eksploatacja i Niezawodnosc – Maintenance and Reliability. 2011 Jan;13:265–76.Search in Google Scholar
[4] Rymarz J, Niewczas A. Ocena gotowości technicznej autobusów komunikacji miejskiej na przykładzie miejskiego przedsiębiorstwa komunikacyjnego w Lublinie (Assessment of technical readiness of public transport buses on the example of the municipal transport company in Lublin), Czasopismo Techniczne Politechniki Krakowskiej; 4-M/2012.Search in Google Scholar
[5] Arunraj N, Maiti J. Risk-based maintenance – techniques and applications. Journal of Hazardous Materials. 2007:142:653–61.10.1016/j.jhazmat.2006.06.069Search in Google Scholar PubMed
[6] Idzikowski A. Stan techniczny i wyposażenie pojazdów samochodowych a bezpieczeństwo ruchu drogowego (Technical condition and equipment of motor vehicles and road traffic safety). Studia i Materiały Polskiego Stowarzyszenia Zarządzania Wiedza/Studies and proceedings polish association for knowledge management; 46/2011.Search in Google Scholar
[7] Iscioglu F, Kocak A. Dynamic reliability analysis of a multi-state manufacturing system. Eksploatacja i Niezawodnosc – Maintenance and Reliability. 2019;21(3):451–9.10.17531/ein.2019.3.11Search in Google Scholar
[8] Tylicki H. Prognozowanie stanu technicznego środków transportu (Forecasting the technical condition of means of transport). Autobusy; 2016 June.Search in Google Scholar
[9] Niewczas A, Rymarz J, Dębicka E. Stages of operating vehicles with respect to operational efficiency using city buses as an example. Eksploatacja i niezawodnosc – Maintenance and Reliability. 2019;21(1):21–7. 10.17531/ein.2019.1.3.Search in Google Scholar
[10] Borucka A, Niewczas A, Hasilova K. Forecasting the readiness of special vehicles rusing the semi-Markov model. Eksploatacja i niezawodnosc – Maintenance and Reliability. 2019;21(4):662–9. 10.17531/ein.2019.4.16.Search in Google Scholar
[11] Andrzejczak K, Młyńczak M, Selech J. Poisson-distributed failures in the predicting of the cost of corrective maintenance. Eksploatacja i Niezawodnosc – Maintenance and Reliability. 2018;20(4):602–9.10.17531/ein.2018.4.11Search in Google Scholar
[12] Dong W, Liu S, Yang X, Wang H, Fang Z. Balancing reliability and maintenance cost rate of multi – state components with fault interval omission. Eksploatacja i Niezawodnosc – Maintenance and Reliability. 2019;21(1):37–45.10.17531/ein.2019.1.5Search in Google Scholar
[13] Hu L, Su P, Peng R, Zhang Z. Fuzzy availability assessment for discrete time multi-state system under minor failures and repairs by using fuzzy Lz transform. Eksploatacja i Niezawodnosc – Maintenance and Reliability. 2017;19(2):179–90.10.17531/ein.2017.2.5Search in Google Scholar
[14] Macián V, Tormos B, Riechi J. Time replacement optimization model: comparative analysis of urban transport fleets using Monte Carlo Simulation. Eksploatacja i Niezawodnosc – Maintenance and Reliability. 2017;19(2):151–7.10.17531/ein.2017.2.1Search in Google Scholar
[15] Oprzędkiewicz J, Młynarski S. Problemy predykcji jakości i niezawodności pojazdów samochodowych (Problems of predicting the quality and reliability of motor vehicles), Konstrukcja, badania, eksploatacja, technologia pojazdów samochodowych i silników spalinowych. Teka Komisji Naukowo-Problemowej Motoryzacji Państwowej Akademii Nauk; 21/2000.Search in Google Scholar
© 2021 Paweł Dziedziak et al., published by De Gruyter
This work is licensed under the Creative Commons Attribution 4.0 International License.
Articles in the same Issue
- Regular Articles
- Electrochemical studies of the synergistic combination effect of thymus mastichina and illicium verum essential oil extracts on the corrosion inhibition of low carbon steel in dilute acid solution
- Adoption of Business Intelligence to Support Cost Accounting Based Financial Systems — Case Study of XYZ Company
- Techno-Economic Feasibility Analysis of a Hybrid Renewable Energy Supply Options for University Buildings in Saudi Arabia
- Optimized design of a semimetal gasket operating in flange-bolted joints
- Behavior of non-reinforced and reinforced green mortar with fibers
- Field measurement of contact forces on rollers for a large diameter pipe conveyor
- Development of Smartphone-Controlled Hand and Arm Exoskeleton for Persons with Disability
- Investigation of saturation flow rate using video camera at signalized intersections in Jordan
- The features of Ni2MnIn polycrystalline Heusler alloy thin films formation by pulsed laser deposition
- Selection of a workpiece clamping system for computer-aided subtractive manufacturing of geometrically complex medical models
- Development of Solar-Powered Water Pump with 3D Printed Impeller
- Identifying Innovative Reliable Criteria Governing the Selection of Infrastructures Construction Project Delivery Systems
- Kinetics of Carbothermal Reduction Process of Different Size Phosphate Rocks
- Plastic forming processes of transverse non-homogeneous composite metallic sheets
- Accelerated aging of WPCs Based on Polypropylene and Birch plywood Sanding Dust
- Effect of water flow and depth on fatigue crack growth rate of underwater wet welded low carbon steel SS400
- Non-invasive attempts to extinguish flames with the use of high-power acoustic extinguisher
- Filament wound composite fatigue mechanisms investigated with full field DIC strain monitoring
- Structural Timber In Compartment Fires – The Timber Charring and Heat Storage Model
- Technical and economic aspects of starting a selected power unit at low ambient temperatures
- Car braking effectiveness after adaptation for drivers with motor dysfunctions
- Adaptation to driver-assistance systems depending on experience
- A SIMULINK implementation of a vector shift relay with distributed synchronous generator for engineering classes
- Evaluation of measurement uncertainty in a static tensile test
- Errors in documenting the subsoil and their impact on the investment implementation: Case study
- Comparison between two calculation methods for designing a stand-alone PV system according to Mosul city basemap
- Reduction of transport-related air pollution. A case study based on the impact of the COVID-19 pandemic on the level of NOx emissions in the city of Krakow
- Driver intervention performance assessment as a key aspect of L3–L4 automated vehicles deployment
- A new method for solving quadratic fractional programming problem in neutrosophic environment
- Effect of fish scales on fabrication of polyester composite material reinforcements
- Impact of the operation of LNG trucks on the environment
- The effectiveness of the AEB system in the context of the safety of vulnerable road users
- Errors in controlling cars cause tragic accidents involving motorcyclists
- Deformation of designed steel plates: An optimisation of the side hull structure using the finite element approach
- Thermal-strength analysis of a cross-flow heat exchanger and its design improvement
- Effect of thermal collector configuration on the photovoltaic heat transfer performance with 3D CFD modeling
- Experimental identification of the subjective reception of external stimuli during wheelchair driving
- Failure analysis of motorcycle shock breakers
- Experimental analysis of nonlinear characteristics of absorbers with wire rope isolators
- Experimental tests of the antiresonance vibratory mill of a sectional movement trajectory
- Experimental and theoretical investigation of CVT rubber belt vibrations
- Is the cubic parabola really the best railway transition curve?
- Transport properties of the new vibratory conveyor at operations in the resonance zone
- Assessment of resistance to permanent deformations of asphalt mixes of low air void content
- COVID-19 lockdown impact on CERN seismic station ambient noise levels
- Review Articles
- FMEA method in operational reliability of forest harvesters
- Examination of preferences in the field of mobility of the city of Pila in terms of services provided by the Municipal Transport Company in Pila
- Enhancement stability and color fastness of natural dye: A review
- Special Issue: ICE-SEAM 2019 - Part II
- Lane Departure Warning Estimation Using Yaw Acceleration
- Analysis of EMG Signals during Stance and Swing Phases for Controlling Magnetorheological Brake applications
- Sensor Number Optimization Using Neural Network for Ankle Foot Orthosis Equipped with Magnetorheological Brake
- Special Issue: Recent Advances in Civil Engineering - Part II
- Comparison of STM’s reliability system on the example of selected element
- Technical analysis of the renovation works of the wooden palace floors
- Special Issue: TRANSPORT 2020
- Simulation assessment of the half-power bandwidth method in testing shock absorbers
- Predictive analysis of the impact of the time of day on road accidents in Poland
- User’s determination of a proper method for quantifying fuel consumption of a passenger car with compression ignition engine in specific operation conditions
- Analysis and assessment of defectiveness of regulations for the yellow signal at the intersection
- Streamlining possibility of transport-supply logistics when using chosen Operations Research techniques
- Permissible distance – safety system of vehicles in use
- Study of the population in terms of knowledge about the distance between vehicles in motion
- UAVs in rail damage image diagnostics supported by deep-learning networks
- Exhaust emissions of buses LNG and Diesel in RDE tests
- Measurements of urban traffic parameters before and after road reconstruction
- The use of deep recurrent neural networks to predict performance of photovoltaic system for charging electric vehicles
- Analysis of dangers in the operation of city buses at the intersections
- Psychological factors of the transfer of control in an automated vehicle
- Testing and evaluation of cold-start emissions from a gasoline engine in RDE test at two different ambient temperatures
- Age and experience in driving a vehicle and psychomotor skills in the context of automation
- Consumption of gasoline in vehicles equipped with an LPG retrofit system in real driving conditions
- Laboratory studies of the influence of the working position of the passenger vehicle air suspension on the vibration comfort of children transported in the child restraint system
- Route optimization for city cleaning vehicle
- Efficiency of electric vehicle interior heating systems at low ambient temperatures
- Model-based imputation of sound level data at thoroughfare using computational intelligence
- Research on the combustion process in the Fiat 1.3 Multijet engine fueled with rapeseed methyl esters
- Overview of the method and state of hydrogenization of road transport in the world and the resulting development prospects in Poland
- Tribological characteristics of polymer materials used for slide bearings
- Car reliability analysis based on periodic technical tests
- Special Issue: Terotechnology 2019 - Part II
- DOE Application for Analysis of Tribological Properties of the Al2O3/IF-WS2 Surface Layers
- The effect of the impurities spaces on the quality of structural steel working at variable loads
- Prediction of the parameters and the hot open die elongation forging process on an 80 MN hydraulic press
- Special Issue: AEVEC 2020
- Vocational Student's Attitude and Response Towards Experiential Learning in Mechanical Engineering
- Virtual Laboratory to Support a Practical Learning of Micro Power Generation in Indonesian Vocational High Schools
- The impacts of mediating the work environment on the mode choice in work trips
- Utilization of K-nearest neighbor algorithm for classification of white blood cells in AML M4, M5, and M7
- Car braking effectiveness after adaptation for drivers with motor dysfunctions
- Case study: Vocational student’s knowledge and awareness level toward renewable energy in Indonesia
- Contribution of collaborative skill toward construction drawing skill for developing vocational course
- Special Issue: Annual Engineering and Vocational Education Conference - Part II
- Vocational teachers’ perspective toward Technological Pedagogical Vocational Knowledge
- Special Issue: ICIMECE 2020 - Part I
- Profile of system and product certification as quality infrastructure in Indonesia
- Prediction Model of Magnetorheological (MR) Fluid Damper Hysteresis Loop using Extreme Learning Machine Algorithm
- A review on the fused deposition modeling (FDM) 3D printing: Filament processing, materials, and printing parameters
- Facile rheological route method for LiFePO4/C cathode material production
- Mosque design strategy for energy and water saving
- Epoxy resins thermosetting for mechanical engineering
- Estimating the potential of wind energy resources using Weibull parameters: A case study of the coastline region of Dar es Salaam, Tanzania
- Special Issue: CIRMARE 2020
- New trends in visual inspection of buildings and structures: Study for the use of drones
- Special Issue: ISERT 2021
- Alleviate the contending issues in network operating system courses: Psychomotor and troubleshooting skill development with Raspberry Pi
- Special Issue: Actual Trends in Logistics and Industrial Engineering - Part II
- The Physical Internet: A means towards achieving global logistics sustainability
- Special Issue: Modern Scientific Problems in Civil Engineering - Part I
- Construction work cost and duration analysis with the use of agent-based modelling and simulation
- Corrosion rate measurement for steel sheets of a fuel tank shell being in service
- The influence of external environment on workers on scaffolding illustrated by UTCI
- Allocation of risk factors for geodetic tasks in construction schedules
- Pedestrian fatality risk as a function of tram impact speed
- Technological and organizational problems in the construction of the radiation shielding concrete and suggestions to solve: A case study
- Finite element analysis of train speed effect on dynamic response of steel bridge
- New approach to analysis of railway track dynamics – Rail head vibrations
- Special Issue: Trends in Logistics and Production for the 21st Century - Part I
- Design of production lines and logistic flows in production
- The planning process of transport tasks for autonomous vans
- Modeling of the two shuttle box system within the internal logistics system using simulation software
- Implementation of the logistics train in the intralogistics system: A case study
- Assessment of investment in electric buses: A case study of a public transport company
- Assessment of a robot base production using CAM programming for the FANUC control system
- Proposal for the flow of material and adjustments to the storage system of an external service provider
- The use of numerical analysis of the injection process to select the material for the injection molding
- Economic aspect of combined transport
- Solution of a production process with the application of simulation: A case study
- Speedometer reliability in regard to road traffic sustainability
- Design and construction of a scanning stand for the PU mini-acoustic sensor
- Utilization of intelligent vehicle units for train set dispatching
- Special Issue: ICRTEEC - 2021 - Part I
- LVRT enhancement of DFIG-driven wind system using feed-forward neuro-sliding mode control
- Special Issue: Automation in Finland 2021 - Part I
- Prediction of future paths of mobile objects using path library
- Model predictive control for a multiple injection combustion model
- Model-based on-board post-injection control development for marine diesel engine
- Intelligent temporal analysis of coronavirus statistical data