Theoretical research on load distribution of composite pre-tightened teeth connections embedded with soft layers
-
Fei Li
 ,
Shuting Ye
,
Qilin Zhao
,
Shuting Ye
,
Qilin Zhao

Abstract
It has been proved by experiments that the soft layers can effectively adjust the load distribution ratio of composite pre-tightened tooth connection, but theoretical research on the composite pre-tightened tooth connection embedded with soft layers has not been carried out. Therefore, in this work, the load distribution theory of composite pre-tightened tooth connection embedded with soft layers is studied by spring stiffness method. First, based on deformation compatibility condition, the theoretical calculation formula of load distribution ratio of each tooth is derived by spring stiffness method. Then, load distribution ratio is obtained by experiments, and the theoretical calculation results are verified. Finally, through the derived formula, the load distribution ratio of the composite pre-tightened tooth connection embedded with soft layers is parameterized. Research shows that (1) The theoretical value is in good agreement with the experimental value, and the maximum error of calculation result of the load distribution of the joint is 8%; (2) Under the action of soft layers, each tooth of two-teeth and three-teeth joints are damaged at the same time, the ultimate bearing capacity is increased by 29.0 and 21.6%, respectively, compared with the traditional two-teeth and three-teeth joints; (3) The elastic modulus and thickness of soft layers have a significant impact on the load distribution ratio of each tooth.
1 Introduction
Composite materials have been widely used in aerospace industry, civil engineering industry, and other fields due to their excellent mechanical properties [1]. For composite structures, the connection between composite materials has always been a weak point restricting the promotion of composite structures [2]. Therefore, an efficient connection method is very important for the development of composite structures [3,4]. Compared with the traditional composite connection technology [5,6,7], composite pre-tightened teeth connection is a new connection technology with higher connection efficiency and better fatigue performance [8]. This connection technology transmits the external load through the interlaminar shear of the composite material and the interface friction f between the metal connector and the composite material plate (Figure 1). the interlaminar shear strength of the composite is significantly higher than that of shear strength of a simple adhesive, and the transverse compressive stress further improves the interlaminar shear strength of the composite material [9], so the connection technology has high connection efficiency [10,11]. At present, the connection technology has been widely used in bridge engineering space truss pieces [12], and large-span truss bridges [13,14,15] in bridge engineering, showing good application prospects.

Schematic of force transmission of the pre-tightened teeth connection.
Yifeng et al. [16] found that composites do not have the ability to redistribute stress because they are made of brittle materials; moreover, the load distribution of each tooth of composite pre-tightened tooth connection is uneven in the process of transferring load, which makes the strength of the composite structure not fully play. In order to utilized, Fei et al. [17] prepared the composite pre-tightened tooth connection embedded with soft layers and conducted experiments, as shown in Figure 2. The experiment proves that the soft layers can be used to allocate the load distribution ratio of each tooth, and the soft layers can realize the uniform distribution of the load of each tooth under a certain thickness combination, so as to improve the ultimate bearing capacity of the joint. However, the theoretical research on the load distribution ratio of composite pre-tightened tooth connection embedded with soft layers has not been carried out.
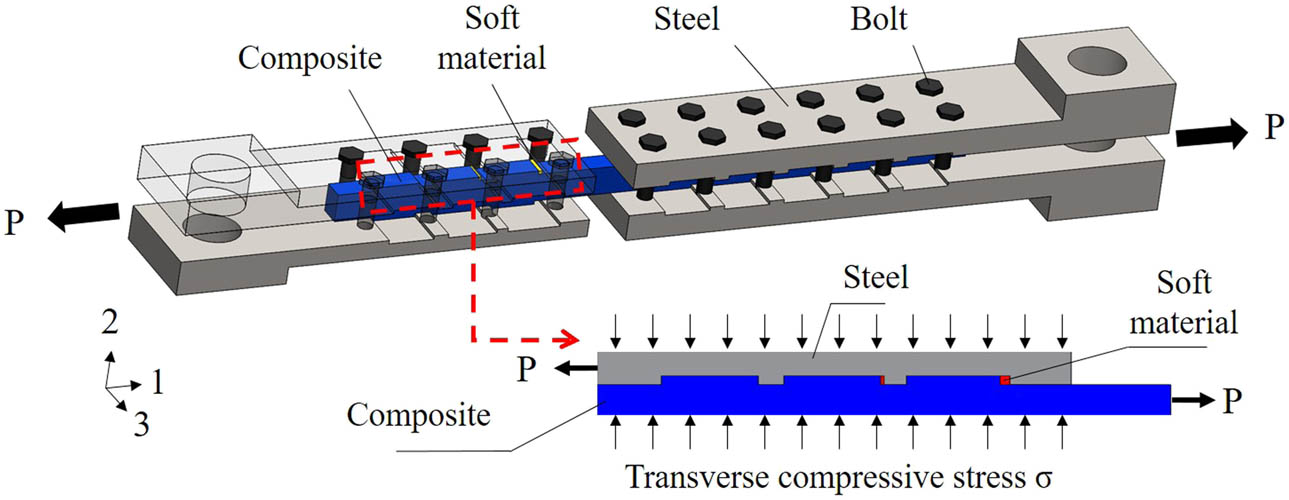
Mechanism diagram of the composite pre-tightened tooth connection embedded with soft layers.
There are three main methods for load distribution of composite joints: analytical approaches, numerical methods, and experiment tests. The finite element method is able to consider the effect of almost all factors on the load distribution ratio of each tooth of composite pre-tightened tooth connection, such as depth of teeth, length of teeth, and number of teeth [18]. This approach involves more computing time, especially when the soft layer is considered. The analytical approaches are cost-effective approaches which can be used to study the problems of composite pre-tightened tooth connection. At present, based on the shear nonlinear constitutive model of composite materials, Yifeng et al. [18] deduced the formula for the calculation of load distribution ratio of each tooth of traditional composite pre-tightened tooth connection (without soft layers), and studied the influence of multiple parameters on the load distribution ratio in combination with experiments. However, due to the large deformation of soft layers, the calculation method cannot consider the influence of soft layers on the load distribution ratio of each tooth. Therefore, it is necessary to establish a new theoretical model to calculate the load distribution ratio of each tooth of the joint embedded with soft layers. The spring stiffness method has been widely used to study the load distribution [19,20,21] and failure prediction of composite bolt joints [22]. The spring stiffness method was developed by Tate and Rosenfeld [20]. This method is extended to study the effect of clearance [21], the friction effect [19] and hole position error [23], and secondary bending effect is also considered as the problem for bolted joints [24,25].
The spring stiffness method is cost-effective to predict the load distribution of composite bolted joints. However, at present, there is no research on the application of spring stiffness method to calculate the load distribution ratio of composite pre-tightened tooth connection. In this study, each part of the composite pre-tightened tooth connection is simplified as the corresponding stiffness spring, and the calculation formula of the load distribution ratio of the traditional composite pre-tightened tooth connection is derived through the shear deformation coordination condition of the joint. On this basis, the formula for calculating the load distribution ratio of composite pre-tightened tooth joints with embedded binder as a soft layer is derived. Then, the load distribution ratios of each tooth of the composite pre-tightened tooth joint embedded in the soft layer in the experiment are compared with the theoretical values to verify the correctness of the derived theoretical formula for embedded bond. Finally, the influence of the adhesive thickness and elastic modulus on the load distribution ratio of each tooth is studied by the theoretical formula.
2 Theoretical formula derivation
Due to the difference in the structure and force transmission mechanism between the composite pre-tightened connection and the composite bolted connection, the traditional spring stiffness method used for composite bolted connection is not suitable for composite pre-tightened tooth connection. In order to apply the spring stiffness method to the load distribution analysis of composite pre-tightened tooth connection, it is necessary to improve the traditional spring stiffness method. Assumptions for deriving the load distribution formula of composite pre-tightened connection are as follows: (1) The entire material maintains linear elasticity; (2) The deformation between composite tooth and steel tooth meets the deformation compatibility condition; (3) the friction force is evenly distributed on the entire joint interface.
In this section, the load distribution theory of composite pre-tightened tooth connection is studied by taking as examples the composite pre-tightened tooth connection without soft layers and the composite pre-tightened tooth connection embedded with soft layers. The specimen structure is shown in Figure 3(a) and (b). The difference between the three-tooth joint embedded with soft layers and the three-tooth joint without soft layers is that the gap between the first tooth and the second tooth of the composite pre-tightened tooth joint embedded with soft layers is preset and then filled with soft layers. In the simplified model of composite, pre-tightened tooth connection embedded with soft layers, the soft layers are simplified as a spring and embedded between composite teeth and steel teeth. Therefore, the application of the spring stiffness method to the theoretical study of composite pre-tightened tooth connection without soft layers is the basis for the theoretical study of composite pre-tightened tooth connection embedded with soft layers.
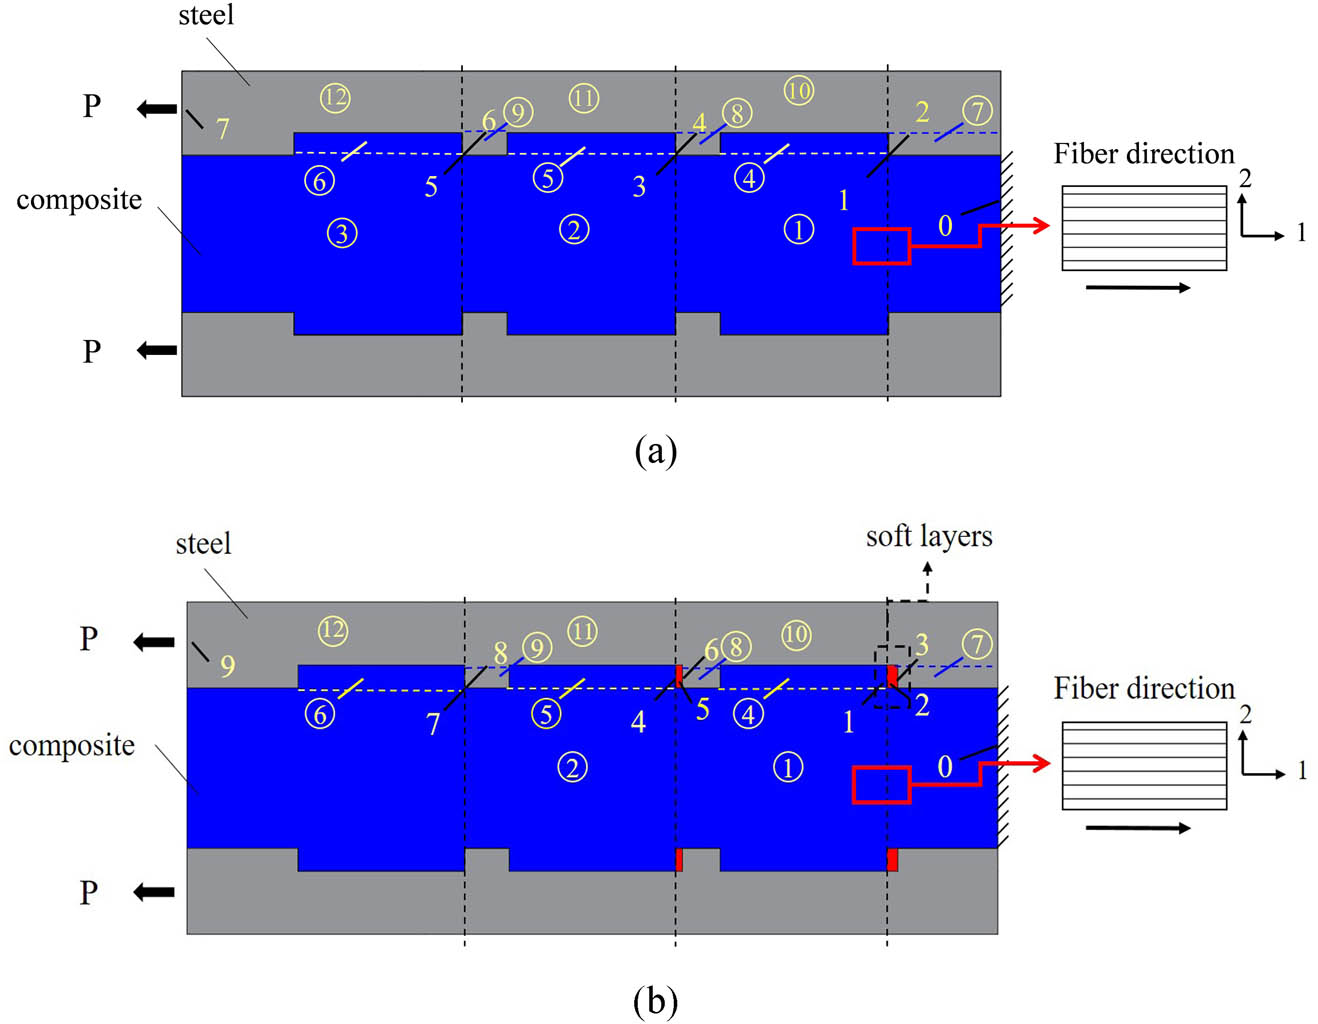
(a) A schematic diagram of the traditional pre-tightened three-tooth joint and (b) schematic diagram of the pre-tightened three-tooth joint embedded with soft layers.
As shown in Figure 3(a), the spring stiffness K F1 represents the stiffness of the composite plate (1) region between the fixed end of the composite plate 0 and the front end of the second composite tooth (5) (position 3). The spring stiffness K F2 represents the stiffness of the composite plate (2) region between the first composite tooth (4) tooth end and the front end of the third composite tooth (6) (position 5). The spring stiffness K F3 represents the stiffness of the composite plate (3) region between the front end of the third composite tooth (6) (position 5) and the end of the composite plate. Similarly, spring stiffness K S1, K S2, and K S3 represent the stiffness of the three steel plate regions. The deformations of the composite tooth are simulated by the spring with K T stiffness. Among them, K T1, K T2, and K T3 represent the spring stiffness of the three-tooth connection structures, respectively.
2.1 Spring stiffness method model of the pre-tightened three-tooth joint without soft layers
According to the basic idea of spring stiffness method, the composite plate, steel plate, and tooth are assumed to be springs with different stiffness. The simplified spring stiffness model is shown in Figure 4.
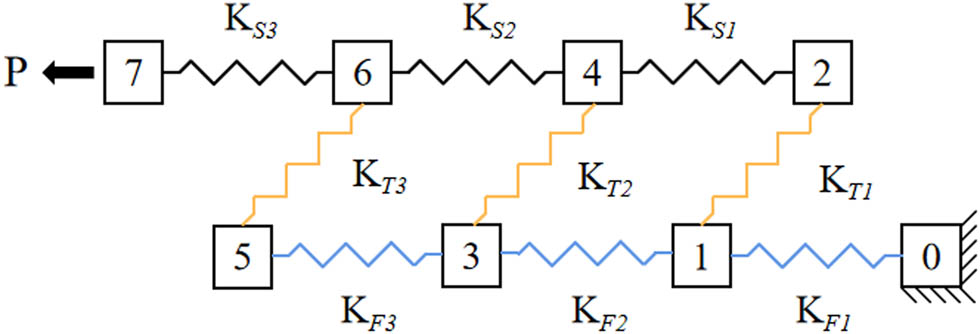
Simplified spring stiffness model of the traditional three-teeth joint.
Based on the condition of deformation coordination, the displacement of the contact surface between the composite plate and the steel plate at the tooth–tooth interface should be the same, i.e., the displacement of positions 1 and 2 is the same, the displacement of positions 3 and 4 is the same, and the displacement of positions 5 and position 6 is the same. The displacements of each key position and loading end 7 were simulated by the displacements x 1, x 2, and x 7 of mass blocks 1–7. In addition, the following points should be noted:
Assuming that the friction force is uniformly distributed around the structure under preload;
When it is used for the composite pre-tightened force tooth joint, only half of the thickness of the composite plate should be used to calculate K F, and the load applied on the end of the steel plate (mass 7) should be half of the actual load on the joint.
The tooth depth and tooth length of each tooth of the specimen derived in this study are equal, namely: K F1 = K F2 = K F3 = K F , K S1 = K S2 = K S3 = K S, and K T1 = K T2 = K T3 = K T.
For mass 1,
For mass 4,
Similar stress analysis is carried out on the other masses, and the linear equations between mass block displacement and external load can be obtained after finishing.
where K is the stiffness matrix of K F, K S and K T. K F is the stiffness of composite plate, K S is the stiffness of steel plate, K T is the stiffness of composite tooth and steel plate tooth meshing, X is the displacement vector of mass block, and V is the load vector.
The load p 1, p 2, and p 3 of the three teeth are
The load distribution ratio of each teeth is
Using the above equation, the internal force distribution ratio of each tooth under any accidental load P is obtained.
2.2 Spring stiffness method model of the pre-tightened three-tooth joint embedded with soft layers
The spring stiffness model of the three-tooth joint embedded with soft layers is shown in Figure 5. It can be seen that the main difference between the spring stiffness model considering the soft layer and the spring stiffness model without soft layer is that the connection between the tooth is changed, i.e., a soft layer stiffness spring is added.
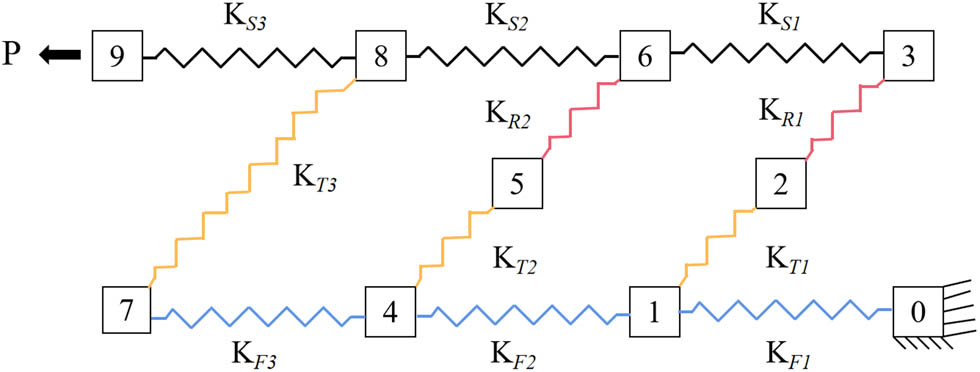
Simplified spring stiffness model of the three-teeth joint embedded with soft layers.
The force equilibrium analysis of the mass block at the first tooth end second tooth end is carried out, and the equilibrium equation is
For mass 2,
For mass 5,
With the same method, the overall spring stiffness matrix becomes
The stiffness matrix K is composed of composite plate stiffness K F, steel plate stiffness K s, tooth structure stiffness K T, and soft material stiffness K R. According to McCarthy et al. [21], the equivalent stiffness calculation formula of composite plate K F and steel plate K S is as follows:
where E F is the elastic modulus of composite plate along the loading direction; w F and t F are the width and thickness of the composite plate, respectively, p is the distance between the first composite tooth end and the second composite tooth end.
where E S is the elastic modulus of the lap plate along the loading direction; ws and ts are the width and thickness of the lap plate, respectively.
Referring to the definition of tooth stiffness [26], the mathematical description is as follows:
where K T represents the single tooth stiffness of the tooth structure; F n represents normal load; b represents the tooth width; ∑δ represents the average deformation of the bevel gear in the tooth line direction at the meshing point.
According to the definition of stiffness and the actual situation of composite pre-tightened force tooth connection, this study puts forward the calculation formula of equivalent stiffness of soft layers.
where E R is the compressive elastic modulus of soft layer; G R is the shear elastic modulus of soft layer; w R and t R are the width of the soft layers and the height along the tooth depth direction, respectively; h R is the thickness of soft layers along the loading direction, namely, h 1 and h 2. The first term describes the extrusion deformation of the soft layers, and the second term describes the shear deformation of the soft layers.
The calculated K F, K S, K T, and KR are taken into the stiffness matrix K and then the load distribution ratio of each tooth is obtained by combining the formulas (5)–(13).
3 Experiment
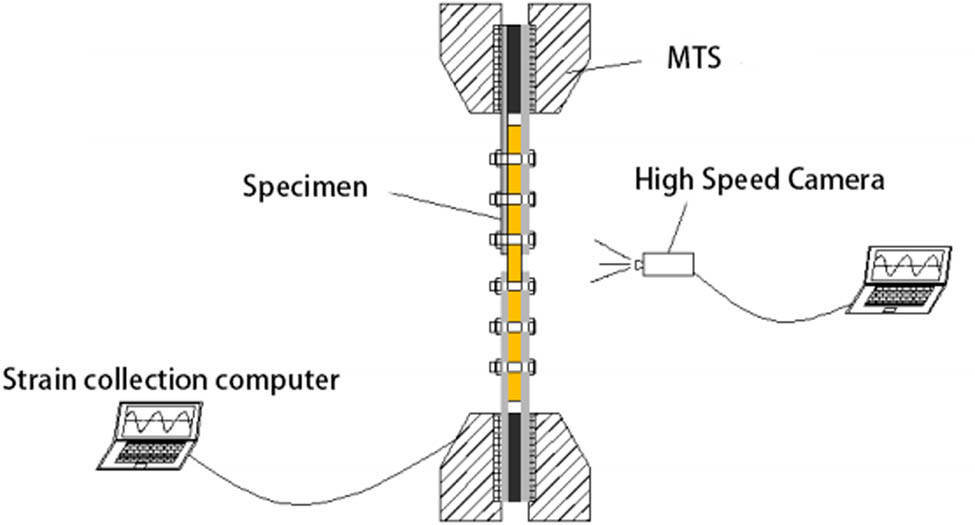
In order to verify the correctness of the calculation formula of each tooth distribution ratio of the composite pre-tightened tooth connection, the composite pre-tightened tooth connection with two teeth and three teeth was designed and prepared in this section. According to the standard ASTM D3846-08, the load‒displacement curves of various specimens were obtained by MTS instrument. The crack propagation of each tooth of various specimens until failure was observed by high-speed camera VW-9000 [27]. The strain of each tooth was obtained by strain gauge, and the load distribution ratio of each tooth was obtained by strain data.
3.1 Experimental configuration
3.1.1 Materials and specimens
The glass fiber reinforced polymer (GFRP) laminates were supplied by Nanjing Jinglue Composites Material Co., Ltd. (Nanjing, China). The matrix of GFRP laminate was made of epoxy vinyl ester resin. The fiber orientation of GFRP laminate is mainly 0° and the fiber volume content is 65%. The soft layer was characterized by an elastic modulus far smaller than GFRP laminates [28]. High viscosity, two-component, toughened epoxy resin adhesive is selected as the soft layer, which has strong bonding properties and can be used to bond treated metals, rubber, and fiber reinforced polymer products materials. This work uses a soft material with an elastic modulus of 3,575 MPa for the experiment. The material parameters of the composite listed in Table 1 were provided by the manufacturer, and the material parameters of steel are presented in Table 2.
Mechanical properties of the GFRP composite
| Elastic modulus | Value (GPa) | Strength | Value (MPa) |
|---|---|---|---|
| E 1 | 48 | X t | 640 |
| E 2 | 8.2 | X c | 320 |
| E 3 | 8.2 | Y t | 29.1 |
| G 12 | 5.1 | Y c | 109.2 |
| G 13 | 5.1 | S 12 | 42 |
| G 23 | 4.6 | S 13 | 42 |
| ν 12 /ν 13 /ν 23 | 0.26/0.26/0.2 | S 23 | 36 |
Note: X t and X c represent the tensile and compressive strengths, respectively, along the fiber orientation; and Y t and Y c represent the strengths perpendicular to the fiber orientation.
Mechanical properties of Q345
| Property | Value |
|---|---|
| E (Young’s modulus) | 210 GPa |
| ν (Poisson’s ratio) | 0.3 |
| Y (Yield strength) | 345 MPa |
As shown in Table 3, the specimens were divided into two groups according to the number of teeth. The specimens were labeled as mT-Hk, where “m” represents the number of teeth and k represents the soft-layer thickness combination number. Tests were repeated twice for each number of specimens to avoid random errors. Figures 6 and 7 show the overlooking and orthographic views of each group of specimens. In order to observe the damage of the composite pre-tightened tooth connection, both ends of the composite are connected by the pre-tightened tooth connection technology. Two additional teeth are set on the right end to ensure that the left end of the composite is damaged. The steel plate is Q345, and its width is 60 mm. Each side of the steel plate is provided with a bolt hole of 8.3 mm in diameter, and the bolt diameter is 8 mm. The torque is applied to the bolt through the torque wrench to provide transverse preload to the composite plate.
Specimen classification and geometric parameters
| Group number | Serial number | Thickness combination (mm) | ||
|---|---|---|---|---|
| Tooth 1 (h1) | Tooth 2 (h2) | Tooth 3 (h3) | ||
| Group A (two-teeth specimen) | 2T-H0 | 0 | 0 | — |
| 2T-H1 | 1.1 | 0 | — | |
| Group B (three-teeth specimen) | 3T-H0 | 0 | 0 | 0 |
| 3T-H1 | 4.3 | 1.0 | 0 | |
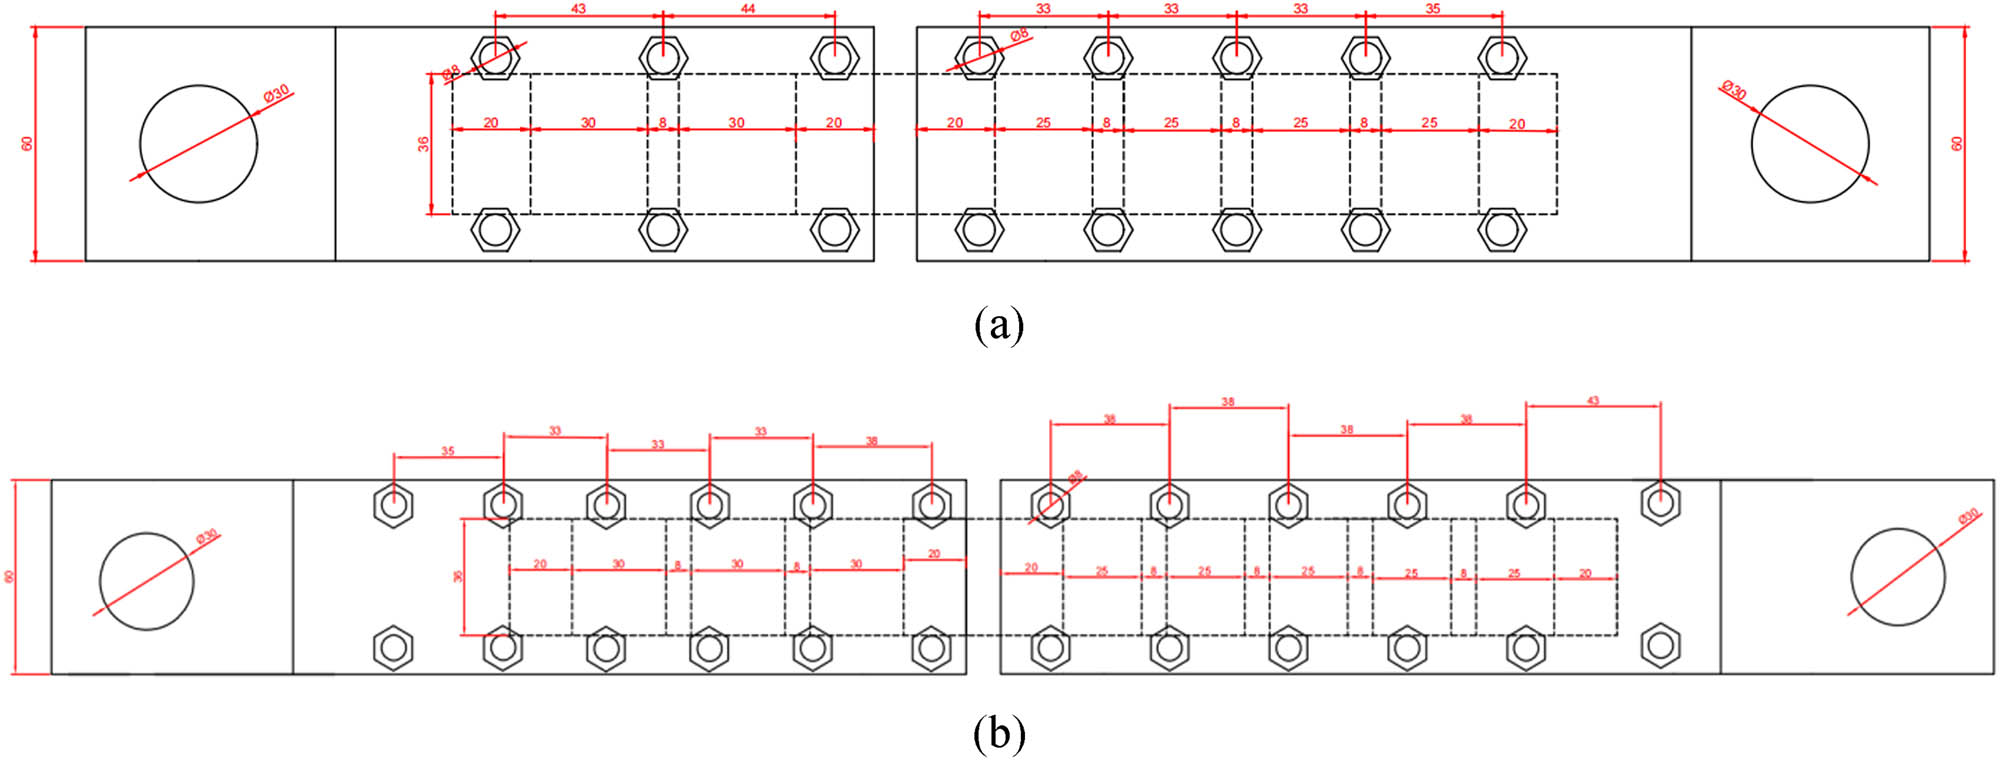
Top view of specimen: (a) Top view of pre-tightened two-tooth joint; and (b) Top view of pre-tightened three-tooth joint.
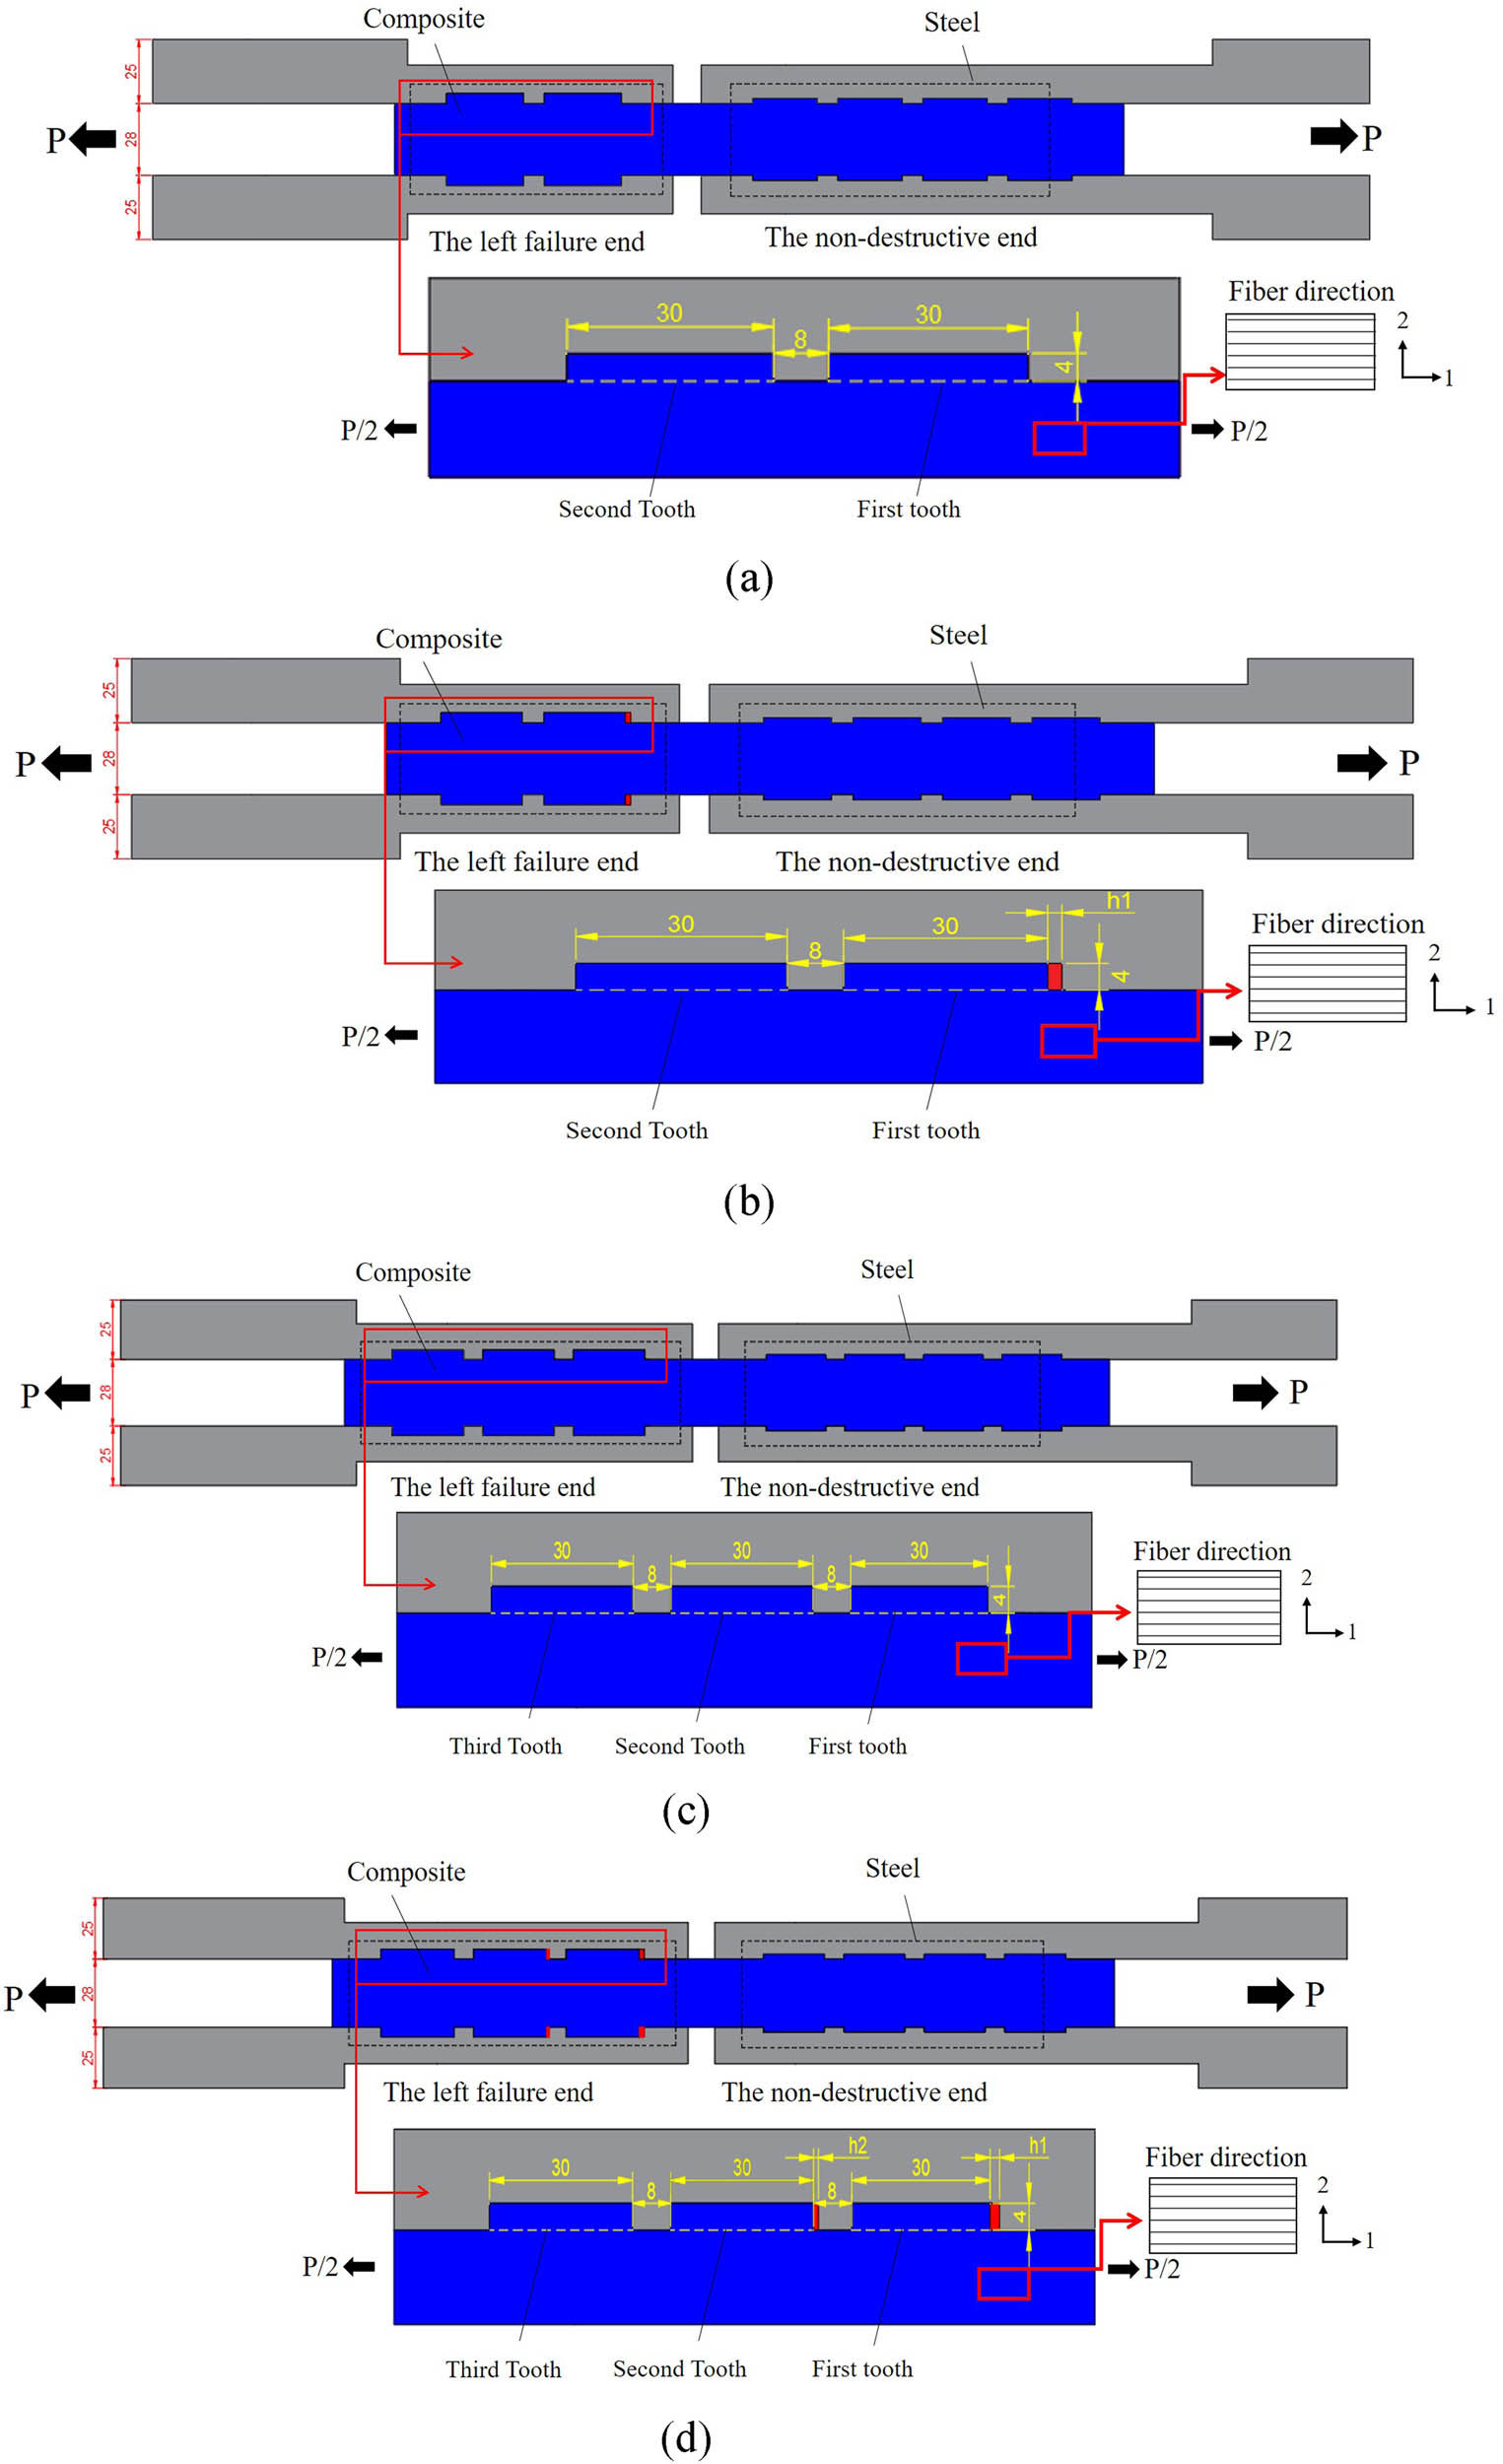
Front view of specimen: (a) Front view of traditional pre-tightened two-tooth joint; (b) front view of pre-tightened two-tooth joint embedded with soft layers; (c) front view of traditional pre-tightened three-tooth joint; and (d) front view of pre-tightened three-tooth joint embedded with soft layers.
3.1.2 Setup of measurement points
The longitudinal strain gauges were placed on the intermediate axis of the GFRP laminates along the fiber orientation. Figure 8 shows the number of strain gauges at the corresponding positions. In the loading process, the continuous sampling was adopted by strain acquisition instrument, and the acquisition frequency of each strain gauge is 1 Hz and coincides with the recording frequency of the test load. The load distribution ratio was calculated by measuring the strain at the corresponding position of each tooth.
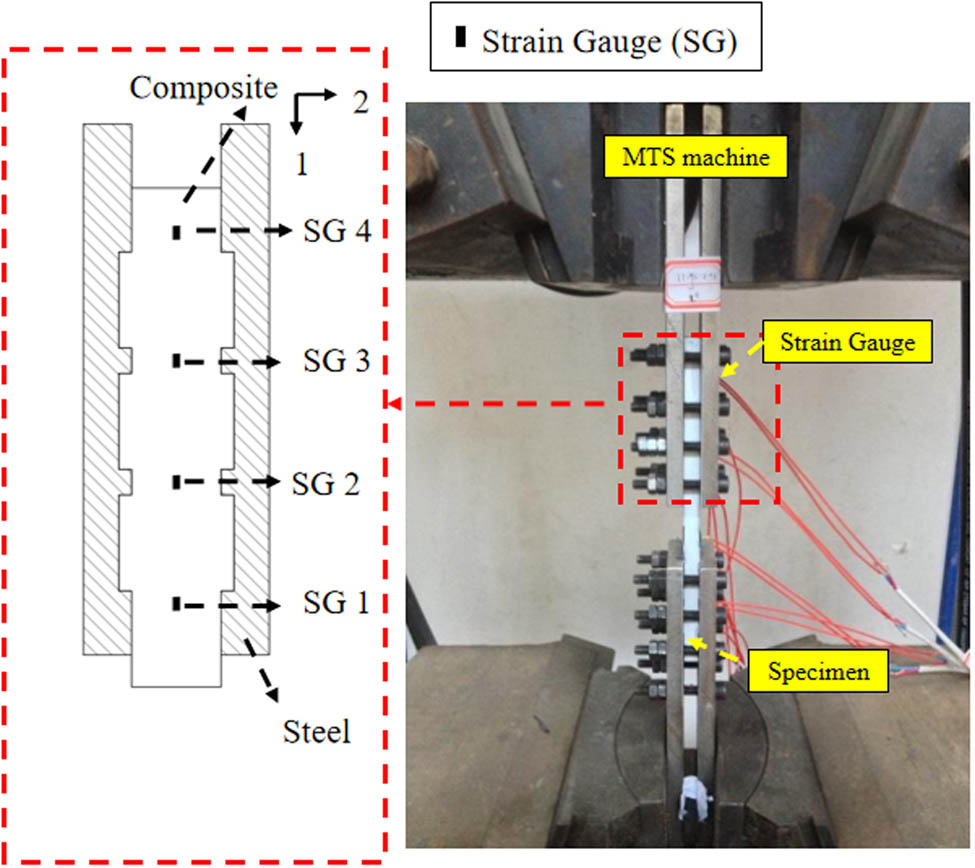
Schematic diagram of the strain gauge mounted on the three-tooth specimen.
3.1.3 Load settings
The test was carried out by the MTS test machine. And the specimens were loaded according to the displacement at a loading speed of 1 mm/min. The damage process of the specimens is recorded by the high-speed camera. The loading field diagram and loading scheme diagram of the specimen test are shown in Figures 9 and 10, respectively.
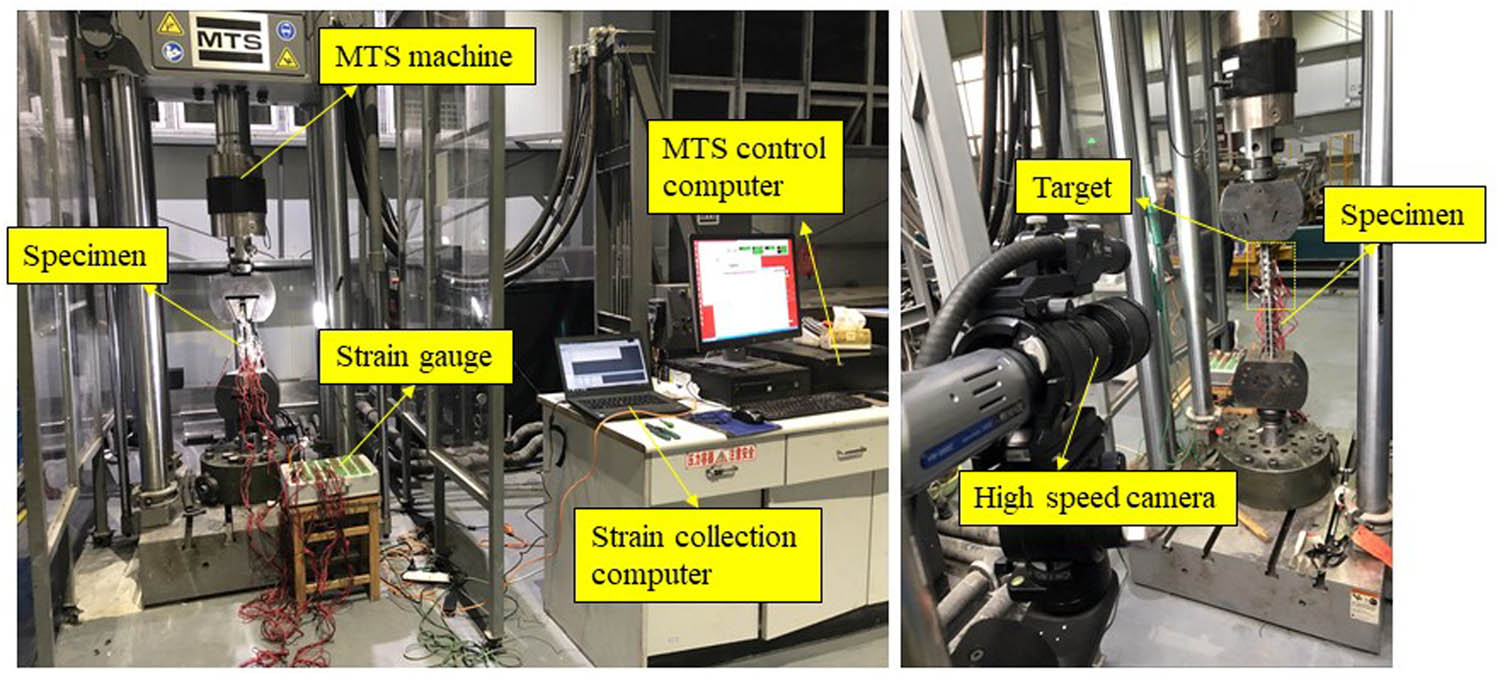
Field diagram of the specimen test loading diagram for the composite pre-tightened tooth connection.
Loading scheme diagram of the specimen test for the composite pre-tightened tooth connection.
3.2 Experimental results
3.2.1 Load-bearing capacity
The load-bearing capacity corresponding to each group of specimens are presented in Table 4 and Figure 11. Soft layer can adjust load distribution ratio to influence load-bearing capacity. When the two-tooth and three-tooth specimens are allocated with the thickness combination of 2T-H1/3T-H1, the specimen reaches the state of simultaneous failure of all teeth. and its bearing capacity was increased by 29.0 and 21.6%, respectively, compared with that of the 2T-H0/3T-H0.
Bearing capacities of specimen
| Group number | Specimen number | Bearing capacity of each specimen (kN) | Average value of bearing capacity (kN) | Increased proportion (%) |
|---|---|---|---|---|
| Group A (two-teeth specimen) | 2T-H0-1 | 92 | 93 | 0 |
| 2T-H0-2 | 94 | |||
| 2T-H1-1 | 116 | 120 | 29.0 | |
| 2T-H1-2 | 124 | |||
| Group B (three-teeth specimen) | 3T-H0-1 | 139 | 139 | 0 |
| 3T-H0-2 | 139 | |||
| 3T-H1-1 | 167 | 169 | 21.6 | |
| 3T-H1-2 | 171 |
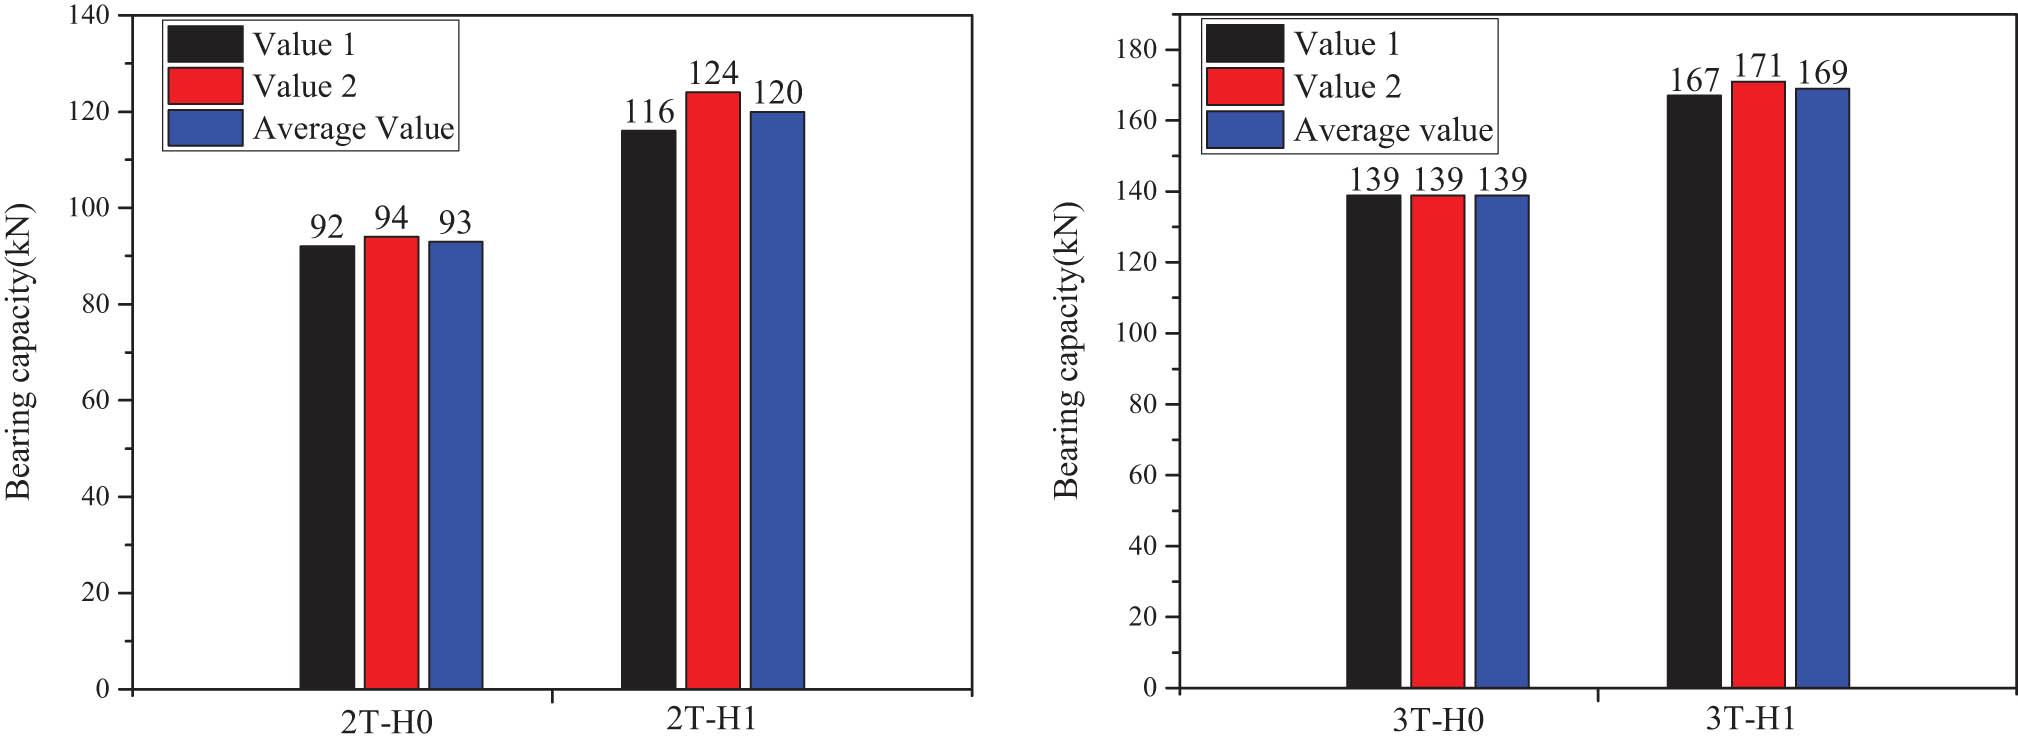
Variation law of bearing capacity of each group of specimens.
3.2.2 Failure process of the specimen
According to the theoretical calculation formula of the load distribution ratio and the actual strain data, it is proved that the soft layers will allocate the load distribution ratio of each tooth, so the tooth will show different crack propagation laws. In this study, the crack development law of each specimen during the whole loading process was captured by a high-speed camera VW-9000. Figures 12–15 show the whole failure process of each group of specimens.
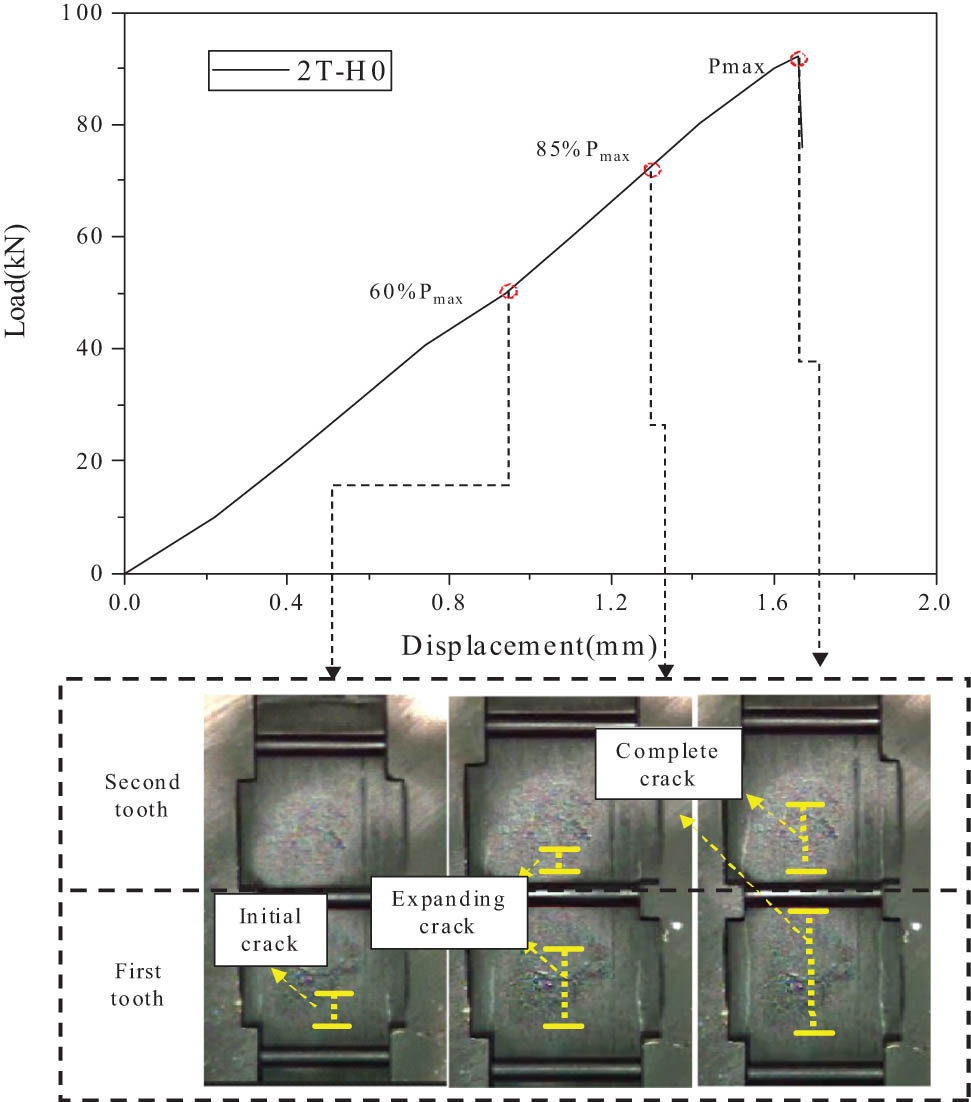
The damage propagation and failure process of specimen 2T-H0.
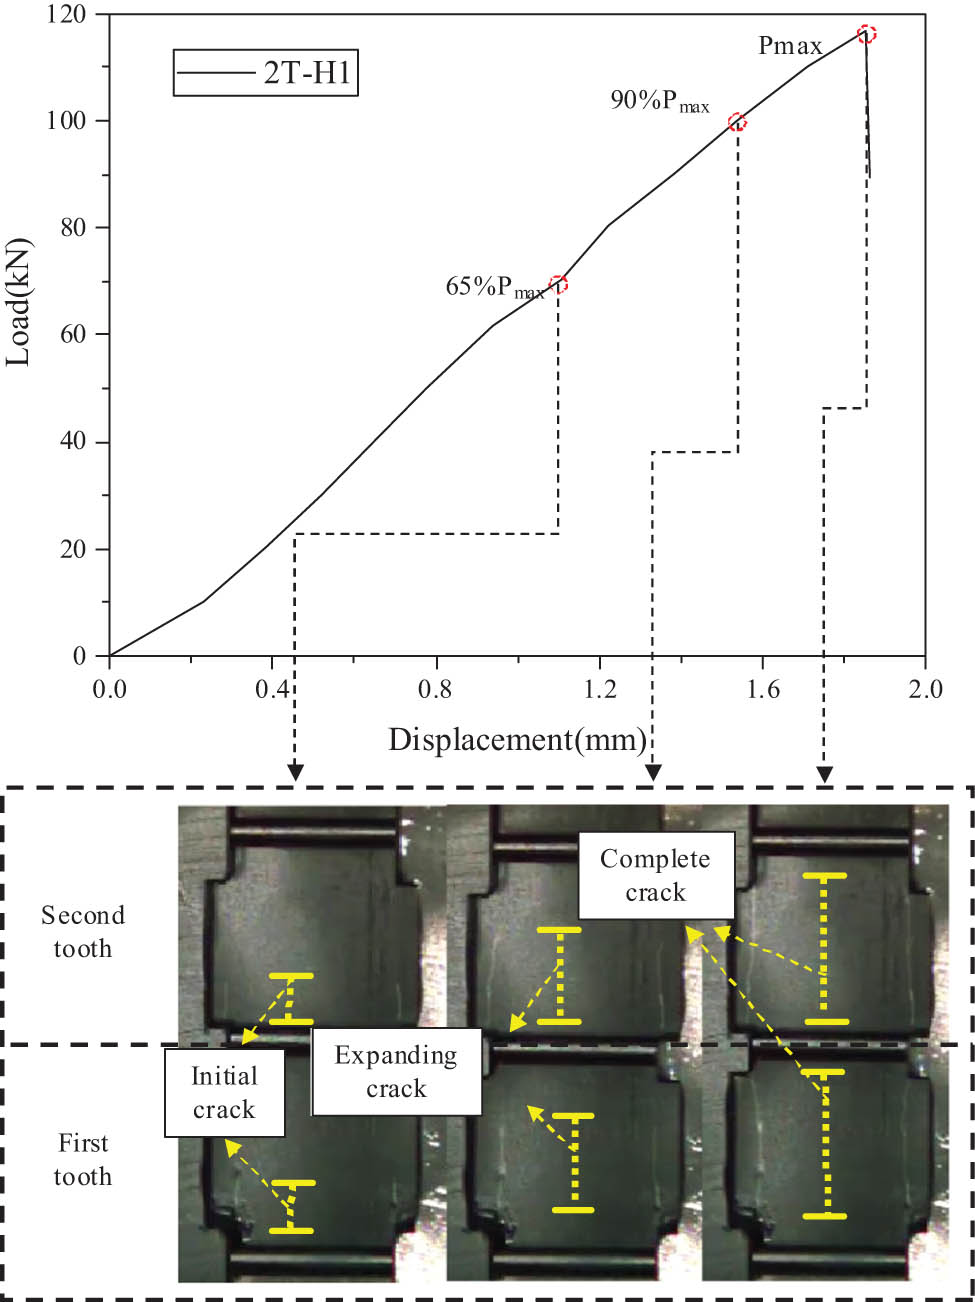
The damage propagation and failure process of specimen 2T-H1.
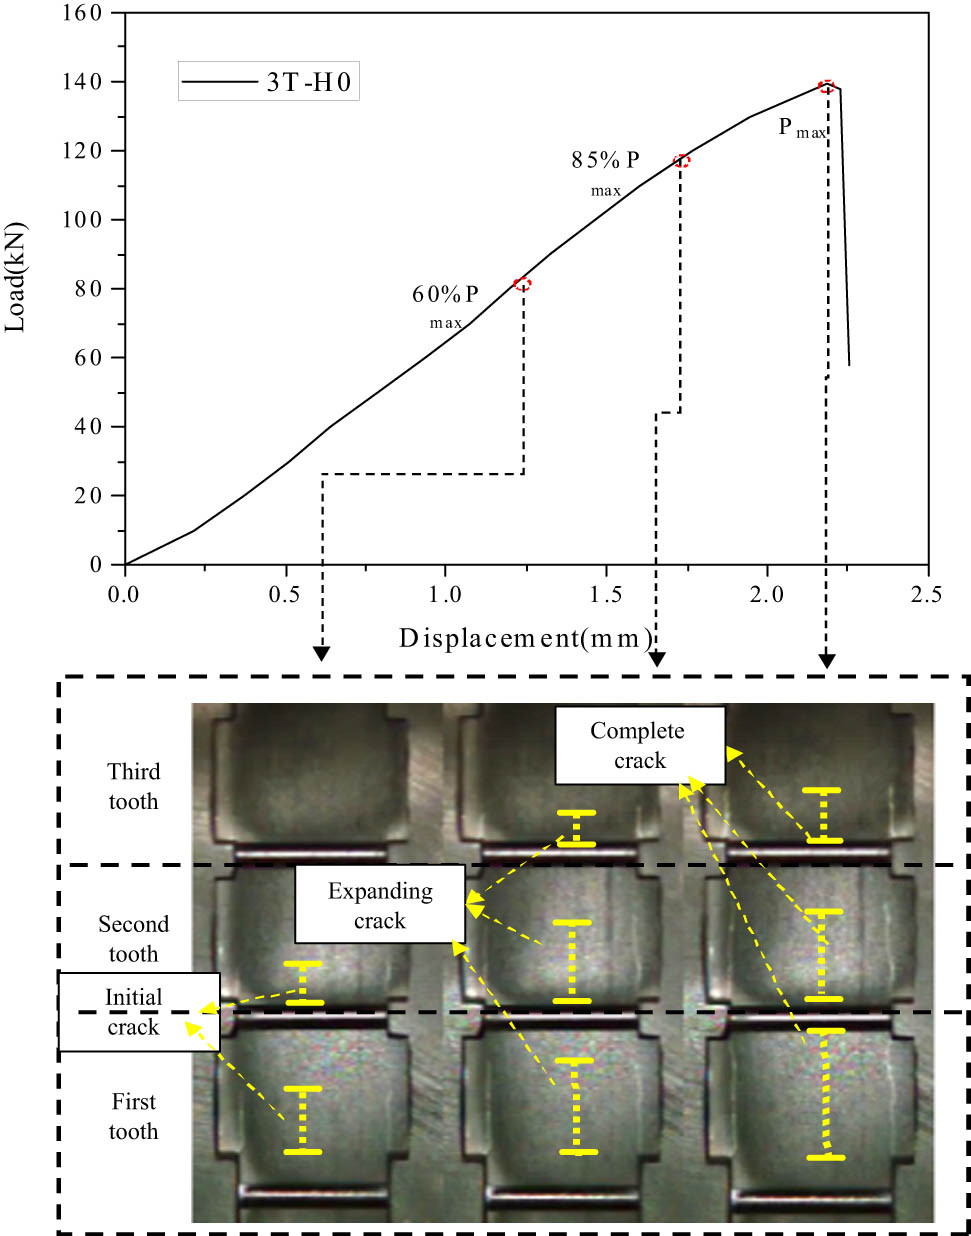
The damage propagation and failure process of specimen 3T-H0.
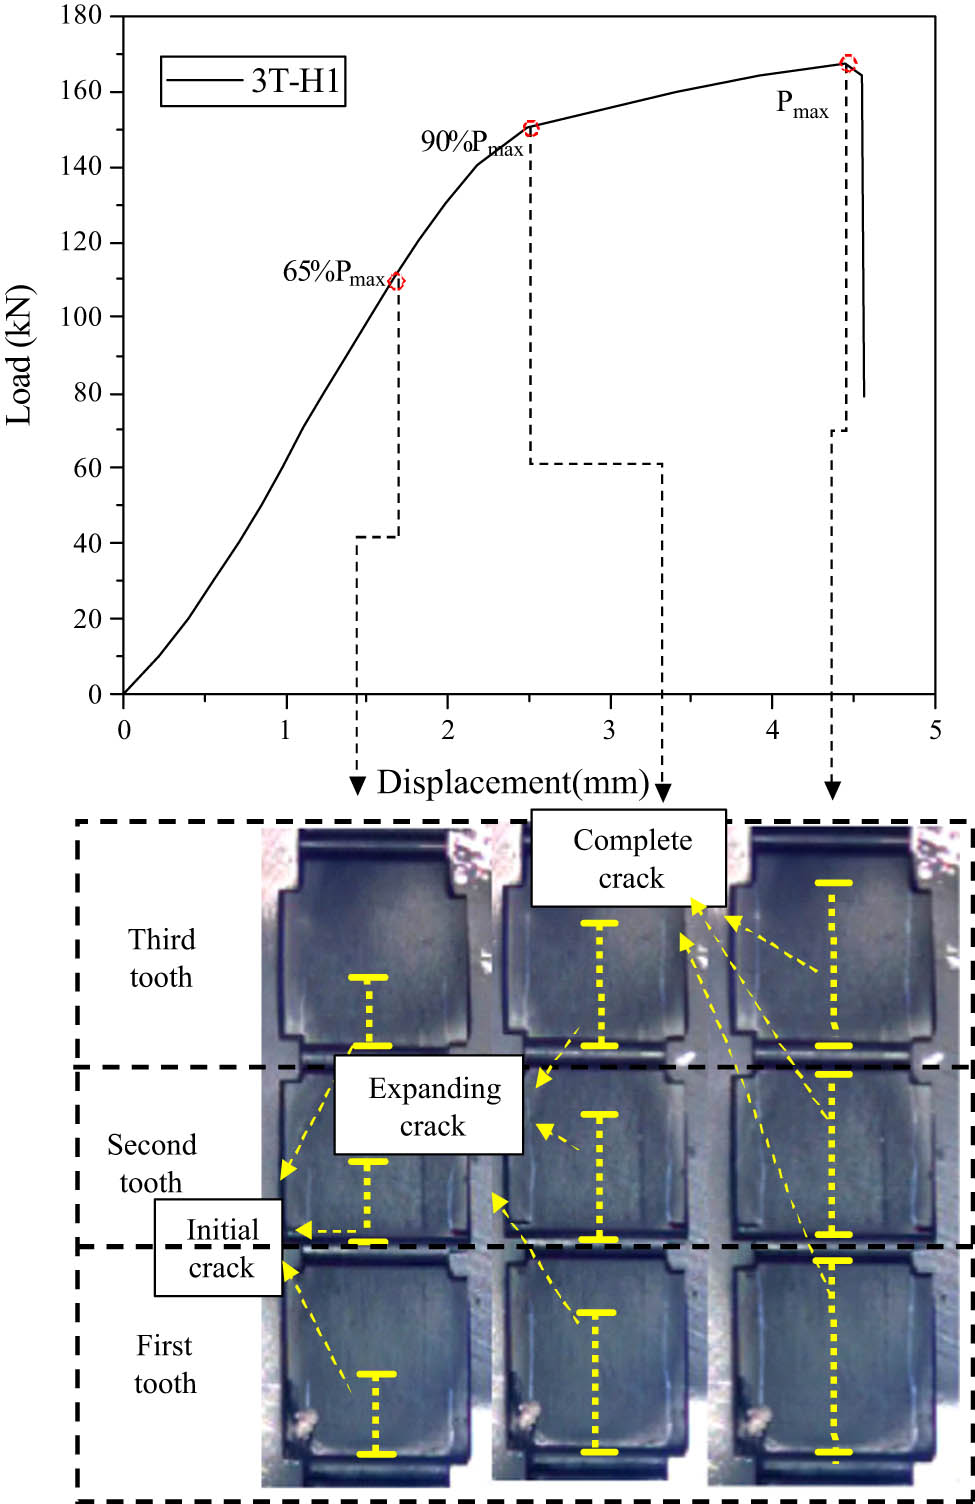
The damage propagation and failure process of specimen 3T-H1.
Figure 12 shows the whole crack propagation process of specimen 2T-H0. When the external load reaches 60% (56 kN) of the ultimate bearing capacity, the initial crack occurs at the first tooth end, and no obvious crack occurs at the second tooth. With the increase in external load, when the external load reaches 85% of the ultimate bearing capacity (78 kN), a damage crack appears in the second tooth, and the first tooth crack has extended more than half of the tooth length. When the external load reaches the ultimate bearing capacity, the crack of the first tooth completely penetrates and loses the bearing capacity. The load borne by the first tooth transfers instantaneously to the second tooth, resulting in a brittle sound and instantaneous failure of the structure.
Figure 13 shows the whole process of 2T-H1 crack propagation and failure of the two-tooth specimen. When the external load reaches 65% (78 kN) of the ultimate bearing capacity, the load distribution ratio of each tooth is adjusted under the action of soft layers, so the initial cracks appear at the same time in both the first tooth and the second tooth. When the external load reaches 90% of the ultimate bearing capacity (108 kN), the crack propagation of the second tooth of the first tooth exceeds half of the tooth length. When the external load reaches the ultimate bearing capacity, the first and second tooth cracks run through simultaneously, a brittle sound is heard, and the structure is a catastrophic failure.
Figure 14 shows the whole crack propagation process of specimen 3T-H0. When the external load reaches 60% (83 kN) of the ultimate bearing capacity, the first tooth end produces about one-third of the crack length, the second tooth has an initial crack, and the third tooth has no obvious crack trace. With the continuous increase in external load, when the external load reaches 85% of the ultimate bearing capacity (118 kN), the crack length of the first tooth has exceeded half of the tooth length, the crack length of the second tooth is also close to half of the tooth length, and the third tooth produces the initial crack. When the external load reaches the ultimate bearing capacity, the crack of the first tooth completely penetrates and loses the bearing capacity. The load borne by the first tooth transfers to the second tooth and the third tooth instantaneously, causing the brittle failure mode of the composite structures.
Figure 15 shows the whole crack propagation process of specimen 3T-H1. When the external load reaches 65% (109 kN) of the ultimate bearing capacity, the load distribution ratio of each tooth is adjusted under the action of soft layers, so the initial cracks appear at the same time in the first, second, and third tooth. When the external load reaches 90% of the ultimate bearing capacity (150 kN), the crack propagation of the first, second, and third tooth exceeds half of the tooth length. When the external load reaches the ultimate bearing capacity, the three teeth cracks run through at the same time, a brittle sound is heard, causing the brittle failure mode of the composite structures.
3.2.3 Load distribution ratio of each tooth
When each group of specimens reaches the ultimate bearing capacity, the load distribution ratio of each group is shown in Table 5. For the traditional two-tooth and three-tooth joints, the load distribution ratio of the first tooth is always the largest due to the brittle material of the composite material. When the ultimate bearing capacity is reached, the load distribution ratio of the first tooth is 63 and 47%, respectively. For the two-tooth and three-tooth joint embedded with soft layers, due to the characteristics of the soft material, the displacement at the tooth end of the soft layers can be larger, and the load is increased slightly, so the load can be effectively transmitted backward to realize the allocation of the load distribution ratio of each tooth. When the bearing capacity of the joint reaches its limit value, the load distribution ratios of the first tooth are 51% and 34% for the second and third tooth joints, respectively.
Final load–distribution of specimens
| Group number | Specimen number | Final load–distribution ratio (%) | ||
|---|---|---|---|---|
| First | Second | Third | ||
| A | 2T-H0 | 63 | 37 | — |
| 2T-H1 | 51 | 49 | — | |
| B | 3T-H0 | 47 | 30 | 23 |
| 3T-H1 | 34 | 32 | 34 | |
4 Results and discussion
4.1 Theoretical calculation and experimental results of the tooth load distribution ratio
By measuring the strain value and combining the formulas (26)–(29), the actual load distribution ratio of each tooth of the composite pre-tightened tooth connection is known. The error between the experimental value and the theoretical value of the load distribution ratio of the tooth with the largest load is extracted. The summary is shown in Table 6, and the comparison of the values is shown in Figure 16.
Comparison of theoretical value and experimental value of load distribution ratio of each tooth
| Specimen number | Experimental value or theoretical value | n 1 (%) | n 2 (%) | n 3 (%) | Maximum error of maximum load distribution ratio of teeth (%) |
|---|---|---|---|---|---|
| 2T-H0 | Experimental value | 63 | 37 | — | 1 |
| Theoretical value | 62 | 38 | — | ||
| 2T-H1 | Experimental value | 51 | 49 | — | 3 |
| Theoretical value | 48 | 52 | — | ||
| 3T-H0 | Experimental value | 47 | 30 | 23 | 8 |
| Theoretical value | 55 | 25 | 20 | ||
| 3T-H1 | Experimental value | 34 | 32 | 34 | 2 |
| Theoretical value | 33 | 31 | 36 |
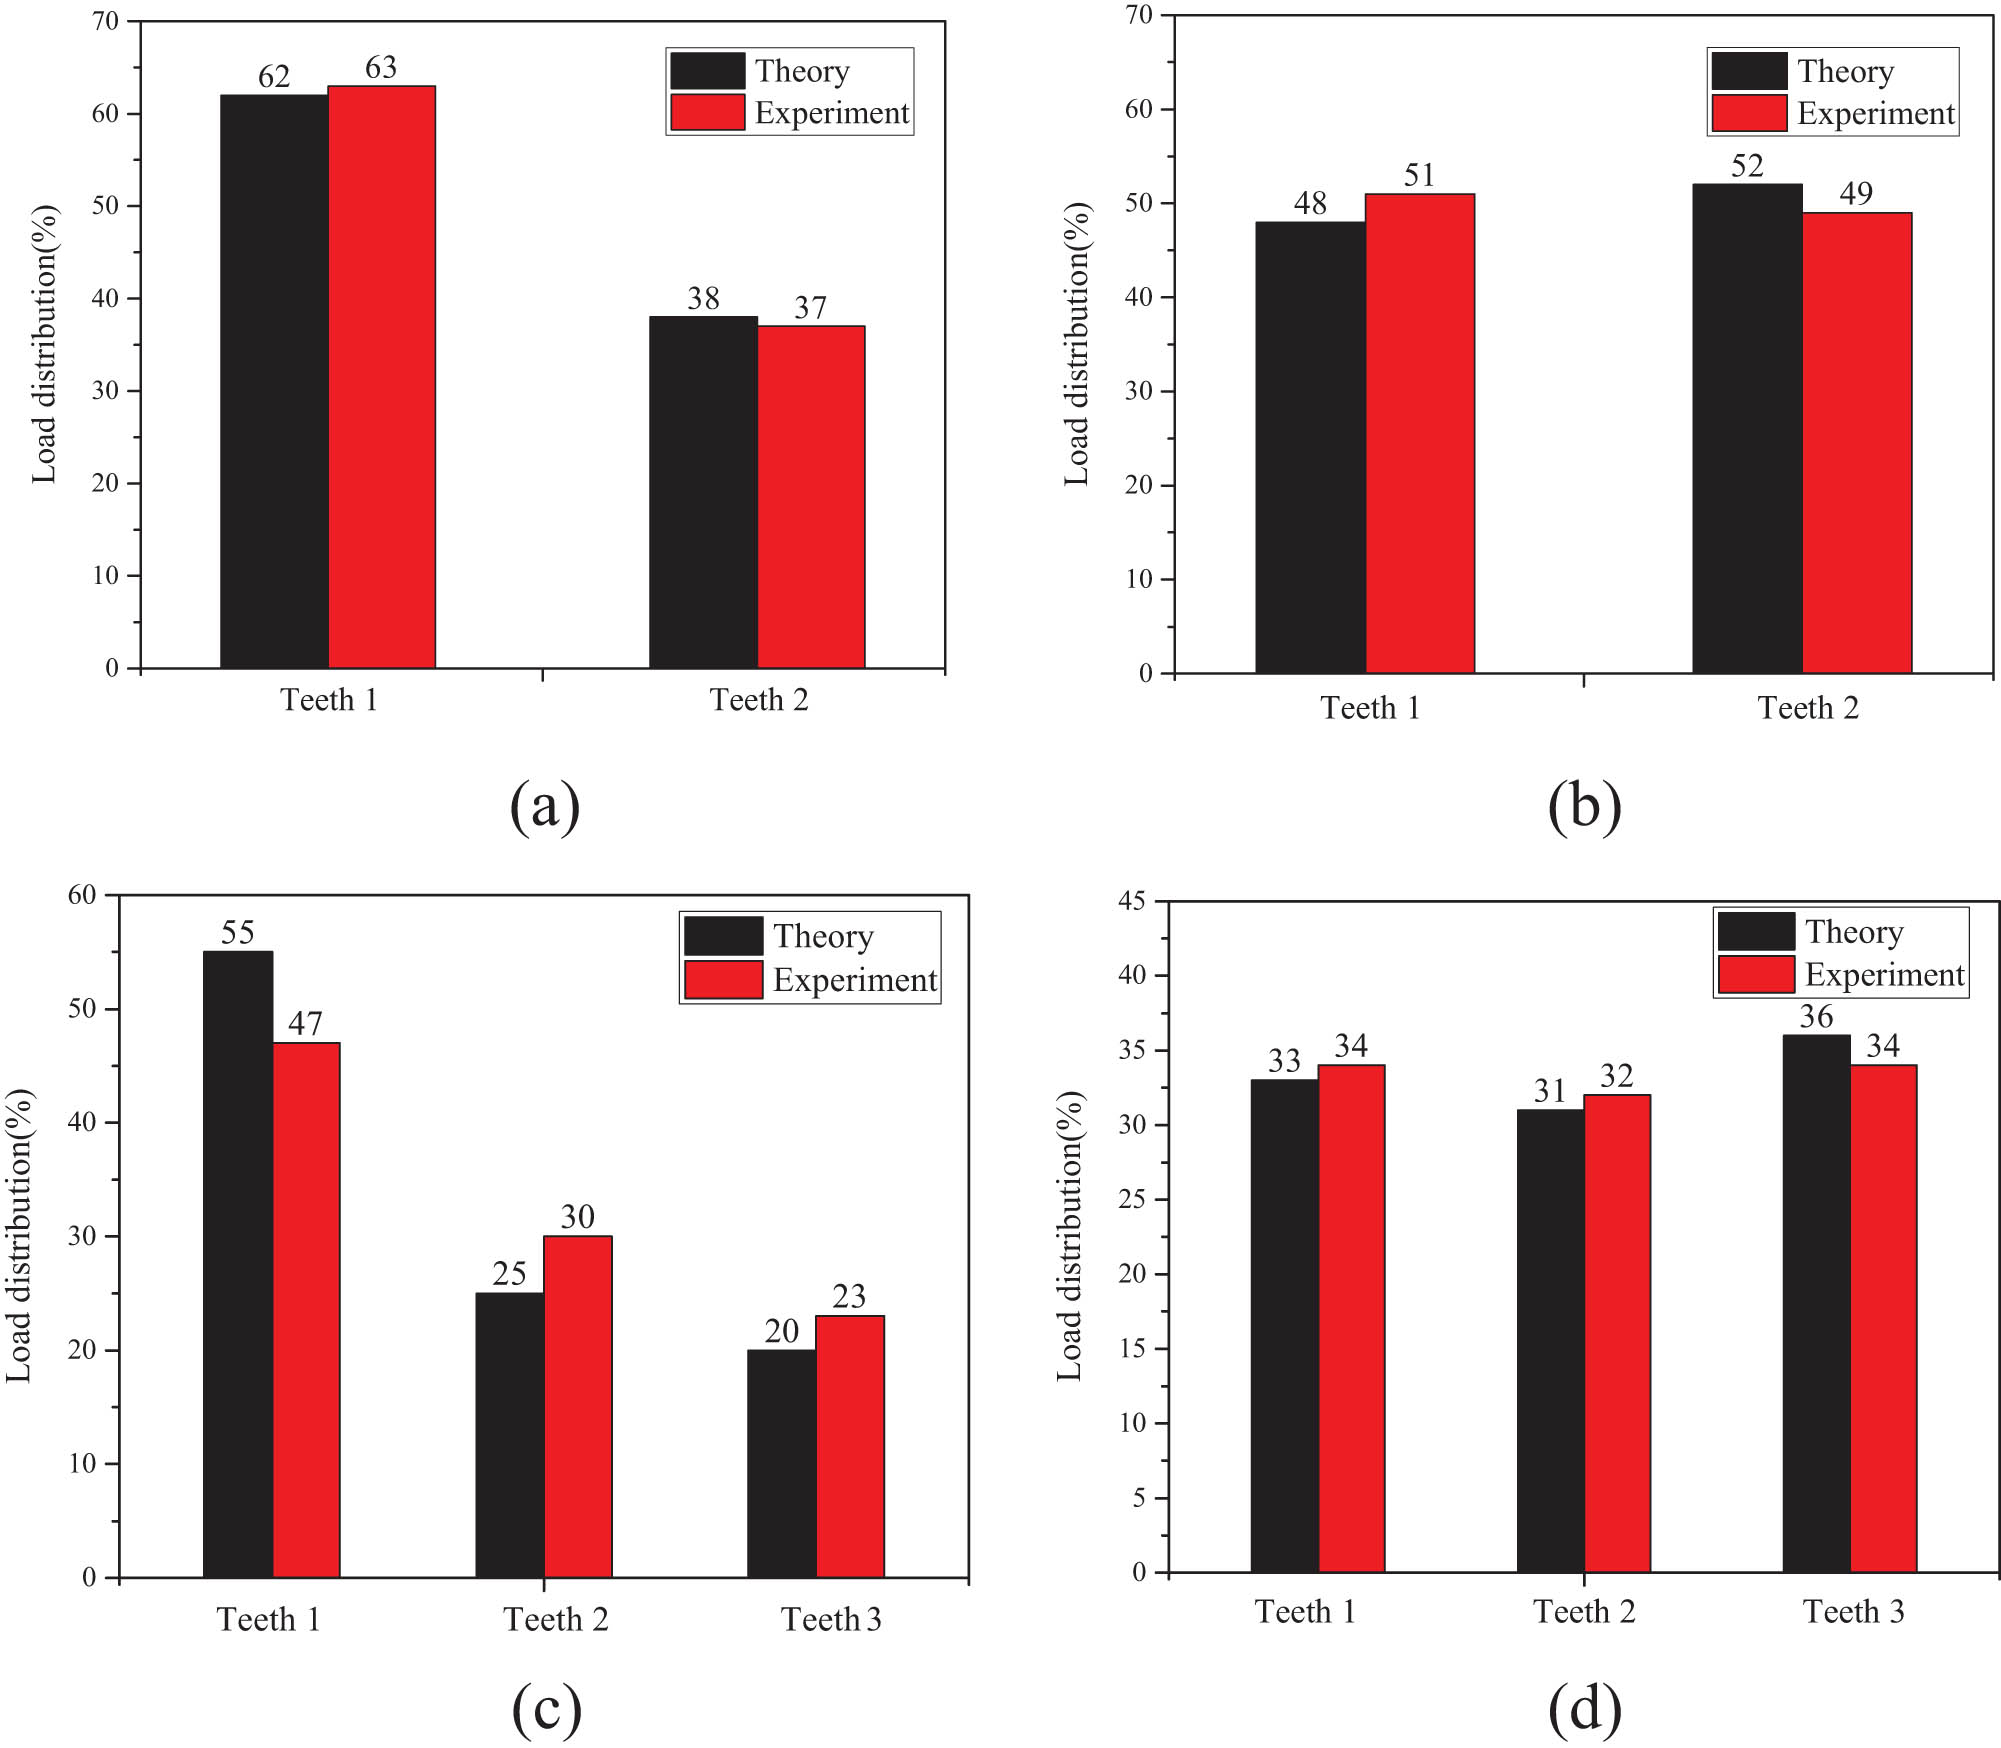
Comparison of theoretical value and experimental value of load distribution ratio of each group of specimens. (a) 2T-H0, (b) 2T-H1, (c) 3T-H0, and (d) 3T-H1.
It can be seen from Table 6 and Figure 16 that the maximum error between the theoretical value and the experimental value of the largest load distribution ratio was 8%. And the theoretical derivation formula can accurately calculate the load distribution ratio of each group of soft material combinations. The load-bearing ratio of teeth embedded with soft layers at the tooth end will decrease significantly, and the load-bearing ratio of adjacent teeth will increase. Through this calculation formula, the thickness of the soft layers can be reasonably be set to make the load of each tooth of the composite pre-tightened tooth connection evenly distribute.
4.2 Study on parameters of load distribution ratio of the joint
In order to have a more in-depth understanding of the transmission mechanism and load distribution ratio of composite pre-tightened tooth connection embedded with soft layers, this section studies the influence of soft layers thickness and elastic modulus on the load distribution ratio by calculating the load distribution ratio of composite pre-tightened tooth connection embedded with soft layers based on the spring stiffness method.
4.2.1 Effect of the soft layer thickness on the load distribution ratio
In this section, the pre-tightened three-tooth joint embedded with soft layers is taken as an example. The geometric parameters and material parameters of the laminates and the steel are consistent with the experimental specimens, and the elastic modulus of the soft layers is 3,575 MPa. The load distribution of each tooth with different soft layers thicknesses is calculated, and the calculation results are shown in Table 7 and Figure 17.
Load distribution under different thickness of soft layers
| Classification | Thickness value of soft layers (mm) | Load distribution ratio (%) | ||||
|---|---|---|---|---|---|---|
| Tooth 1 | Tooth 2 | Tooth 3 | Tooth 1 | Tooth 2 | Tooth 3 | |
| H0 | 0 | 0 | 0 | 55 | 31 | 14 |
| H1 | 2 | 0 | 0 | 41 | 42 | 17 |
| H2 | 0 | 2 | 0 | 60 | 26 | 14 |
| H3 | 0 | 0 | 2 | 58 | 32 | 10 |
| H4 | 1 | 0 | 0 | 47 | 39 | 14 |
| H5 | 1.5 | 0 | 0 | 44 | 41 | 15 |
| H6 | 2.5 | 0 | 0 | 39 | 43 | 18 |
| H7 | 3 | 0 | 0 | 38 | 44 | 18 |
| H8 | 4 | 0 | 0 | 35 | 46 | 19 |
| H9 | 6 | 0 | 0 | 32 | 47 | 21 |
| H10 | 8 | 0 | 0 | 30 | 49 | 21 |
| H11 | 4 | 1.5 | 0 | 39 | 34 | 27 |
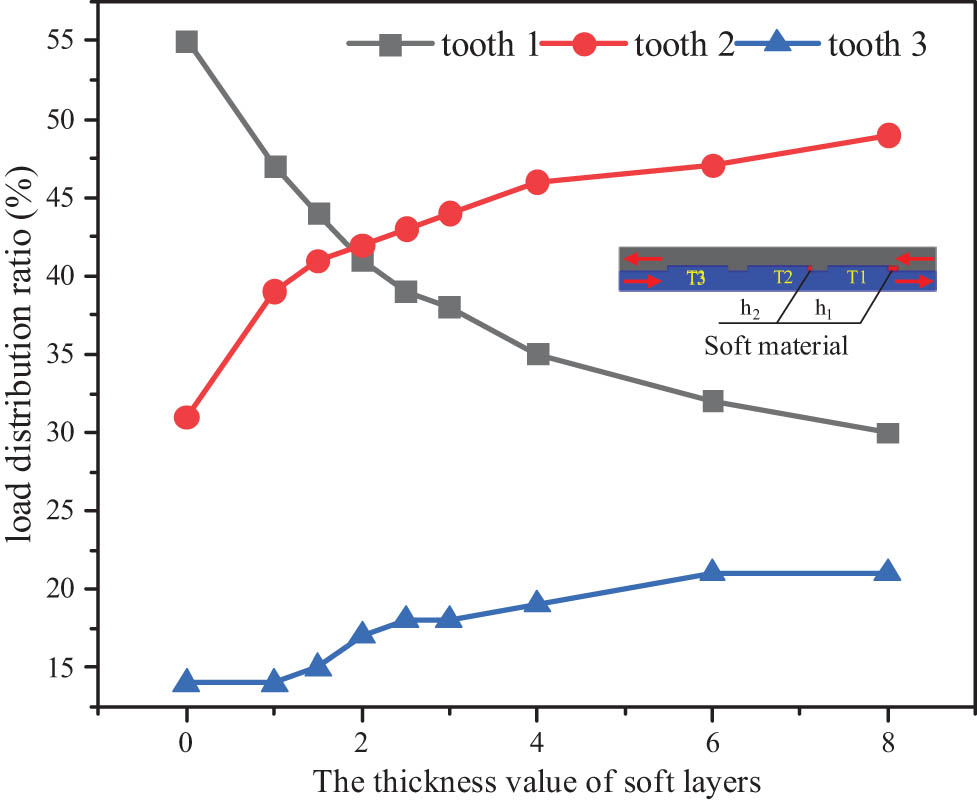
Load distribution ratio changes with the thickness of the soft layer.
By comparing the results of H0 and H1∼H3, it is not difficult to see that after embedding a certain thickness of the soft layer at the tooth end, the load distribution ratio of the tooth 1 decreases significantly, and the load ratio of other teeth increases. From the perspective of the thickness of the soft layer, in the cases of H0∼H1 and H4∼H10, only the soft layer is embedded in the first tooth end, and the thickness of the soft layer gradually increases from 0 to 8 mm. By comparing their load distribution data, it is not difficult to find that with the increase in the thickness of the soft layer, the load proportion of the first tooth embedded with the soft layer gradually decreases from 55 to 30% at the same load level, indicating that the greater the thickness is, the more obvious the effect on the decrease in the load distribution results is. There is an optimal thickness combination when elastic moduli of the soft layer are certain. Under the optimal thickness combination of soft layers, the shear failure occurred in all teeth of the specimens at the same time and the bearing capacity of the joint is the largest.
4.2.2 Effect of the elastic modulus of soft layers on load distribution ratio
When the other parameters of the soft layer embedded in the tooth end are certain, the elastic modulus of the soft layer has a great influence on load distribution of each tooth. In this group, the influence of the material parameters of the three-tooth joint and the thickness of the soft layers in the previous section on the load distribution ratio remains unchanged, and the thickness combinations of the soft layer from the first tooth to the third tooth are 2.8, 0.8, and 0 mm. The setting of the elastic modulus of the soft layer and the corresponding load distribution results under the same tensile load P are shown in Table 8.
Load distribution ratio under different elastic modulus of the soft layer
| Classification | Elastic modulus of soft layer (MPa) | Load distribution ratio (%) | ||
|---|---|---|---|---|
| Tooth1 | Tooth2 | Tooth3 | ||
| R1 | 500 | 29 | 28 | 43 |
| R2 | 750 | 31 | 30 | 39 |
| R3 | 1,000 | 33 | 32 | 35 |
| R4 | 1,500 | 39 | 33 | 28 |
| R5 | 2,000 | 38 | 34 | 28 |
| R6 | 2,500 | 39 | 35 | 26 |
| R7 | 3,000 | 41 | 35 | 24 |
Through the analysis of Table 8, the following conclusions can be drawn: (1) The elastic modulus of the soft layer has a great influence on the load distribution of the composite pre-tightened tooth connection. Under a certain thickness combination, the tooth with the largest load distribution ratio may be completely different when the soft layers with different elastic moduli are embedded. (2) The smaller the elastic modulus of the soft layer is, the greater the decrease in the corresponding teeth load distribution ratio is, i.e., the more obvious the effect of load proportion redistribution is. Figure 18 and Table 8 show that with the increase in the elastic modulus of the soft layer, the bearing ratio of the tooth of the soft layer (the first and the second tooth) increases significantly for the connection structure under the thickness combination. Therefore, the thickness combination of the soft layer and the elastic modulus affect each other. In the design, the appropriate two parameters should be selected at the same time, which is conducive to the uniformity of the load distribution.
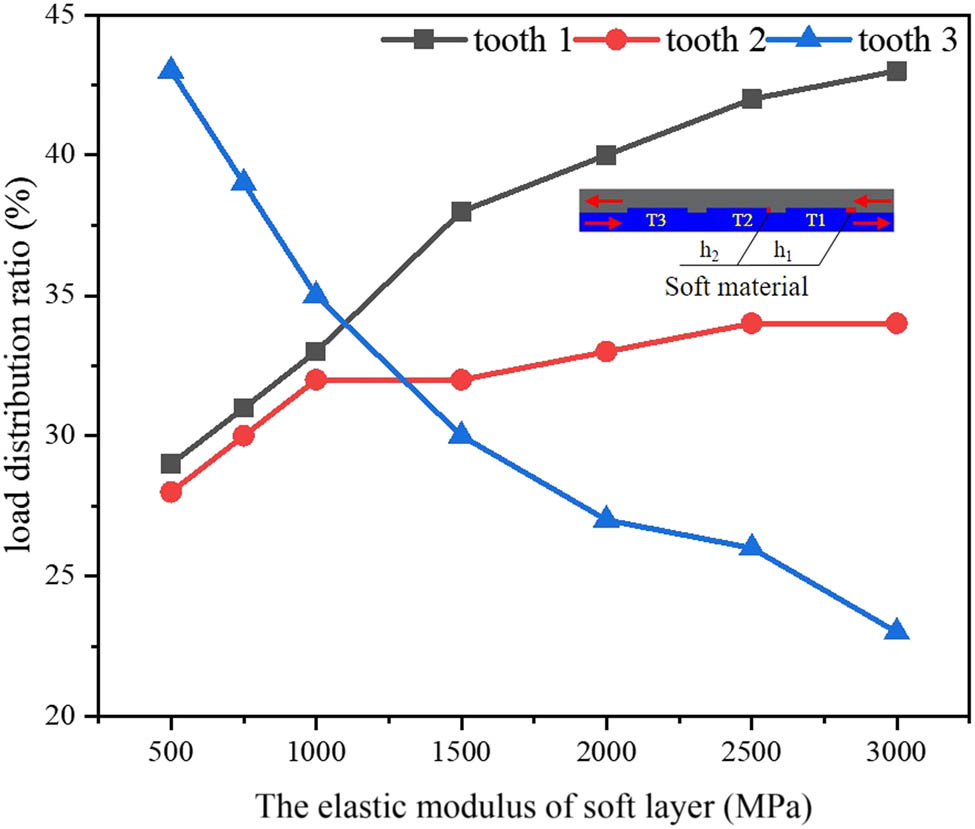
Load distribution ratio changes with the elastic modulus of the soft layer.
5 Conclusion
In this work, based on the spring stiffness method model and according to the deformation compatibility condition of equal displacement, the formula for calculation of the load distribution ratio of composite pre-tightened tooth connection embedded with soft layers is proposed for calculating the load distribution ratio of each tooth of composite pre-tightened tooth connection embedded with soft layers, and the calculation formula is verified by experiments. Finally, the influence of the soft layers’ thickness and elastic modulus on the load distribution of composite pre-tightened tooth connection was studied by a theoretical calculation formula. The following conclusions can be obtained through analysis:
Based on the spring stiffness model and the deformation compatibility condition, an analytical model for the load distribution of composite pre-tightened tooth joint embedded with soft layers is proposed, which is used to study the load distribution theory of composite pre-tightened tooth connection embedded with soft layers. The theoretical value agrees well with the experimental value, and the maximum error between the theoretical value and the experimental value is 8%. Therefore, the method for calculation of load distribution ratio of the pre-tightened tooth joint is feasible.
The experimental study shows that the soft layers can effectively allocate the load distribution ratio of each tooth. Under the action of soft layers, each tooth of two-teeth and three-teeth joints are damaged at the same time, and the ultimate bearing capacity is increased by 29.0 and 21.6%, respectively, compared with the traditional two-teeth and three-teeth joints.
The theoretical calculation formula shows that the thickness and elastic modulus of soft layers have a significant impact on the load distribution ratio of each tooth. Specifically, the greater the thickness of soft layers before the tooth end is, the smaller the elastic modulus is, and greater the reduction in the load distribution ratio of the tooth is.
-
Funding information: This work is supported by the National Natural Science Foundation of China (Project Number: 52478138).
-
Author contributions: All authors have accepted responsibility for the entire content of this manuscript and consented to its submission to the journal, reviewed all the results, and approved the final version of the manuscript. FL: methodology, software, investigation, formal analysis, and writing – original draft; ZZ: conceptualization, funding acquisition, resources, supervision, writing – review and editing; YS: data curation, and writing – original draft; QZ: visualization and investigation; MC: software and validation; YG: visualization, writing – review and editing; LS: preparation, writing – review and editing.
-
Conflict of interest: Authors state no conflict of interest.
-
Data availability statement: All data generated or analyzed during this study are included in this published article.
References
[1] Votsis RA, Stratford TJ, Chryssanthopoulos MK, Tantele EA. Dynamic assessment of a FRP suspension footbridge through field testing and finite element modelling. Steel Compos Struct. 2017;23:205–15. 10.12989/scs.2017.23.2.205.Suche in Google Scholar
[2] Rush D, Bisby L, Jowsey A, Melandinos A, Lane B. Structural performance of unprotected concrete-filled steel hollow sections in fire: A review and meta-analysis of available test data. Steel Compos Struct. 2012;12:325–50. 10.12989/scs.2012.12.4.325.Suche in Google Scholar
[3] Nardin SD, Debs ALHCE. An experimental study of connections between I-beams and concrete filled steel tubular columns. Steel Compos Struct. 2004;4:303–15. 10.12989/scs.2004.4.4.303.Suche in Google Scholar
[4] Xiaoquan C, Xiaoyuan D, Kun C, Maosheng S, Xiaodong L, Gang C. Tensile performances of single-lap countersunk composite joints with metallic bushing. Steel Compos Struct. 2021;40:421–34. 10.12989/scs.2021.40.3.421.Suche in Google Scholar
[5] Esmaeili F, Chakherlou TN, Zehsaz M. Investigation of bolt clamping force on the fatigue life of double lap simple bolted and hybrid (bolted/bonded) joints via experimental and numerical analysis. Eng Fail Anal. 2014;45:406–20. 10.1016/j.engfailanal.2014.07.014.Suche in Google Scholar
[6] Mihaela I, Andrés V, Maricely DA, Patricia S, Elena S. Environmentally assisted fatigue failure of a structural bolted-joint connection. Eng Fail Anal. 2022;137:106322. 10.1016/j.engfailanal.2022.106322.Suche in Google Scholar
[7] Pisharody AP, Smith DE. Effect of interlayer adherend inclusions on strength of composite bonded joints. Compos Struct. 2022;291:115531. 10.1016/j.compstruct.2022.115531.Suche in Google Scholar
[8] Deng AZ, Zhao QL, Li F, Chen H. Research on bearing capacity of single tooth to composite pre-tightened teeth connection. J Reinf Plast Compos. 2013;32:1603–13. 10.1177/0731684413492575.Suche in Google Scholar
[9] Li X, Hallett SR, Wisnom MR. Predicting the effect of through-thickness compressive stress on delamination using interface elements. Compos Part A: Appl Sci Manuf. 2008;39:218–30. 10.1016/j.compositesa.2007.11.005.Suche in Google Scholar
[10] Gao Y, Li F, Zhao Q, Gao J, Yan X, Xu L. Failure modes and failure mechanisms of single tooth bound to composite pre-tightened tooth connection. J Reinf Plast Compos. 2018;37:267–83. 10.1177/0731684417741205.Suche in Google Scholar
[11] Gao Y, Li F, Zhao Q, Gao J, Hu Y. Strength prediction of a single tooth bound to composite pre-tightened tooth connection (PTTC) joints based on different failure criteria. KSCE J Civ Eng. 2019;23:3547–59. 10.1007/s12205-019-1988-8.Suche in Google Scholar
[12] Liu P, Zhao Q, Li F, Liu J, Chen H. Research on the Mechanical Properties of a Glass Fiber Reinforced Polymer-Steel Combined Truss Structure. Sci World J. 2014;2014:309872. 10.1155/2014/309872.Suche in Google Scholar PubMed PubMed Central
[13] Zhang D, Zhao Q, Huang Y, Li F, Chen H, Miao D. Flexural properties of a lightweight hybrid FRP-aluminum modular space truss bridge system. Compos Struct. 2014;108:600–15. 10.1016/j.compstruct.2013.09.058.Suche in Google Scholar
[14] Zhang D, Huang Y, Zhao Q, Gao Y, Tao J. Evaluation of the torsional mechanism by analytical solution for a hybrid fiber-reinforced polymer–aluminum triangular deck truss beam. Adv Struct Eng. 2016;19:872–9. 10.1177/1369433215627158.Suche in Google Scholar
[15] Zhang DD, Yuan JX, Zhao QL, Li F, Gao YF, Zhu RJ, et al. Static performance of a new GFRP-metal string truss bridge subjected to unsymmetrical loads. Steel Compos Struct. 2020;35:641–57. 10.12989/scs.2020.35.5.641.Suche in Google Scholar
[16] Yifeng G, Fei L, Qilin Z, Jiangang G, Lin S, Zhiqin Z. Study on load distribution ratio of composite pre-tightened tooth joint by shear nonlinearity. Steel Compos Struct. 2021;40(5):747–59. 10.12989/scs.2021.20.5.747.Suche in Google Scholar
[17] Fei L, QiLin Z, Zhen L, DongDong Z, Lin S, JinHui D. Load distribution of composite pre-tightened teeth connections embedded with soft layers. Compos Struct. 2022;300:116070. 10.1016/j.compstruct.2022.116070.Suche in Google Scholar
[18] Yifeng G, Dongdong Z, Feng L, Qilin Z, Zhiqin Z, Yan C. Bearing strength and failure behaviour of composite pre-tightened multi-tooth joint. Compos Struct. 2021;272:114208. 10.1016/j.compstruct.2021.114208.Suche in Google Scholar
[19] McCarthy CT, Gray PJ. An analytical model for the prediction of load distribution in highly torqued multi-bolt composite joints. Compos Struct. 2011;93:287–98. 10.1016/j.compstruct.2010.09.017.Suche in Google Scholar
[20] Li F, Zhao Q, Gao Y, Xu L, Chen H. A prediction method of the failure load and failure mode for composite pre-tightened tooth connections based on the characteristic lengths. Compos Struct. 2016;154:684–93. 10.1016/j.compstruct.2016.06.036.Suche in Google Scholar
[21] McCarthy MA, McCarthy CT, Padhi GS. A simple method for determining the effects of bolt–hole clearance on load distribution in single-column multi-bolt composite joints. Compos Struct. 2006;73:78–87. 10.1016/j.compstruct.2005.01.028.Suche in Google Scholar
[22] Sharos PA, Egan B, McCarthy CT. An analytical model for strength prediction in multi-bolt composite joints at various loading rates. Compos Struct. 2014;116:300–10. 10.1016/j.compstruct.2014.05.021.Suche in Google Scholar
[23] Lecomte J, Bois C, Wargnier H, Wahl J-C. An analytical model for the prediction of load distribution in multi-bolt composite joints including hole-location errors. Compos Struct. 2014;117:354–61. 10.1016/j.compstruct.2014.06.040.Suche in Google Scholar
[24] Gray PJ, McCarthy CT. An analytical model for the prediction of through-thickness stiffness in tension-loaded composite bolted joints. Compos Struct. 2012;94:2450–9. 10.1016/j.compstruct.2012.02.011.Suche in Google Scholar
[25] Olmedo A, Santiuste C, Barbero E. An analytical model for the secondary bending prediction in single-lap composite bolted-joints. Compos Struct. 2014;111:354–61. 10.1016/j.compstruct.2014.01.015.Suche in Google Scholar
[26] Li R, Zhao Q. Gear strength design data. China, NY, BeiJing: China Machine Press; 1984.Suche in Google Scholar
[27] ASTM. D3846-08, standard test method for in-plane shear strength of reinforced plastics. West Conshohocken, PA, USA: American Society of Testing Materials, ASTM International; 2015.Suche in Google Scholar
[28] Barthelat F, Tang H, Zavattieri PD, Li CM, Espinosa HD. On the mechanics of mother-of-pearl: A key feature in the material hierarchical structure. J Mech Phys Solids. 2007;55:306–37. 10.1016/j.jmps.2006.07.007.Suche in Google Scholar
© 2024 the author(s), published by De Gruyter
This work is licensed under the Creative Commons Attribution 4.0 International License.
Artikel in diesem Heft
- Regular Articles
- Research on damage evolution mechanisms under compressive and tensile tests of plain weave SiCf/SiC composites using in situ X-ray CT
- Structural optimization of trays in bolt support systems
- Continuum percolation of the realistic nonuniform ITZs in 3D polyphase concrete systems involving the aggregate shape and size differentiation
- Multiscale water diffusivity prediction of plain woven composites considering void defects
- The application of epoxy resin polymers by laser induction technologies
- Analysis of water absorption on the efficiency of bonded composite repair of aluminum alloy panels
- Experimental research on bonding mechanical performance of the interface between cementitious layers
- A study on the effect of microspheres on the freeze–thaw resistance of EPS concrete
- Influence of Ti2SnC content on arc erosion resistance in Ag–Ti2SnC composites
- Cement-based composites with ZIF-8@TiO2-coated activated carbon fiber for efficient removal of formaldehyde
- Microstructure and chloride transport of aeolian sand concrete under long-term natural immersion
- Simulation study on basic road performance and modification mechanism of red mud modified asphalt mixture
- Extraction and characterization of nano-silica particles to enhance mechanical properties of general-purpose unsaturated polyester resin
- Roles of corn starch and gellan gum in changing of unconfined compressive strength of Shanghai alluvial clay
- A review on innovative approaches to expansive soil stabilization: Focussing on EPS beads, sand, and jute
- Experimental investigation of the performances of thick CFRP, GFRP, and KFRP composite plates under ballistic impact
- Preparation and characterization of titanium gypsum artificial aggregate
- Characteristics of bulletproof plate made from silkworm cocoon waste: Hybrid silkworm cocoon waste-reinforced epoxy/UHMWPE composite
- Experimental research on influence of curing environment on mechanical properties of coal gangue cementation
- Multi-objective optimization of machining variables for wire-EDM of LM6/fly ash composite materials using grey relational analysis
- Synthesis and characterization of Ag@Ni co-axial nanocables and their fluorescent and catalytic properties
- Beneficial effect of 4% Ta addition on the corrosion mitigation of Ti–12% Zr alloy after different immersion times in 3.5% NaCl solutions
- Study on electrical conductive mechanism of mayenite derivative C12A7:C
- Fast prediction of concrete equivalent modulus based on the random aggregate model and image quadtree SBFEM
- Research on uniaxial compression performance and constitutive relationship of RBP-UHPC after high temperature
- Experimental analysis of frost resistance and failure models in engineered cementitious composites with the integration of Yellow River sand
- Influence of tin additions on the corrosion passivation of TiZrTa alloy in sodium chloride solutions
- Microstructure and finite element analysis of Mo2C-diamond/Cu composites by spark plasma sintering
- Low-velocity impact response optimization of the foam-cored sandwich panels with CFRP skins for electric aircraft fuselage skin application
- Research on the carbonation resistance and improvement technology of fully recycled aggregate concrete
- Study on the basic properties of iron tailings powder-desulfurization ash mine filling cementitious material
- Preparation and mechanical properties of the 2.5D carbon glass hybrid woven composite materials
- Improvement on interfacial properties of CuW and CuCr bimetallic materials with high-entropy alloy interlayers via infiltration method
- Investigation properties of ultra-high performance concrete incorporating pond ash
- Effects of binder paste-to-aggregate ratio and polypropylene fiber content on the performance of high-flowability steel fiber-reinforced concrete for slab/deck overlays
- Interfacial bonding characteristics of multi-walled carbon nanotube/ultralight foamed concrete
- Classification of damping properties of fabric-reinforced flat beam-like specimens by a degree of ondulation implying a mesomechanic kinematic
- Influence of mica paper surface modification on the water resistance of mica paper/organic silicone resin composites
- Impact of cooling methods on the corrosion behavior of AA6063 aluminum alloy in a chloride solution
- Wear mechanism analysis of internal chip removal drill for CFRP drilling
- Investigation on acoustic properties of metal hollow sphere A356 aluminum matrix composites
- Uniaxial compression stress–strain relationship of fully aeolian sand concrete at low temperatures
- Experimental study on the influence of aggregate morphology on concrete interfacial properties
- Intelligent sportswear design: Innovative applications based on conjugated nanomaterials
- Research on the equivalent stretching mechanical properties of Nomex honeycomb core considering the effect of resin coating
- Numerical analysis and experimental research on the vibration performance of concrete vibration table in PC components
- Assessment of mechanical and biological properties of Ti–31Nb–7.7Zr alloy for spinal surgery implant
- Theoretical research on load distribution of composite pre-tightened teeth connections embedded with soft layers
- Coupling design features of material surface treatment for ceramic products based on ResNet
- Optimizing superelastic shape-memory alloy fibers for enhancing the pullout performance in engineered cementitious composites
- Multi-scale finite element simulation of needle-punched quartz fiber reinforced composites
- Thermo-mechanical coupling behavior of needle-punched carbon/carbon composites
- Influence of composite material laying parameters on the load-carrying capacity of type IV hydrogen storage vessel
- Review Articles
- Effect of carbon nanotubes on mechanical properties of aluminum matrix composites: A review
- On in-house developed feedstock filament of polymer and polymeric composites and their recycling process – A comprehensive review
- Research progress on freeze–thaw constitutive model of concrete based on damage mechanics
- A bibliometric and content analysis of research trends in paver blocks: Mapping the scientific landscape
- Bibliometric analysis of stone column research trends: A Web of Science perspective