Experimental research on bonding mechanical performance of the interface between cementitious layers
-
Xi Qin
 and
Jiazheng Li
and
Jiazheng Li

Abstract
Interfaces of cementitious layers have widely existed in construction projects, and they are the weakest part of the whole building. In this article, laser scanning and ultrasonic pulse, splitting tensile, and semi-disc fracture tests were carried out to study the bonding performance of cementitious layers. Different performance metrics, such as splitting tensile bond strength, ultrasonic pulse velocity, and attenuation of first arrival, were used to evaluate the bonding characteristics of the concrete layers. The results revealed that the parameters of the interface curve decreased, and the mechanical properties of the interface became weaker with an increase of the interval time. The amplitude of the first wave was more sensitive to the presence of the interface than the ultrasonic pulse velocity. Finally, the relationships between the performance metrics were analyzed. The fracture toughness of model I and mode II was highly correlated with the parameters of the micromorphology of the layered concrete, and the correlation coefficient is not less than 0.9511. The fracture toughness of mode I was strongly related to the splitting tensile strength, with a correlation coefficient of not less than 0.9744. This study was useful for the future study of the mode I and I fracture performance, the morphology, and other physical properties of cementitious layers.
List of abbreviation and symbols
- RCC
-
roller-compacted concrete
- SEM
-
scanning electron microscopy
- CT
-
computer tomography
- SCB
-
semi-circular bend
- Pcurve
-
the length of the interface curve, mm
- h
-
the altitude difference from the peak to valley on the solid line, mm
- K I
-
the stress intensity factors for mode I, MPa m1/2
- K Ic
-
the fracture toughness of mode I, MPa m1/2
- Y I
-
the geometry factors for mode I
- S1
-
the loading distances of modes I, mm
- RCCP
-
roller-compacted concrete pavement
- EDS
-
energy dispersive spectroscopy
- UHPC
-
ultra-high-performance concrete
- TPB
-
Three-point bending
- Acurve
-
the area surrounded by the continuous line of the interface and the dotted line through the highest point, mm2
- f ts
-
the splitting tensile strength, MPa
- K II
-
the stress intensity factors for mode II, MPa m1/2
- K IIc
-
the fracture toughness of mode II, MPa m1/2
- Y II
-
the geometry factors for mode II
- S2
-
the loading distances of mode II, mm
1 Introduction
Interfaces between cementitious layers occur widely in hydraulic, civil, and repair engineering, such as the layers of roller-compacted concrete (RCC) dams [1] and roller-compacted concrete pavement (RCCP) [2,3], the interface between old and new concrete [4], and the interface of printed concrete [5,6]. The interfaces of the concrete layer poured at different times were the weakest parts of the overall structure. Therefore, it is important to investigate the bonding performance at the weakest interfaces.
The morphologies of the interfaces were studied at different levels to observe the interface’s multiscale characteristics [7], which can unveil the structures of the interfaces. Li et al. [8] used scanning electron microscopy (SEM), energy dispersive spectroscopy, and splitting tensile tests to study the major properties of new-to-old concrete and found that the interface was porous and rich in large crystals. Xie et al. [4] divided the bonding interface into penetrating, strongly affected, and weakly affected layers and found that the interface was porous and abundant in Ca(OH)2. Qin and Xu [9] investigated concentrated initial defects in layer interfaces using a computer tomography method.
The mechanical performance of the interfaces was studied by some researchers. Daneshvar et al. [10] summarized the parameters affecting the bond strength and analyzed the influence of the different overlays on the interfacial bond strength. Ling et al. [11] studied the relationship between the compressive, splitting tensile, and shear strengths of RCC specimens with different layers. Qian and Xu [12] studied different layer interfaces with different time intervals by performing macro strength, permeability, and microstructure tests and found that longer interval times lead to weaker bond strength. Feng et al. [13] found that there was a linear relationship between the area of the substrate adhered to the ultra-high-performance concrete overlay and the substrate roughness had a significant influence on the bond strength. In contrast, the steel fiber type had only a slight influence on bond strength.
Micro-cracks and cavities reduce the load-bearing capacity and lead to failures of the concrete structure [14]. There are more micro-cracks and cavities in the concrete layers [8,9], and hence, the shear- and tension-resistance ability of the interface between the concrete layers should be analyzed. Maier and Lees [15] summarized the parameters affecting the interlayer fracture behavior. Currently, there are some tests for the shear strength of a layer, such as the direct shear test [16,17,18], Z-type specimen test [19], semi-circular bend (SCB) specimen test [20], and double-edge notched plate test [21]. The tension fracture properties can be investigated using a three-point bending test [22], wedge splitting test [15,23], Brazilian disc test [24], and SCB specimen test [20]. Among these methods, the SCB specimen type could be adapted to research the shear and tension fracture properties of interfaces with less materials usage and a simpler manufacturing process.
In this study, the mesoscopic and microscopic structures of interfaces between concrete and mortar layers were studied by scanning topography observation and SEM. The bonding characteristics of the interfaces between the cementitious layers were tested using splitting tensile and ultrasonic pulse tests. The shear and tension bonding properties of the interfaces were comprehensively investigated using an SCB specimen test. Subsequently, the relationships between bonding parameters are discussed. Therefore, the result suggests the bonding performance study of the interfaces between the cementitious layers.
2 Materials
Ordinary Portland cement manufactured by Jinyu was used in the experiment; its composition is shown in Table 1. Fly ash, sand, and aggregates were obtained from the Baihetan Dam Project and carried downstream of the Jinshajiang River. The mix proportions of the mortars are shown in Table 2. The mortar setting times were obtained from the penetration resistance test according to ASTM C403 [25], and a plastic sheet was paved on the surface of the mold during the test to prevent moisture loss. The initial setting time was 5 h 54 min, whereas the final setting time was 8 h 16 min.
Chemical composition of cement
| Components | CaO | SiO2 | Al2O3 | MgO | SO3 | Fe2O3 | Na2O | K2O | LOI |
|---|---|---|---|---|---|---|---|---|---|
| % By weight | 47.87 | 25.12 | 11.29 | 5.52 | 2.95 | 2.39 | 0.65 | 0.60 | 2.63 |
Mix proportion of mortar
| W/(C + F) | Water | Cement | Sand |
|---|---|---|---|
| kg/m3 | |||
| 0.5 | 400 | 800 | 1,840 |
The mix proportions of the concrete are listed in Table 3. The aggregate was sieved with a 16 mm square hole sieve to adapt the dimensions of the SCB specimens. Type-I fly ash and JM-II water reducers were used to prepare the concrete. The setting times of the concrete were tested such that the initial setting time was 12 h, while the final setting time was 16 h.
Mix proportion of concrete
| W/(C + F) | F/(C + F) | S/(S + A) | Water reducer | Water | Cement | Fly ash | Sand | Aggregate | Water reducer |
|---|---|---|---|---|---|---|---|---|---|
| % | % | % | kg/m3 | ||||||
| 0.44 | 40 | 40 | 0.60 | 120.00 | 163.64 | 109.09 | 968.59 | 1137.04 | 1.6364 |
3 Methods
Mortar and concrete specimens with a layer interface were prepared, as shown in Figure 1. In this process, the dimensions of the mold were 100 mm cubes. First, the mixture was poured into half the height of the mold, and then, the surface of the mixture was covered with a plastic sheet to prevent moisture loss. After specific time intervals, the plastic sheet was removed, and the upper half height of the mold was poured. Mortar specimens were prepared at 0, 5, 10, and 15 h at four different time intervals, while concrete specimens were prepared at 0, 10, 20, and 35 h at four different time intervals. When pouring the upper layer, 0.5% by weight of dye was added to the raw materials before mixing to distinguish the upper and lower layers for structural observation. The specimens with a certain strength were demolded after 1 day set in molds and then cured under the standard condition of 20 ± 2°C temperature and relative humidity not less than 95% until 28 days for tests.

Pouring process of the specimen.
3.1 Specimen preparation
The specimen for the scanner observation was drilled a hole with a 30 mm diameter along the layer interface of a 100 mm cube using a diamond drill of 38 mm diameter and then cut to approximately 15 mm in thickness. The observed surface was then ground and polished for scanning. The sample preparation process is illustrated in Figure 2. Then, the specimen from the scanner observation was cut to dimensions of approximately 10 mm × 5 mm × 2 mm for the SEM test.

Process of specimen preparation for scanner topography observation: (a) drill along the layer interface, (b) cut to about 15 mm in thickness, (c) the thin plate, and (d) grinding and polishing.
The dimensions of the specimens for the splitting tensile and ultrasonic pulse tests were 100 mm × 100 mm × 100 mm, and three specimens of every interval group were prepared. The specimen for the SCB fracture test was drilled along the layer interface, and a cylinder with a diameter of 75 mm was obtained. Then, the cylinder was cut into thin circular plates with a thickness of 30 mm, and the circular plate was cut into a semi-circular plate. Finally, a crack with a length of 15 mm was fabricated. The preparation process for the SCB specimens is shown in Figure 3. Three specimens of each interval group and mode type were prepared for the SCB test.

Preparation process of SCB specimen: (a) drill along the layer interface, (b) thin circular plate, (c) prefabricated crack, and (d) semi-circular specimen with load point mark.
3.2 Scanner topography observation
An HP LaserJet Professional M1136 scanner was used to observe the surface of the specimen. The maximum scanning resolution was 1,200 dpi. A picture of the layer interface was obtained, and the interface was drawn by a line.
Because of the layered pouring, the layer interface is not a straight line. The solid line in Figure 4 shows the schematic of the layer interface. Pcurve is the length of the interface curve, and Acurve is the area surrounded by the continuous line of the interface and the dotted line through the highest point. h is the altitude difference from the peak to the valley on the solid line. Pcurve, Acurve, and h can be used to demonstrate the bond properties of the interface between layers.

Schematic of the layer interface.
3.3 SEM test
Before conducting the SEM test, the tiny sample was dried with a 40°C dryer for 1 day, and then the surface was cleaned with an ear wash ball and plated with platinum before being observed with SEM. After several preparation procedures, the specimens were placed under an emission SEM to obtain SEM images of the surface around the interfaces.
3.4 Ultrasonic pulse test
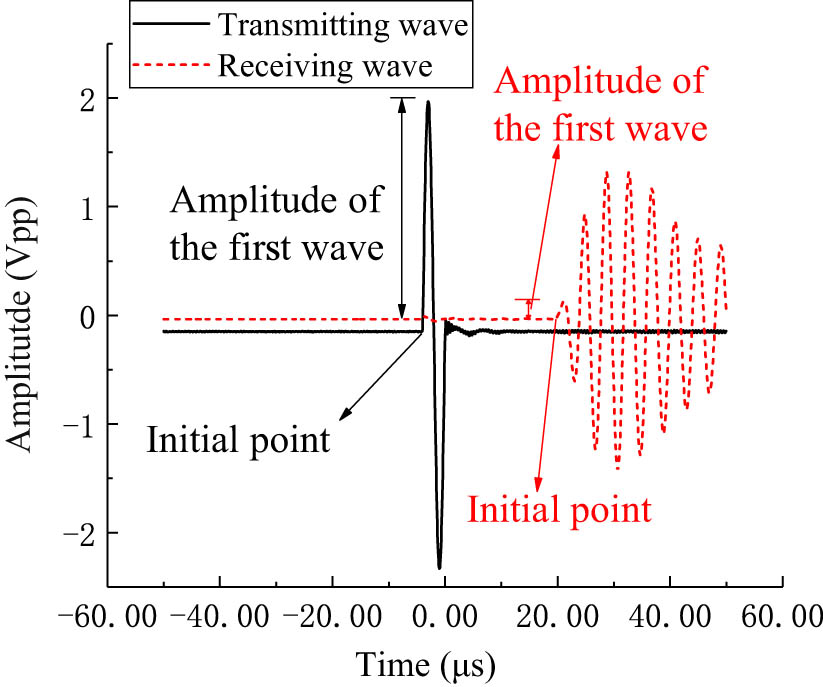
Ultrasonic pulse tests can use ultrasonic waves to analyze the received ultrasonic waves to represent the bond properties of the layer [9,12]. Schematic and physical pictures of the ultrasonic pulse test are shown in Figure 5. A transmitting wave (250 kHz, 2 Vpp) was generated from the wave generator and amplified using a power amplifier. Two probes were placed on opposite surfaces parallel to the interface of the specimen using an ultrasonic couplant. The wave transmitted from the transmitting probe was weakened through the specimen and then captured by the receiving probe. The receiving and transmitting waves can be shown on the screen of the oscilloscope, as shown in Figure 6. From the two waveforms, the initial vibration point and first wave amplitudes of the transmitting and receiving waves were obtained and analyzed. The wave velocity and relative amplitude of the first wave were acquired to demonstrate the bond properties of the layer.

Ultrasonic pulse test: (a) schematic and (b) physical map.
Waveform of the transmitting and receiving wave.
3.5 Splitting tensile test
A 100 mm cube was set between the two steel plates for the splitting tensile test, and two steel square strips of 5 mm × 5 mm were placed between the steel plates along the interface, as shown in Figure 7. The yellow line indicates the location of the interface layer. The formula for splitting tensile strength is described in equation (1):
where f ts is the splitting tensile strength (MPa), P is the maximum failure load (N), and A is the cross-sectional area of the specimen (mm2).

Splitting tensile test.
3.6 SCB specimen test
Concrete can fracture in modes I (tension), II (shear), and III (antiplane shear) [26,27]. The fracture problems of modes I and II are the most frequent occurrence and damage [28]. A four-point bend beam is often used for mode I and II fractures in concrete [28,29], which requires complex specimen preparation and massive material usage. SCB specimens have also been tested for both mode I and mode II fractures of rock [30,31], asphalt mixtures [32], and concrete [33]. SCB specimens with less material usage are easier to form and test than four-point bending beams. The specimen can be loaded from mode I to mode II by changing the crack angle or loading distance. To simplify specimen preparation, the same specimen was used to test the mode I and mode II fracture toughness of the interface by changing the loading distance of the loading rollers, as shown in Figure 8. A symmetric loading method, as shown in Figure 8(a), was used for the mode I fracture, whereas an asymmetric loading method was used for the mode II fracture, as shown in Figure 8(b).

Semi-circular specimens: (a) loading method of mode I fracture and (b) loading method of mode II fracture.
The stress intensity factor could be calculated by equation (2):
where K I and K II are the stress intensity factors for mode I and mode II (MPa m1/2), respectively; P is the load (N); R is the radius of the specimen (mm); t is the thickness of the specimen (mm); a is the crack length (m); Y I and Y II which are functions of the specimen geometry and loading condition, are the geometry factors for modes I and II, respectively; and S1 and S2 are the loading distances of modes I and II. In the mode II fracture toughness test, S2 should be determined via numerical simulation to ensure mode II failure.
4 Numerical simulation
The stress distribution around the crack tip of the asymmetric SCB (ASCB) specimen was analyzed by numerical simulation, and the ASCB specimen was confirmed to be an efficient specimen for studying mode II fracture. A two-dimensional model was established using the commercial finite-element program ABAQUS. The dimensions of the test piece were as follows: diameter D = 75 mm, crack length a = 15 mm, and thickness t = 30 mm. A finite-element model of the semi-disc test piece is shown in Figure 9. An 8-node quadrilateral quadratic plane stress reduction integral element (CPS8R) was used, and the number of elements is 1,688, and the number of nodes is 4,950. The top load P was taken as 4,000 N, and the loading spans S1 and S2 were adjusted to obtain the stress intensity factors of modes I and II under the corresponding loading span. The geometric factors, Y I and Y II, were inversely derived according to equation (2). The discrete data points in Figure 11 are represented by discrete solid graphs, and the fit curves between Y I, Y II, and S2/R are indicated by the solid lines of the corresponding colors.

Finite-element mesh of SCB specimen.
The positive and negative values of Y II, as shown in Figure 10, obtained by the finite-element numerical analysis, are related to the shear stress direction at the crack tip. When S2 was maintained, and S1 was decreased, a positive Y II was obtained. Therefore, the absolute value of Y II was used in the subsequent analysis. When S1 is fixed, Y I continuously decreases as S2 decreases, and the rate of decrease of Y I continuously increases. The absolute value of Y II increased as S2 decreased. When S2 is fixed, a larger S1 results in a larger Y I and an absolute value of Y II.

Variation of the geometric factor of fracture toughness: (a) Y I-S2/R and (b) Y II-S2/R.
Therefore, when S2 = S1, the crack tip is in pure mode I fracture, Y II = 0. When S1 is fixed, as S2 decreases, the fracture model of the crack tip transitions from a pure mode I fracture to a mixed fracture, and the effect of the mode II fracture increases. Continuously reduce S2 until pure mode II fracture failure occurs at the crack tip, at which point Y I = 0. The absolute values of S2 and Y II when Y I = 0 can be determined according to the fitting curve shown in Figure 10. So, in the mode I fracture test, S1 = 15 mm, S2 = 15 mm, Y I = 2.0829, Y II = 0, and in the mode II fracture test, S1 = 15 mm, S2 = 3.55 mm, Y I = 0, |Y II| = 1.3966.
5 Laboratory test
Before loading, the loading positions of the specimens are marked in red short lines according to S1 and S2 of mode I and II fracture tests. Mode I and II fracture tests were conducted, as shown in Figure 11, and two steel rollers were placed on the lower loading plate to control the loading span. The indoor SCB specimen test was carried out using a WDW-20 kN electronic universal testing machine for displacement control with a loading speed of 0.1 mm/min. In the semi-disc test, the test piece was small, and the critical failure load P c was substituted into equation (2) to calculate the fracture toughness, i.e., the critical stress intensity factor [34], of the corresponding cementitious layers.

SCB test loading diagram: (a) mode II fracture loading test and (b) mode I fracture loading test.
6 Experimental results
6.1 Results of the layered mortar
6.1.1 Micromorphology
The surface morphology of the mortar layer structures at different intervals could be obtained using a scanner. The images are shown in Figure 12. The interfaces between the upper and lower layers were evident because of the dyed-up layer. The schematics of the interfaces are shown in Figure 4, and the parameters of the interfaces within the 18.15 mm length range are given in Table 4. The larger the interval time, the smaller the parameters of the interface curve, and the flatter the interface. Therefore, shortening the interval time can increase the interpenetration and mixability of the upper and lower layers of the mortar.

Mortar layer structures of different intervals: (a) 0 h, (b) 5 h, (c) 10 h, and (d) 15 h.
Topography parameters of mortar interfaces
| Interval time (h) | Length L (mm) | Acurve (mm2) | Pcurve (mm) | h (mm) |
|---|---|---|---|---|
| 5 | 18.15 | 1,340 | 261.65 | 1.13 |
| 10 | 18.15 | 756 | 205.87 | 0.89 |
| 15 | 18.15 | 443 | 195.99 | 0.38 |
Monolithic mortar, rough interface, and flatter interface were chosen to analyze the microstructures of the different interfaces. Micro-topographic images of the layered mortar at 0, 5, and 15 h intervals are shown in Figure 13. The left images in every row are topographic images with a magnification factor of 50. The middle images in every row are magnified images of the red rectangles in the left images, and the right images in every row are magnified images of the red rectangles in the middle images. Two strip marks were engraved to sign the positions of the interfaces on the right side of Figure 14(d) and (g). The three right images, Figure 14(c), (f) and (i), show the images with the longer time interval, larger the pore area, and larger the pore diameter.

SEM test of the layered mortar with different intervals: (a) 0 h, 50 magnification; (b) 0 h, 100 magnification; (c) 0 h, 500 magnification; (d) 5 h, 50 magnification; (e) 5 h, 100 magnification; (f) 5 h, 500 magnification; (g) 15 h, 50 magnification; (h) 15 h, 100 magnification; and (i) 15 h, 500 magnification.

Result of ultrasonic pulse test of the layered mortar with different interval times.
7 Ultrasonic pulse test
To compare the significance of the ultrasonic test parameters changing with the interval time, the normalized parameter values were used for a comparative analysis according to the parameters of the monolithic mortar. The average normalized ultrasonic velocity and average normalized first wave amplitude ratio (received wave to transmitted wave) of the mortar interface are shown in Figure 14. The ultrasonic wave velocity passing through the layered mortar was insensitive to the interval time. The first wave amplitude ratio was very sensitive to the interval time between the layers, which was testified in the literature [12]. The amplitude of the first wave was very sensitive to the presence of the interface. Before the initial setting time, the first wave amplitude ratio decreased significantly with increasing interval time. After the final setting time, the first wave amplitude ratio decreased slowly with increasing interval time.
8 Splitting tensile test
The splitting tensile strength decreased almost linearly with an increase in the interval time between 0 and 10 h, as shown in Figure 15. However, the tensile strength decreased less between 10 and 15 h after the final setting time of 8 h 16 min. As the interlayer interval time increased, the tensile strength between concrete layers gradually decreased. From the split surface condition, the larger the interval time, the rougher the split surface.

Splitting tensile strength of the layered mortar.
9 SCB specimen test
The fracture test results for the layered mortar semi-discs are shown in Figure 16. K Ic decreased almost linearly with an increase in the interval between 0 and 10 h. K Ic decreased slightly during the 10 and 15 h intervals after the final setting time. K IIc decreased significantly during the 0 and 5 h intervals, while the change between the 5 and 10 h intervals was smaller.

Result of SCB test of the layered mortar.
The interlayer failure surface of the layered mortar in the SCB tests is shown in Figure 17. The failure surfaces of the monolithic mortar were uneven under both mode I and mode II loading. When the monolithic mortar underwent mode II loading, the crack in the specimen was deflected toward the S1 loading side, and the crack was finally deflected toward the uploading point. When the interface of the mortar underwent mode I loading, the cracks of the specimens extended vertically upward along the crack tip at the interface without any deflection. When the interface of the mortar underwent mode II loading after the final setting time, the cracks of the specimens also extended vertically upward along the crack tip at the interface without any deflection. The failure surface of the interface with a 5 h interval was slightly uneven under mode II loading. Irrespective of the type of loading mode, the larger the interval time, the larger the pores in the failure surfaces of the interface.

Failure surface of SCB specimens of the layered mortar.
9.1 Results of the layered concrete
9.1.1 Meso-morphology
Similar to the mortar interface, the scanner images of the layered concrete test piece are shown in Figure 18. The parameters of the interface curve within 18.15 mm are listed in Table 5. Before the initial setting time (12 h), at the 10 h interval, the upper and lower concrete layers had the greatest influence, and the aggregates of the upper layer interpenetrated within the lower concrete layer. After the final setting time (16 h), the interpenetration between the upper and lower layers decreased rapidly at the 20 h interval, especially at 35 h. The parameters decrease as the interlayer interval time increases. The area (Acurve) and height difference (h) of the layered concrete changed significantly with the interval time.

Concrete layer structures of different intervals: (a) 0 h, (b) 10 h, (c) 20 h, and (d) 35 h.
Topography parameters of concrete layer
| Interval time (h) | Length L (mm) | Acurve (mm2) | Pcurve (mm) | h (mm) |
|---|---|---|---|---|
| 10 | 18.15 | 2,076 | 263.01 | 2.25 |
| 20 | 18.15 | 641 | 212.39 | 0.67 |
| 35 | 18.15 | 126 | 187.52 | 0.22 |
10 Ultrasonic pulse test
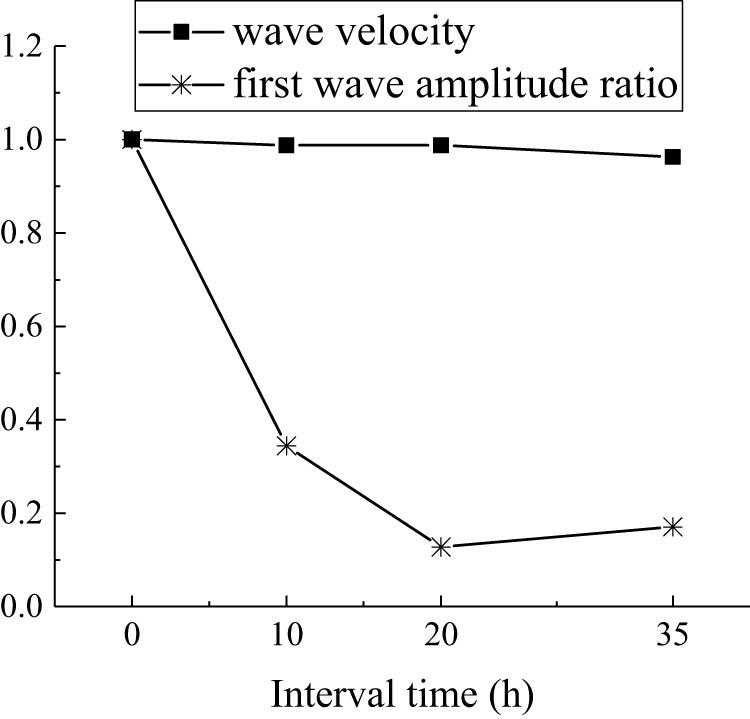
Like the interface of the mortar, the average normalized ultrasonic velocity and average normalized first wave amplitude ratio of the layered concrete are shown in Figure 19. The average normalized first wave amplitude ratio of the layered concrete was also more sensitive than the average normalized ultrasonic velocity to changes in the interval time. The first wave amplitude ratio decreased significantly before the initial setting time with the increase in the interval time. It decreased relatively slowly with the increase in the interval time after the initial setting time. The first wave amplitude ratio increased slightly at 35 h intervals, which might be because more energy of the ultrasonic wave was needed to pass through the concrete specimen of the long interval interface, and it was difficult to obtain an accurate first wave amplitude of the receiver wave. Therefore, a larger-energy ultrasonic wave should be used to penetrate the layered concrete specimen.
Result of the ultrasonic pulse test of the layered concrete with different interval times.
11 Splitting tensile test
The splitting tensile strength of the concrete layer decreased with increasing interval time, as shown in Figure 20. After the final setting time, the splitting tensile strength of the concrete layer changes relatively slowly. In addition, many aggregates broke on the failure surface of the splitting tensile test, and the area of the broken aggregate decreased as the interval time increased. The failure surface of the interface at 30 h interval was flat, without broken aggregates.

Splitting tensile strength of the layered concrete.
12 SCB specimen test
The fracture test results for the layered concrete semi-discs are shown in Figure 21. K Ic decreased almost linearly with an increase in the interval between 0 and 20 h. K Ic decreased relatively slowly between 20 and 30 h after the final setting time (16 h). The change in K IIc with the interval time was the same as that of K Ic, but K IIc of the layered concrete was more sensitive to the change in interval time. Compared with the results of the layered mortar, the presence of the aggregate affected the mutual penetration of the upper and lower layers and changed the sensitivity of the bonding properties. The rule of the failure surface to the interval time of the layered concretes was basically the same as that of layered mortars, but the failure surface of the layered concrete was rougher than that of layered mortars owing to the existence of aggregates.

Result of the SCB test of the layered concrete.
13 Discussion
13.1 Correlation between fracture parameters and meso-morphology parameters
Figure 22 shows that the interlaminar meso-morphology parameters had a good correlation with mode II fracture toughness for both the layered mortar and concrete. The correlation coefficient between K IIc and h was not less than 0.9846. However, the correlation between K Ic and h is not general, and the correlation coefficient of the layered concrete is 0.9997, whereas that of the layered mortar is 0.5778. As K IIc is related to the friction of the interface and the height difference h represents the roughness of the interface, K IIc and h are more closely related than K Ic and h.

Correlation between fracture and microscopic morphology parameters: (a) mortar and (b) concrete.
13.2 Correlation between fracture parameters and amplitude ratios
Figure 23 shows that the correlations between K IIc and the amplitude ratio were higher for both the layered mortar and concrete, and the correlation coefficient was not less than 0.9590. The relationship between K Ic and the amplitude ratio was relatively lower than that with K IIc; however, the correlation coefficient was not less than 0.8709. Considering the layered concrete, the fracture toughness of modes I and II was highly correlated with the amplitude ratio, and the correlation coefficient was not less than 0.9832.

Correlation between fracture parameters and average normalized amplitude ratios: (a) mortar and (b) concrete.
13.3 Correlation between fracture parameters and splitting tensile strength
Figure 24 shows that there was a strong correlation between the splitting tensile strength and K Ic of the interface between the layered mortar and concrete, with a correlation coefficient of not less than 0.9744. K Ic could be predicted by tensile strength [35], and splitting tensile strength is the ability to resist tensile failure. The correlation between the splitting tensile strength and K IIc was relatively weaker than that with K Ic of the layered mortar. The correlation coefficient between the splitting tensile strength and K IIc of the layered mortar was only 0.8098.

Correlation between fracture parameters and splitting tensile strength: (a) mortar and (b) concrete.
14 Conclusions
In this study, the interfaces of layered cementitious materials with different interval times were investigated using mesoscopic structures, ultrasonic pulse tests, splitting tensile tests, and SCB specimen tests. The bonding properties of the interfaces were then determined and evaluated.
As the time interval increased, the total area of the pores and the range of weak substances at the interface of the layered mortar increased. The interpenetration of the upper and lower layers of the layered mortar and concrete weakened with an increase in the interval time. Owing to the different coagulation properties of the layered mortar and concrete and the presence of coarse aggregates in the layered concrete, the interpenetration between the layered concrete was greater at the same intervals.
The ultrasonic velocity was less sensitive to the interval of the interface than the first wave amplitude ratio of the received and transmitted waves in the ultrasonic pulse test. Therefore, the first wave amplitude ratio can be used to study the characteristics of the interface between the layered cementitious materials.
K IIc and K Ic of the SCB specimen test decreased with an increase in the interval of the interface between cementitious layers. K IIc was more sensitive to the interval than K Ic of the layered concrete, whereas K Ic was more sensitive to the interval before the initial setting time than K Ic of the layered mortar.
The results of the ultrasonic test and the splitting strength are correlated well with the fracture toughness parameters of the layered cementitious material. K IIc of the layered cementitious material had a strong correlation with the meso-morphology parameters, which were related to the toughness of the interface. K Ic did not have a clear correlation with the meso-morphology parameters. Therefore, meso-morphology tests, ultrasonic pulse tests, and splitting tensile tests can be conducted to determine the fracture toughness of the interface between cementitious layers.
-
Funding information: This research was funded by the National Natural Science Foundation of China (52009011, 52090084, 52239009), Natural Science Foundation of Hubei Province (2021CFB154), and Fundamental Research Funds for Central Public Welfare Research Institutes (CKSF2021455/CL).
-
Conflict of interest: Authors state no conflict of interest.
-
Data availability statement: All data, models, and code generated or used during the study appear in the published article.
References
[1] Liu D, Li Z, Liu J. Experimental study on real-time control of roller compacted concrete dam compaction quality using unit compaction energy indices. Constr Build Mater. 2015;96:567–75.10.1016/j.conbuildmat.2015.08.048Search in Google Scholar
[2] Aghaeipour A, Madhkhan M. Mechanical properties and durability of roller compacted concrete pavement (RCCP) – A review. Road Mater Pavement Des. 2020;21(7):1775–98.10.1080/14680629.2019.1579754Search in Google Scholar
[3] Khweir K, Fordyce D. Influence of layer bonding on the prediction of pavement life. In Proc Institution of Civil Engineers-Transport. Vol. 156. Issue. 2. London: Thomas Telford Ltd.; 2003. p. 73–83.10.1680/tran.2003.156.2.73Search in Google Scholar
[4] Xie H, Li G, Xiong G. Microstructure model of the interfacial zone between fresh and old concrete. J Wuhan Univ Technol-Mater Sci Ed. 2002;17(4):64–8.10.1007/BF02838421Search in Google Scholar
[5] Zareiyan B, Khoshnevis B. Effects of interlocking on interlayer adhesion and strength of structures in 3D printing of concrete. Autom Constr. 2017;83:212–21.10.1016/j.autcon.2017.08.019Search in Google Scholar
[6] Wang L, Tian Z, Ma G, Zhang M. Interlayer bonding improvement of 3D printed concrete with polymer modified mortar: Experiments and molecular dynamics studies. Cem Concr Compos. 2020;110:103571.10.1016/j.cemconcomp.2020.103571Search in Google Scholar
[7] Sadowski Ł. Multi-scale evaluation of the interphase zone between the overlay and concrete substrate: Methods and descriptors. Appl Sci. 2017;7(9):893.10.3390/app7090893Search in Google Scholar
[8] Li G, Xie H, Xiong G. Transition zone studies of new-to-old concrete with different binders. Cem Concr Compos. 2001;23(4–5):381–7.10.1016/S0958-9465(01)00002-6Search in Google Scholar
[9] Qin X, Xu Q. Statistical analysis of initial defects between concrete layers of dam using X-ray computed tomography. Constr Build Mater. 2016;125:1101–13.10.1016/j.conbuildmat.2016.08.149Search in Google Scholar
[10] Daneshvar D, Behnood A, Robisson A. Interfacial bond in concrete-to-concrete composites: A review. Constr Build Mater. 2022;359:129195.10.1016/j.conbuildmat.2022.129195Search in Google Scholar
[11] Ling C, Jin S, Tu C. Experiment researches on RCC with layer surfaces for longtan project. J Hydroelectr Eng. 2001;3:117–29 (in Chinese).Search in Google Scholar
[12] Qian P, Xu Q. Experimental investigation on properties of interface between concrete layers. Constr Build Mater. 2018;174:120–9.10.1016/j.conbuildmat.2018.04.114Search in Google Scholar
[13] Feng S, Xiao H, Liu M, Zhang F, Lu M. Shear behaviour of interface between normal-strength concrete and UHPC: Experiment and predictive model. Constr Build Mater. 2022;342:127919.10.1016/j.conbuildmat.2022.127919Search in Google Scholar
[14] Golewski GL. The phenomenon of cracking in cement concretes and reinforced concrete structures: the mechanism of cracks formation, causes of their initiation, types and places of occurrence, and methods of detection—a review. Buildings. 2023;13(3):765.10.3390/buildings13030765Search in Google Scholar
[15] Maier M, Lees J. Interlayer fracture behaviour of functionally layered concrete. Eng Fract Mech. 2022;271:108672.10.1016/j.engfracmech.2022.108672Search in Google Scholar
[16] Ray I, Davalos JF, Luo S. Interface evaluations of overlay-concrete bi-layer composites by a direct shear test method. Cem Concr Compos. 2005;27(3):339–47.10.1016/j.cemconcomp.2004.02.048Search in Google Scholar
[17] Liu G, Lu W, Lou Y, Pan W, Wang Z. Interlayer shear strength of Roller compacted concrete (RCC) with various interlayer treatments. Constr Build Mater. 2018;166:647–56.10.1016/j.conbuildmat.2018.01.110Search in Google Scholar
[18] Qin X, Xu Q. The shear strength and mode II fracture toughness of layered concrete. Eng Mech. 2019;36(9):188–96 (in Chinese).Search in Google Scholar
[19] Wang Z, Lin Y, Qian Y. Experimental research on shear properties of new-to-old concrete interface. J Southwest Jiatong Uni. 2005;40(5):600–4 (in Chinese).Search in Google Scholar
[20] Ayatollahi MR, Aliha MRM, Saghafi H. An improved semi-circular bend specimen for investigating mixed mode brittle fracture. Eng Fract Mech. 2011;78(1):110–23.10.1016/j.engfracmech.2010.10.001Search in Google Scholar
[21] Huang Z. Study on induced joints and fracture property of layer surface in RCC with test and numerical modeling. Chinese dissertation. Dalian: Dalian University of Technology; 2005 (in Chinese).Search in Google Scholar
[22] Shah SG, Bhasya V, Kishen JMC. Tension-softening properties for concrete–concrete interfaces. ACI Struct J. 2011;108(6):725.10.14359/51683371Search in Google Scholar
[23] He J, Huang H, Jiang H, Zhou Y, Jin F, Zhang C. Experimental investigation into mode-I interfacial fracture behavior between rock and self-compacting concrete in rock-filled concrete. Eng Fract Mech. 2021;258:108047.10.1016/j.engfracmech.2021.108047Search in Google Scholar
[24] Chang X, Guo T, Zhang S. Cracking behaviours of layered specimen with an interface crack in Brazilian tests. Eng Fract Mech. 2020;228:106904.10.1016/j.engfracmech.2020.106904Search in Google Scholar
[25] ASTM C403/C403M-16. Standard test method for time of setting of concrete mixtures by penetration resistance. West Conshohocken, PA: ASTM International; 2016.Search in Google Scholar
[26] Van Mier JGM. Fracture processes of concrete. Boca Raton, Florida: CRC Press; 1996.Search in Google Scholar
[27] Pietras D, Aliha MRM, Sadowski T. Mode III fracture toughness testing and numerical modeling for aerated autoclaved concrete using notch cylinder specimen subjected to torsion. Mater Today: Proc. 2021;45:4326–9.10.1016/j.matpr.2020.12.899Search in Google Scholar
[28] Zhao Y, Liu Y, Xu B. Effect of coarse aggregate size distribution on fracture toughness of concrete based on boundary effect model. Theor Appl Fract Mech. 2021;113:102970.10.1016/j.tafmec.2021.102970Search in Google Scholar
[29] Dong W, Wu Z, Tang X, Zhou X. A comparative study on stress intensity factor-based criteria for the prediction of mixed mode I-II crack propagation in concrete. Eng Fract Mech. 2018;197:217–35.10.1016/j.engfracmech.2018.05.009Search in Google Scholar
[30] Ayatollahi MR, Aliha M. On determination of mode II fracture toughness using semi-circular bend specimen. Int J Solids Struct. 2006;3(17):5217–27.10.1016/j.ijsolstr.2005.07.049Search in Google Scholar
[31] Zhang X, Wu X, Xiao Y, Shi J, Zhao Y, Zhang M. Extending application of asymmetric semi-circular bend specimen to investigate mixed mode I/II fracture behavior of granite. J Central South Univ. 2022;29(4):1289–304 (in Chinese).10.1007/s11771-022-4989-6Search in Google Scholar
[32] Pirmohammad S, Abdi M, Ayatollahi MR. Mode II fracture tests on asphalt concrete at different temperatures using semi-circular bend specimen loaded by various types of supports. Theor Appl Fract Mech. 2021;116:103089.10.1016/j.tafmec.2021.103089Search in Google Scholar
[33] Su C, Wu Q, Weng L, Chang X. Experimental investigation of mode I fracture features of steel fiber-reinforced reactive powder concrete using semi-circular bend test. Eng Fract Mech. 2019;209:187–99.10.1016/j.engfracmech.2019.01.029Search in Google Scholar
[34] Golewski GL. Effect of coarse aggregate grading on mechanical parameters and fracture toughness of limestone concrete. Infrastructures. 2023;8(8):117.10.3390/infrastructures8080117Search in Google Scholar
[35] Guan JF, Hu XZ, Xie CP, Li QB, Wu ZM. Wedge-splitting tests for tensile strength and fracture toughness of concrete. Theor Appl Fract Mech, 2018;93:263–75.10.1016/j.tafmec.2017.09.006Search in Google Scholar
© 2024 the author(s), published by De Gruyter
This work is licensed under the Creative Commons Attribution 4.0 International License.
Articles in the same Issue
- Regular Articles
- Research on damage evolution mechanisms under compressive and tensile tests of plain weave SiCf/SiC composites using in situ X-ray CT
- Structural optimization of trays in bolt support systems
- Continuum percolation of the realistic nonuniform ITZs in 3D polyphase concrete systems involving the aggregate shape and size differentiation
- Multiscale water diffusivity prediction of plain woven composites considering void defects
- The application of epoxy resin polymers by laser induction technologies
- Analysis of water absorption on the efficiency of bonded composite repair of aluminum alloy panels
- Experimental research on bonding mechanical performance of the interface between cementitious layers
- A study on the effect of microspheres on the freeze–thaw resistance of EPS concrete
- Influence of Ti2SnC content on arc erosion resistance in Ag–Ti2SnC composites
- Cement-based composites with ZIF-8@TiO2-coated activated carbon fiber for efficient removal of formaldehyde
- Microstructure and chloride transport of aeolian sand concrete under long-term natural immersion
- Simulation study on basic road performance and modification mechanism of red mud modified asphalt mixture
- Extraction and characterization of nano-silica particles to enhance mechanical properties of general-purpose unsaturated polyester resin
- Roles of corn starch and gellan gum in changing of unconfined compressive strength of Shanghai alluvial clay
- A review on innovative approaches to expansive soil stabilization: Focussing on EPS beads, sand, and jute
- Experimental investigation of the performances of thick CFRP, GFRP, and KFRP composite plates under ballistic impact
- Preparation and characterization of titanium gypsum artificial aggregate
- Characteristics of bulletproof plate made from silkworm cocoon waste: Hybrid silkworm cocoon waste-reinforced epoxy/UHMWPE composite
- Experimental research on influence of curing environment on mechanical properties of coal gangue cementation
- Multi-objective optimization of machining variables for wire-EDM of LM6/fly ash composite materials using grey relational analysis
- Synthesis and characterization of Ag@Ni co-axial nanocables and their fluorescent and catalytic properties
- Beneficial effect of 4% Ta addition on the corrosion mitigation of Ti–12% Zr alloy after different immersion times in 3.5% NaCl solutions
- Study on electrical conductive mechanism of mayenite derivative C12A7:C
- Fast prediction of concrete equivalent modulus based on the random aggregate model and image quadtree SBFEM
- Research on uniaxial compression performance and constitutive relationship of RBP-UHPC after high temperature
- Experimental analysis of frost resistance and failure models in engineered cementitious composites with the integration of Yellow River sand
- Influence of tin additions on the corrosion passivation of TiZrTa alloy in sodium chloride solutions
- Microstructure and finite element analysis of Mo2C-diamond/Cu composites by spark plasma sintering
- Low-velocity impact response optimization of the foam-cored sandwich panels with CFRP skins for electric aircraft fuselage skin application
- Research on the carbonation resistance and improvement technology of fully recycled aggregate concrete
- Study on the basic properties of iron tailings powder-desulfurization ash mine filling cementitious material
- Preparation and mechanical properties of the 2.5D carbon glass hybrid woven composite materials
- Improvement on interfacial properties of CuW and CuCr bimetallic materials with high-entropy alloy interlayers via infiltration method
- Investigation properties of ultra-high performance concrete incorporating pond ash
- Effects of binder paste-to-aggregate ratio and polypropylene fiber content on the performance of high-flowability steel fiber-reinforced concrete for slab/deck overlays
- Interfacial bonding characteristics of multi-walled carbon nanotube/ultralight foamed concrete
- Classification of damping properties of fabric-reinforced flat beam-like specimens by a degree of ondulation implying a mesomechanic kinematic
- Influence of mica paper surface modification on the water resistance of mica paper/organic silicone resin composites
- Impact of cooling methods on the corrosion behavior of AA6063 aluminum alloy in a chloride solution
- Wear mechanism analysis of internal chip removal drill for CFRP drilling
- Investigation on acoustic properties of metal hollow sphere A356 aluminum matrix composites
- Uniaxial compression stress–strain relationship of fully aeolian sand concrete at low temperatures
- Experimental study on the influence of aggregate morphology on concrete interfacial properties
- Intelligent sportswear design: Innovative applications based on conjugated nanomaterials
- Research on the equivalent stretching mechanical properties of Nomex honeycomb core considering the effect of resin coating
- Numerical analysis and experimental research on the vibration performance of concrete vibration table in PC components
- Assessment of mechanical and biological properties of Ti–31Nb–7.7Zr alloy for spinal surgery implant
- Theoretical research on load distribution of composite pre-tightened teeth connections embedded with soft layers
- Coupling design features of material surface treatment for ceramic products based on ResNet
- Optimizing superelastic shape-memory alloy fibers for enhancing the pullout performance in engineered cementitious composites
- Multi-scale finite element simulation of needle-punched quartz fiber reinforced composites
- Thermo-mechanical coupling behavior of needle-punched carbon/carbon composites
- Influence of composite material laying parameters on the load-carrying capacity of type IV hydrogen storage vessel
- Review Articles
- Effect of carbon nanotubes on mechanical properties of aluminum matrix composites: A review
- On in-house developed feedstock filament of polymer and polymeric composites and their recycling process – A comprehensive review
- Research progress on freeze–thaw constitutive model of concrete based on damage mechanics
- A bibliometric and content analysis of research trends in paver blocks: Mapping the scientific landscape
- Bibliometric analysis of stone column research trends: A Web of Science perspective