Study on electrical conductive mechanism of mayenite derivative C12A7:C
-
Cong Ji
 ,
Shan-shan Yang
,
Shan-shan Yang

Abstract
This study explains the conductive mechanism of C12A7:C from the perspective of crystal structure. C12A7:C is a carbon derivative of C12A7 and prepared by CaCO3 and Al2O3 in sealed graphite crucible through high-temperature sintering experiments. The main component was confirmed to be C12A7:C through X-ray diffraction inversion analysis. The four-probe method revealed that it is a semiconductor with conductivity of 4,339 S/m. A conductive model of C12A7:C crystal was established to study its conductive mechanism. Through theoretical calculations of the conductive structure model, the density of states and transfer function are important factors determining the conductivity of C12A7:C crystals. Based on the analysis of these two factors, C is the key to electron transfer in the C12A7:C crystal. Further research indicates that the C–C bond is the main form of C in C12A7:C crystals. These C–C bonds satisfy the formation conditions of conjugated systems and are key to the conductivity of C12A7:C crystals. Through simulation calculations, the volt ampere characteristic curve of C12A7:C exhibits Ohmic conductor characteristics. The conductivity of C12A7:C obtained through theoretical calculation is consistent with the experimental results. In conclusion, the conductivity of C12A7:C crystal is mainly due to the C–C conjugated system formed by carbon atoms in the crystal.
1 Introduction
C12A7 (12CaO·7Al2O3) is known as a mineral of calcium aluminate. As a light metal oxide, C12A7 is a kind of insulator in common conditions. It can be used in many optical devices due to its high transparency. C12A7 belongs to cubic crystal system (a = 11.98 Å, Z = 2, space group I43d). The crystal cell is composed of [Ca24Al28O64]4+ lattice frame and two free O2−, expressed as [Ca24Al28O64]4+ + 2O2−. Each cell of C12A7 has 12 cages. The diameter of each cage is about 0.4 nm. The average charge is +1/3. To maintain the overall electrical neutrality, the other two free O2− randomly occupy the center of two cages. The binding force between O2− and the frame [Ca24Al28O64]4+ is weak. Therefore, the O2− is able to shuttle freely in the cage [1]. Each cage is connected to eight adjacent cages through a window composed of six atoms (about 0.1 nm in diameter). The six atoms include one Ca atom, two Al atoms, and three O atoms. The window can be used for the exchange of materials inside and outside the cage. With this unique function, other anions such as OH− [2], Cl− [3], NH2− [4], H− [5], O− [6], and even e− [7] can be flexibly used to replace the free O2− in the cage.
In previous studies, when C12A7 is treated by some reduction atmospheres (such as Ca, Ti vapor), electrons can replace the free O2− in the cage to reform an inorganic electronic compound [Ca24Al28O64]4+ + 4e− (C12A7:e−) [8]. The electrons will be evenly distributed in each cage, and the inner diameter of the cage is similar to the C12A7 empty cage. This cage deformation will be eliminated, because the average inner diameter of C12A7:e− cage is slightly larger than normal C12A7. Similarly, using other anions to replace the free O2− in the cage will also have this effect [9].
In recent research works, studies on the application of C12A7 derivatives as electride materials mainly focus on C12A7:e− [10−16]. In Jiping et al.’s study [10], a single crystal of C12A7:e− was prepared via a spark plasma sintering and the electrical conductivity at room temperature is 1,960 S/m. In Kim et al.’s study [11], they found that C12A7:e− had high potential as an efficient electron-injection electrode for organic light-emitting diodes. In Adachia et al.’s study [12], they found that the C12A7/C12A7:e− devices exhibited a bistable resistance switching effect with an on-to-off resistance ratio of ∼102 and operated as a resistive random access memory. In Yanagi et al.’s study [13], the value of 0.4 eV between C12A7:e− and C60 is the lowest electron injection barriers for conventional organic semiconductors. In Matsuishi and Hosono’s study [14], C12A7:e− is a promising candidate for electron emitting source with small work function of 2.4 eV. In Lalan and Ganesanpotti’s studies [15,16], a new C12A7 material C12A7:e−@G was obtained by improved process. It is superior in all aspects to the unimproved C12A7. In their study, the electrical conductivity of C12A7:e−@G is 1,050 S/m. It is far better than the electrical conductivity of C12A7:e−/MG with 42 S/m.
There are also multiple studies on other derivatives of C12A7, which mainly focuses on chemical and engineering materials [17−22]. In Hosono et al.’s study [17], C12A7:H− is formed by heat treatment of C12A7 in a hydrogen atmosphere and exhibits a persistent insulator-conductor conversion upon ultraviolet-light or electron-beam irradiation. In Huang et al.’s study [18], they found that the emission intensity of C12A7 derivative with all the anionic species strongly depended on the sample surface temperature and the extraction field. In Hayashi et al.’s study [19], the radical incorporated C12A7:O− has a large magnetic susceptibility that obeys Curie’s law. In Wang et al.’s study [20], the production of hydrogen from the catalytic steam reforming of bio-oil, generated from fast pyrolysis of biomass, was investigated by using novel metal-doped catalysts of C12A7:O−/M (M = Mg, K, Ce). In Hayashi et al.’s study [21], the effect of humidity on the electrical conductivity in porous and dense ceramics of Ca12Al14O32:SixCl2+x (x = 0, 1.7, 3.4) with a mayenite structure was examined at room temperature. In Ruszak et al.’s study [22], mayenite was found to be a promising catalyst for economically appealing secondary abatement of nitrous oxide in nitric acid plants.
In Chen et al.’s study [23], C12A7:e− is directly prepared by doping aluminum powder into high-temperature sintering. The parameters of the sample vary with the aluminum powder content. The sample with a concentration of 25% aluminum powder has a maximum conductivity of 111 S/m. In the study by Yang et al. [24], carbon is doped C12A7 crystal and forms a new C12A7 derivative with good electrical conductivity. The resistance of sample is about 3 Ω m at normal temperature. The electrical characteristics are similar to semiconductors. Meanwhile, the sample has a low surface work function of lower than 3.7 eV. Therefore, it has great application prospects in optoelectronic devices.
In this study, we prepared a kind of C12A7 derivative semiconductor and explained the conductive mechanism from the perspective of crystal structure. C12A7 derivatives were prepared by high-temperature sintering method in graphite crucibles. Through X-ray diffraction (XRD) inversion analysis, the C12A7 derivative obtained in the experiment was confirmed to be C12A7:C. The conductivity of C12A7:C was measured using four-probe method. The conductivity mechanism of C12A7:C was confirmed through the analysis of its conductivity model. Then, the theoretical conductivity of C12A7:C is calculated to verify the results.
2 Experimental preparation and XRD analysis of C12A7 derivatives
C12A7 and its derivatives are usually prepared by high temperature sintering method in the laboratory. In this experiment, we use thermal arc as heating source to obtain high temperature field in sealed graphite crucible.
2.1 Experiment
The experimental device is shown in Figure 1.
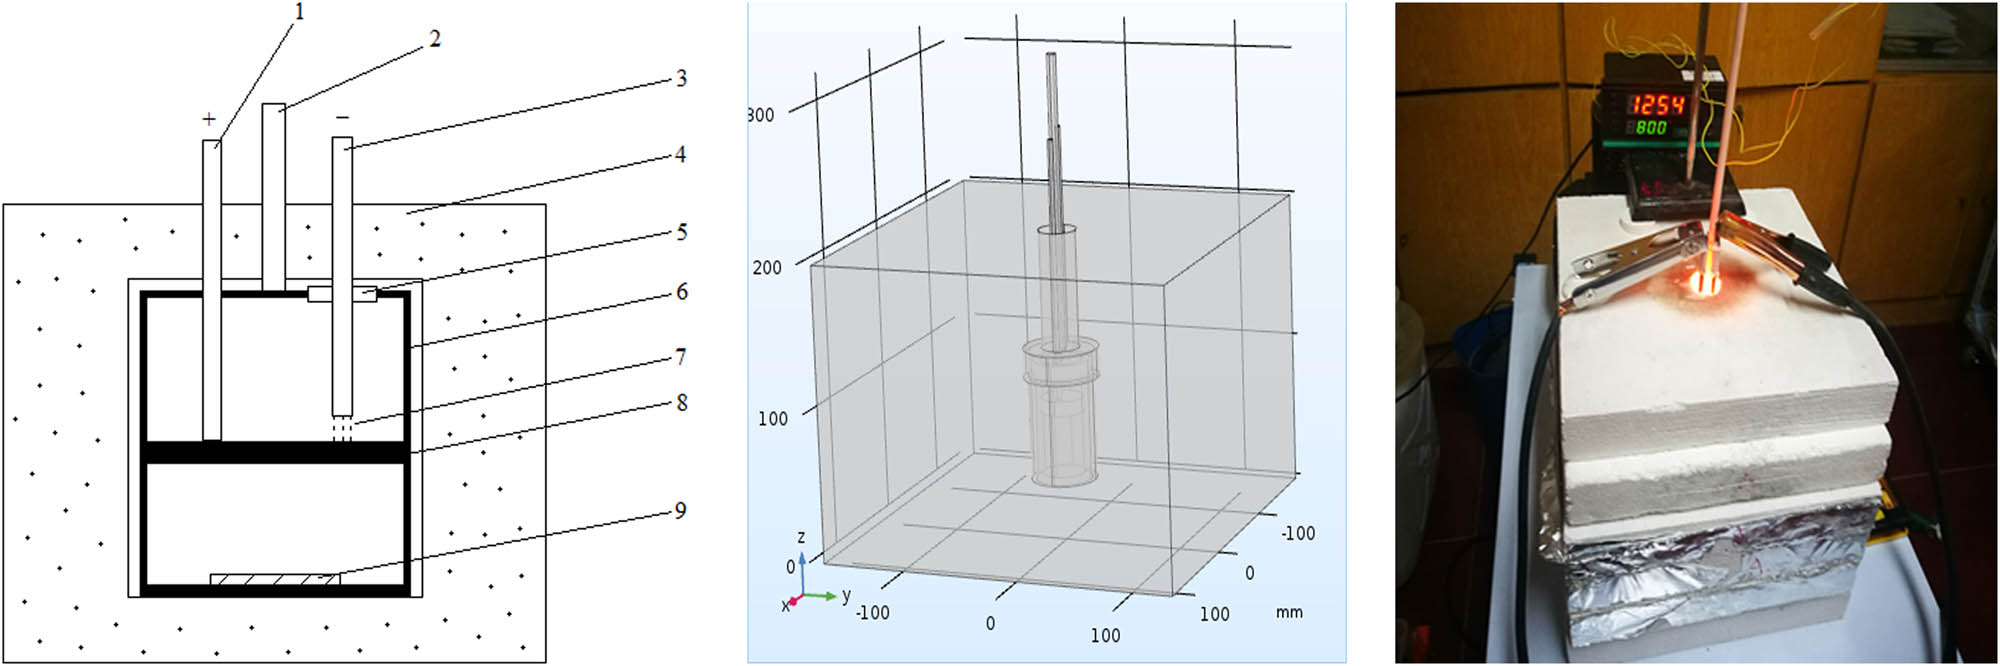
Experimental setup. (1) Tungsten electrode (+), (2) tungsten rhenium thermocouple, (3) tungsten electrode (−), (4) insulation layer, (5) insulating sealing sleeve, (6) sealed graphite crucible, (7) high temperature arc, (8) graphite partition plate, and (9) Sample.
Synthesis of C12A7:C is shown in Figure 2. Calcium carbonate and alumina powder are mixed at a mass ratio of 1:0.595 and stirred in distilled water to obtain the slurry. The slurry is brushed evenly on the surface of the molybdenum sheet and heated to 85℃ for about 20 min to remove moisture. Then, the sheet is placed in the graphite crucible and the crucible is sealed next. The sealed graphite crucible with the sample is placed in the thermal insulation material and heated by high temperature arc. The crucible temperature is monitored by tungsten rhenium thermocouple. The arc current can be changed by adjusting the power supply voltage to control the internal temperature of the graphite crucible. As the crucible reaches a high temperature of 1,750 K, the high temperature is kept for above 2 h. After heating, the device is cooled naturally to room temperature. The sample of C12A7 derivative obtained is shown in Figure 3. The surface of sample is polished carefully to remove the graphite layer and reduce the impact of surface roughness on XRD analysis.
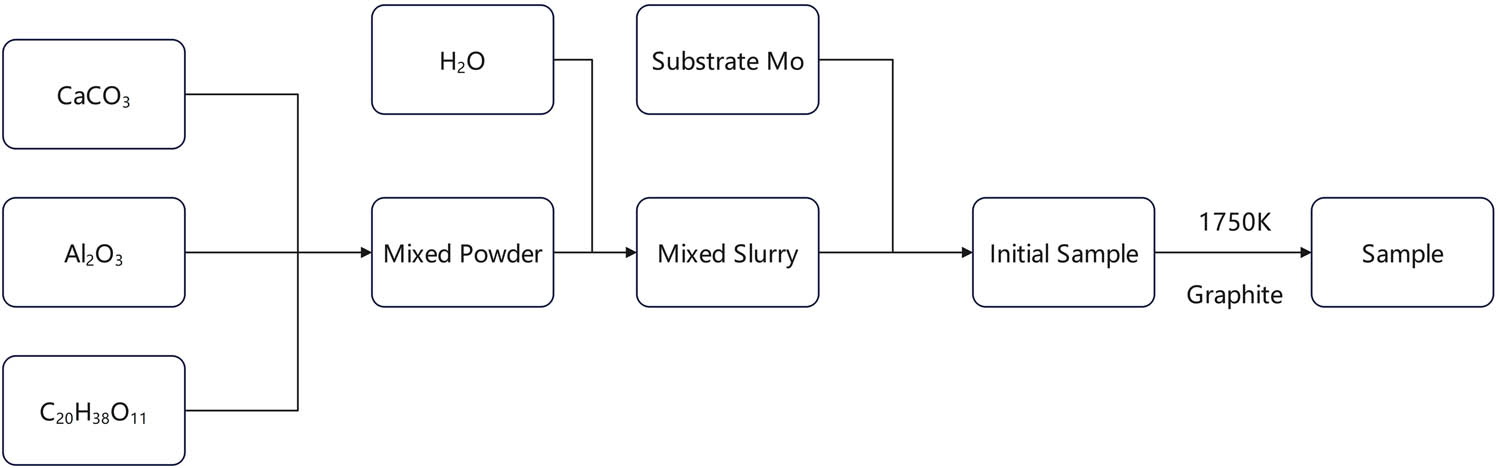
Synthesis of C12A7:C.
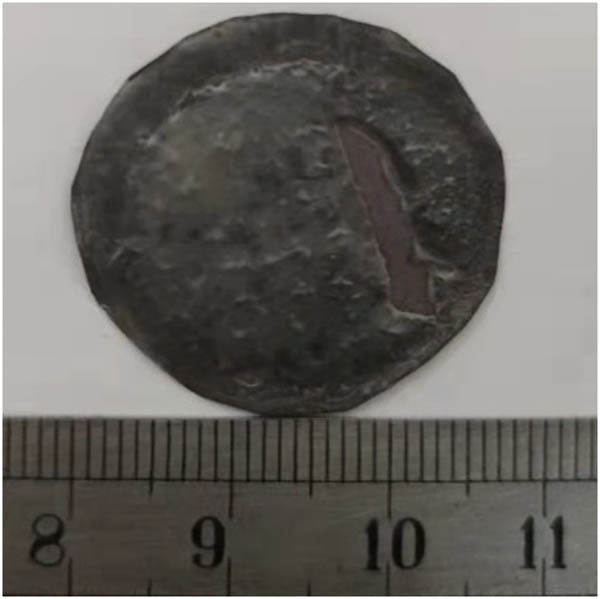
Surface photo of the sample.
2.2 XRD analysis of C12A7 derivative
The XRD result of the sample is shown in Figure 4.
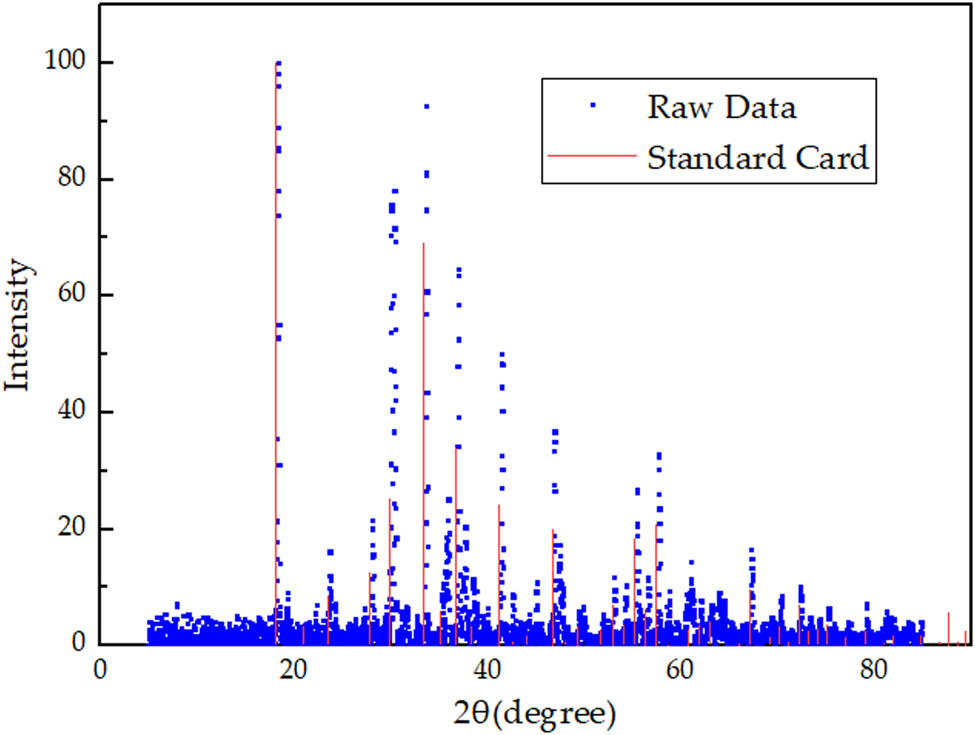
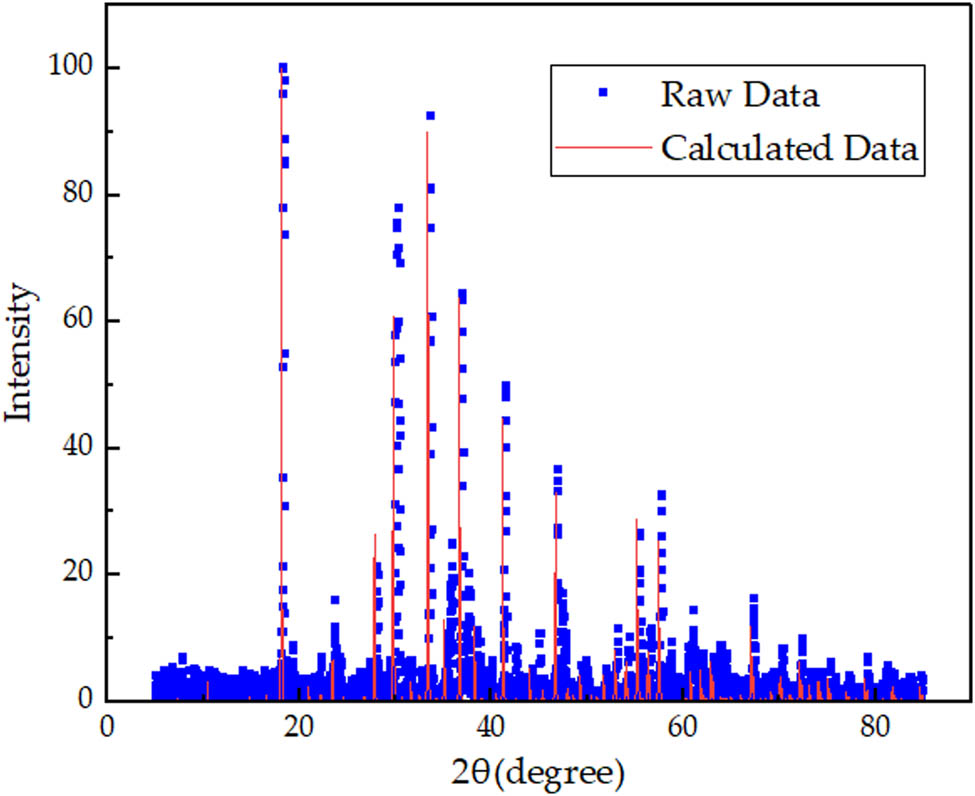
XRD pattern of sample prepared by experiment.
In Figure 4, the experimental XRD results are marked in red. The main peaks are at 2θ = 18.1°, 30.5°, 33.4°, and 36.7°. The maximum peak is at 2θ = 18.1° and the second peak is at 2θ = 33.4°. The only phase consistent with the peak position is C12A7. The standard card of C12A7 is marked in blue. It can be seen that there is a significant deviation between the peak value of experimental XRD results and C12A7 standard card. Therefore, the experimental product is a kind of C12A7 derivative. Based on the composition of reactants, the possible derivatives are C12A7:e− and C12A7:C. Meanwhile, the experimental results do not match XRD of C12A7:e− as well [21,22]. As a result, the only possible product is C12A7:C.
In order to further confirm the composition of the sample, a theoretical model of C12A7:C is established. The atom coordinates of C12A7:C are based on the C12A7 crystal model [8]. The C12A7:C model is established by adding C to replace O2− and vacancies in the crystal cage and then optimizing the structure in energy. Crystal structure of C12A7:C is shown in Figure 5. The green particles are Ca, pink particles are Al, red particles are O, and gray particles are C.
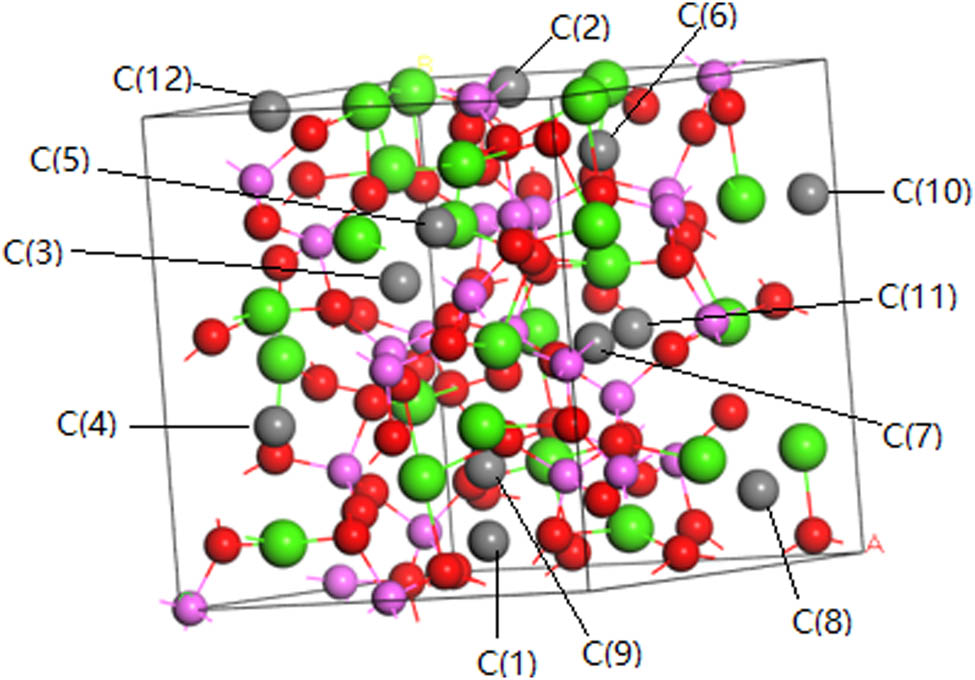
Crystal structure of C12A7:C.
The XRD theoretical inversion of the crystal structure model is carried out to obtain the theoretical XRD pattern of C12A7:C. The result is shown in Figure 6.
XRD pattern of C12A7:C theoretical model.
The XRD pattern of the sample is basically consistent with the XRD pattern of C12A7:C theoretical model in Figure 6. Comparing the experimental and theoretical calculations, their maximum peaks (relative intensity I 1 = 100) are at 2θ = 18.1°, and their second peak (I 2) is at 2θ = 33.4°. The relative intensity of the second peak is about 96. There are also similar peaks at 2θ = 30.5° and 2θ = 36.7°. Consequently, the crystal sample is determined as C12A7:C, a C12A7 derivative.
3 Measurement of C12A7:C surface conductivity
The electrical conductivity of the sample surface can be measured by four-probe method. The four-probe resistance ratio tester is shown in Figure 7.
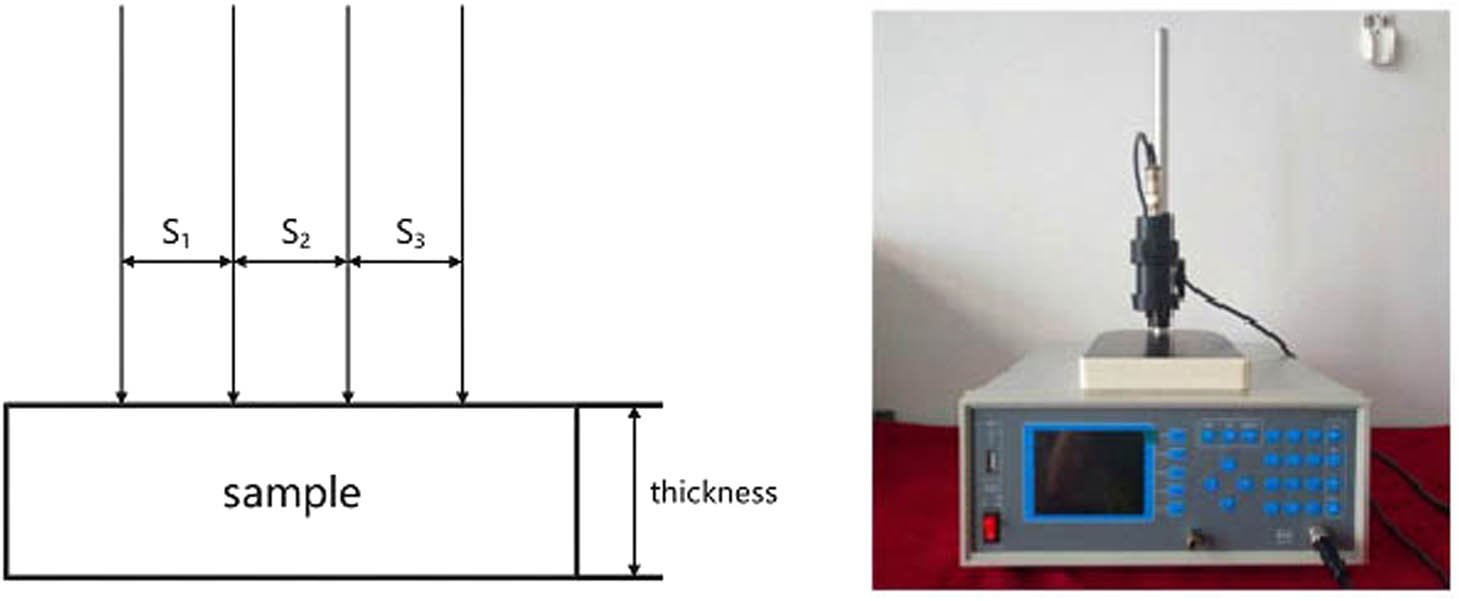
Four-probe square resistance ratio tester.
In this experiment, EC-700 coating thickness gauge is used to measure the thickness of crystal sample on the surface of molybdenum sheet. The electric conductivity of C12A7:C coating on the sample surface is measured with FT-330 four-probe square resistance tester. The distance between the four probes is 2 mm.
The thickness of the crystal coating can be obtained by the coating thickness gauge directly. The sample is put into the four-probe resistance ratio tester. The four probes are pressed to the surface of the sample slowly. Then, the electrical resistance of C12A7:C obtained in the experiment can be read from the tester.
The measuring errors of the experimental results are mainly due to the measuring error of the film thickness meter in measuring the coating thickness of the sample. Meanwhile, the surface nonuniformity of C12A7:C also causes the measurement error of the four probes. Therefore, the average thickness value is taken as the final sample thickness after several times of measurement. The measured thickness is 0.145 mm. The electrical conductivity is measured by resistivity tester in different positions of the sample surface. The average value is used as the final result. The conductivity of the sample is 4,339 S/m.
4 Electrical conductivity mechanism of C12A7:C
C12A7 is an electrical insulator, but many C12A7 derivatives have good electrical conductivity. Many research works on C12A7 derivatives speculate that the change in electrical conductivity is due to its unique crystal structure. In this experiment, C12A7:C also has good electrical conductivity by experimental measurement. In order to illustrate the mechanism of this conductive C12A7 derivative, an electron transport model of C12A7:C is developed.
4.1 Crystal electrical conduction model
In the crystal electrical conduction system, the electrical conductivity of the system at equilibrium can be expressed as [25] follows:
where ƒ 1 is the Fermi distribution function of electrode μ at equilibrium, E 1 is the corresponding Fermi energy, and G is the Green’s function.
The following equation can be used to calculate the quasi-charge flux between the system electrodes.
where T μv is the transfer function, representing the total electron transmittance between electrode μ and ν. It is an important parameter to describe the conductivity characteristics.
Transfer function T μv can be expressed as
where Γ μν is the energy of the electrode and G μν is Green’s function.
Then, the linear conductance σ can be expressed as
Formula (4) shows that the value of conductance mainly depends on the density of states (DOS) ∂ƒ/∂E and transfer function T μν .
Therefore, the analysis on DOS and transfer function of C12A7:C crystal can infer roughly the main contribution part of crystal electrical conductivity.
The common method to calculate the conductivity of crystals is to construct crystal layers with electrodes at both ends. The circuit model is constructed with three C12A7:C crystal in parallel as resistors with electrodes at both ends. Its length, width, and height dimensions are 35.94, 11.98, and 11.98 Å. The density functional theory BLYP method is used to calculate the crystal conductivity model. The calculation will obtain the electron transport process and volt ampere curve of the crystal.
The crystal electrical conduction model of C12A7:C crystal is shown in Figure 8.

Crystal electrical conduction model of C12A7:C.
4.2 Transfer function of C12A7:C crystal
Based on the crystal electrical conduction model, Dmol3 module is used to calculate the transfer function of C12A7:C. The density functional Becke exchange plus Lee Yang Parr correlation (BLYP) of generalized gradient approximation (GGA) is selected. The SCF tolerance is 1.0 × 10⁻⁴, max SCF cycles is 180 and core treatment is DFT Semi core Pseudopots.
The transfer function T μν of C12A7:C is obtained by calculation (Figure 9).
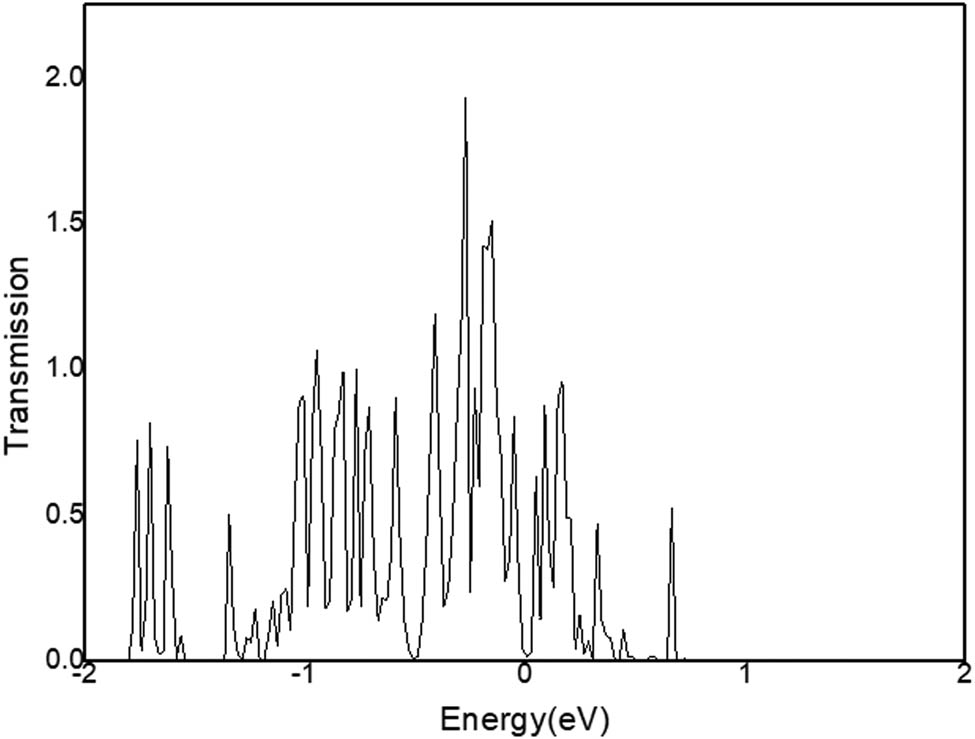
Transfer Function of C12A7:C.
In Figure 9, the transfer function T μν of C12A7:C is mainly distributed in the energy state range of −2 and 1 eV. The maximum peak of the transfer function is at −0.3 eV, and the peak value is 1.98.
4.3 DOS of C12A7:C
Another factor affecting crystal conductivity is DOS. The DOS in C12A7:C crystal is calculated by GGA-BLYP density functional equation. The energy cutoff is 700.0 eV. The SCF tolerance is 2.0 × 10⁻⁶ eV/atom. The relativity treatment is Koelling Hormon. The calculated energy band structure of C12A7:C is shown in Figure 10.
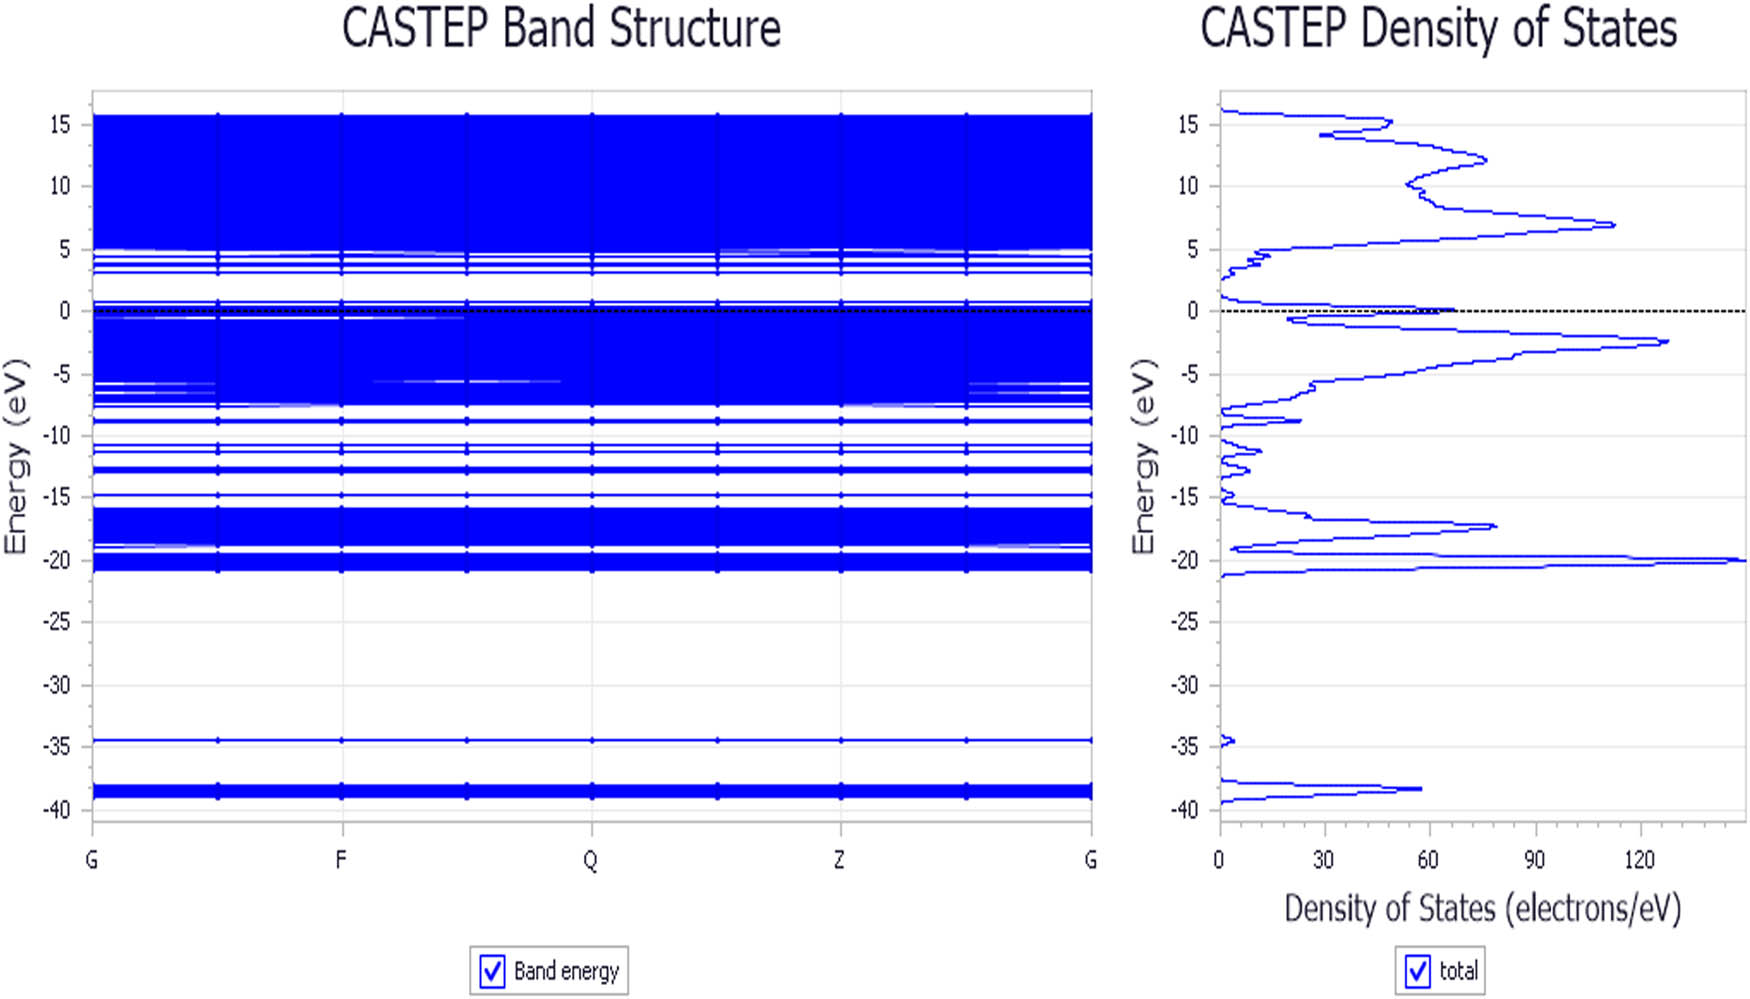
Energy band structure of C12A7:C.
It is shown in Figure 8 that the band gap of C12A7:C is 2.247 eV, and Fermi energy level of DOS is 66.5 eV.
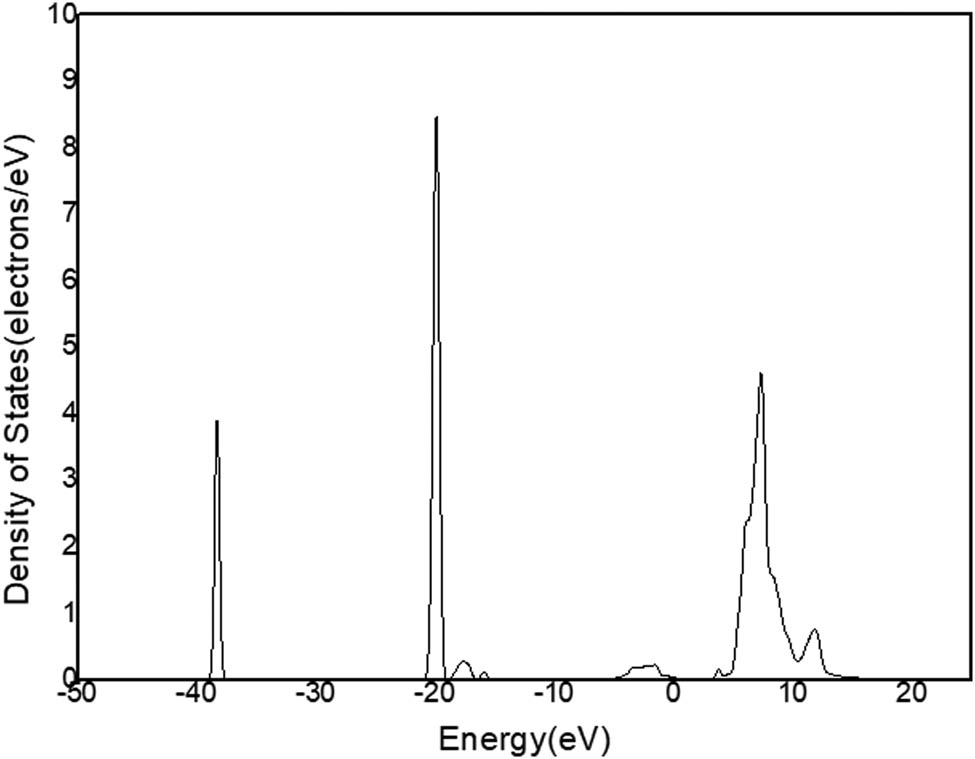
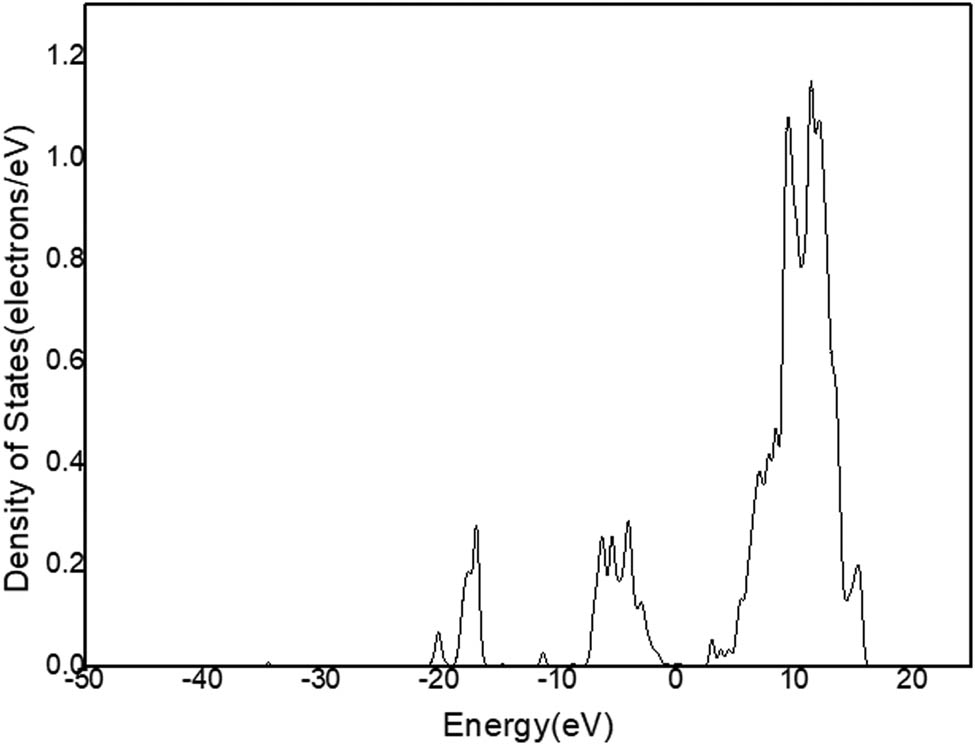
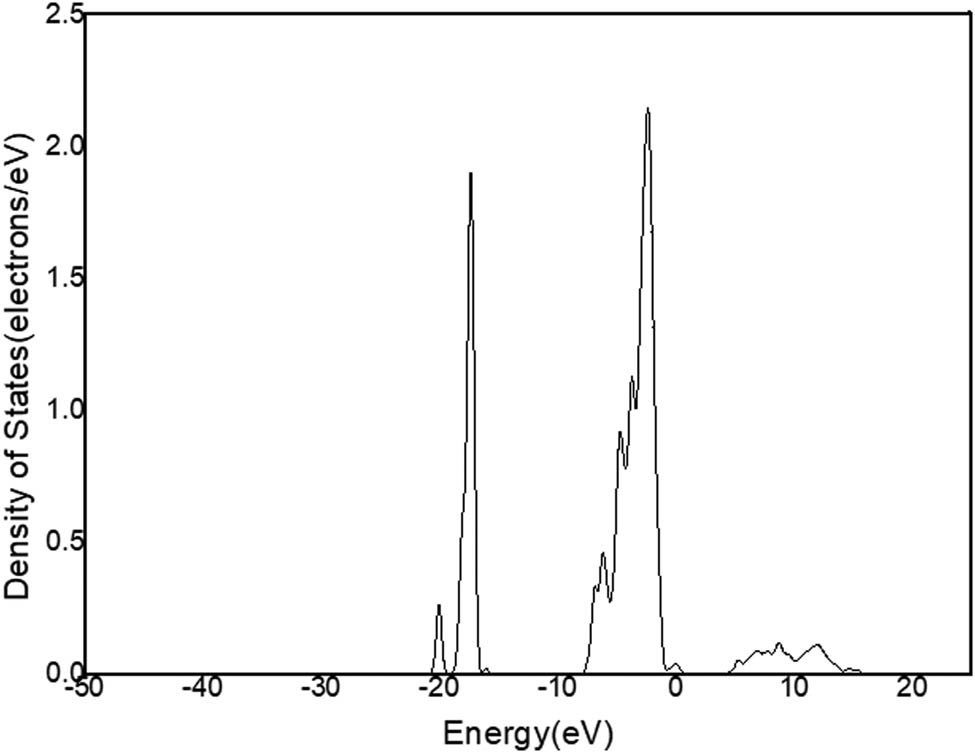
Figure 11 shows the total DOS of the crystal. Figures 12–15 show the partial density of states (PDOS) of Ca, Al, O, and C, respectively, in the crystal.
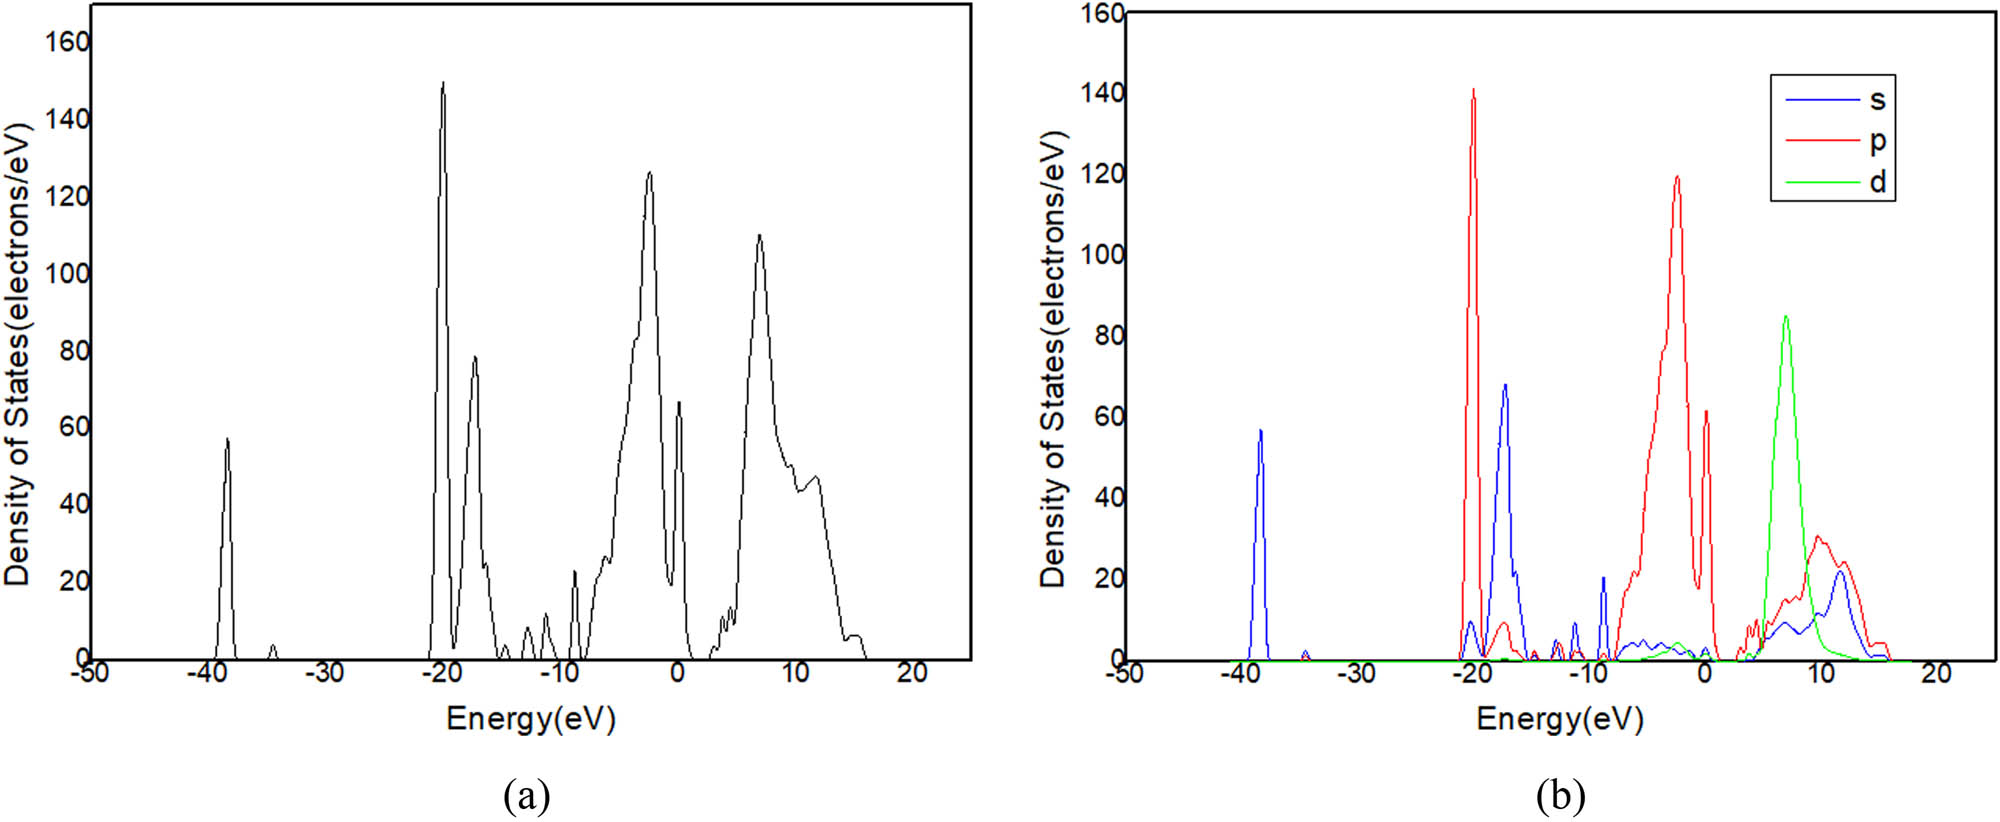
(a) DOS and (b) PDOS of C12A7:C.
DOS of Ca in C12A7:C.
DOS of Al in C12A7:C.
DOS of O in C12A7:C.
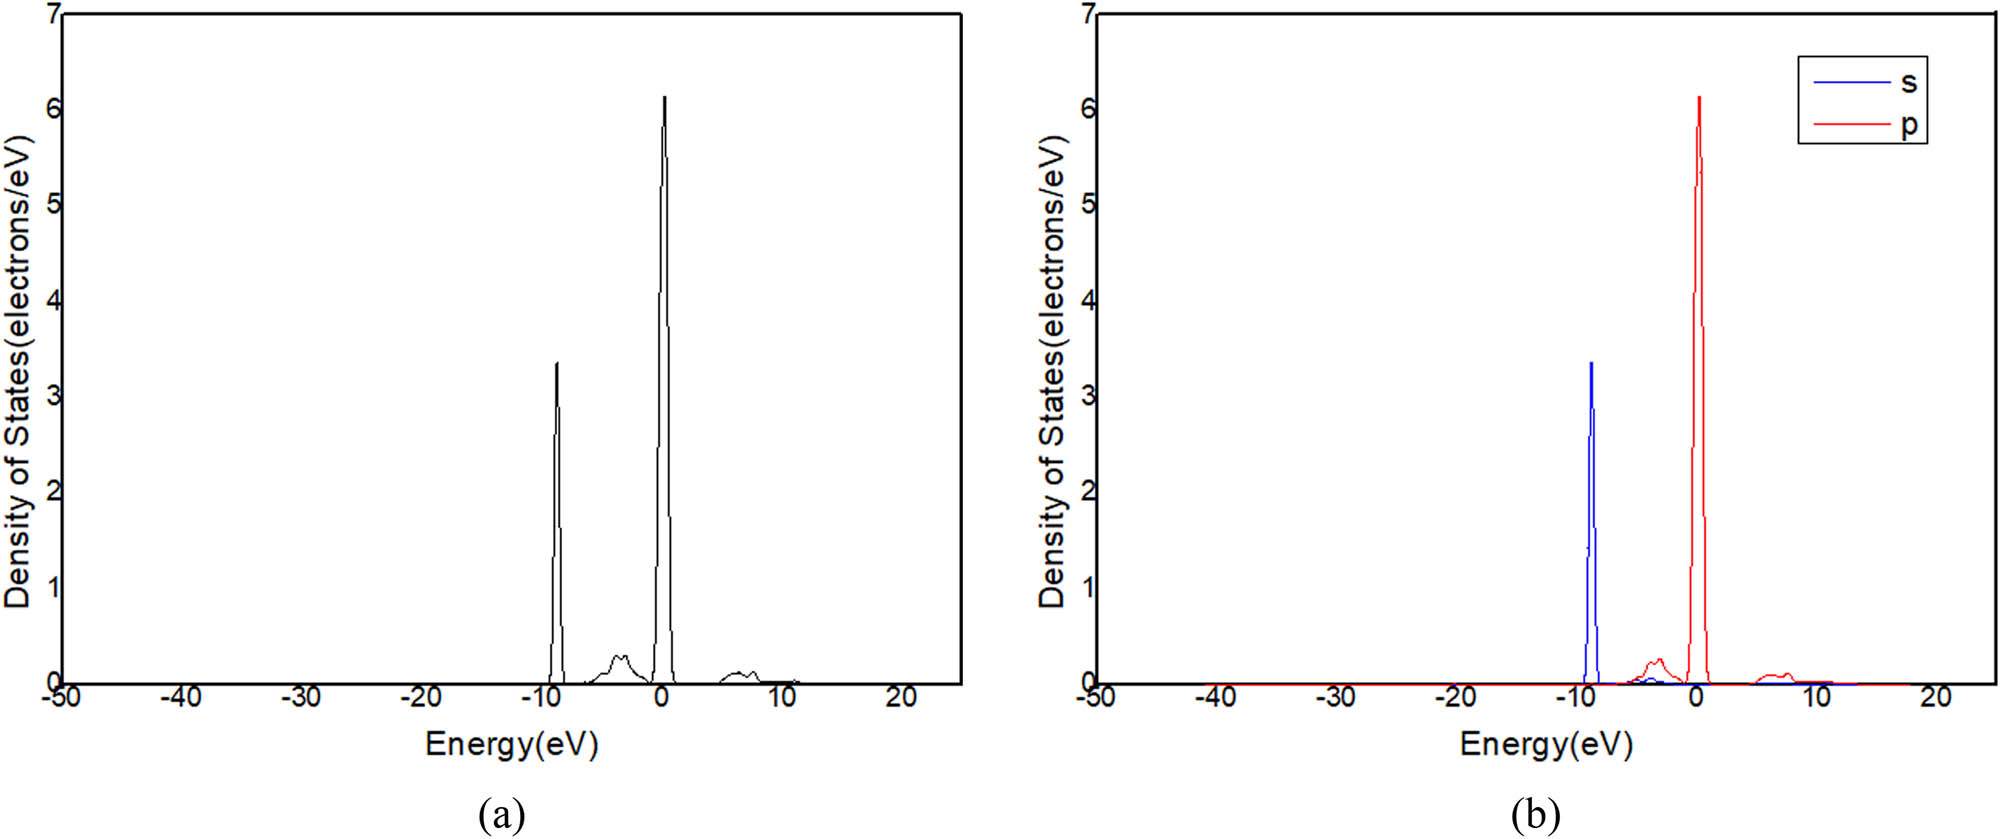
(a) DOS and (b) PDOS of C in C12A7:C.
Figure 11a shows that there is only one peak in −2 and 1 eV energy level range (Figure 9) in the state density diagram of C12A7:C. The partial DOS indicates that the peak belongs to the p-orbital electron (Figure 11b). The partial DOS of Ca (Figure 12) and the partial DOS of Al (Figure 13) in c have no peak in −2 and 1 eV energy level range. Therefore, Ca and Al in the crystal have little contribution to the crystal conduction. In Figure 14, DOS of O has an incomplete peak in −2 and 1 eV energy level range. The maximum value is 1.6. In Figure 15a, DOS of C has a complete peak in −2 and 1 eV energy level range. The peak value is 6.1. The peak value of C is larger than O. Meanwhile, considering the chemical property of O, it is excluded that O provides free electrons. Therefore, the C of C12A7:C makes a main contribution to crystal electrical conductivity.
Further analysis of PDOS of C in Figure 15b shows that the p-orbital electrons have one peak at −2 and 1 eV energy levels. This is consistent with the overall DOS of C12A7:C crystal. The s-orbital electrons have no obvious peaks in this region. Thus, the p-orbital electrons of C are determined as main contribution to the electrical conductivity of C12A7:C crystal.
4.4 Details of C12A7:C crystal conductive mechanism
To explore the specific electron transport mechanism of C in the crystal, other parameters obtained in the calculation of the DOS are summarized and analyzed, including population, bond number, and electron spin direction.
The bonding state of each atom is analyzed in the crystal. According to the bonding of non-carbon, the possibility of other atoms providing migrating electrons in the conduction can be roughly ruled out. This can further verify that C in C12A7:C has a major contribution to its conductivity. According to the bonding condition of C, the C–C bonds provide the main way to transfer electrons in the conductance. Therefore, population distribution of the theoretical model of C12A7:C (Figure 5) is calculated. The bonding population distributions of C are shown in Table 1.
Bonding population distributions of C in C12A7:C crystal
| Number of bonds | Atom | Number | Atom | Number | Population | Length (Å) |
|---|---|---|---|---|---|---|
| 1 | C | 8 | Al | 11 | −0.1 | 2.70434 |
| 2 | C | 5 | Al | 2 | 0.06 | 2.70434 |
| 3 | C | 2 | Al | 2 | 0.05 | 2.70434 |
| 4 | C | 4 | Al | 3 | 0.05 | 2.70434 |
| 5 | C | 6 | Al | 6 | 0.05 | 2.70434 |
| 6 | C | 11 | Al | 9 | 0.05 | 2.70434 |
| 7 | C | 3 | Al | 6 | 0.04 | 2.70434 |
| 8 | C | 9 | Al | 13 | 0.04 | 2.70434 |
| 9 | C | 12 | Al | 12 | 0.04 | 2.70434 |
| 10 | C | 1 | Al | 1 | 0.03 | 2.70434 |
| 11 | C | 10 | Al | 15 | 0.03 | 2.70434 |
| 12 | C | 13 | Al | 13 | 0.03 | 2.70434 |
| 13 | C | 15 | Al | 13 | 0.03 | 2.70434 |
| 14 | C | 17 | Al | 11 | 0.03 | 2.70434 |
| 15 | C | 7 | Al | 10 | 0.02 | 2.70434 |
| 16 | C | 14 | Al | 10 | 0.02 | 2.70434 |
| 17 | C | 16 | Al | 16 | 0.02 | 2.70434 |
| 18 | C | 1 | C | 12 | 2.11 | 1.13737 |
| 19 | C | 3 | C | 13 | 2.05 | 1.13737 |
| 20 | C | 7 | C | 10 | 1.52 | 1.47232 |
| 21 | C | 15 | C | 16 | 1.51 | 1.47232 |
| 22 | C | 14 | C | 17 | 1.5 | 1.47232 |
| 23 | C | 5 | Ca | 12 | 0.11 | 2.6987 |
| 24 | C | 2 | Ca | 4 | 0.1 | 2.6987 |
| 25 | C | 9 | Ca | 15 | 0.1 | 2.6987 |
| 26 | C | 4 | Ca | 7 | 0.09 | 2.6987 |
| 27 | C | 6 | Ca | 11 | 0.09 | 2.6987 |
| 28 | C | 11 | Ca | 17 | 0.09 | 2.6987 |
| 29 | C | 13 | Ca | 20 | 0.05 | 2.6987 |
| 30 | C | 3 | Ca | 2 | 0.04 | 2.6987 |
| 31 | C | 1 | Ca | 1 | 0.02 | 2.6987 |
| 32 | C | 8 | Ca | 14 | 0.02 | 2.6987 |
| 33 | C | 12 | Ca | 18 | 0.02 | 2.6987 |
| 34 | C | 7 | Ca | 16 | −0.01 | 2.6987 |
| 35 | C | 10 | Ca | 16 | −0.01 | 2.6987 |
| 36 | C | 14 | Ca | 24 | 0.01 | 2.6987 |
| 37 | C | 15 | Ca | 22 | −0.01 | 2.6987 |
| 38 | C | 16 | Ca | 22 | 0 | 2.6987 |
| 39 | C | 17 | Ca | 24 | 0 | 2.6987 |
| 40 | C | 8 | O | 17 | 0.48 | 1.13737 |
| 41 | C | 8 | O | 32 | −0.1 | 1.47232 |
| 42 | C | 8 | O | 18 | −0.09 | 2.6287 |
| 43 | C | 13 | O | 13 | −0.07 | 2.6287 |
| 44 | C | 3 | O | 45 | −0.06 | 2.6287 |
| 45 | C | 3 | O | 56 | −0.06 | 2.6475 |
| 46 | C | 10 | O | 22 | −0.06 | 2.6287 |
| 47 | C | 12 | O | 12 | −0.06 | 2.6287 |
| 48 | C | 16 | O | 4 | −0.06 | 2.6287 |
| 49 | C | 17 | O | 5 | −0.06 | 2.6287 |
| 50 | C | 1 | O | 50 | −0.05 | 2.6287 |
| 51 | C | 12 | O | 50 | −0.05 | 2.97187 |
| 52 | C | 13 | O | 45 | −0.05 | 2.97187 |
| 53 | C | 14 | O | 8 | −0.05 | 2.6287 |
| 54 | C | 4 | O | 53 | 0.04 | 2.6475 |
| 55 | C | 7 | O | 25 | −0.04 | 2.6287 |
| 56 | C | 9 | O | 20 | 0.04 | 2.6287 |
| 57 | C | 9 | O | 63 | 0.04 | 2.6475 |
| 58 | C | 13 | O | 63 | −0.04 | 2.6475 |
| 59 | C | 15 | O | 1 | −0.04 | 2.6287 |
| 60 | C | 1 | O | 9 | −0.03 | 2.97187 |
| 61 | C | 2 | O | 49 | 0.03 | 2.6287 |
| 62 | C | 3 | O | 16 | −0.03 | 2.97187 |
| 63 | C | 4 | O | 38 | 0.03 | 2.6287 |
| 64 | C | 5 | O | 33 | 0.03 | 2.6287 |
| 65 | C | 6 | O | 56 | 0.03 | 2.6475 |
| 66 | C | 7 | O | 36 | −0.03 | 2.97187 |
| 67 | C | 10 | O | 37 | −0.03 | 2.97187 |
| 68 | C | 11 | O | 59 | 0.03 | 2.6475 |
| 69 | C | 12 | O | 62 | −0.03 | 2.6475 |
| 70 | C | 14 | O | 27 | −0.03 | 2.97187 |
| 71 | C | 15 | O | 63 | −0.03 | 2.6475 |
| 72 | C | 15 | O | 30 | −0.03 | 2.97187 |
| 73 | C | 16 | O | 34 | −0.03 | 2.97187 |
| 74 | C | 17 | O | 61 | −0.03 | 2.6475 |
| 75 | C | 17 | O | 28 | −0.03 | 2.97187 |
| 76 | C | 1 | O | 51 | −0.02 | 2.6475 |
| 77 | C | 6 | O | 26 | 0.02 | 2.6287 |
| 78 | C | 7 | O | 60 | −0.02 | 2.6475 |
| 79 | C | 10 | O | 65 | −0.02 | 2.6475 |
| 80 | C | 11 | O | 15 | 0.02 | 2.6287 |
| 81 | C | 14 | O | 60 | −0.02 | 2.6475 |
| 82 | C | 16 | O | 66 | −0.02 | 2.6475 |
| 83 | C | 2 | O | 52 | 0.01 | 2.6475 |
| 84 | C | 2 | O | 10 | −0.01 | 2.97187 |
| 85 | C | 4 | O | 24 | −0.01 | 2.97187 |
| 86 | C | 5 | O | 52 | 0.01 | 2.6475 |
| 87 | C | 6 | O | 6 | 0.01 | 2.97187 |
| 88 | C | 8 | O | 61 | −0.01 | 2.6475 |
| 89 | C | 8 | O | 39 | −0.01 | 2.97187 |
| 90 | C | 9 | O | 41 | −0.01 | 2.97187 |
| 91 | C | 5 | O | 2 | 0 | 2.97187 |
| 92 | C | 11 | O | 43 | 0 | 2.97187 |
In Table 1, each bond in the crystal is classified according to the kind of bonding atoms. The first column in the table is the number of the bond, the second and fourth columns are the kind of bonding atoms, third and fifth columns are the atomic numbers. The bonds of 1–17 are C–Al bonds. 18–22 are C–C bonds. 23–39 are C–Ca. 40–92 are C–O bonds. Consequently, the possible carbon-containing bonds in C12A7:C are C–Ca, C–Al, C–O, and C–C. The population distributions of 1–17 and 23–92 bonds show that the populations of C–Ca, C–Al, and C–O in the crystal are small. Their maximum absolute value is 0.11. Therefore, there is hardly any bond about C–Ca, C–Al, and C–O bond in C12A7:C crystal.
The bonds of 18–22 numbers are C–C bonds, C1–C12, C3–C13, C7–C10, C14–C17, and C15–C16 specifically in C12A7:C crystal. The absolute values of C–C bond populations are larger than other bonds. The populations of C1–C12 and C3–C13 are 2.11 and 2.05, respectively. The populations of C7–C10, C14–C17, and C15–C16 are 1.52, 1.5, and 1.51 respectively. As a result, almost C exists in C12A7:C crystal as C–C bond.
In order to distinguish the type of C–C bond, the electron spin direction of C12A7:C is calculated using theoretical model. The results are shown in Table 2.
Spin direction of C atoms in C12A7:C crystal
| Atom | Orbital charge | |||
|---|---|---|---|---|
| S | P x | P y | P z | |
| C1 | 1.346 | 1.014 | 0.978 | 1.077 |
| C2 | 1.936 | 1.432 | 0.609 | 0.377 |
| C3 | 1.365 | 1.016 | 0.99 | 1.076 |
| C4 | 1.938 | 0.314 | 1.381 | 0.714 |
| C5 | 1.937 | 0.764 | 0.271 | 1.378 |
| C6 | 1.939 | 0.65 | 0.327 | 1.419 |
| C7 | 1.597 | 0.928 | 0.947 | 0.958 |
| C8 | 1.606 | 0.732 | 0.662 | 0.727 |
| C9 | 1.937 | 0.714 | 1.382 | 0.309 |
| C10 | 1.604 | 0.929 | 0.94 | 0.954 |
| C11 | 1.941 | 1.354 | 0.27 | 0.754 |
| C12 | 1.353 | 1.015 | 1.081 | 0.977 |
| C13 | 1.355 | 1.01 | 1.089 | 1.01 |
| C14 | 1.599 | 0.959 | 0.938 | 0.939 |
| C15 | 1.599 | 0.958 | 0.942 | 0.945 |
| C16 | 1.607 | 0.955 | 0.943 | 0.925 |
| C17 | 1.613 | 0.958 | 0.949 | 0.921 |
The charges in the three directions P x , P y , and P z of the p-orbitals of C atoms listed in Table 2 can be used to determine the spin direction of the bond formed by two C atoms. If the charge values in the three directions P x , P y , and P z of the C–C bonds are close, it can be determined that the p-orbitals of the two atoms of C–C bond have the same electron spin direction. In Table 2, the charges in spin direction of p-orbital electron P x , P y , and P z of C1 and C12 are 1.014 and 1.015; 0.978 and 1.081; and 1.077 and 0.977, respectively. These values are close. It can be concluded that the spin direction of the p-orbital electrons of C1–C12 bond are the same. Similarly, for other C–C bonds of C3–C13, C7–C10, C14–C17, and C15–C16 are also considered that the spin direction of p-orbit electron of C atoms constituting bond are same.
The C–C bond consisting of C atoms with the same p-orbital electron spin direction is called π-conjugate system. Therefore, these C–C bonds of C1–C12, C3–C13, C7–C10, C14–C17, and C15–C16 are π-conjugate systems.
As known, conjugate conduction is the common case for electric conduction of C–C bond in molecules [26,27,28,29]. This provides the conditions for the carrier of free electrons to migrate out of the region. Therefore, π-conjugate system in the molecule is the main reason for the conjugate conductive phenomenon. Considering that the electric conductivity of C12A7:C is lower than the common conjugated conductive polymer, there may be scattered π-conjugate system of C–C in C12A7:C crystal. The band gap of C12A7:C (Figure 9) is 2.247 eV. In general, the band gap of π-conjugated system is 1.5−3 eV. The band gap of C12A7:C is consistent with it. Thus, the conclusion is believable.
In brief, Ca, Al, and O contribute little to the electrical conductivity of C12A7:C crystal. The atoms C in C12A7:C crystal play a major role in the electrical conductivity. Specifically, part of C in the crystal will form C–C bonds. These C–C bonds meet the formation conditions of the π-conjugate system. When the potential is applied at both ends of the crystal, the π-conjugate system will happen conjugate conduction. This explains the mechanism of C12A7:C crystal electrical conduction.
4.5 Theoretical calculation of C12A7:C electrical conductivity
The electrical conduction model of C12A7:C crystal is shown in Figure 7. Dmol3 is used for electron transport simulation calculation of the crystal conductive model. Voltage applied at the ends of model is 5 mV. The results are shown in Figure 16.
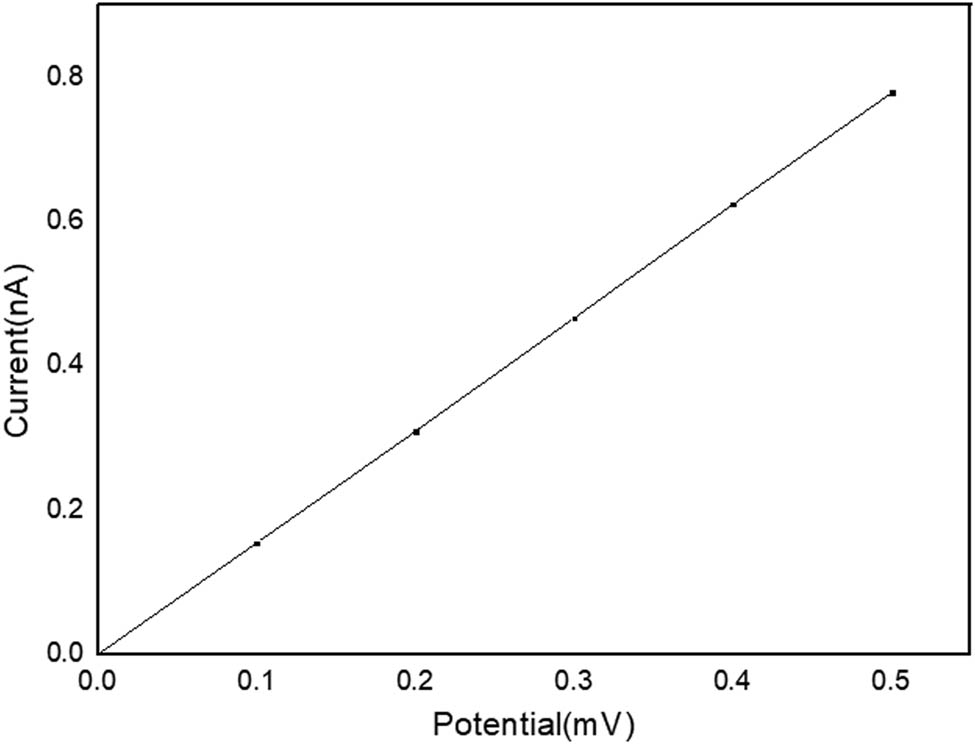
Volt–ampere characteristic curve of C12A7:C.
In Figure 16, the volt–ampere curve of C12A7:C shows an obvious linear distribution. It is entirely consistent with Ohm’s law. Therefore, C12A7:C crystal is a type of ohmic conductors at room temperature.
The electric conductivity of the crystal can be calculated by the volt-ampere curve and the formula for crystal layer size is as follows:
where A is the cross-sectional area and L is the length of the crystal layer.
In this calculation, the length of the crystal layer is 3.594 × 10⁻⁹ m. The cross-sectional area is 1.435 × 10⁻¹⁸ m2. The conductivity of C12A7:C crystals can be calculated as 3893.7 S/m based on the volt–ampere curve.
4.6 Comparison between theoretical calculation and experiment
The relative error between the theoretical conductivity 3893.7 S/m and the experimental results 4339 S/m is 10.3%. Considering the influence of lattice defects and impurity components, the result is very satisfied. The theoretical conductivity of C12A7:C 3893.7 S/m is in the typical range of semiconductor conductivity. The consistency between the experimental results and the theoretical calculation results verifies that the above theoretical calculation is quite reliable.
Many other researchers have also studied the conductivity of C12A7 derivatives. In Kimay and Hosonob’s study [8], the electrical conductivity of C12A7:e− at 300 K is ∼1,000 S/m. In Jiping et al.’s study [10], the electrical conductivity of C12A7:e− at room temperature is 1,960 S/m. In Lalan and Ganesanpotti’s study [16], the electrical conductivity of C12A7:e−@G is 1,050 S/m. In Khan et al.’s study [30], the electrical conductivity of C12A7:e− is 2,100 S/m. Overall, the electrical conductivity C12A7 derivatives are within the range of semiconductor conductivity. This is consistent with the result in this study. The conductivity of this article is slightly higher than theirs. The difference is due to the structural differences between the C12A7 derivatives. In C12A7 preparation process, different parameters will result in different derivatives with different crystal structures. In our study, the main contribution of C12A7:C crystal’s electrical conductivity comes from π-conjugate system composed of C–C. This is different from other derivatives such as C12A7:e−.
5 Conclusion
In this study, the conductive mechanism of C12A7:C is analyzed from the perspective of crystal structure. This article mainly includes the preparation of derivatives, measurement of crystal structure, measurement of crystal conductivity, and analysis of crystal conductivity mechanism. The analysis of crystal conductivity mechanism includes transfer function analysis, DOS analysis, population analysis, and theoretical calculation of crystal conductivity.
Carbon derivative of C12A7 was prepared through high-temperature arc sintering in sealed graphite crucible. The theoretical model of C12A7 crystal structure was established through atomic coordinates. The XRD results of the sample and the XRD theoretical inversion shows that the component of the sample is C12A7:C.
The crystal conductive model is established according to the crystal structure model of C12A7:C. Through the theoretical equations of crystal electric conduction, the crystal electrical conductivity mainly depends on the product of the DOS ∂ƒ/∂E and the transfer function T μν . Results of C12A7:C crystal conductive calculation show that the transfer function T μν is mainly distributed in the energy state interval (−2, 1 eV). Important parameters including DOS, population, and electron spin direction are obtained through simulation calculations of C12A7:C crystal. Based on total and partial DOS of each element in the crystal, the key atoms to the electrical conductivity of C12A7:C crystal is C. Meanwhile, Ca, Al, and O have little contribution to the electrical conductivity of C12A7:C.
The bonding population of C12A7:C crystal conductive model shows that carbon in C12A7:C crystal mainly exists in the form of C–C bonds. The electron spin direction of C in the crystal indicates that the p-orbital electron spin direction of C atoms in each C–C bond is basically the same. Therefore, the C–C bonds in C12A7:C crystals can form π-conjugated systems, leading to conjugated conductivity. In summary, the formation of C–C bonds in π-conjugated systems is the main factor in improving the conductivity of C12A7:C crystals.
The electrical conductivity of the sample is measured to be 4,339 S/m using the four-probe measurement. The volt–ampere curve of C12A7:C obtained by numerical simulation shows ohmic conductor characteristics. The electrical conductivity is calculated as 3,893 S/m. It is consistent with the experimental result. Thus, the theoretical analysis through C12A7:C crystal conductive model is reliable in this research.
In conclusion, C12A7:C is a fine semiconductor ceramic electrode material with conductivity of 4,339 S/m. The conductivity of C12A7:C crystal mainly comes from the carbon in the crystal. Carbon atoms form a π-conjugated system in the crystal cage, promoting electron transfer in C12A7:C crystal. Based on its conductivity, it has excellent application prospects in thermionic emission electrode materials. The conductivity of C12A7:C is higher than conductivity of C12A7:e− according to the comparison with other literature. It has high development prospects as a semiconductor material.
Acknowledgements
The authors are grateful for the reviewer’s valuable comments that improved the manuscript.
-
Funding information: Authors state no funding involved.
-
Author contributions: All authors have accepted responsibility for the entire content of this manuscript and consented to its submission to the journal, reviewed all the results, and approved the final version of the manuscript. CJ and FG designed the experiments. CJ, FG, and S-sY carried them out. CJ developed the model code and performed the simulations. CJ prepared the manuscript with contributions from all co-authors.
-
Conflict of interest: Authors state no conflict of interest.
-
Data availability statement: The datasets generated during and/or analyzed during the current study are available from the corresponding author on reasonable request.
References
[1] Whatmore RW, O’Hara C, Cockayne B, Jones GR, Lent B. Ca12Al14O33: A new piezoelectric material. Mater Res Bull. 1979;14:967–72. 10.1016/0025-5408(79)90060-6.Search in Google Scholar
[2] Eufinger JP, Schmidt A, Lerchb M, Janek J. Novel anion conductors–conductivity, thermodynamic stability and hydration of anion-substituted mayenite-type cage compounds C12A7:X (X = O, OH, Cl, F, CN, S, N). Phys Chem Chem Phys. 2015;17:6844–57. 10.1039/c4cp05442c.Search in Google Scholar PubMed
[3] Sun JQ, Gong L, Shen J, Lin Z, Li QX. Sol-gel preparation of porous C12A7-Cl− crystals. Acta Phys-Chim Sin. 2010;26:795–8. 10.3866/PKU.WHXB20100241.Search in Google Scholar
[4] Hayashi F, Tomota Y, Kitano M, Toda Y, Yokoyama T, Hosono H. NH2– dianion entrapped in a nanoporous 12CaO•7Al2O3 crystal by ammonothermal treatment: reaction pathways, dynamics, and chemical stability. J Am Chem Soc. 2014;136:11698–706. 10.1021/ja504185m.Search in Google Scholar PubMed
[5] Liu X, Li L, Sun H, Wen G, Wang D, Ren S, et al. NiW catalyst modified with C12A7: H- and its promotion to hydrogenation selectivity of hydrodesulfurization. Fuel. 2021;290:120037. 10. 10.1016/j.fuel.2020.120037.Search in Google Scholar
[6] Hosono H, Hayashi K, Kajihara K, Sushko PV, Shluger AL. Oxygen ion conduction in 12CaO center dot 7Al2O3:O2- conduction mechanism and possibility of O- fast conduction. Solid State Ion. 2009;180:550–5. 10.1016/j.ssi.2008.10.015.Search in Google Scholar
[7] Kim SW, Miyakawa M, Hirano M, Kohama Y, Kawaji H, Atake T, et al. Superconducting transition in electron-doped 12CaO∙7Al2O3. Mater Trans. 2008;49:1748–52. 10.2320/matertrans.MBW200717.Search in Google Scholar
[8] Kimay SW, Hosonob H. Synthesis and properties of 12CaO·7Al2O3 electride: review of single crystal and thin film growth. Philos Mag. 2012;21:2596–628. 10.1080/14786435.2012.685770.Search in Google Scholar
[9] Sushko PV, Shluger AL, Hirano M, Hosono H. From insulator to electride: a theoretical model of nanoporous oxide 12CaO·7Al2O3. J Am Chem Soc. 2007;129:942–51. 10.1021/ja066177w.Search in Google Scholar PubMed
[10] Jiping Z, Xin Z, Hongliang L, Yixin X, Hao J, Jiuxing Z. Electrical transport and electron emission properties of [Ca24Al28O64]4+:4e‒ single crystal. J Chin Ceram Soc. 2019;47:33–8. 10.14062/j.issn.0454-5648.2019.01.04.Search in Google Scholar
[11] Kim KB, Miyakawa M, Kikuchi M, Yanagi H. Photoelectron spectroscopic study of C12A7:e- and Alq3 interface: the formation of a low electron-injection barrier. J Phys Chem C. 2007;111:8403–6. 10.1021/jp072635r.Search in Google Scholar
[12] Adachia Y, Kima SW, Kamiyaa T, Hosonoa H. Bistable resistance switching in surface-oxidized C12A7:e− single-crystal. Mater Sci Eng B. 2009;161:76–9. 10.1016/j.mseb.2008.11.042.Search in Google Scholar
[13] Yanagi H, Kuroda T, Kim K, Toda Y, Kamiya T, Hosono H. Electron injection barriers between air-stable electride with low work function, C12A7:e−, and pentacene, C60 and copper phthalocyanine. J Mater Chem. 2012;22:4278–81. 10.1039/c2jm14966d.Search in Google Scholar
[14] Matsuishi S, Hosono H. Stable inorganic electride C12A7: e−: electronic properties and structure. Nihon Kessho Gakkaishi. 2007;49:171–8. 10.5940/jcrsj.49.171.Search in Google Scholar
[15] Lalan V, Ganesanpotti S. The smallest anions, induced porosity and graphene interfaces in C12A7:e− electrides: a paradigm shift in electromagnetic absorbers and shielding materials. J Mater Chem C. 2022;10:969–82. 10.1039/D1TC03762E.Search in Google Scholar
[16] Lalan V, Ganesanpotti S. The smallest anions entrapped mayenite electride@graphitic carbon core-shells reinforced with superparamagnetic Fe3O4 delivers unrivalled high-frequency microwave absorption. Chem Eng J. 2023;461:75.1–17. 10.1016/j.cej.2023.141857.Search in Google Scholar
[17] Hosono H, Hayashi K, Hirano M. Active anion manipulation for emergence of active functions in the nanoporous crystal 12CaO•7Al2O3: a case study of abundant element strategy. J Mater Sci. 2007;42:1872–83. 10.1007/s10853-006-1316-9.Search in Google Scholar
[18] Huang F, Li J, Wang L, Dong T, Tu J, Torimoto Y, et al. Features and mechanism of H- anion emission from 12 CaO.7 Al2O3 surface. J Phys Chem B. 2005;109:12032–7. 10.1021/jp050006g.Search in Google Scholar PubMed
[19] Hayashi K, Matsuishi S, Ueda N, Hirano M, Hosono H. Maximum incorporation of oxygen radicals, O- and O2-, into 12CaO·7Al2O3 with a nanoporous structure. Chem Mater. 2003;15:1851–4. 10.1021/cm020959g.Search in Google Scholar
[20] Wang Z, Pan Y, Dong T, Zhu X, Kan T, Yuan L, et al. Production of hydrogen from catalytic steam reforming of bio-oil using C12A7-O--based catalysts. Appl Catal A: Gen. 2007;320:24–34. 10.1016/j.apcata.2006.12.003.Search in Google Scholar
[21] Hayashi K, Muramatsu H, Matsuishi S, Kamiya T, Hosono H. Humidity-sensitive electrical conductivity in Ca12Al14-xSixO32Cl2+x (0 < = x < = 3.4) ceramics. Electrochem Solid-State Lett. 2009;12:11–3. 10.1149/1.3032908.Search in Google Scholar
[22] Ruszak M, Inger M, Witkowski S, Wilk M, Kotarba A, Sojka Z. Selective N2O removal from the process gas of nitric acid plants over ceramic 12CaO·7Al2O3 catalyst. Catal Lett. 2008;126:72–7. 10.1007/s10562-008-9619-x.Search in Google Scholar
[23] Chen W, Qi K, Wang X. Research of preparation and thermionic emission properties of C12A7:e−. Chin J Electron Devices. 2020;43:715–9. 10.3969/j.issn.1005-9490.2020.04.001.Search in Google Scholar
[24] Yang S, Ji C, Gu F. Investigation on electrical conductivity and surface distribution of work function of C12A7 electride. J Mater Sci: Mater Electron. 2019;30:16421–6. 10.1007/s10854-019-02016-2.Search in Google Scholar
[25] Sun J, Xu Y, Wang R, Xing L. Influences of temperature on the conductive properties of single crystal C12A7: e−. Int J Electrochem Sci. 2013;8:10122–8. 10.1016/S1452-3981(23)13098-7.Search in Google Scholar
[26] Andre J, Delhalle J, Bredas JL. Quantum approach to electrical conduction phenomena in conjugated organic polymers. Quantum Chem Aided Des Org Polym. 1991;1:163–282. 10.1142/9789814317115_0004.Search in Google Scholar
[27] Vitali P, Rahul P, Yutaka H, Eugenia M. Electrical conduction mechanism in conjugated polymers studied using Flicker noise spectroscopy. Int Soc Opt Eng. 2006;51:2656–61. 10.1016/j.electacta.2005.08.005.Search in Google Scholar
[28] H Bässler. Opto-electronic properties of conjugated polymers. Macromol Symposia. 1996;104:269–84. 10.1002/masy.19961040123.Search in Google Scholar
[29] Vukmirovic N, Wang LW. Electronic structure of disordered conjugated polymers: polythiophenes. J Phys Chem B Condens Matter Mater Surf Interfaces Biophys. 2009;113:409–15. 10.1021/jp808360y.Search in Google Scholar PubMed
[30] Khan K, Tareen AK, Aslam M, Thebo KH, Khan U, Wang R, et al. A comprehensive review on synthesis of pristine and doped inorganic room temperature stable mayenite electride, [Ca24Al28O64]4+ (e−)4 and its applications as a catalyst. Prog Solid State Chem. 2018;54:1–19. 10.1016/j.progsolidstchem.2018.12.001.Search in Google Scholar
© 2024 the author(s), published by De Gruyter
This work is licensed under the Creative Commons Attribution 4.0 International License.
Articles in the same Issue
- Regular Articles
- Research on damage evolution mechanisms under compressive and tensile tests of plain weave SiCf/SiC composites using in situ X-ray CT
- Structural optimization of trays in bolt support systems
- Continuum percolation of the realistic nonuniform ITZs in 3D polyphase concrete systems involving the aggregate shape and size differentiation
- Multiscale water diffusivity prediction of plain woven composites considering void defects
- The application of epoxy resin polymers by laser induction technologies
- Analysis of water absorption on the efficiency of bonded composite repair of aluminum alloy panels
- Experimental research on bonding mechanical performance of the interface between cementitious layers
- A study on the effect of microspheres on the freeze–thaw resistance of EPS concrete
- Influence of Ti2SnC content on arc erosion resistance in Ag–Ti2SnC composites
- Cement-based composites with ZIF-8@TiO2-coated activated carbon fiber for efficient removal of formaldehyde
- Microstructure and chloride transport of aeolian sand concrete under long-term natural immersion
- Simulation study on basic road performance and modification mechanism of red mud modified asphalt mixture
- Extraction and characterization of nano-silica particles to enhance mechanical properties of general-purpose unsaturated polyester resin
- Roles of corn starch and gellan gum in changing of unconfined compressive strength of Shanghai alluvial clay
- A review on innovative approaches to expansive soil stabilization: Focussing on EPS beads, sand, and jute
- Experimental investigation of the performances of thick CFRP, GFRP, and KFRP composite plates under ballistic impact
- Preparation and characterization of titanium gypsum artificial aggregate
- Characteristics of bulletproof plate made from silkworm cocoon waste: Hybrid silkworm cocoon waste-reinforced epoxy/UHMWPE composite
- Experimental research on influence of curing environment on mechanical properties of coal gangue cementation
- Multi-objective optimization of machining variables for wire-EDM of LM6/fly ash composite materials using grey relational analysis
- Synthesis and characterization of Ag@Ni co-axial nanocables and their fluorescent and catalytic properties
- Beneficial effect of 4% Ta addition on the corrosion mitigation of Ti–12% Zr alloy after different immersion times in 3.5% NaCl solutions
- Study on electrical conductive mechanism of mayenite derivative C12A7:C
- Fast prediction of concrete equivalent modulus based on the random aggregate model and image quadtree SBFEM
- Research on uniaxial compression performance and constitutive relationship of RBP-UHPC after high temperature
- Experimental analysis of frost resistance and failure models in engineered cementitious composites with the integration of Yellow River sand
- Influence of tin additions on the corrosion passivation of TiZrTa alloy in sodium chloride solutions
- Microstructure and finite element analysis of Mo2C-diamond/Cu composites by spark plasma sintering
- Low-velocity impact response optimization of the foam-cored sandwich panels with CFRP skins for electric aircraft fuselage skin application
- Research on the carbonation resistance and improvement technology of fully recycled aggregate concrete
- Study on the basic properties of iron tailings powder-desulfurization ash mine filling cementitious material
- Preparation and mechanical properties of the 2.5D carbon glass hybrid woven composite materials
- Improvement on interfacial properties of CuW and CuCr bimetallic materials with high-entropy alloy interlayers via infiltration method
- Investigation properties of ultra-high performance concrete incorporating pond ash
- Effects of binder paste-to-aggregate ratio and polypropylene fiber content on the performance of high-flowability steel fiber-reinforced concrete for slab/deck overlays
- Interfacial bonding characteristics of multi-walled carbon nanotube/ultralight foamed concrete
- Classification of damping properties of fabric-reinforced flat beam-like specimens by a degree of ondulation implying a mesomechanic kinematic
- Influence of mica paper surface modification on the water resistance of mica paper/organic silicone resin composites
- Impact of cooling methods on the corrosion behavior of AA6063 aluminum alloy in a chloride solution
- Wear mechanism analysis of internal chip removal drill for CFRP drilling
- Investigation on acoustic properties of metal hollow sphere A356 aluminum matrix composites
- Uniaxial compression stress–strain relationship of fully aeolian sand concrete at low temperatures
- Experimental study on the influence of aggregate morphology on concrete interfacial properties
- Intelligent sportswear design: Innovative applications based on conjugated nanomaterials
- Research on the equivalent stretching mechanical properties of Nomex honeycomb core considering the effect of resin coating
- Numerical analysis and experimental research on the vibration performance of concrete vibration table in PC components
- Assessment of mechanical and biological properties of Ti–31Nb–7.7Zr alloy for spinal surgery implant
- Theoretical research on load distribution of composite pre-tightened teeth connections embedded with soft layers
- Coupling design features of material surface treatment for ceramic products based on ResNet
- Optimizing superelastic shape-memory alloy fibers for enhancing the pullout performance in engineered cementitious composites
- Multi-scale finite element simulation of needle-punched quartz fiber reinforced composites
- Thermo-mechanical coupling behavior of needle-punched carbon/carbon composites
- Influence of composite material laying parameters on the load-carrying capacity of type IV hydrogen storage vessel
- Review Articles
- Effect of carbon nanotubes on mechanical properties of aluminum matrix composites: A review
- On in-house developed feedstock filament of polymer and polymeric composites and their recycling process – A comprehensive review
- Research progress on freeze–thaw constitutive model of concrete based on damage mechanics
- A bibliometric and content analysis of research trends in paver blocks: Mapping the scientific landscape
- Bibliometric analysis of stone column research trends: A Web of Science perspective