Fast prediction of concrete equivalent modulus based on the random aggregate model and image quadtree SBFEM
-
Wenhu Zhao
 and
Liguo Sun
and
Liguo Sun

Abstract
To evaluate the mechanical property of concrete materials rapidly, a fast prediction model of the concrete equivalent modulus is proposed based on the random aggregate model and scaled boundary finite element method (SBFEM). First, a random aggregate model of meso-concrete is employed to construct the representative volume element (RVE) according to the aggregate content, gradation, shape, etc. Second, the RVE model is transformed to be a grayscale image and stored as a digital matrix. The quadtree mesh is partitioned automatically for simulation by SBFEM. There are only six types of unique subdomains, and the hanging node does not affect the simulation accuracy. The global stiffness matrix can be assembled directly according to the six subdomain stiffness matrices. Finally, the equivalent modulus is predicted by using the numerical homogenization method. Several numerical examples are employed to verify this model, and the results are compared with that of other methods. The result indicates that the proposed model can efficiently determine the equivalent modulus. Furthermore, the effect of the aggregate gradation, shape, porosity, and pore water are studied and analysed in this work. The proposed model is potential and helpful in predicting the mechanical properties of concrete or other composite materials.
1 Introduction
Concrete is a main construction material with excellent performance, which has widely used in civil and hydraulic engineering [1,2,3]. It is an artificial composite material generated by mixing cement, sand, coarse aggregate, water, and other admixtures, followed by evenly stirring, compacting, curing, and hardening. The mechanical properties of concrete are directly related to the water/cement ratio, pores, aggregate content, and aggregate type [4,5] The traditional researches on mechanical properties of concrete mostly focus on experimental tests. The test not only provides basic parameters for numerical simulation and theoretical analysis but also offers a significant method of verification of the rationality and accuracy of theories [6,7,8]. However, it usually requires a lot of manpower and material costs to accommodate the changes in test conditions and site factors. What’s worse, with the operation of engineering structures, the germination of internal defects results in a certain degree discreteness in experimental data.
To efficiently evaluate the mechanical properties of concrete, especially including defects, it is necessary to develop the prediction model. Based on a three-phase spherical model and a hollow cylindrical rod model, the influence of porosity on the macroscopic mechanical properties of concrete has been studied and given the quantitative relationships between the porosity and the effective bulk and shear moduli [9]. The results indicate that the effect of pore-water on concrete tensile strength is significant and should not be neglected in design. On the basis of homogenization techniques and failure criteria, Greco et al. [10] proposed an innovative micro-mechanical approach to investigate the effects of micro-crack initiation and evolution on the macroscopic response of elastic periodic composite materials, where the initially undamaged inclusion and matrix interface were considered in the fibre-reinforced composite. The innovative approach with robust capability and efficiency is also helpful to study the mechanical properties of composite materials like concrete. Considering the porosity and pore size, Li et al. [11] established a micromechanical model to predict the macroscopic of concrete through two equivalent processes and discussed the influence of the elastic modulus of coarse aggregate, the coarse aggregate content, and the elastic modulus of the interfacial transition zone (ITZ) on the yield strength. In the later work, explicit formulae of porous concrete effective tensile and compressive strengths were given out and detailed the total influence coefficient of porosity and pore size [12]. As a basic mechanical index of concrete, the equivalent elastic modulus plays an important role in governing the mechanical properties and especially in terms of stiffness and deformation capacity. Many studies have been carried out to estimate the effective elastic modulus based on the theoretical and experimental analyses [13,14,15]. The influences on the effective elastic modulus also have been studied by considering the maximum aggregate size, aggregate gradation, hydration, water-to-binder ratio (w/b), coarse aggregate content, steel fibre shape, and so on.
With the development of meso-mechanics and computer technology, numerical simulation has become a popular method to study the relationship between meso-components and macroscopic mechanical properties of concrete [16,17]. When establishing the numerical model of the meso-concrete structure, the finite element method is commonly utilized with quite fine meshes to fit well with heterogeneous geometric boundaries for avoiding the appearance of the hanging nodes [18]. It greatly increases the workload of grid partition and subsequent structural numerical calculation. To avoid remeshing processes, Ammendolea et al. [19] present a novel finite element (FE) modelling approach based on the moving mesh technique to reproduce crack propagation mechanisms. The comparison results show that the proposed method has high reliability and robustness, which could represent a valid tool to simulate concrete fracture property. Recently, the scaled boundary finite element method (SBFEM) with a semi-analytical accuracy in the calculation is developed [20], which exhibits outstanding works on crack propagation modelling [21,22]. What is more, the computational domain of SBFEM only discretizes in the boundary of elements so that the method becomes more alternative for the simulation of complex heterogeneous materials due to its accuracy and low computational cost [23]. On the other hand, the quadtree is a tree data structure that starts with the initial root unit, and each unit can be divided into four subunits until all units meet the requirements [24]. When the quadtree data structure is used for the meshing, an automatic partition of the model is fulfilled and achieves a rapid transition of the junction of different mesh sizes [25]. Combining the quadtree algorithm and SBFEM, a novel approach was proposed for the mesoscopic fracture modelling of concrete [26]. There are only six types of unique node subdomains, and all the shapes are square. When assembling the overall stiffness matrix of the model, only six types of subdomain stiffness matrices are calculated and other element stiffness matrices are directly obtained by multiplying the scale factor. Because of the same features with the corner node in SBFEM, the handing node does not affect the calculation accuracy, which is flexible and robust on element meshing with irregular boundaries for composite materials like concrete to study the mechanical property of concrete with the quadtree data structure.
The aim of this article is to propose a fast prediction model for evaluating the effective modulus of 2D mesoscopic concrete based on the random aggregate model. Herein, SBFEM is employed to calculate the mesoscopic response of concrete with the quadtree data structure. First, the mesoscopic components of concrete are generated and distributed randomly by the random aggregate model. Then, the mesoscopic concrete model is transferred into a data matrix and divided in accord with the quadtree data structure to follow. Combining the advantages of image quadtree algorithm, the representative volume element (RVE) of meso-concrete is established, and the stress–strain field efficiently based on SBFEM was analysed. The equivalent modulus is predicted by using the numerical homogenization method. Finally, several numerical examples are conducted to verify the prediction model. What is more, the effects of aggregate gradation, particle shape, porosity, and pore water are analysed on the concrete equivalent modulus.
2 Construction of meso-concrete model
In general, meso-concrete is regarded as a three-phase material containing mortar, aggregate, and ITZ. The coarse aggregate of the concrete structure is the crushed stone or gravel with a convex shape. The area, equivalent radius, size distribution, and other characteristics of aggregates in the concrete specimen are analysed by using the statistic method before constructing the meso-concrete model. Herein, the 2D meso-concrete model is considered, and the shape of polygonal aggregates is generated that usually consists of two steps, namely, aggregate generating and distributing [27]. In the first step, several circles are randomly generated with different quantities and sizes according to the descending order of aggregate sizes. The size of each circle approximates the size of the corresponding gradation aggregate. An original triangle is drawn by connecting three random points located in the trisection arc of the circle. The triangle is then extended to be polygon by governing the thresholds of the size of the longest edge and the total area of the polygon. Finally, that polygon is regarded as the polygon aggregate, and the detailed generation process is shown in Figure 1.

Generation of random polygonal aggregate.
In the governing of the edge size, a maximum threshold l max is employed, and the aggregate will extend from this edge when the value is larger than the threshold (l i > l max). The new vertex is obtained randomly in the semicircular area according to the current longest edge l(x i , x i−1), as shown in Figure 2, and the coordinate vector x p is given as follows:
where
x
i
and
x
i+1 denote the two vertices coordinate vector of the longest edge, γ is a random value between 0 and 1,

Generation of vertex x p.
To ensure the particle sizes of generated aggregates belong to the region of the aggregate gradation, statistics on the particle size of the generated aggregate is performed according to the geometric method. First, each edge of the aggregate is selected as the baseline and the vertical line is drawn from each vertex to the edge. The corresponding length of each vertical line is then calculated and sorted. Finally, the minimum value of all maximum lengths is the particle size of the aggregate, which means that the minimum threshold of the sieve pore can successfully get through for classifying aggregate gradation. For example, orthogonal lines from each vertex to edge i and i + 1 are drawn, and each maximum value max i and max i+1 is sorted out, as shown in Figure 3. If max i > max i+1, then the aggregate can get through the sieve pore along the edge i + 1 and the size of the sieve pore is max i+1. Thus, the particle size D of the aggregate is the minimum value of all maximum lengths, which is expressed as follows:

Identifying method of aggregate particle size.
In the second step, the obtained aggregate is randomly distributed over the model based on the Monte Carlo method. The distribution process also adheres to the descending order of aggregate sizes. An inspection of the mutual overlap between any two aggregates is performed to verify the aggregate distribution. To increase efficiency, the inspection is divided into coarse and fine strategies. A minimal rectangle is employed to envelop the aggregate by using the minimum and maximum values of aggregate coordinates in the coarse strategy. If any two rectangles do not overlap with each other, the aggregate distribution proceeds. Otherwise, the vertex will be tracked to check the location. If the vertex located in another aggregate or the aggregate overlaps with another one, the new aggregate will be rotated by a random angle around its centroid up to 360 degree and the vertex locations are tracked and checked again. The aggregate would be discarded unless a certain angle is obtained to make the aggregate not overlap any other aggregate. The coordinate of vertex after rotating is expressed as follows:
where
3 Numerical model for meso-concrete
3.1 Image quadtree mesh
Quadtree data structure is a hierarchical data structure that recursively divides each parent data into four child data. Quadtree mesh can quickly complete the element transition at the junction of different material areas, and the divided elements are all squares with high quality, as shown in Figure 4. The original square is the root element, and each square is divided into four equivalent squares by the quadtree mesh algorithm until the square size reaches the threshold. Handing nodes are inevitably generated during the mesh partition and hence it is hard to combine the finite element method for simulation [28]. Fortunately, the handing node is common with the corner node in the SBFEM element, and only six types of unique subdomains may occur in the numerical model by implementing the 2:1 rule during the quadtree meshing, as shown in Figure 5. These subdomain stiffness matrices can be precalculated and stored for fast data invocation.

Hanging nodes in quadtree mesh.

Unique subdomains when implemented 2:1 rule.
Before the quadtree mesh partition, the element size and pixel threshold of the image model are set first. The numbers in the pixel matrix range are 0–255, where 1 represents black colour and 255 represents white colour, respectively. The larger the number, the lighter the colour. Different colours represent different materials. The meso-concrete model is then transformed to be a grayscale image and stored as a digital matrix, as shown in Figure 6. The white colour is the aggregate and the black colour is the mortar. Taking a local region as example, the element size is set as one pixel and the grey colour denotes the ITZ. The transformation process is shown in Figure 6. During the quadtree mesh partition, the digital matrix is divided into four square subdomains in the first step, as shown in Figure 7(a). Then a check is carried out to the difference value between any two adjacent pixels in each subdomain. If the difference value is larger than the threshold value, the subdomain will be divided into four smaller square subdomains again. This process is repeated until the difference value in each element meets the pixel threshold and the quadtree mesh is shown in Figure 7(b). Finally, a further partition is implemented to ensure that the size ratio of adjacent subdomains is not greater than 2:1, namely, the balanced quadtree mesh [29]. The dividing step of the quadtree meshes of the meso-concrete model is shown in Figure 7.

Transformation process of meso-concrete to pixel matrix model. (a) Meso-concrete RVE model. (b) Local region with mortar, aggregate and ITZ. (c) Pixel image of the local region. (d) Pixel matrix model.

Dividing steps of quadtree meshes with 2:1 rule. (a) Digital matrix divided into four square. (b) Quadtree mesh satisfying the pixel threshold. (c) Final balanced quadtree meshes of local region. (d) Overall quadtree meshes of meso-concrete model.
3.2 SBFEM formulation
When conducting the numerical simulation of the meso-concrete, the quadtree meshing algorithm is employed to divide the model automatically and each square element with uncertain hanging nodes is modelled as scaled boundary finite element (SBFE) subdomain. The SBFEM is a radially analytical numerical method, which was first proposed by Wolf and Song [30]. In the SBFE subdomain, polygon edges with any number of nodes can be used as conventional line elements so that the hanging node does not affect the solution accuracy. As shown in Figure 8, the so-called scaling centre O places in the geometric centre of the quadtree SBFE subdomain, and only boundaries are discretized as line elements. Herein, the SBFE subdomain contains four corner nodes and two handing nodes, where the handing node divides the corresponding edge. There are six line elements in this subdomain, and the handing nodes are called as regular nodes in the scaled boundary coordinates (ξ, η).

SBFE subdomain with local coordinates (ξ, η).
In each SBFE subdomain, any point (x, y) in the line element can be described as follows:
where ( x b , y b ) is the nodal coordinate vectors in Cartesian coordinate, b denotes the number of line elements, N (η) is the shape function of the line element, ξ is the dimensionless radial coordinate pointing from the scaling centre (ξ = 0) to the boundary (ξ = 1), and η is the local coordinate in the circumferential direction along each line element. The whole area is covered by scaling the line elements on the boundary, which is shown by the dot-dashed line (ξ < 1) in Figure 8.
It is noted that only two-node line element is employed in the quadtree SBFE subdomain so that the vectors can be described directly by the two-node coordinates of the line element on the boundary with x b = [x i , x i+1] and y b = [y i , y i+1]. With the coordinate transformation to the scaled boundary coordinate, the displacements at the point inside the subdomain are formed as follows:
where
The static SBFEM equilibrium in displacement can be derived by applying the principle of virtual work.
where
Equation (6) is the Euler–Cauchy equation, which can be transformed into a first-order differential equation.
where
The Hamiltonian matrix
where c is the integral constant vector, S 11 is the positive real part of the eigenvalue vector of the modes, and Ψ 11 and Ψ 21 denote the displacement and force modes, respectively. The stiffness matrix of each S element is defined as follows:
For the elastic problem, the stiffness matrices of all S elements are assembled to form the global stiffness matrix, which are similar to the static stiffness matrices in FEM [31].
4 Prediction scheme of concrete equivalent modulus
A three-step analysis scheme is proposed to predict the equivalent modulus rapidly. First, the RVE of the meso-concrete model is constructed according to the aggregate content, gradation, and shape. Aggregates are randomly extended and distributed by using the randomized algorithm, which is detailed in Section 2. The square RVE model is exported as a grayscale image. Second, the grayscale image containing different colour is stored as a digital matrix and divided into quadtree meshes with 2:1 rule. SBFEM is then employed to analyse the stress–strain field with the static uniform compressive load. Finally, the numerical homogenization method is employed to evaluate the equivalent modulus. During the simulation, the average stress and average strain of RVE of meso-concrete are calculated as follows:
where
5 Numerical examples
5.1 Verification of equivalent modulus
To verify the proposed prediction model, several groups of meso-concrete RVE are generated with polygonal aggregates. Each group contains three numerical specimens, and the specimen size is 450 mm × 450 mm. Aggregates are generated and classified into three aggregate gradations according to the Fuller gradation curve and the aggregate standard [32]. The sizes of the three gradations are in ranges of 10–25, 25–40, and 40–50 mm, respectively, where the particle size of each aggregate is calculated using Equation (2). The aggregate contents are set to be 20, 30, 40, 50, 60, and 70%. The typical RVE models are shown in Figure 9. Concrete is generally simulated as a three-phase composite material, and the ITZ thickness is determined by the cement particle size. ITZ thickness is quite small, and the value is approximately between 30 and 80 μm [33]. For the sake of simplicity, only aggregate and mortar matrices are considered in this meso-concrete numerical model. The grayscale image of the meso-concrete model is set to be 1,024 pixel × 1,024 pixel and one pixel denote 0.44 mm. The white colour represents the aggregate with E = 7.0 × 10¹⁰ Pa and v = 0.16. The black colour is the mortar matrix with E = 3.0 × 10¹⁰ Pa and v = 0.2. The model is partitioned by the image quadtree algorithm for the SBFEM analysis, and the minimum element size is 1 pixel. A static uniform compressive load is imposed on the top edge of the model and the bottom edge is restrained by several rollers, where the value is 1.0 × 10⁶ N/m.

Typical RVE models with contents of 20, 40, and 60%. (a) 20% aggregate content. (b) 30% aggregate content. (c) 40% aggregate content.
The quadtree mesh of the concrete RVE model with 30% aggregate content is shown in Figure 10(a). Mesh partition and all subsequent calculations are completed on a desktop PC configured with Intel(R) Core(TM) i7-8700 CPU @ 3.20 GHz and 64 GB memory. The total number of SBFE subdomains is 87670, and the mesh partition process only takes 0.21 s. Due to implementing the 2:1 rule, only six unique SBFE subdomain stiffness matrices are calculated, and hence, the calculation cost is quite low, wherein the static solution for simulating the concrete RVE with 30% aggregate content takes 5.02 s. The displacement in the direction of the compressive load and normal stress contour plots are, respectively, shown in Figure 10(b) and (c).
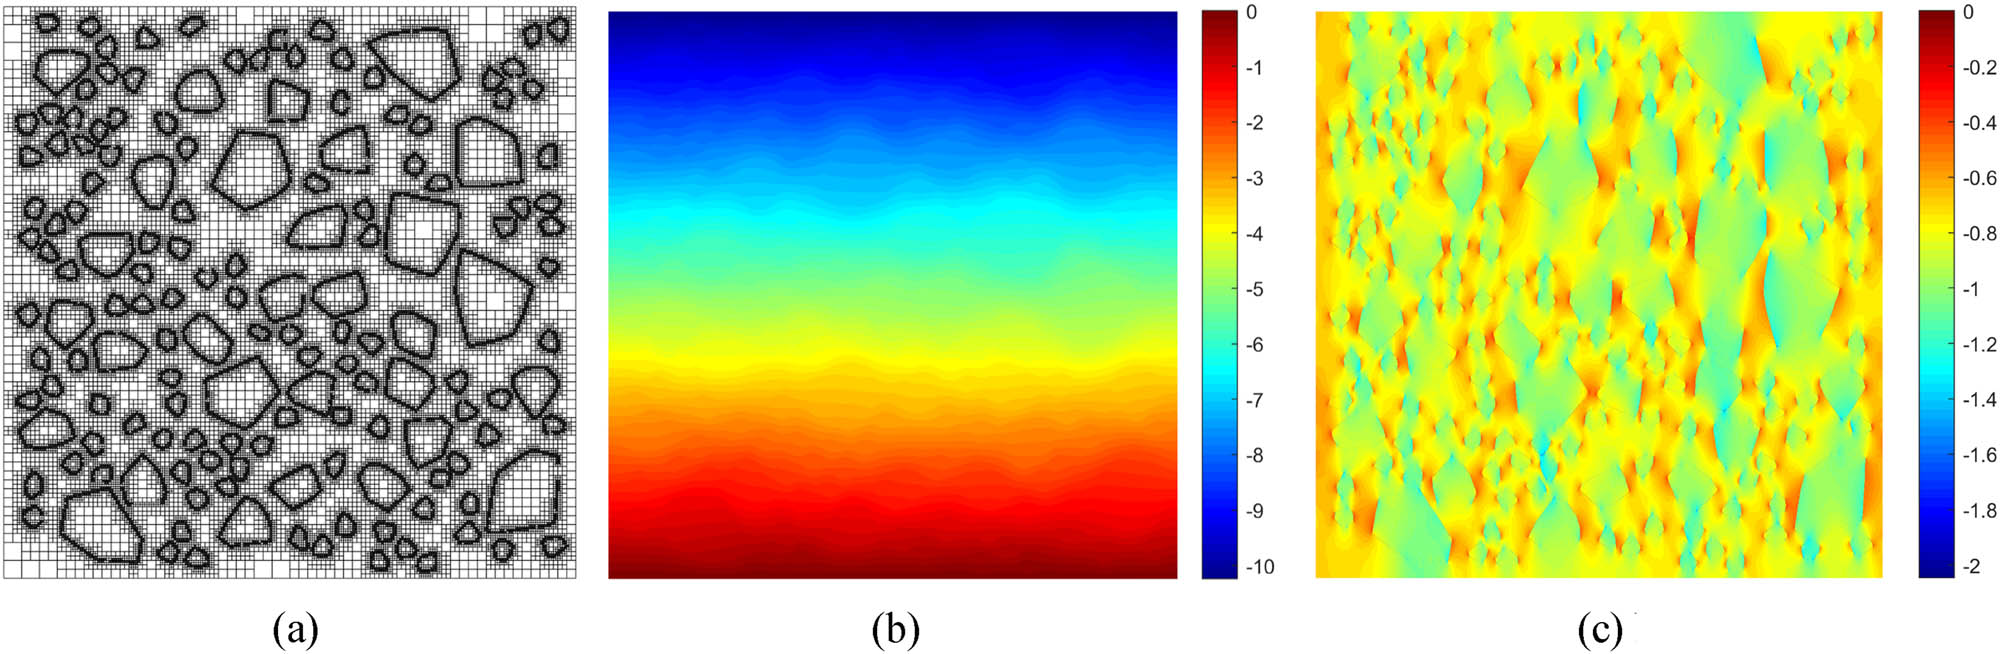
Quadtree mesh, displacement, and stress contour plots of concrete RVE with 30% aggregate content. (a) Quadtree meshes. (b) Displacement contour in vertical direction/μm. (c) Normal stress contour in vertical direction/MPa.
Based on the numerical results of concrete RVE, the average values of stress

Comparison of equivalent elastic modulus under different methods.

Relative error of equivalent elastic modulus compared with other methods.

Variation of bulk modulus and shear modulus with aggregate content.
5.2 Effect of aggregate gradation and shape
To reveal the effect of aggregate gradation and shape on the equivalent modulus, the meso-concrete RVE models with 50% polygonal and circular aggregates are considered under different gradation compositions. Taking the aggregate content to be 50%, the aggregates are classified into four gradations according to the particle size, wherein the sizes are in ranges of 10–25, 25–40, 40–50, and 50–63 mm [32]. If the concrete aggregates consist of two smaller gradations, the gradation composition aggregate is called to be two-graded aggregate. Herein, two-, three-, and fully-graded aggregates are designed to construct the meso-concrete RVE model. The automatic analyses are then carried out by using the image quadtree algorithm and SBFEM. The predicted values of the equivalent elastic modulus are detailed in Table 1.
Comparison of aggregate gradation and shape on equivalent elastic modulus of concrete
| Aggregate gradation | Average equivalent elastic modulus (GPa) | |
|---|---|---|
| Polygonal aggregate | Circular aggregate | |
| Secondary graded | 44.4327 | 44.2659 |
| Tertiary graded | 44.3799 | 44.1961 |
| Fully graded | 44.3691 | 44.2151 |
Under the same aggregate content, the equivalent elastic modulus of concrete with polygonal aggregates is slightly larger than the one of concrete with circular aggregates. The main reason is that polygonal aggregate with sharp corners often leads to stress concentration, so that the calculated results are magnified by using the stress–strain field based on the numerical homogenization method. In addition, the irregular shape of polygonal aggregates increases the variability due to the rotation, which induces a larger standard deviation on the equivalent elastic modulus. The maximum value of the standard deviation for the polygonal aggregate model is 11.75%, and the value tends to be smaller with the increasing aggregate gradation, as shown in Figure 14. The discontinuous aggregate gradation plays the same role as polygonal aggregates, which induces a “stress concentration” in the whole domain, so that the predicted results present the same overestimate on the equivalent modulus. On the other hand, the standard deviation for the circular aggregate model tends to be larger with the increasing aggregate gradation, and the minimum value is 5.83%. It is concluded that aggregates with smoother aggregate gradation distribution form more compact concrete, which causes a slighter effect on the prediction of concrete equivalent modulus. If the aggregate composition is consistent with a quite ideal aggregate gradation, the effect of gradation would be zero and the standard deviation is a constant, which may be induced by the random distribution of aggregates.

Standard deviation of equivalent elastic modulus for different aggregate shape and gradation.
5.3 Effect of porosity and pore water
Due to the presence of defects like pores and microcracks, concrete material is inevitably permeated by water. The pore water pressure is imposed on the pore wall and the performance of concrete deteriorates steadily, especially under dynamic loading. To study the impact of porosity and pore water on the equivalent modulus of concrete, the moduli of the mortar matrix need to be reduced considering the volume fraction of the pores or pore water. The effective bulk and shear moduli are given based on the three-phase spherical model in the work of Jin et al. [9]. The reduction values of the Young’s modulus and Poisson’s ratio of the mortar matrix are calculated by the relationship with the bulk and shear moduli. Taking the random aggregate model of the fully graded concrete with 50% aggregate content as example, the equivalent modulus of dry and saturated concrete is calculated, and the variation curves of the equivalent elastic modulus are analysed with respect to the mortar matrix porosity from 0 to 30%. The equivalent elastic modulus decreases with the increasing porosity as shown in Figure 15(a). The decreasing values are divided by the elastic modulus value of nonporous concrete, and the relative reduction rates are calculated and shown in Figure 15(b). When the porosity of the concrete is 25%, the relative reduction rates on the equivalent elastic modulus are 7.13 and 5.78% for the dry concrete and saturated concrete, respectively. The pore water plays a positive role to restrain concrete from deteriorating the compression performance in a certain degree, and the positive impact becomes larger as the porosity increases.
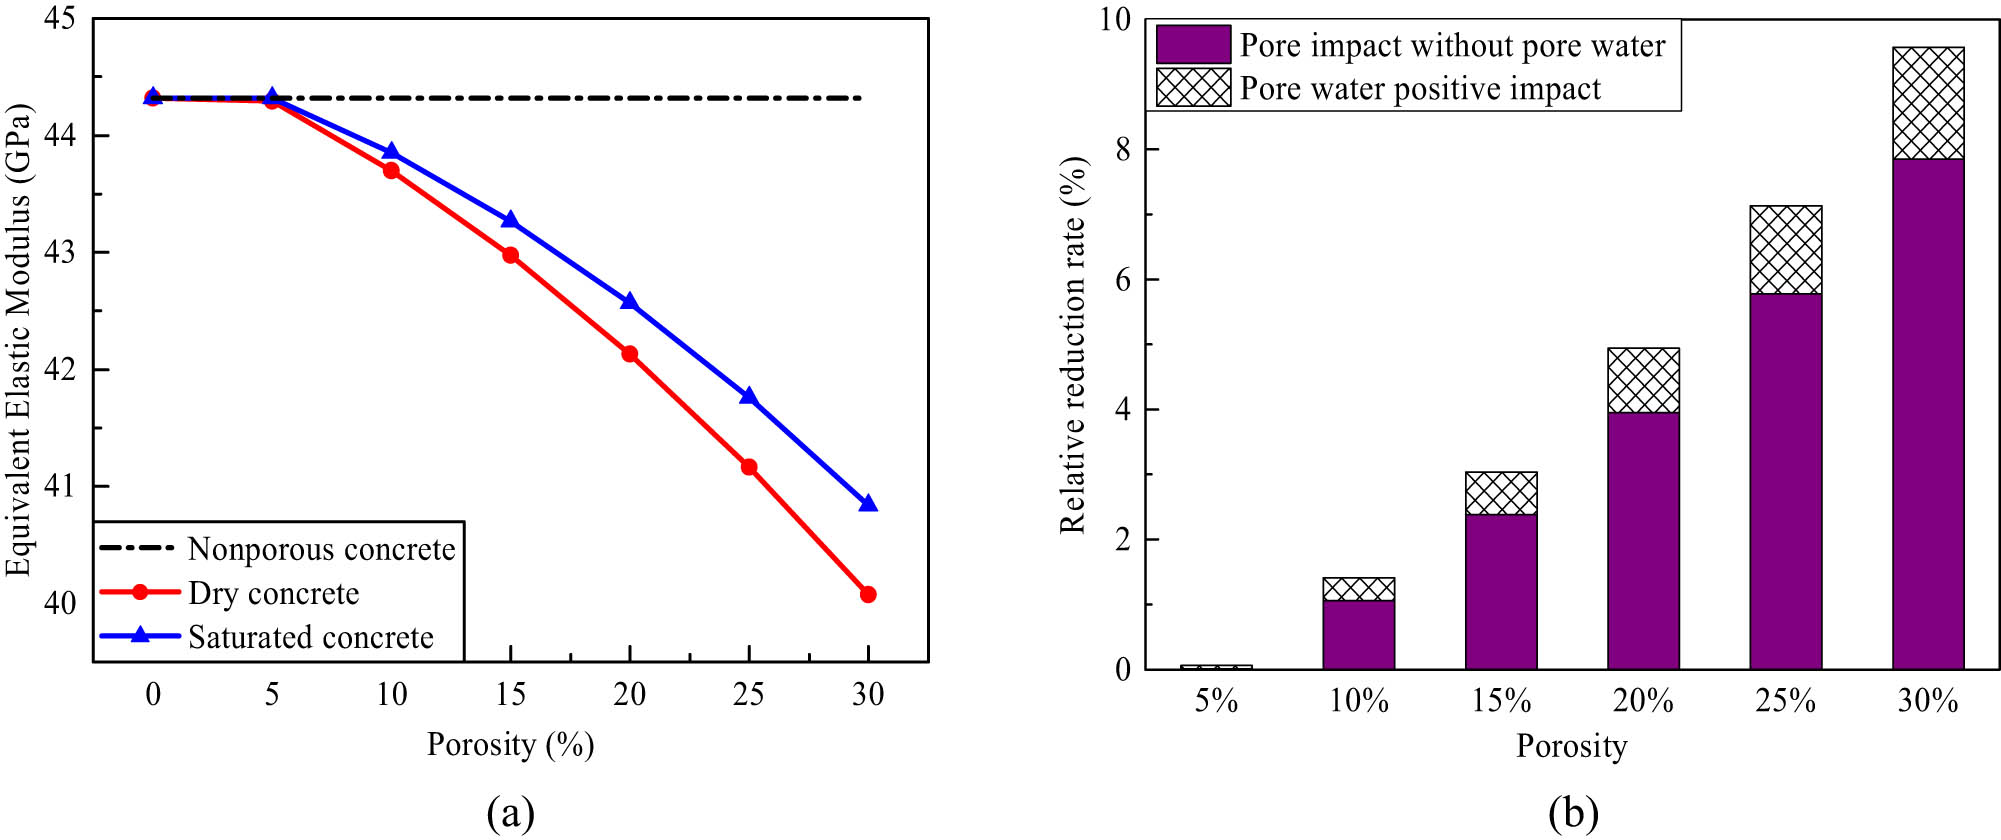
Variations on equivalent elastic modulus of concrete with porosity and pore water. (a) Comparison with dry and saturated concrete. (b) Relative reduction rate.
6 Conclusions
Combining the random aggregate model of meso-concrete and the quadtree SBFEM, a fast prediction scheme is proposed for determining the equivalent modulus based on the numerical homogenization method. Several numerical examples are studied to verify the predicted results, and the comparison with other methods is analysed with different aggregate contents. Furthermore, the effects of the aggregate gradation, shape, porosity, and pore water are studied in our work. The simulation results indicate the potential of the proposed model for predicting the equivalent modulus of concrete, and the model is also applicable to other composite materials. The conclusions can be drawn as follows:
The prediction model consists of a random aggregate model, the image quadtree method, and SBFEM. The equivalent modulus of concrete can be determined fast according to the aggregate content, gradation, shape, porosity, and pore water. The predicted results agree well with the values of the Mori–Tanaka method, and the maximum relative error is only 1.20%.
In the process of solving the equivalent modulus of concrete, the 2:1 rule of quadtree mesh partition is adopted, so there are only six unique subdomains in the whole calculation. Consequently, the overall stiffness matrix required for the solution can be assembled directly with the element stiffness matrix of these six modes. This approach significantly reduces the calculation work of the stiffness matrix, resulting in lower costs and greater automation.
The discontinuous aggregate gradation plays the same role as polygonal aggregates, which induces a “stress concentration” in the whole domain, so that the predicted results present the same overestimate on the equivalent modulus. Smoother aggregate gradation distribution forms more compact concrete, which causes a slighter effect on the prediction of concrete equivalent modulus. The effect of gradation would be zero with the aggregate fitting with a quite ideal aggregate gradation.
The porosity of concrete deteriorates the mechanic compression performance, while the pore water plays a positive role to restrain concrete from deteriorating to a certain degree and the positive impact becomes larger as the porosity increases. Therefore, the saturated concrete is recommended in pressure-bearing structures rather than dry concrete.
Acknowledgments
The authors are very thankful for Jiangxi s double thousand plan talents project (No. jxsq2023101086) and College students innovative entrepreneurial training plan program of Nanchang University (2023CX023Z).
-
Funding information: This research was funded by the National Natural Science Foundation of China (Nos. 52109152 and 12202179) and the Jiangxi Provincial Natural Science Foundation (No. 20232BAB214086).
-
Author contributions: All authors have accepted responsibility for the entire content of this manuscript and consented to its submission to the journal, reviewed all the results and approved the final version of the manuscript. WZ: conceptualization, methodology, and writing-original draft. CF: writing – review and validation. PZ: review and editing, support, and supervision. LS: support and validation.
-
Conflict of interest: Authors state no conflict of interest.
-
Data availability statement: The data that support the findings of this study are available from the corresponding author upon reasonable request.
References
[1] Singh N, Kumar P, Goyal P. Reviewing the behaviour of high volume fly ash based self compacting concrete. J Build Eng. 2019;26:100882.10.1016/j.jobe.2019.100882Search in Google Scholar
[2] Bessaid M, Matallah M, Rouissat B. A poromechanical-damage-based-model for water-driven fracture modelling of concrete gravity dams. Int J Numer Anal Methods Geomech. 2022;46(3):469–85.10.1002/nag.3308Search in Google Scholar
[3] Chen DH, Yang ZH, Wang M, Xie JH. Seismic performance and failure modes of the Jin’anqiao concrete gravity dam based on incremental dynamic analysis. Eng Fail Anal. 2019;100:227–44.10.1016/j.engfailanal.2019.02.018Search in Google Scholar
[4] Fang X, Wang C, Li H, Wang X, Zhang S, Luo X, et al. Influence of mesoscopic pore characteristics on the splitting-tensile strength of cellular concrete through deep-learning based image segmentation. Constr Build Mater. 2022;315:125335.10.1016/j.conbuildmat.2021.125335Search in Google Scholar
[5] Ince R, Cetin S. Effect of grading type of aggregate on fracture parameters of concrete. Mag Concr Res. 2019;71(16):860–8.10.1680/jmacr.18.00095Search in Google Scholar
[6] Zhao W, Du C, Sun L, Chen X. Experimental study on fracture behaviour of concrete after low-cycle reciprocating loading. Constr Build Mater. 2021;276(7):122190.10.1016/j.conbuildmat.2020.122190Search in Google Scholar
[7] Dilbas H, Çakır Ö, Yıldırım H. An experimental investigation on fracture parameters of recycled aggregate concrete with optimized ball milling method. Constr Build Mater. 2020;252:119118.10.1016/j.conbuildmat.2020.119118Search in Google Scholar
[8] Zhao W, Wang R. Experimental study on the influence of high-frequency vibratory mixing on concrete performance. Sci Eng Compos Mater. 2023;1:20220199.10.2139/ssrn.4225757Search in Google Scholar
[9] Jin L, Du X, Ma G. Macroscopic effective moduli and tensile strength of saturated concrete. Cem Concr Res. 2012;42:1590–600.10.1016/j.cemconres.2012.09.012Search in Google Scholar
[10] Greco F, Leonetti L, Nevone BP. Non-linear macroscopic response of fiber-reinforced composite materials due to initiation and propagation of interface cracks. Eng Fract Mech. 2012;80:92–113.10.1016/j.engfracmech.2011.10.003Search in Google Scholar
[11] Li D, Li Z, Lv C, Zhang G, Yin Y. A predictive model of the effective tensile and compressive strengths of concrete considering porosity and pore size. Constr Build Mater. 2018;170:520–6.10.1016/j.conbuildmat.2018.03.028Search in Google Scholar
[12] Li D, Li Z, Yin Y, Du X, Zhang G. Prediction of cracking, yield and ultimate strengths based on theconcrete three-phase micromechanics model. Constr Build Mater. 2018;193:416–25.10.1016/j.conbuildmat.2018.10.164Search in Google Scholar
[13] Li G, Zhao Y, Pang SS, Li Y. Effective Young’s modulus estimation of concrete. Cem Concr Res. 1999;29(9):1455–62.10.1016/S0008-8846(99)00119-2Search in Google Scholar
[14] Ouyang X, Shi C, Wu Z, Li K, Shan B, Shi J. Experimental investigation and prediction of elastic modulus of ultra-high performance concrete (UHPC) based on its composition. Cem Concr Res. 2020;138:106241.10.1016/j.cemconres.2020.106241Search in Google Scholar
[15] Wang J, Jivkov AP, Li QM, Engelberg DL. Experimental and numerical investigation of mortar and ITZ parameters in meso-scale models of concrete. Theor Appl Fract Mech. 2020;109:102722.10.1016/j.tafmec.2020.102722Search in Google Scholar
[16] Sanahuja J, Dormieux L, Chanvillard G. Modelling elasticity of a hydrating cement paste. Cem Concr Res. 2007;37(10):1427–39.10.1016/j.cemconres.2007.07.003Search in Google Scholar
[17] Yang H, Zhu E, Liu L. Analysis of the effect of pore structure on the mechanical properties of concrete based on the meso numerical model. Appl Sci. 2022;12(11):5428.10.3390/app12115428Search in Google Scholar
[18] Dunant CF, Bary B, Giorla AB, Péniguel C, Sanahuja J, Toulemonde C, et al. A critical comparison of several numerical methods for computing effective properties of highly heterogeneous materials. Adv Eng Softw. 2013;58(4):1–12.10.1016/j.advengsoft.2012.12.002Search in Google Scholar
[19] Ammendolea D, Greco F, Lonetti P, Luciano R, Pascuzzo A. Crack propagation modeling in functionally graded materials using moving mesh technique and interaction integral approach. Compos Struct. 2021;269:114005.10.1016/j.compstruct.2021.114005Search in Google Scholar
[20] Ooi ET, Natarajan S, Song C, Ooi EH. Crack propagation modelling in concreteusing the scaled boundary finite element method with hybrid polygon-quadtree meshes. Int J Fract. 2017;203:135–57.10.1007/s10704-016-0136-4Search in Google Scholar
[21] Zhang P, Du C, Zhao W, Sun L. Dynamic crack face contact and propagation simulation based on the scaled boundary finite element method. Computer Methods Appl Mech Eng. 2021;385:114044.10.1016/j.cma.2021.114044Search in Google Scholar
[22] Du C, Huang W, Ghaemian M, Jiang S, Zhao Z. New nonlocal multiscale damage model for modelling damage and cracking in quasi-brittle materials. Eng Fract Mech. 2022;277:108927.10.1016/j.engfracmech.2022.108927Search in Google Scholar
[23] Tian X, Birk C, Du C, Ooi ET. Automatic micro-scale modelling and evaluation of effective properties of highly porous ceramic matrix materials using the scaled boundary finite element method. Computer Methods Appl Mech Eng. 2024;419:116596.10.1016/j.cma.2023.116596Search in Google Scholar
[24] Samet H. The quadtree and related hierarchical data structures. ACM Comput Surv. 1984;16(2):187–260.10.1145/356924.356930Search in Google Scholar
[25] Chen X, Luo T, Ooi ET, Ooi EH, Song C. A quadtree-polygon-based scaled boundary finite element method for crack propagation modelling in functionally graded materials. Theor Appl Fract Mech. 2018;94:120–33.10.1016/j.tafmec.2018.01.008Search in Google Scholar
[26] Jiang S, Sun L, Ooi ET, Ghaemian M, Du C. Automatic mesoscopic fracture modelling of concrete based on enriched SBFEM space and quad-tree mesh. Constr Build Mater. 2022;350:128890.10.1016/j.conbuildmat.2022.128890Search in Google Scholar
[27] Du C, Sun L. Numerical simulation of aggregate shapes of two-dimensional concrete and its application. J Aerosp Eng. 2007;20(3):172–8.10.1061/(ASCE)0893-1321(2007)20:3(172)Search in Google Scholar
[28] Ooi ET, Man H, Natarajan S, Song C. Adaptation of quadtree meshes in the scaled boundary finite element method for crack propagation modelling. Eng Fract Mech. 2015;144:101–17.10.1016/j.engfracmech.2015.06.083Search in Google Scholar
[29] Guo H, Ooi ET, Saputra AA, Yang Z, Natarajan S, Ooi EH, Song C. A quadtree-polygon-based scaled boundary finite element method for image-based mesoscale fracture modelling in concrete. Eng Fract Mech. 2019;211:420–41.10.1016/j.engfracmech.2019.02.021Search in Google Scholar
[30] Wolf J, Song C. The scaled boundary finite-element method-a fundamental solution-less boundary element method. Computer Methods Appl Mech Eng. 2001;190:5551–68.10.1016/S0045-7825(01)00183-9Search in Google Scholar
[31] Song C, Ooi E, Natarajan S. A review of the scaled boundary finite element method for two-dimensional linear elastic fracture mechanics. Eng Fract Mech. 2018;187:45–73.10.1016/j.engfracmech.2017.10.016Search in Google Scholar
[32] GB/T 14685-2022, Pebble and crushed stone for construction, State administration for market regulation and standardization administration, China; 2022.Search in Google Scholar
[33] Du X, Jin L, Zhang R, Li Y. Effect of cracks on concrete diffusivity: A meso-scale numerical study. Ocean Eng. 2015;108:539–51.10.1016/j.oceaneng.2015.08.054Search in Google Scholar
[34] Christensen D, Bonaquist R. Improved hirsch model for estimating the modulus of hot mix asphalt. Asph Paving Technol. 2015;84:527–62.10.1080/14680629.2015.1077635Search in Google Scholar
© 2024 the author(s), published by De Gruyter
This work is licensed under the Creative Commons Attribution 4.0 International License.
Articles in the same Issue
- Regular Articles
- Research on damage evolution mechanisms under compressive and tensile tests of plain weave SiCf/SiC composites using in situ X-ray CT
- Structural optimization of trays in bolt support systems
- Continuum percolation of the realistic nonuniform ITZs in 3D polyphase concrete systems involving the aggregate shape and size differentiation
- Multiscale water diffusivity prediction of plain woven composites considering void defects
- The application of epoxy resin polymers by laser induction technologies
- Analysis of water absorption on the efficiency of bonded composite repair of aluminum alloy panels
- Experimental research on bonding mechanical performance of the interface between cementitious layers
- A study on the effect of microspheres on the freeze–thaw resistance of EPS concrete
- Influence of Ti2SnC content on arc erosion resistance in Ag–Ti2SnC composites
- Cement-based composites with ZIF-8@TiO2-coated activated carbon fiber for efficient removal of formaldehyde
- Microstructure and chloride transport of aeolian sand concrete under long-term natural immersion
- Simulation study on basic road performance and modification mechanism of red mud modified asphalt mixture
- Extraction and characterization of nano-silica particles to enhance mechanical properties of general-purpose unsaturated polyester resin
- Roles of corn starch and gellan gum in changing of unconfined compressive strength of Shanghai alluvial clay
- A review on innovative approaches to expansive soil stabilization: Focussing on EPS beads, sand, and jute
- Experimental investigation of the performances of thick CFRP, GFRP, and KFRP composite plates under ballistic impact
- Preparation and characterization of titanium gypsum artificial aggregate
- Characteristics of bulletproof plate made from silkworm cocoon waste: Hybrid silkworm cocoon waste-reinforced epoxy/UHMWPE composite
- Experimental research on influence of curing environment on mechanical properties of coal gangue cementation
- Multi-objective optimization of machining variables for wire-EDM of LM6/fly ash composite materials using grey relational analysis
- Synthesis and characterization of Ag@Ni co-axial nanocables and their fluorescent and catalytic properties
- Beneficial effect of 4% Ta addition on the corrosion mitigation of Ti–12% Zr alloy after different immersion times in 3.5% NaCl solutions
- Study on electrical conductive mechanism of mayenite derivative C12A7:C
- Fast prediction of concrete equivalent modulus based on the random aggregate model and image quadtree SBFEM
- Research on uniaxial compression performance and constitutive relationship of RBP-UHPC after high temperature
- Experimental analysis of frost resistance and failure models in engineered cementitious composites with the integration of Yellow River sand
- Influence of tin additions on the corrosion passivation of TiZrTa alloy in sodium chloride solutions
- Microstructure and finite element analysis of Mo2C-diamond/Cu composites by spark plasma sintering
- Low-velocity impact response optimization of the foam-cored sandwich panels with CFRP skins for electric aircraft fuselage skin application
- Research on the carbonation resistance and improvement technology of fully recycled aggregate concrete
- Study on the basic properties of iron tailings powder-desulfurization ash mine filling cementitious material
- Preparation and mechanical properties of the 2.5D carbon glass hybrid woven composite materials
- Improvement on interfacial properties of CuW and CuCr bimetallic materials with high-entropy alloy interlayers via infiltration method
- Investigation properties of ultra-high performance concrete incorporating pond ash
- Effects of binder paste-to-aggregate ratio and polypropylene fiber content on the performance of high-flowability steel fiber-reinforced concrete for slab/deck overlays
- Interfacial bonding characteristics of multi-walled carbon nanotube/ultralight foamed concrete
- Classification of damping properties of fabric-reinforced flat beam-like specimens by a degree of ondulation implying a mesomechanic kinematic
- Influence of mica paper surface modification on the water resistance of mica paper/organic silicone resin composites
- Impact of cooling methods on the corrosion behavior of AA6063 aluminum alloy in a chloride solution
- Wear mechanism analysis of internal chip removal drill for CFRP drilling
- Investigation on acoustic properties of metal hollow sphere A356 aluminum matrix composites
- Uniaxial compression stress–strain relationship of fully aeolian sand concrete at low temperatures
- Experimental study on the influence of aggregate morphology on concrete interfacial properties
- Intelligent sportswear design: Innovative applications based on conjugated nanomaterials
- Research on the equivalent stretching mechanical properties of Nomex honeycomb core considering the effect of resin coating
- Numerical analysis and experimental research on the vibration performance of concrete vibration table in PC components
- Assessment of mechanical and biological properties of Ti–31Nb–7.7Zr alloy for spinal surgery implant
- Theoretical research on load distribution of composite pre-tightened teeth connections embedded with soft layers
- Coupling design features of material surface treatment for ceramic products based on ResNet
- Optimizing superelastic shape-memory alloy fibers for enhancing the pullout performance in engineered cementitious composites
- Multi-scale finite element simulation of needle-punched quartz fiber reinforced composites
- Thermo-mechanical coupling behavior of needle-punched carbon/carbon composites
- Influence of composite material laying parameters on the load-carrying capacity of type IV hydrogen storage vessel
- Review Articles
- Effect of carbon nanotubes on mechanical properties of aluminum matrix composites: A review
- On in-house developed feedstock filament of polymer and polymeric composites and their recycling process – A comprehensive review
- Research progress on freeze–thaw constitutive model of concrete based on damage mechanics
- A bibliometric and content analysis of research trends in paver blocks: Mapping the scientific landscape
- Bibliometric analysis of stone column research trends: A Web of Science perspective