Structural optimization of trays in bolt support systems
-
Cunfei Wang


Abstract
Fiber reinforced polymer (FRP) have the advantages of high strength, corrosion resistance, and low density, which are widely used to serve as tray products in bolt support systems. As a key component, the low mechanical load-bearing capacity of trays significantly limits their widespread application. Besides, there is no corresponding theoretical calculations and strength analysis methods for the structural design. The aim of this study is to optimize the tray structure and improve its load-bearing capacity. Through theoretical calculations and finite element numerical analysis, the effect of inner surface taper and stiffener height on the load-bearing capacity of the tray under the application of constant axial force is investigated. The results show that first of all, the larger the inner surface taper is, the better the load capacity of the tray. Second, the special-shaped truncated cone type displayed better load capacity than the stiffener tray. Third, the higher the design height of the stiffener is, the smaller the deformation and shear stress on the top of the inner surface of the tray, and better load capacity is achieved. We believe that this study provides theoretical guidance for the structural design of high-performance FRP trays.
1 Introduction
Compared with traditional support systems, the bolt support technology can effectively reduce the input and transportation of support materials and material cost. Besides, its support principle is in line with the modern rock mechanics and containment theory, belonging to an “active” support [1,2]. The bolt, after installation, reinforces the surrounding rock, which facilitates forming a whole bearing structure. This can utilize the stability of the rock and give full play to its bearing capacity [3]. Thus, the bolt support is an economical and effective support method [4].
In the field of bolt support, metal bolts are easy to process and have high fracture elongation, so they have been widely used in the last century [5]. However, with high density, they are prone to corrosion, generating sparks when cutting and damaging the conveyor belt making it risky in support safety [6]. In recent years, fiber reinforced polymer (FRP) bolts gradually replace metal bolts because of their light weight [7], high strength [8], and excellent resistance to corrosion [9] and electromagnetism [10]. And they also do not cause damage to the metal drill bits during the tunneling process by boring machines [11] and effectively avoid the generation of static electricity [12].
Figure 1 shows the FRP bolt support system composed of bolt, conical tray, and nut. During the support process, one end of the FRP bolt is bolted into the soil (surrounding rock) body, and the other is connected to the FRP tray and nut [13]. The tray transmits the thrust generated by the locking torque of the nut to the surrounding rock, producing the initial bolt force. At the same time, pressure is also transmitted from the top of surrounding rock to the bolt to produce the working resistance, which strengthens the surrounding rock and stops the displacement of surrounding rocks. Therefore, adequate mechanical properties are vital for the tray [14]. Previous engineering practice shows that FRP bolts are generally not damaged. The actual damage failures, including bolts slipping out of the nut, cracks at the top and bottom of the tray, etc., almost come from the tray and nut [15]. Therefore, the tray is the weaker component of the bolt support system. And high mechanical properties are the key factors to improve the overall bearing capacity of the support system.

The bolt support structure: (a) conical tray; (b) bolt system; and (c) nut.
Industrially, the shape and structural design of the trays are different. Figure 2 shows the trays and nuts from different Chinese manufacturers, all of them match the 27 mm diameter bolts and have a stiffener structure, while the key structural parameters are not exactly the same. Table 1 shows the dimensions of the trays measured using the vernier calipers, and there are obvious differences in the taper of the inner surface and the height of the stiffeners.
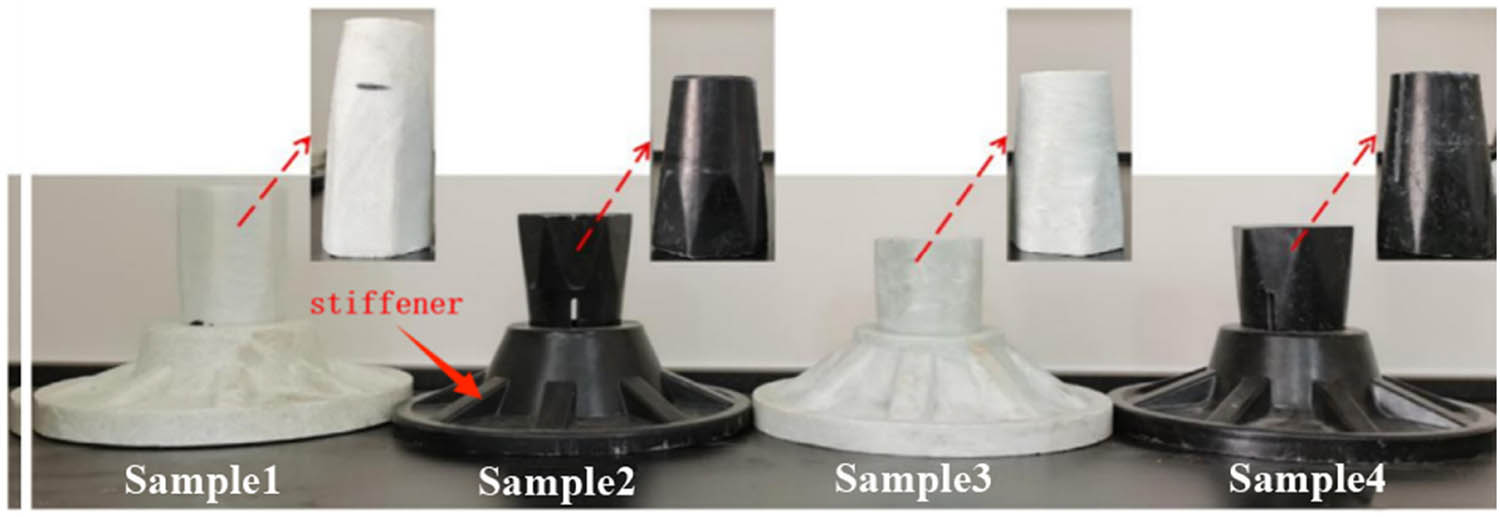
The tray structural design diagrams of different manufacturers.
Dimensional data of trays of different manufacturers
| Tray structure | Sample 1 | Sample 2 | Sample 3 |
|---|---|---|---|
| Inner surface taper | 1/5.0 | 1/4.2 | 1/4.6 |
| Stiffener height/mm | 38 | 45 | 30 |
| Number of stiffeners | 8 | 8 | 8 |
Trays from different manufacturers, although with different structural dimensions, are damaged and lose their load-bearing capacity during the practical support, which cannot meet the current requirements of surrounding rock support [16]. Therefore, scholars have studied the influences of key structural parameters on the performance of trays from the perspective of improving the load-bearing capacity. Wen et al. analyzed the contact stress and displacement between the glass FRP (GFRP) bolt and the nut using the ANSYS digital simulation. It was concluded that the total tensile stress of the nut and the bolt was transferred to the tray in contact with the threaded teeth, and the teeth of the first three rings of the nut bore 70% of the total stress [17]. Carvelli et al. studied the boltage performance of GFRP bolts and tapered trays through experiments and digital simulations, and found that the tapered trays were suitable for partial diameter GFRP bolts, while the GFRP bolts with smaller diameter are prone to shear damage [18]. Jia et al. concluded that the tray cracking or breaking was mainly due to the excessive deformation on the tray edge, and the large deformation caused tangential tensile damage and local cracks, which could be extended to the core of the tray and caused the whole tray to fail [19]. Huang et al. found that the edges of the tray and the two ends of the inner surface were easy to damage [20]. Li et al. calculated the internal force distribution of the tray by using the thin plate bending and cavity expansion theory, compared with the results of the finite element numerical analysis, and concluded that the inner taper surface of the central free surface of the tray was the weakest part, and the ultimate strength of the GFRP tray was 35.81–53.00% of the standard tensile strength of a 20 mm GFRP bolt [21].
The current study points out the hidden dangers of weak mechanical properties of the tray, such as the tapered inner surface of the tray prone to cracking [22]. Although there are some related explorations, the systematic studies on structural optimization, the tapered inner surface of the tray and the height of the stiffener bars are insufficient [23]. This study investigated the effects of tray inner surface taper and stiffener height on the unified load-carrying capacity of trays through theoretical calculations and digital simulations. We tried to provide reliable guidance for the structural design through theoretical calculation and finite element modeling analysis. Therefore, FRP trays could be applied in the scenarios with higher support requirements [24].
2 Materials and methods
2.1 Model establishment
In order to build the numerical analysis model, the calculation domain needs to be determined. As shown in Figure 3a, the support density of bolts in the surrounding rock needs to be determined according to the surrounding rock grade. The bolts are distributed perpendicular to the contour of the roadway, and the high support density is easy to produce a bolt cluster effect; therefore, the tray spacing at the end of the bolt support is set to be 1 m. The calculation domain of the model is as follows: the surrounding rock is a 0.5 m × 0.5 m × 0.5 m cube, and the bolts pass through the center of the tray and are fixed to the surrounding rock by the preload action of the nut, as shown in Figure 3b. The surrounding rock adopts elastomeric intrinsic model and surrounding rock grid, and the purpose of using a larger mesh size is to save arithmetic power and time. The tray, nut, and bolt are modeled according to the actual size, and the mesh size is of 1 mm and encrypted to 0.5 mm for the inner surface of the tray, inner surface of the nut, and thread surface of the bolt. The accuracy of the results is ensured by trial calculation of different sizes of meshes, as shown in Figure 3c–e (Table 2). Table 2 shows the number of units for each section.
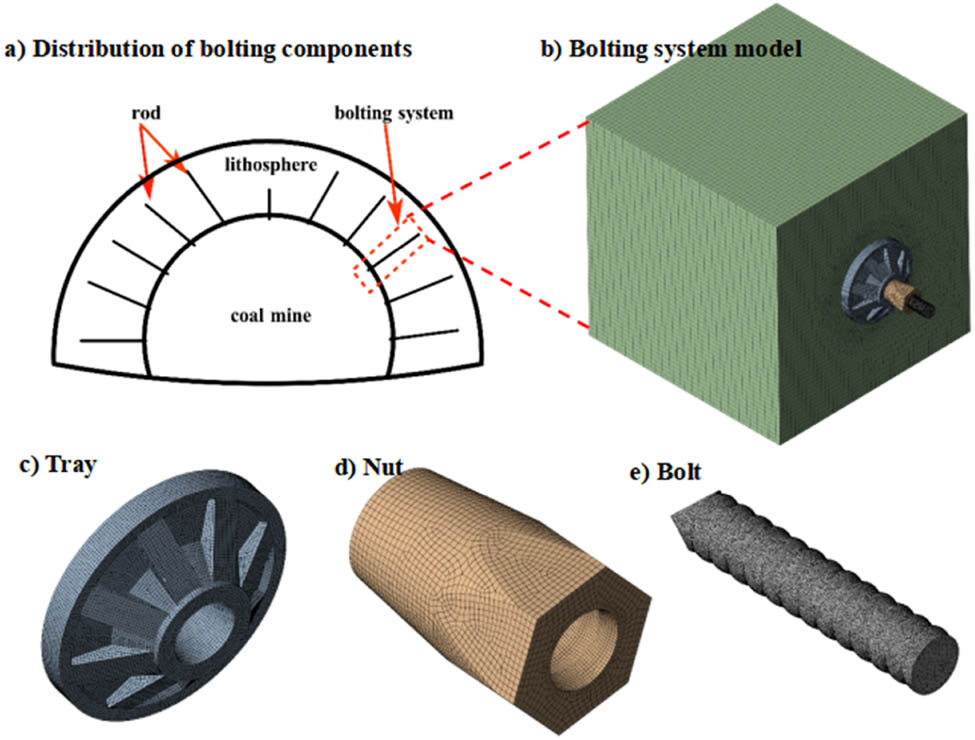
Digital model design and meshing. (a) Distribution of bolting components, (b) bolting system model, (c) tray, (d) nut, and (e) bolt.
Quantity of each part unit (unit: pieces)
| Model parts | Number of grids |
|---|---|
| Bolt | 12,501 |
| Nut | 5,530 |
| Tray | 7,321 |
| Rock | 12,503 |
2.2 Digital model parameters
At present, the commonly used matrix resins for FRP bolt support systems are epoxy resin, vinyl resin, and phenolic resin, and the reinforcing fibers are glass fiber and basalt fiber. In this study, the epoxy resin and glass fiber are selected and their tensile strength, Poisson’s ratio, and Young’s modulus are determined according to the laboratory tests. The parameters of the surrounding rock model refer to GB50086-2015 “China Coal Industry Standard Enclosure Classification,” as shown in Table 3.
Performance parameters of FRPs and rocks
| Parts | Material | Young’s modulus/GPa | Poisson’s ratio | Tensile strength/MPa | Shear strength/MPa |
|---|---|---|---|---|---|
| Tray, nut, and GFRP bars | GFPR | 40 | 0.2 | 850 | 270 |
| Rock | Rock | 4 | 0.35 | / | / |
According to the service conditions of the bolt support system in the underground mine, the constraints of the digital model are set as follows:
By the program default function in the model, frictional constraints are applied to the contact part between the surrounding rock and the bottom of the tray, and fixed constraints are applied to the part that is not in contact with the tray.
By the program default function in the model, frictional contact is applied to the part of the outer surface of the nut in contact with the inner surface of the tray, and the inner surface of the nut with the rib threads, respectively.
The end of bolt is bound to the surrounding rock.
Huang et al. [20] pointed out that for the FRPs, its frictional coefficient is about 0.2 regardless of the fiber orientation. Zhao et al. used a friction coefficient of 0.1 for convenient calculation. In this study, the friction coefficient of the FRP tested in laboratory was 0.2, which was in accordance with that reported in previous papers [13]. An axial force of 200 kN was applied to the bolt along the axial direction to analyze the variation trend of tray deformation and the corresponding shear stress.
3 Results and discussion
3.1 Effects of taper fit of tray/nut on load-carrying capacity
3.1.1 Design of the taper value
The tensile strength of FRP is generally higher than its shear strength. Under high stress conditions, the FRP material will be damaged and lose its load-bearing capacity when it reaches the maximum shear stress. So, this study judges whether the tray materials are damaged via the maximum shear stress value. In order to explore the influence of the inner surface taper, this study designs seven kinds of trays with different inner surface tapers according to the structural parameters and engineering experiences of current commercially available products. And then the changes in the influence of taper on the load-bearing capacity of the trays are analyzed through both theoretical and digital simulations. Figure 4 shows the dimensions of the trays.
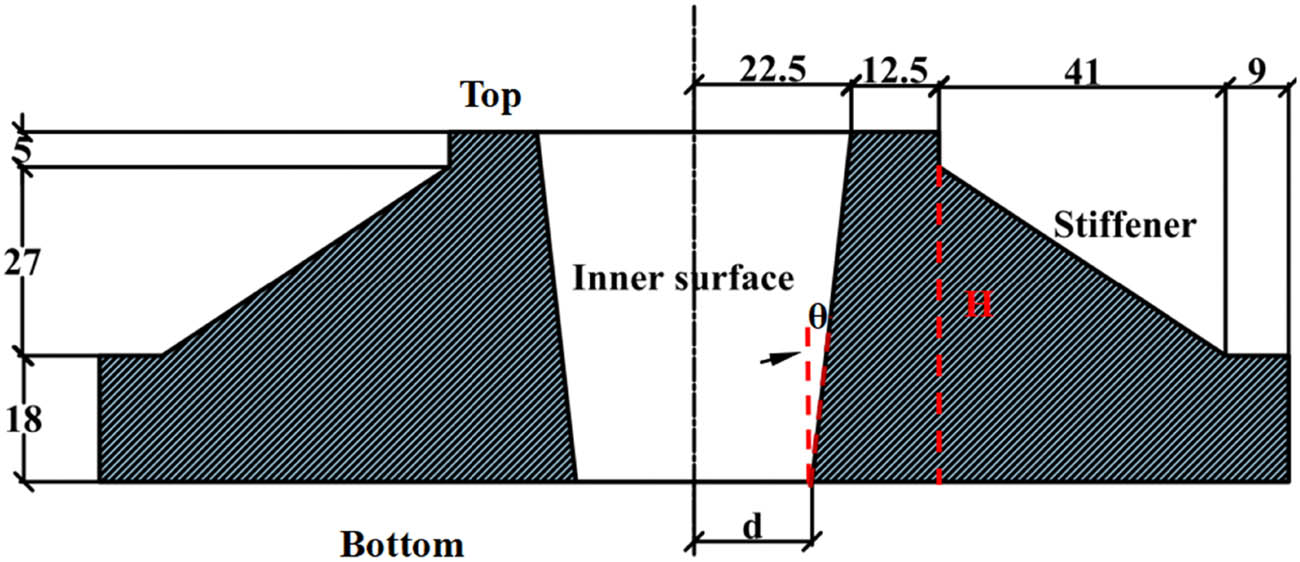
Structure and dimensions of tray.
The formula for calculating the inner surface taper is as follows:
where C is the taper value, D is the top radius of the inner surface (22.5 mm, a fixed value). H is the height of the tray (50 mm, a fixed value), and d is the bottom radius of the inner surface (mm, a variable value).
Table 4 shows the trays’ design parameters, and seven different taper values are determined by adjusting the value of d. The taper of the nut outer surface is in line with the taper of the tray inner surface to ensure that the two surfaces can fit closely.
Design conditions of detailed structural parameters of tray
| Tray | D/mm | d/mm | ρ1/mm | H/mm | C | θ/degree |
|---|---|---|---|---|---|---|
| a | 22.5 | 16.25 | 19.38 | 50 | 1/4.00 | 7.13 |
| b | 22.5 | 16.61 | 19.56 | 50 | 1/4.25 | 6.27 |
| c | 22.5 | 16.94 | 19.72 | 50 | 1/4.5 | 6.15 |
| d | 22.5 | 17.23 | 19.87 | 50 | 1/4.75 | 6.02 |
| e | 22.5 | 17.50 | 20.00 | 50 | 1/5.00 | 5.71 |
| f | 22.5 | 17.74 | 20.12 | 50 | 1/5.25 | 5.44 |
| g | 22.5 | 17.95 | 20.20 | 50 | 1/5.5 | 5.20 |
3.1.2 Force analysis of the inner surface of tray
Referring to the previous studies and engineering experiences, it is well known that the inner surface of tray is prone to cracking when extruded by the nut. So, the force analysis is performed on the stress points of the inner surface of the tray. As shown in Figure 5, to establish the coordinate system, the axial direction of the bolt is designated as Z-axis and the direction perpendicular to Z-axis is X-axis. Assuming that no relative motion occurs between the tray and the nut when the axial force is received, a point P on the inner surface of the tray is subjected to two kinds of forces. One is the static friction force f generated by the friction between the nut and the tray, which is at an angle of θ with the Z-axis. The other is the positive pressure perpendicular to the inner surface of the tray exerted by the nut, which is at an angle of θ with the X-axis. These two forces along the X-axis and the Z-axis are decomposed into a combined force in two directions.
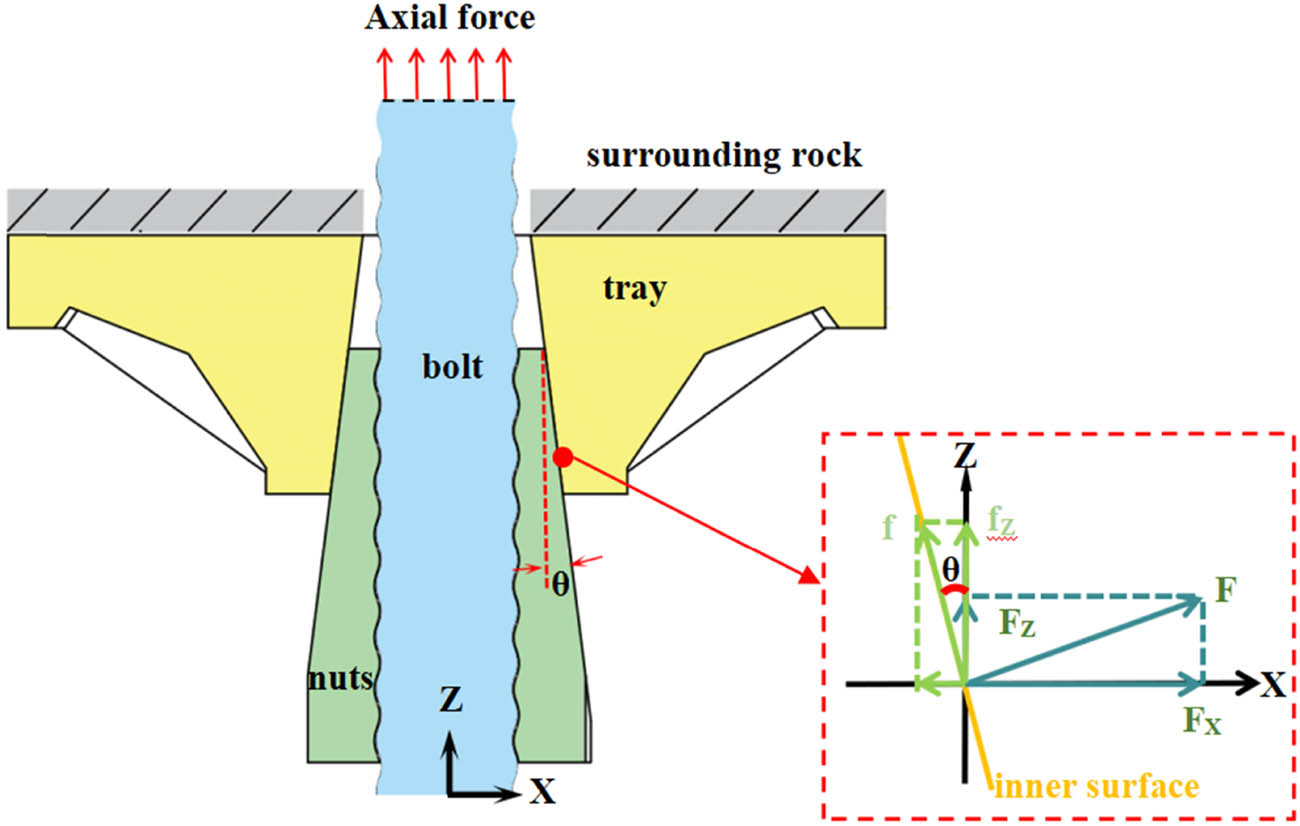
Analysis of the forces on the inner surface of the tray.
where ϕ is the friction angle between the nut and the inner wall, the friction coefficient tan ϕ = 0.2, and θ is the inclination angle of the inner surface of the tray.
From equations (2)–(4), it can be seen that for this point, when an axial force is applied to the bolt, there exists a force on the inner surface of the tray along the positive Z-axis and X-axis. This indicates that under the axial load, two kinds of deformations occur on the inner surface of the tray. One is the movement of the nut toward the bottom of the inner surface of the tray under the F Z-axis. The other is the expansion deformation of the tray caused by the nut squeezing the inner surface of the tray under the F X-axis. As the taper decreases, the value of F X-axis increases eventually accompanied by a decrease in the θ value, increase in the F X value, and a decrease in the f X value. However, for the F Z-axis, its value decreases eventually accompanied by a decrease in the θ value and FZ value, as well as an increase in the f Z value. Among them, the former decreases more drastically. The bottom area of the inner surface of the tray is thicker and the top area is thinner, and the top is the weak point of the tray structure. As the taper value decreases, the F X-axis increases and the top area of the tray is at risk of failure. In order to accurately describe the effect of taper on F X-axis, the cavity expansion model and digital analysis are carried out for further illustration.
3.1.3 Analysis by cavity expansion theory
The cavity expansion model used to describe the effect of taper on the tray requires the following assumptions, as shown in Figure 6.
The inner wall of the central hole of the tray is simplified as a sloping surface, and the angle between the sloping surface and the z-axis is θ.
The nut pressure is uniformly distributed over the entire inner surface of the tray.
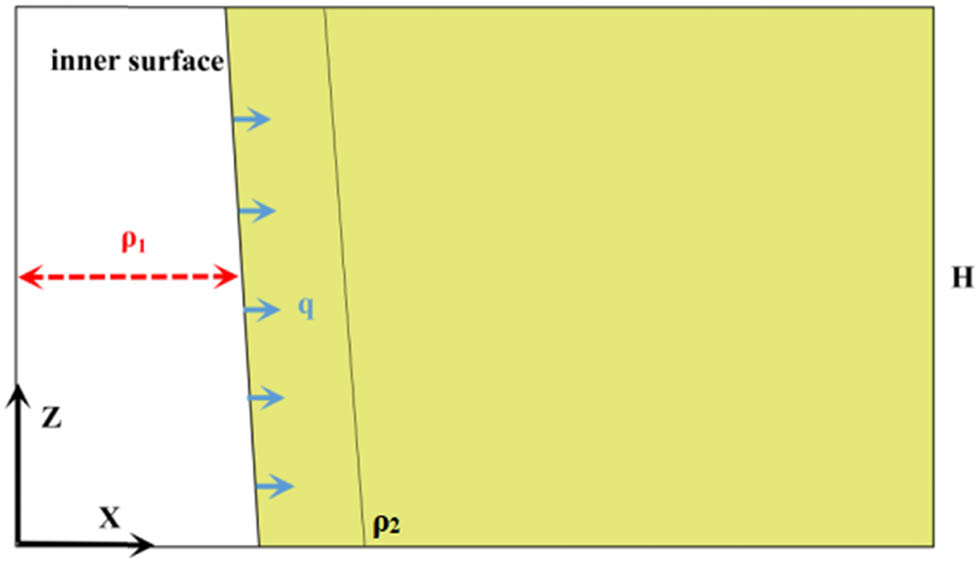
The equivalent model of cavity expansion theory.
In the calculation, the equivalent radius (ρ 1) of trays with different tapers are calculated according to the average value of the radius of the inner surface of the tray, and ρ 1 gradually increased as the taper decreased. The calculated values of the equivalent inner diameter of trays with different tapers are shown in Table 3. The height of the hole H is determined based on the actual height of the inner surface of the tray (50 mm). The maximum radius of the actual top of the tray is 35 mm, and according to the unfavorable factors, the influence range of the small hole expansion is the tray top edge, so the maximum equivalent radius of the cavity expansion effect ρ 2 is 35 mm. From equation (2), the transverse pressure q on the inner surface of the tray subjected to nut squeeze with different taper could be obtained, which is related to θ. According to the previous studies, the expansion stress on the inner surface of the tray subjected to expansion stress pointing to the X-axis could be calculated using equation (5).
where ρ 1 is the equivalent radius of the tray (m), ρ 2 is the maximum equivalent radius affected by the cavity expansion effect (m), ρ is the vertical distance between the top point of the tray and the Z-axis, taking the value range from 19.38 × 10⁻³ to 35 × 10−3 (m), and σ φ is the expansion shear stress generated by the nut extrusion pointing to the X-axis (MPa).
Figure 7 shows that the expansion shear stress generated by the nut squeeze on the inner surface of the tray gradually increases with the decrease in the taper, and the maximum value of the expansion stress of each tray is concentrated on the inner surface of the tray. The shear stress gradually decreased with the increase in ρ 2. Therefore, the smaller the taper is, the higher shear stress the top of the tray is subjected to. This is not beneficial for improving the load-bearing capacity of the tray. The model analysis for the taper is verified by the digital simulation below.
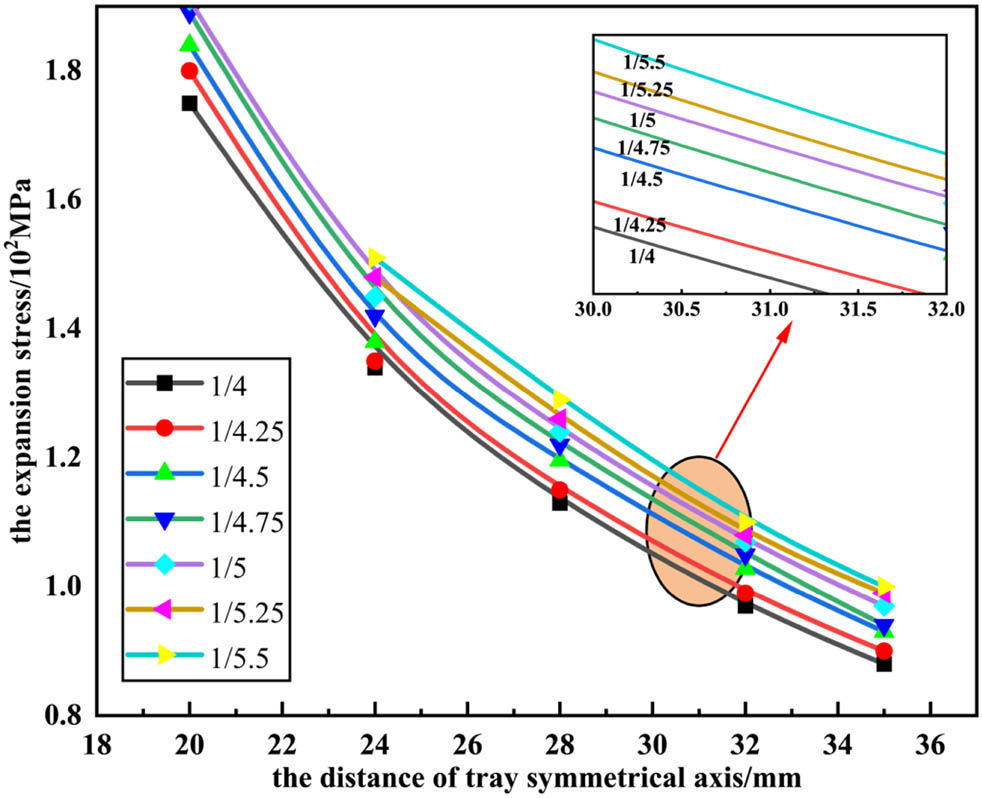
Forces on the inner surface of the tray with different inner surface tapers.
3.1.4 Finite element numerical analysis
The relationship between taper and expansion shear stress was described by cavity expansion theory. However, in the process of performing theoretical calculations, the tray structure is simplified, and the obtained shear stress values still differed from the actual situation, so the tray with different inner surface tapers was analyzed numerically.
Figure 8a shows the state of the tray when it is unstressed, and Figure 8b shows the deformation of the tray after the axial load is applied to the bolt. The tray was significantly deformed in three regions on the inner surface, marked as A, B, and C. In region A, the tray was mainly influenced by the FX-axis and expanded outward along the circumferential direction; region B and region C were mainly deformed by the FZ-axis. The deformation value at the top of the tray was maximum, indicating that this region was the most vulnerable to deformation and damage, and this verified part of the conclusion made during the force analysis.
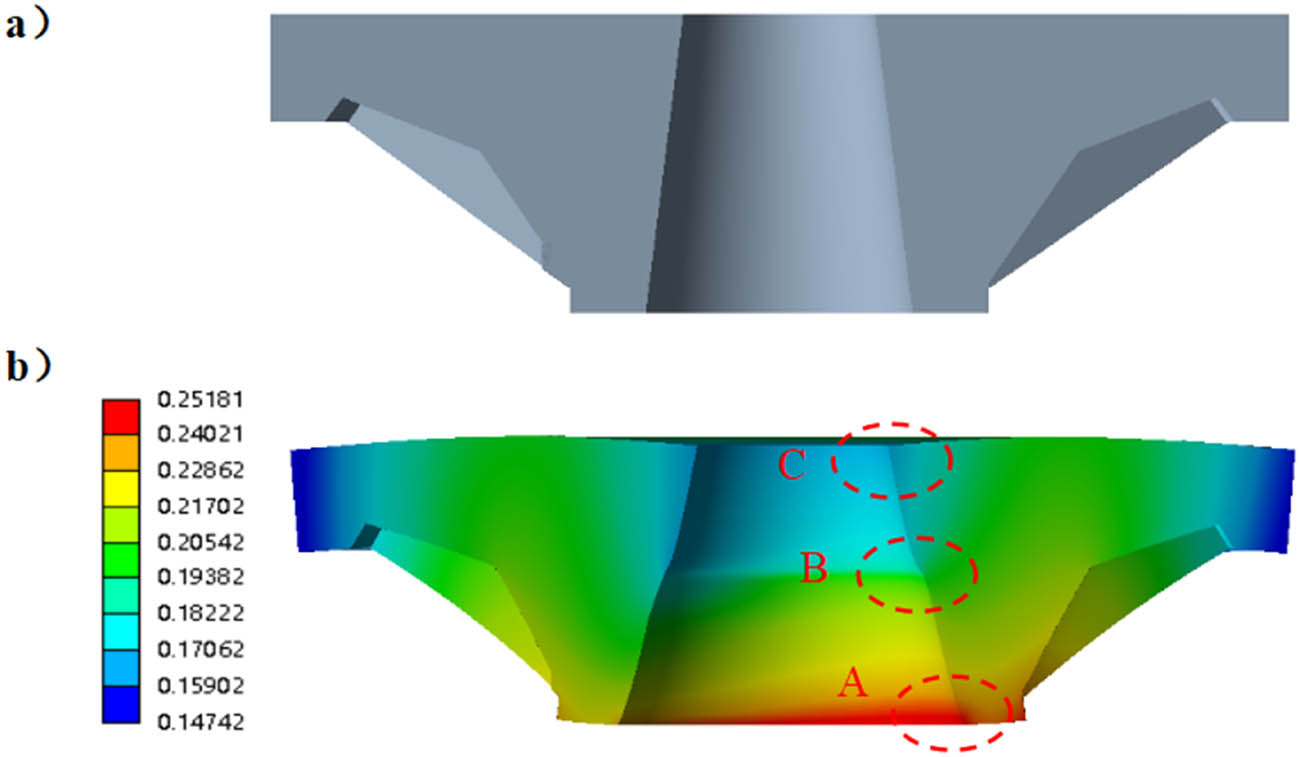
A deformation diagram of the tray after application of the force. (a) top of tray, (b) middle of tray, and (c) bottom of tray.
Figure 9 shows the forms of damage when the axial force was applied to the tray in the laboratory using a universal testing machine. It can be seen that an obvious crack was produced on the inner surface of the tray with the top edge, and the cracks extended from the top to the bottom. The experiment verified that the top of the inner surface of the tray was a weaker part, which was in line with the results of the force analysis.
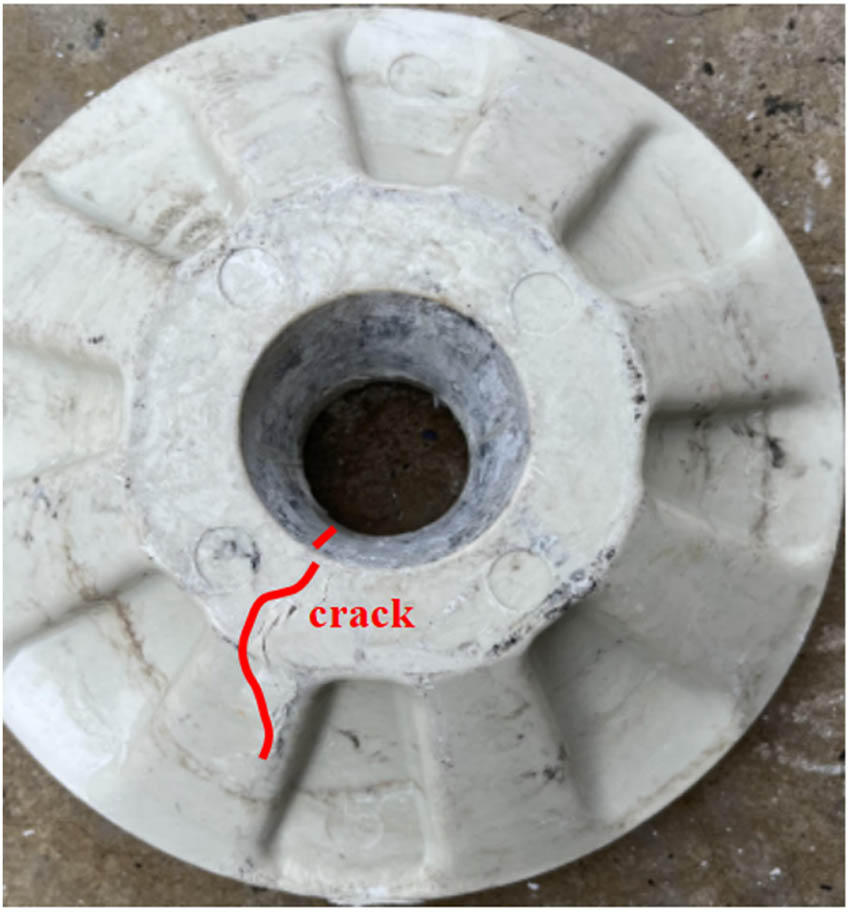
Tray failure diagram under actual working condition.
Figure 10 shows the results of the numerical analysis of the effect of different inner surface tapers on the deformation distribution of the tray. The maximum deformation of the trays with different inner surface tapers was concentrated on the top of the inner surface of the trays, and the deformation of the bottom of the inner surface of the trays was smaller. As the tray taper decreased, the deformation distribution area showed an overall trend of expansion, which indicated that the overall deformation of the tray inner surface increased and the load-bearing capacity decreased.
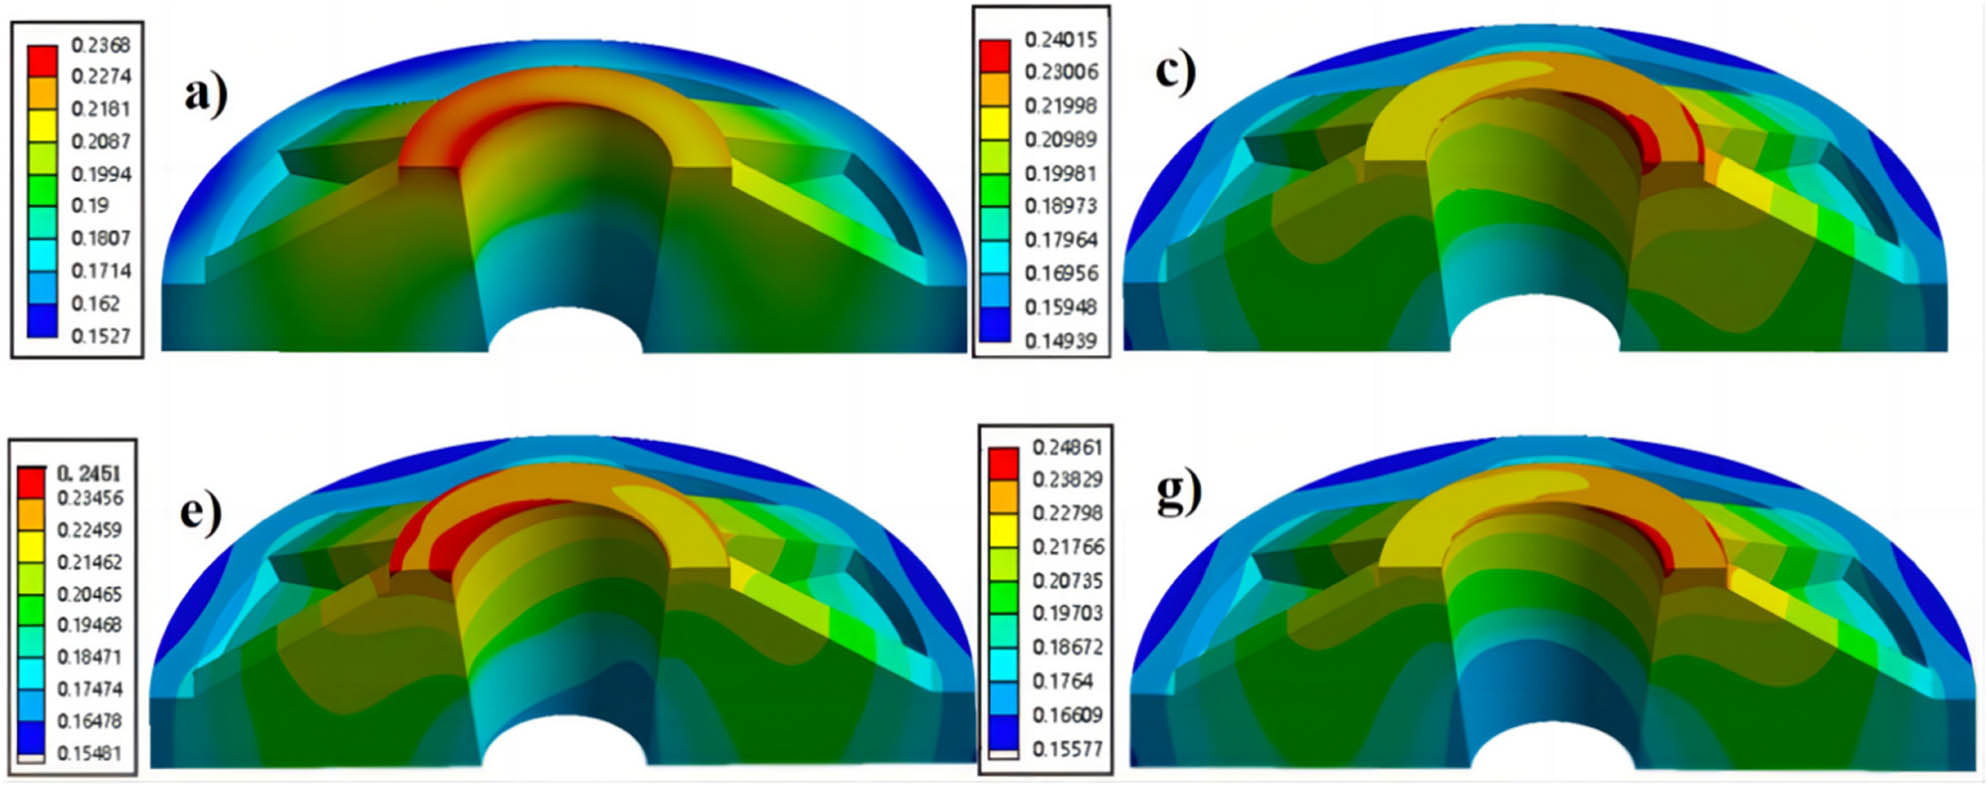
A deformation diagram of trays with different tapers. (a) 1/4, (c) 1/4.5, (e) 1/5, and (g) 1/5.5.
Figure 11 shows the results of the numerical analysis of the effect of different inner surface tapers on the shear stress distribution of the tray. As shown in the figure, the maximum shear stress of trays with different tapers was concentrated on the top of the inner surface of the tray, and the shear stress at the bottom of the inner surface of the tray was smaller. As the taper decreased, the maximum shear stress distribution gradually spread to the bottom of the inner surface, and the area of shear stress distribution on the whole inner surface was larger for trays with 1/5 and 1/5.5 taper. Combined with the distribution law of deformation, it indicated that the smaller the taper, the greater the possibility of damage to the inner surface of the tray, which would lead to the decrease in the bearing capacity of the bolt support system.
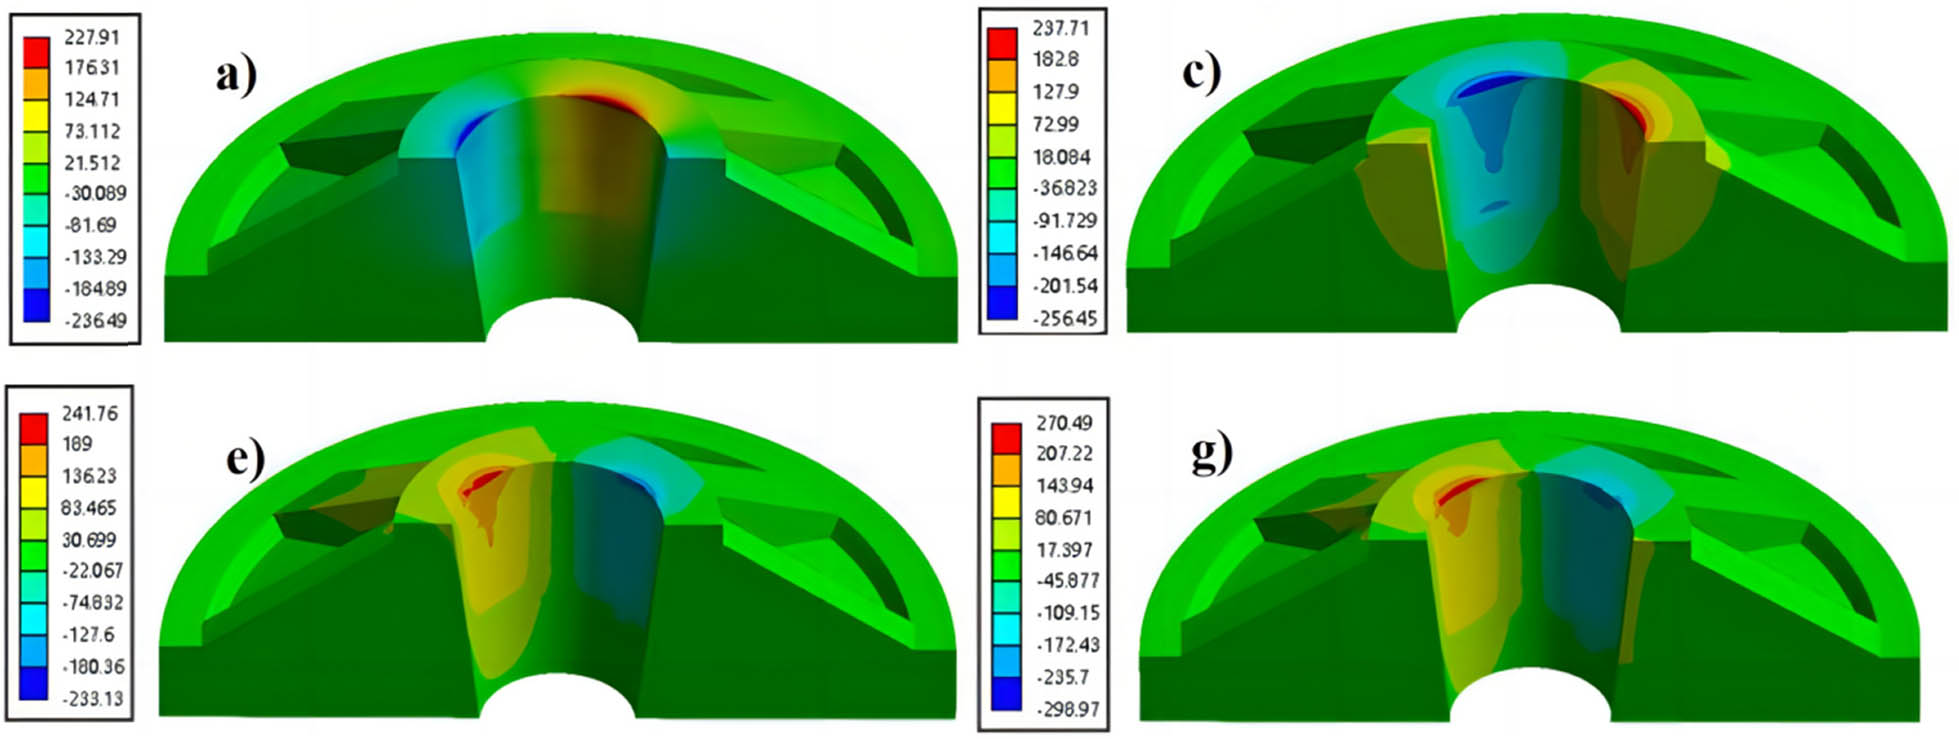
The maximum shear stress profiles of different taper trays. (a) 1/4, (c) 1/4.5, (e) 1/5, and (g) 1/5.5.
The maximum shear strength of the GFPR trays tested in the laboratory was 270 MPa, and these data were used to determine whether the trays failed to rupture when an axial force of 200 kN was applied. Figure 12 shows the trend of deformation and shear stress for seven different tapered trays. It could be seen that as the taper decreased from 1/4 to 1/5.5, the total deformation value of the trays gradually increased from 0.237 to 0.248 mm, an increase of 5%, and the maximum shear stress increased from 227 to 270 MPa, an increase of 19%. When the tray taper was less than 1/5.5, the shear stress of the tray would be greater than 270 MPa, exceeding the ultimate shear strength of the material, and the tray might be damaged, resulting in a support failure. Therefore, the design of the tray taper under this axial force must be less than 1/5.5.
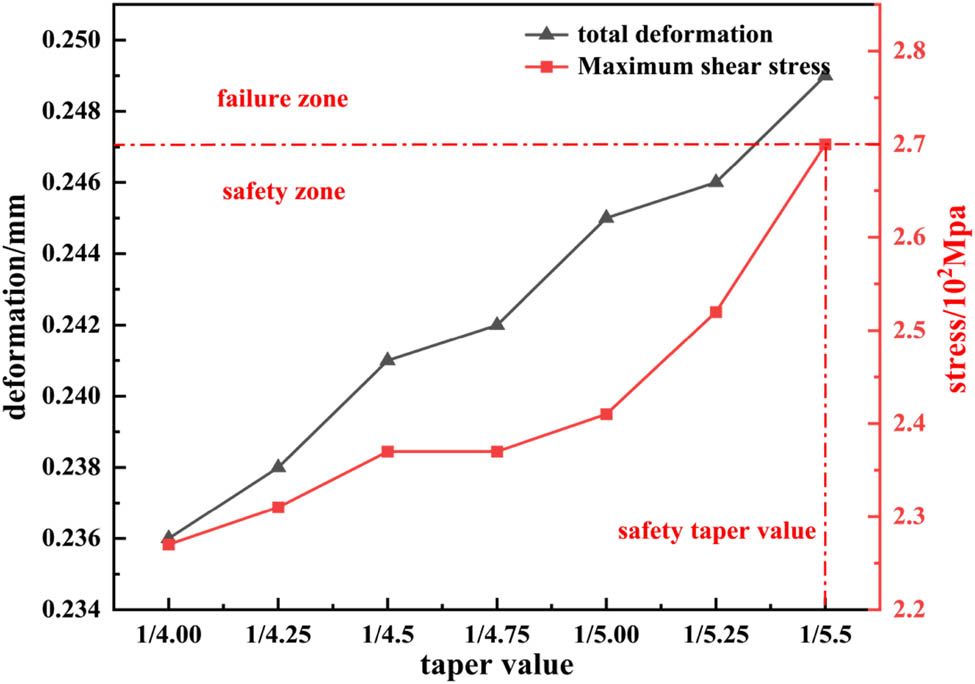
Stress and deformation values for trays with different inner surface tapers.
The shear stress trend obtained by using cavity expansion theory and numerical analysis method was consistent. Both indicated that decreasing taper would lead to an increase in deformation and shear stress on the inner surface of the tray, which was not beneficial for improving the load-bearing capacity of the top of the tray. So, a larger taper value needs to be adopted for the inner surface in the structural design.
3.2 Effect of stiffener height on tray load-bearing capacity
3.2.1 Design of the stiffener height
The stiffener structure is commonly used for commercial trays. As shown in Figure 2, different tray products had eight symmetrical distributions of stiffener, but the height was different. There was a lack of systematic research on the stiffener height previously, so different stiffener heights of the tray were designed in this section, as shown in Table 5. The special-shaped truncated cone type (45-SSTCT) with a stiffener height of 45 mm had a continuous distribution of stiffener and overall stiffener. However, the tray with a stiffener height of 15 mm had no stiffener structure, and the inner surface taper of the trays with different stiffener heights were 1/4.
Design size of stiffener height
| Tray | Height of the top of the stiffener/mm | Equivalent thickness of column shell (δ)/mm |
|---|---|---|
| a | SSTCT | 33 |
| b | 45 | 33 |
| c | 30 | 24 |
| d | 15/no stiffener | 12.5 |
3.2.2 Analysis by column-shell thin-wall theory
Due to the adjustment of the stiffener height, the tray showed a change in thickness from top to bottom. So, the column-shell thin-wall theory was adopted to study the influence of the stiffener height on the bearing capacity of the tray. Figure 13 shows the column-shell thin-wall theory required for simplifying the model by making the following assumptions:
The tray model is simplified by considering the stiffener as a continuous entirety. The top height of the tray (H = 15–45 mm) became a thin wall with a continuous column shell thickness, and the column shell thickness δ is calculated by averaging.
The inner surface is circular in the cross-section along the X-axis, and its average value is taken to obtain the equivalent radius R of the thin wall on the inner surface of the simplified model, of which, R = 19.38 mm for different trays due to the same taper.
The squeezing action q of the nut is uniformly distributed on the inner surface of the tray. In addition, the equivalent thickness is calculated to be the same because the stiffener height is the same for trays a and b.
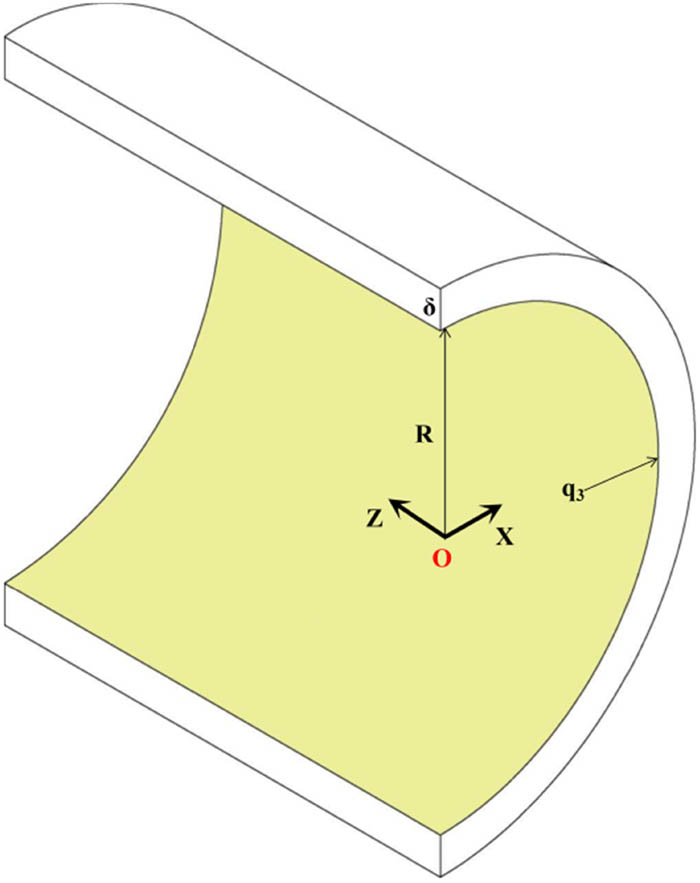
Thin-walled diagram of column and shell.
According to You et al. [24], the moment-free theoretical equilibrium equation and the moment-free theoretical elasticity equation of the column and shell are elastic as follows:
where q 1, q 2, and q 3 are the components of load q on the shell column in the Z-axis direction, annulus of the inner surface, and X-axis direction, respectively (Pa). F T is the flattening force received on the inner surface (N); ν and ω are the deformations of the tray inner surface points in the annulus and X-axis directions (m); and μ is a constant value, and E is the Young’s modulus (Pa).
The inner surface of the tray is mainly subjected to the expansion caused by the extrusion of the nut, so the boundary conditions are set as follows:
Combined with equations (6)–(13), the forces on the inner surface can be deduced from the above equation as follows:
The above equations show that the calculated FX-axis value is merely related to the maximum radius R of the column shell via the thin-wall theory. R is a constant value in this study. However, the expansion deformation ω is related to the thin-wall thickness of the column shell, so the model is only suitable for calculating the relationship between ω and δ. As shown in Figure 14, the larger the wall thickness of the column shell, the smaller the transverse deformation of the tray toward the X-axis, and this guides our numerical simulation study.
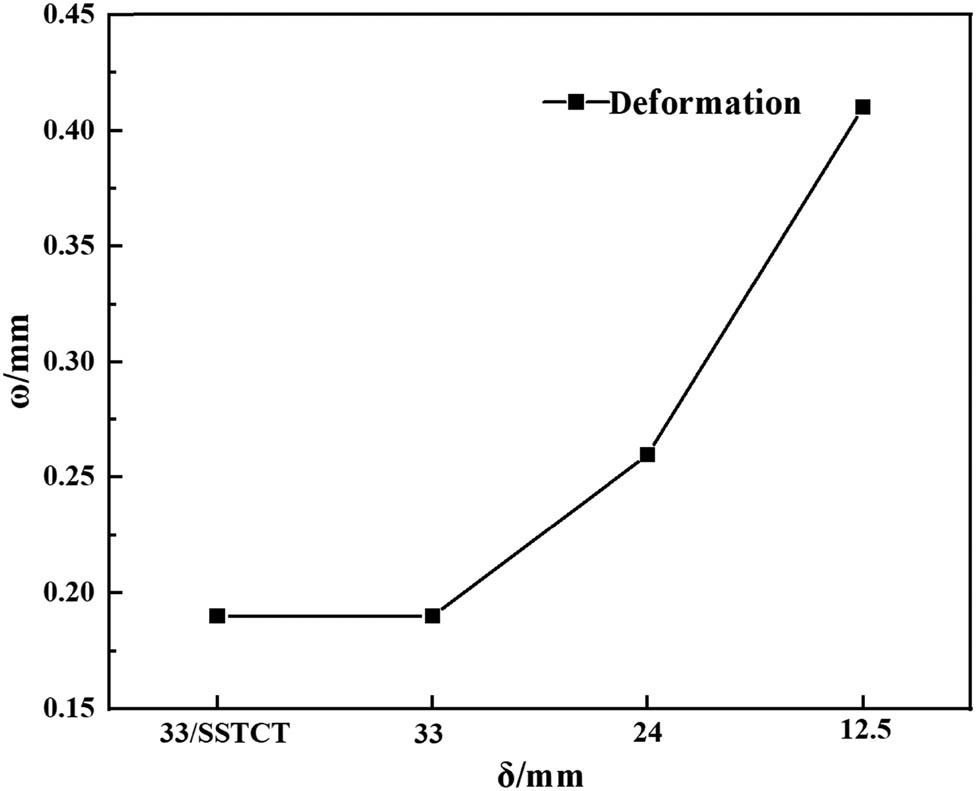
Calculation of deformation values by thin-walled structure of column and shell.
3.2.3 Finite element numerical analysis
Figure 15 shows the results of numerical analysis of the influence of different stiffener heights on the distribution of deformation values of the tray. The maximum displacement was concentrated on the top of the tray, and the distribution of the maximum deformation was widened gradually as the stiffener height was decreased. This indicated that the tendency of the inner surface deformation toward expansion gradually increased. The total deformation of 45-SSTCT was the smallest, suggesting the best bearing capacity. With the decrease in the stiffener height, the deformation of same part of the trays inner surface with different stiffener heights increased, indicating that the trays with larger stiffener heights had a better load-bearing capacity.
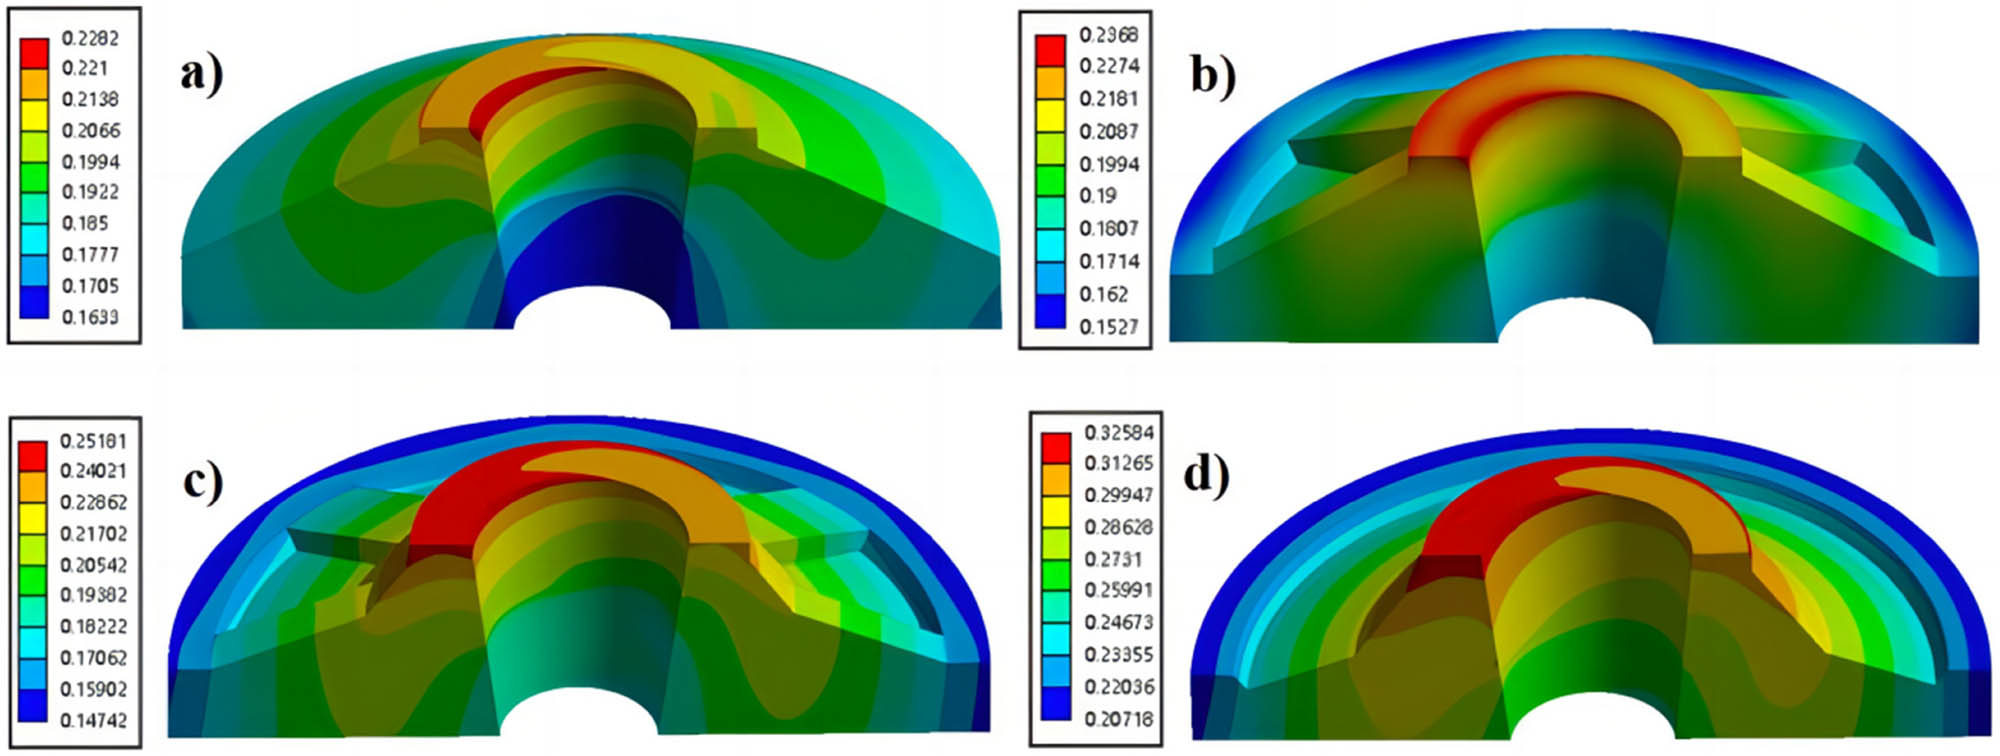
Deformation distributions of the trays with different stiffener heights. (a) 33/SSTCT, (b) 33, (c) 24, and (d) 45.
Figure 16 shows the results of the numerical analysis of the effects of different stiffener heights on the shear stress distribution of the tray. 45-SSTCT had the lowest shear stress. As the stiffener height decreased, the distribution of the maximum shear strength on the inner surface gradually expanded, and the tray without stiffener had a larger shear stress distribution on the entire inner surface, indicating that it was highly vulnerable to damage.
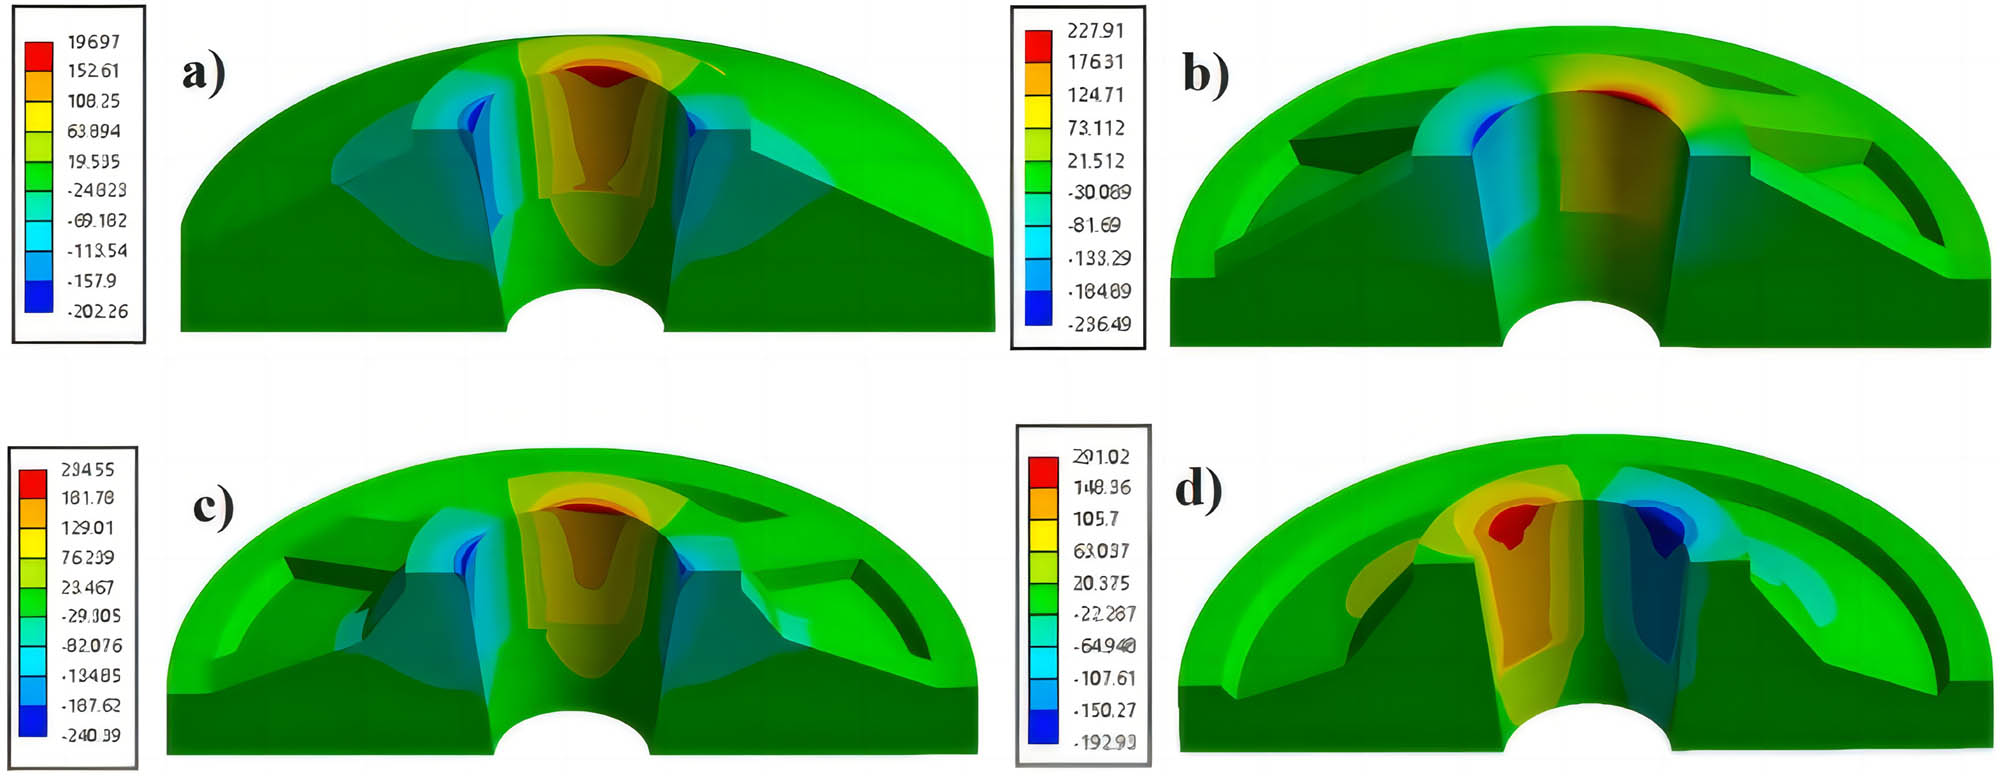
Distribution of maximum shear stress of the trays with different stiffener heights. (a) 33/SSTCT, (b) 33, (c) 24, and (d) 45.
The FRPs with shear strength of 270 MPa were used as a criterion to judge the damages to the trays. Figure 17 shows the trend of deformation and shear stress of trays with different stiffener heights. It could be seen that as the stiffener height was decreased, the shear stress and deformation values of the trays was increased. 45-SSTCT trays had the lowest deformation and shear stress values, and combined with the analysis of the cloud diagrams, it showed that 45-SSTCT had the best load-carrying capacity. As the height of tray stiffener was reduced from 45 to 15 mm (without stiffener structure), the total deformation of the tray was increased from 0.23 to 0.33 mm, by 43%. In consistent with the trend obtained from the thin-walled theory of column and shell, and the maximum shear stress was increased from 197 to 291 MPa, by 48%. Without stiffener structure, the top shear stress reached 290 MPa. This exceeded the maximum shear stress that the material could withstand, and the tray entered the damage zone and lost its load-bearing capacity.
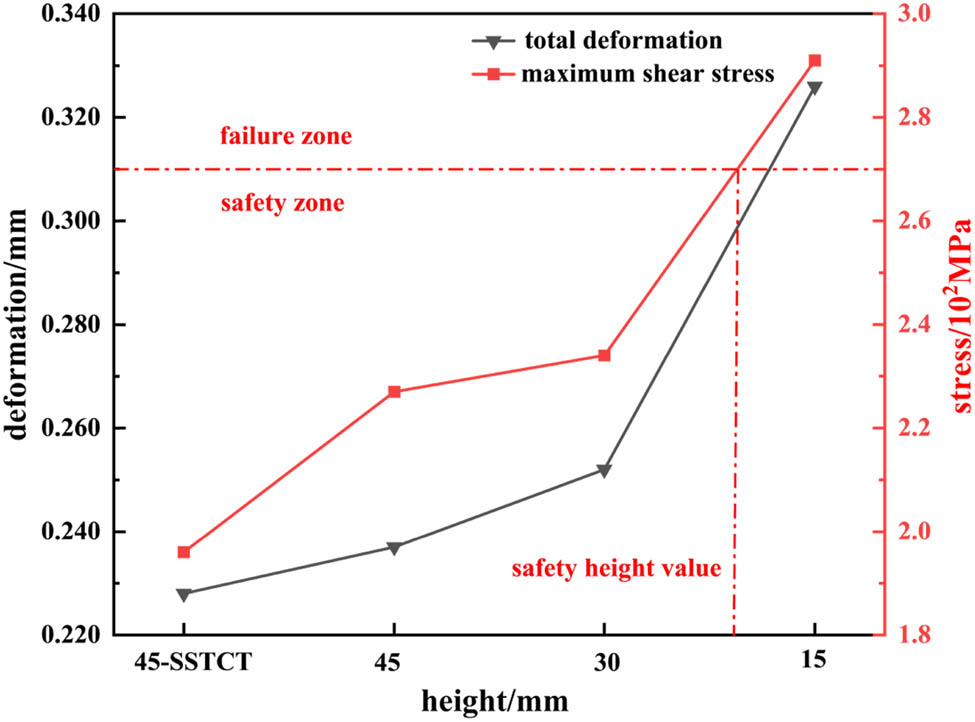
Stress and deformation values of trays with different stiffener heights.
Therefore, the results from the theoretical calculations using the column-shell thin-wall theory were consistent with the trend of deformation values obtained by the numerical analysis method. 45-SSTCT tray had the best load-bearing capacity, and the higher the stiffener height, the higher the load-bearing capacity that could be achieved.
3.2.4 Experimental verification process
This study conducted load capacity tests with different taper values and stiffener heights to demonstrate the accuracy of the numerical simulation analysis.
According to MT/T 1061-2008 “Resin Anchor Glass Fiber Reinforced Plastic bolts and Accessories,” the study tested the influence of different taper values and stiffener height on the load capacity of the composite material bolting system.
Figure 18 shows the required equipment and samples for the experiment. JiangSu KeHuan Innovative Material Co., Ltd was commissioned to produce 27 mm diameter composite bolts with glass fiber and epoxy resin as its main components, and three different taper value trays and nuts with short-cut fibers and resin pre-pregs as its main components, and three different stiffener height trays with short-cut fibers and resin pre-pregs as its main components. The anchoring system was tested using a universal testing machine.
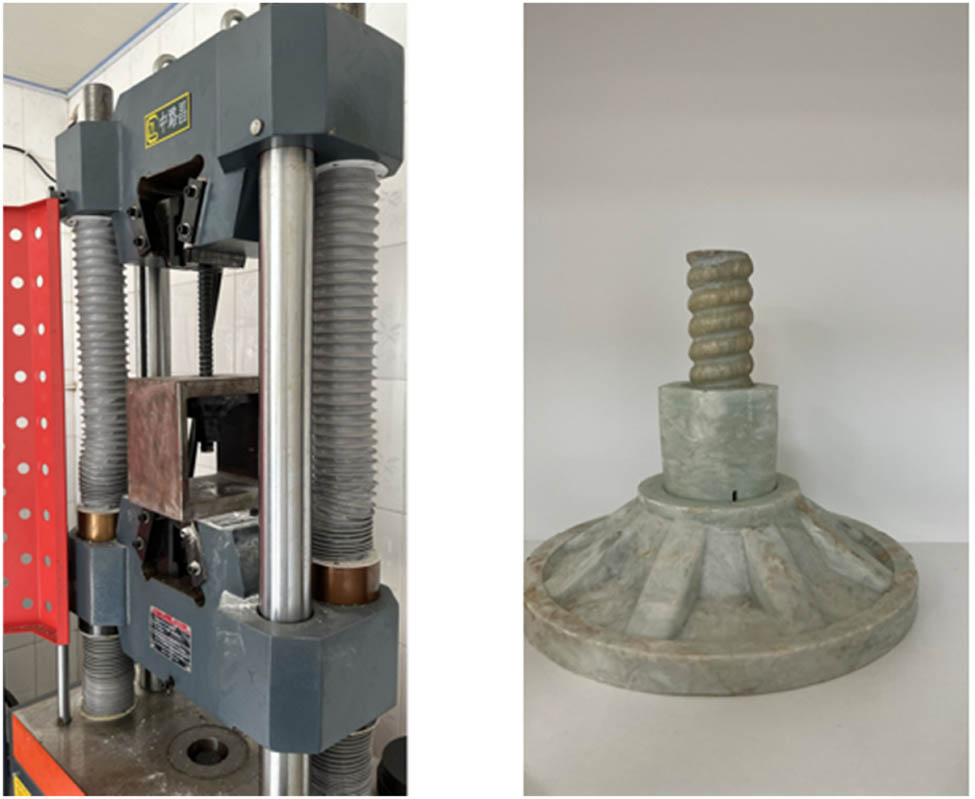
The universal testing machine samples for the experiment.
Three test samples had taper values of 1/4.00, 1/4.75, and 1/5.5, respectively, while the other three samples had stiffener heights of 15, 30, and 45 mm, respectively. The bearing capacity of the bolting system was tested using a loading rate of 500 mm/min. The test results can be used to compare and analyze the effectiveness of the anchor system design.
Figure 19 shows the data obtained through universal testing machine. As the stiffener height value decreases, the bearing capacity of the bolting system decreases, and as the taper value decreases, the bearing capacity of the bolting system also decreases. This is consistent with our theoretical analysis and numerical simulation results.
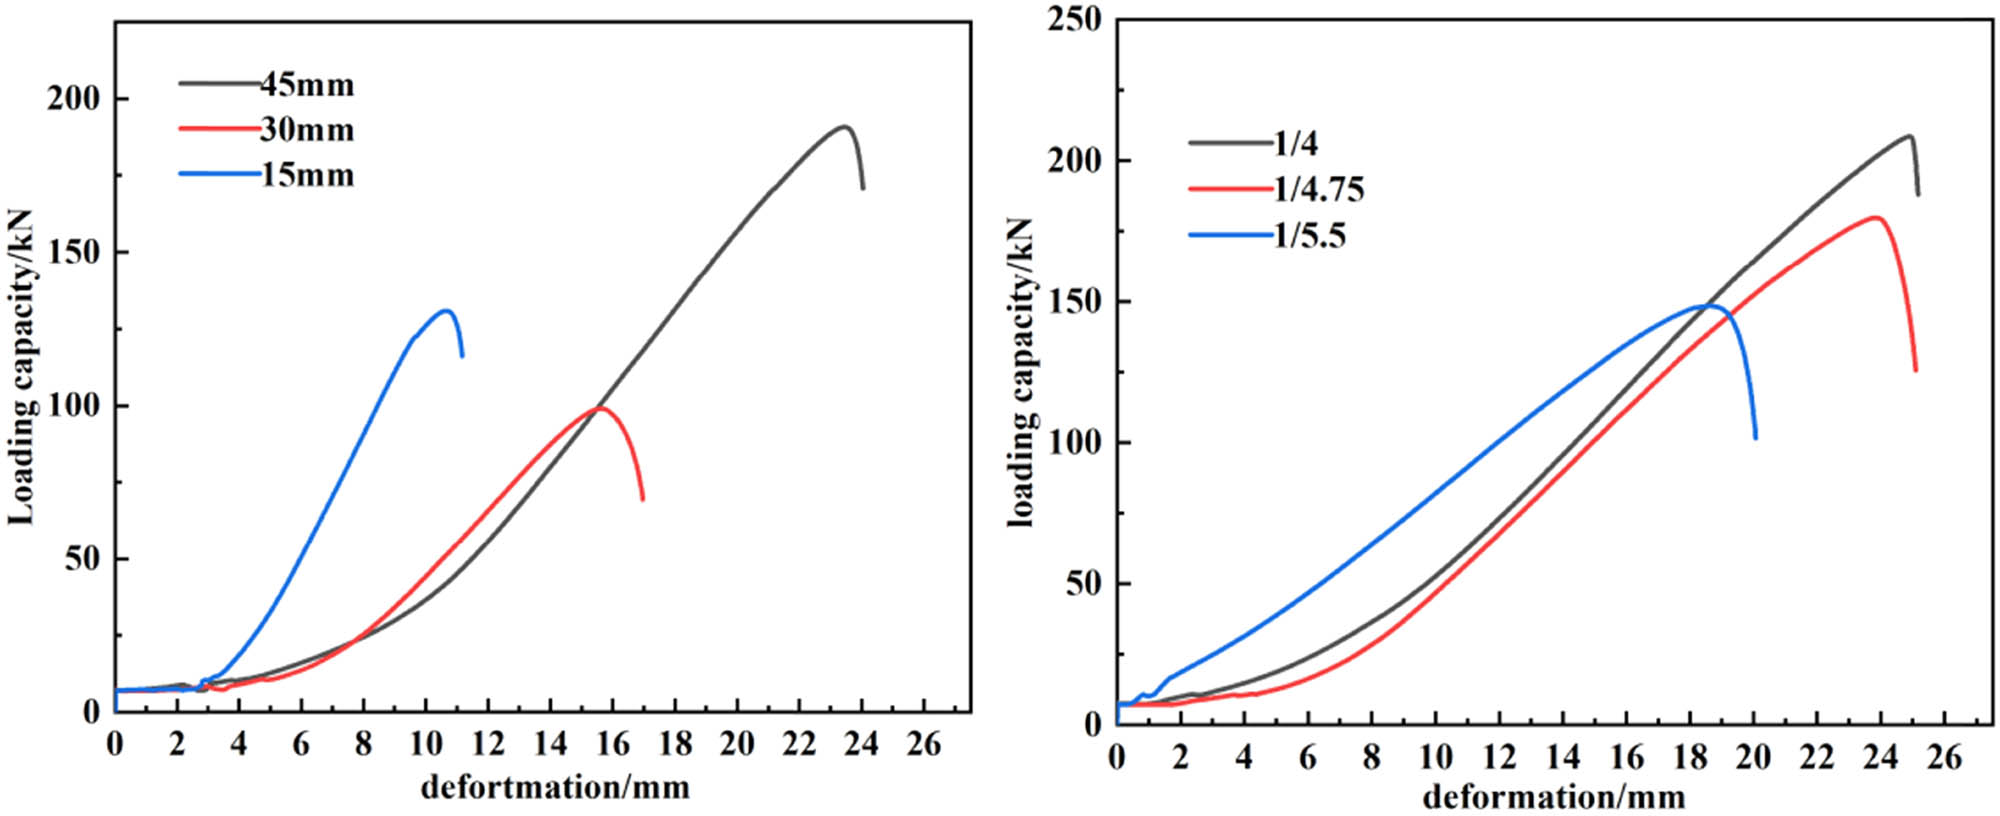
The data obtained through a universal testing machine.
4 Conclusion
In this study, the influences of inner surface taper and stiffener height on the performance of GFPR trays were investigated using the theoretical calculations and finite element numerical analysis method, and the optimized design method was proposed. The main conclusions are as follows:
Through force analysis, theoretical calculation, and numerical analysis, the weak part of the tray when subjected to axial force is found, and the top of the tray is subjected to the maximum deformation and shear stress. This is prone to expansion, deformation, and damage. So, the structural design of the top of the tray needs to be strengthened with emphasis.
Through the mutual corroboration of cavity expansion theory and numerical simulation, it is known that the design of the inner surface of the tray with a large taper value can reduce the deformation and shear stress on the tray top, and when the taper is lower than 1/5, the tray is about to reach the maximum shear stress of the FRP material and has the risk of being damaged. So, when designing the tray structure, increasing the taper value of the inner surface can effectively improve the load-bearing capacity of the tray.
The stiffener height is crucial to the load capacity of the tray as evidenced by the mutual confirmation of the column-shell thin-wall theory and numerical simulation. 45-SSTCT shaped tray design has the best load capacity, when the tray has no stiffener structure. The shear stress is too large and trays are easy to be destroyed, and raising the stiffener height can reduce the maximum shear stress and total deformation of expansion in the weak part of the tray top and improve the load capacity of the tray. The maximum shear stress and the total expansion deformation of the weak part can be reduced by raising the stiffener height, which can improve the tray load capacity.
Due to model simplification in the research on the cavity expansion theory and column shell thin wall theory, it is impossible to get the same calculated values as the numerical analysis. However, both are consistent with the data variation trend obtained from the numerical analysis, which can guide the structural design. The reliability of the conclusions was verified by mechanical tests.
Acknowledgements
The authors acknowledge the support from the Beijing Institute of Technology.
-
Funding information: This research received no external funding.
-
Conflict of interest: The authors declare no conflict of interest.
-
Data availability statement: The data used to support the findings of this study are available from the corresponding author upon request.
References
[1] Chen S, Yang Z, Wang W, Shahrour I. Study on rock bolt reinforcement for a gravity dam foundation. Rock Mech Rock Eng. 2011;45:1151–6. 10.1007/s00603-011-0179-9.Search in Google Scholar
[2] Osinga D. A review of the high performance rock-bolting method and its application in a Nordic mine. Helsinki: Aalto University; 2018. p. 211–6.Search in Google Scholar
[3] Saba N, Jawaid M, Alothman OY, Paridah MT, Hassan A. Recent advances in epoxy resin, natural fiber-reinforced epoxy composites and their applications. J Reinf Plast Comp. 2015;35(6):447–70. 10.1177/0731684415618459.Search in Google Scholar
[4] Guo X, Mao X, Ma C, Huang J. Bolt support mechanism based on elastic theory. Int J Min Sci Technol. 2013;23(4):469–74. 10.1016/j.ijmst.2013.07.002.Search in Google Scholar
[5] McKerrow L, Carman. City tunnel projects -Engineering safety and quality within a constrained environment. Environ Manage. 2001;28(6):819.Search in Google Scholar
[6] Shi J-J, Ma N-J. Research on the mechanical property test of a new high-strength metal bolt. J Coal Sci Eng (China). 2011;17(4):393–6. 10.1007/s12404-011-0406-8.Search in Google Scholar
[7] Guo C, Lin X. Study on the suitability of basalt fiber reinforcement as anchor. J Luoyang Inst Sci Technol. 2012;22(4):4.Search in Google Scholar
[8] Elahi F, Hossain M, Afrin S, Khan M. Study on the mechanical properties of glass fiber reinforced polyester composites. 3rd International Conference on Mechanical Industrial & Energy Engineering (ICMIEE); 2014.Search in Google Scholar
[9] Peng X, Fan M, Hartley J, Al-Zubaidy M. Properties of natural fiber composites made by pultrusion process. J Compos Mater. 2012;46:237–46. 10.1177/0021998311410474.Search in Google Scholar
[10] Zaman A, Gutub SA, Wafa MA. A review on FRP composites applications and durability concerns in the construction sector. J Reinf Plast Comp. 2013;32(24):1966–88. 10.1177/0731684413492868.Search in Google Scholar
[11] Schmidt JW, Bennitz A, Täljsten B, Goltermann P, Pedersen H. Mechanical anchorage of FRP tendons – A literature review. Constr Build Mater. 2012;32:110–21. 10.1016/j.conbuildmat.2011.11.049.Search in Google Scholar
[12] Borgmeier E. Fibre-reinforced plastic (FRP) – an innovative approach to further development of rock bolt technology and the development of new outlets in tunnel and structural engineering. Min Rep. 2014;150(4):200–7. 10.1002/mire.201400027.Search in Google Scholar
[13] Zhao D, Wen S, Wang L, Zhang B, Yang L. Structural parameters and critical anchorage length of tunnel system bolts made of basalt fibre. Constr Build Mater. 2021;310:125081. 10.1016/j.conbuildmat.2021.125081.Search in Google Scholar
[14] Wang W, Song Q, Xu C, Gong H. Mechanical behaviour of fully grouted GFRP rock bolts under the joint action of pre-tension load and blast dynamic load. Tunn Undergr Space Technol. 2018;73:82–91. 10.1016/j.tust.2017.12.007.Search in Google Scholar
[15] Lin X-M, Qin Y, OuYang L-L, Jiang H-Y, Yang J-J, Chen C. Model experimental study on GFRP anchor reinforcement and soil deformation. J Phys Conf Ser. 2021;2044(1):012114. 10.1088/1742-6596/2044/1/012114.Search in Google Scholar
[16] Zou C, Ye Y, Wang W, Wang S. Monitoring analysis on deformation of the roadway bolting by GFRP of Jinshandian IRON MINE. Met Mine. 2011;(425):73–6.Search in Google Scholar
[17] Wen M, Cui X, Wang H. Finite element analysis of screw nut contact of composite bolt. Fiber Reinf Plast Compos. 2008;(4):7–11. 10.3969/j.issn.1003-0999.2008.04.002.Search in Google Scholar
[18] Carvelli V, Fava G, Pisani Marco A. Anchor system for tension testing of large diameter GFRP bars. J Compos Constr. 2009;13(5):344–9. 10.1061/(ASCE)CC.1943-5614.0000027.Search in Google Scholar
[19] Jia X, Li M, Meng X, Wang Y. Failure mechanism analysis and structural optimization of glass fiber reinforced plastics bolting tray based on ANSYS. Saf Coal Mines. 2015;46(5):4. 10.13347/j.cnki.mkaq.2015.05.060.Search in Google Scholar
[20] Huang L, Liu F, Jianjun MA. Ultimate stress and displacement analysis of FRP bolt tray and nut. Low Temp Archit. 2017;39(6):3. 10.13905/j.cnki.dwjz.2017.06.028.Search in Google Scholar
[21] Li J, Du Z, Geng S, Han W, Wu Y, Feng H. Theoretical analysis method of variable thickness GFRP tray. Materials. 2022;15(7):2346. 10.3390/ma15072346.Search in Google Scholar PubMed PubMed Central
[22] Kang H, Wu Y, Gao F, Jiang P, Cheng P, Meng X, et al. Mechanical performances and stress states of rock bolts under varying loading conditions. Tunn Undergr Space Technol. 2016;52:138–46. 10.1016/j.tust.2015.12.005.Search in Google Scholar
[23] Zhang M, Bai X, Li W. Experiment on external anchorage performance for nut-pallet anchorage of GFRP anti-floating anchors. J Cent South Univ. 2016;47:239–46. 10.11817/j.issn.1672-7207.2016.01.033.Search in Google Scholar
[24] You P, Chen H, Li M, Wu Y. A simulative study on the effect of friction coefficient and angle on failure behaviors of GLARE subjected to low-velocity impact. Sci Eng Compos Mater. 2023;30(1):20220194. 10.1515/secm-2022-0194.Search in Google Scholar
© 2024 the author(s), published by De Gruyter
This work is licensed under the Creative Commons Attribution 4.0 International License.
Articles in the same Issue
- Regular Articles
- Research on damage evolution mechanisms under compressive and tensile tests of plain weave SiCf/SiC composites using in situ X-ray CT
- Structural optimization of trays in bolt support systems
- Continuum percolation of the realistic nonuniform ITZs in 3D polyphase concrete systems involving the aggregate shape and size differentiation
- Multiscale water diffusivity prediction of plain woven composites considering void defects
- The application of epoxy resin polymers by laser induction technologies
- Analysis of water absorption on the efficiency of bonded composite repair of aluminum alloy panels
- Experimental research on bonding mechanical performance of the interface between cementitious layers
- A study on the effect of microspheres on the freeze–thaw resistance of EPS concrete
- Influence of Ti2SnC content on arc erosion resistance in Ag–Ti2SnC composites
- Cement-based composites with ZIF-8@TiO2-coated activated carbon fiber for efficient removal of formaldehyde
- Microstructure and chloride transport of aeolian sand concrete under long-term natural immersion
- Simulation study on basic road performance and modification mechanism of red mud modified asphalt mixture
- Extraction and characterization of nano-silica particles to enhance mechanical properties of general-purpose unsaturated polyester resin
- Roles of corn starch and gellan gum in changing of unconfined compressive strength of Shanghai alluvial clay
- A review on innovative approaches to expansive soil stabilization: Focussing on EPS beads, sand, and jute
- Experimental investigation of the performances of thick CFRP, GFRP, and KFRP composite plates under ballistic impact
- Preparation and characterization of titanium gypsum artificial aggregate
- Characteristics of bulletproof plate made from silkworm cocoon waste: Hybrid silkworm cocoon waste-reinforced epoxy/UHMWPE composite
- Experimental research on influence of curing environment on mechanical properties of coal gangue cementation
- Multi-objective optimization of machining variables for wire-EDM of LM6/fly ash composite materials using grey relational analysis
- Synthesis and characterization of Ag@Ni co-axial nanocables and their fluorescent and catalytic properties
- Beneficial effect of 4% Ta addition on the corrosion mitigation of Ti–12% Zr alloy after different immersion times in 3.5% NaCl solutions
- Study on electrical conductive mechanism of mayenite derivative C12A7:C
- Fast prediction of concrete equivalent modulus based on the random aggregate model and image quadtree SBFEM
- Research on uniaxial compression performance and constitutive relationship of RBP-UHPC after high temperature
- Experimental analysis of frost resistance and failure models in engineered cementitious composites with the integration of Yellow River sand
- Influence of tin additions on the corrosion passivation of TiZrTa alloy in sodium chloride solutions
- Microstructure and finite element analysis of Mo2C-diamond/Cu composites by spark plasma sintering
- Low-velocity impact response optimization of the foam-cored sandwich panels with CFRP skins for electric aircraft fuselage skin application
- Research on the carbonation resistance and improvement technology of fully recycled aggregate concrete
- Study on the basic properties of iron tailings powder-desulfurization ash mine filling cementitious material
- Preparation and mechanical properties of the 2.5D carbon glass hybrid woven composite materials
- Improvement on interfacial properties of CuW and CuCr bimetallic materials with high-entropy alloy interlayers via infiltration method
- Investigation properties of ultra-high performance concrete incorporating pond ash
- Effects of binder paste-to-aggregate ratio and polypropylene fiber content on the performance of high-flowability steel fiber-reinforced concrete for slab/deck overlays
- Interfacial bonding characteristics of multi-walled carbon nanotube/ultralight foamed concrete
- Classification of damping properties of fabric-reinforced flat beam-like specimens by a degree of ondulation implying a mesomechanic kinematic
- Influence of mica paper surface modification on the water resistance of mica paper/organic silicone resin composites
- Impact of cooling methods on the corrosion behavior of AA6063 aluminum alloy in a chloride solution
- Wear mechanism analysis of internal chip removal drill for CFRP drilling
- Investigation on acoustic properties of metal hollow sphere A356 aluminum matrix composites
- Uniaxial compression stress–strain relationship of fully aeolian sand concrete at low temperatures
- Experimental study on the influence of aggregate morphology on concrete interfacial properties
- Intelligent sportswear design: Innovative applications based on conjugated nanomaterials
- Research on the equivalent stretching mechanical properties of Nomex honeycomb core considering the effect of resin coating
- Numerical analysis and experimental research on the vibration performance of concrete vibration table in PC components
- Assessment of mechanical and biological properties of Ti–31Nb–7.7Zr alloy for spinal surgery implant
- Theoretical research on load distribution of composite pre-tightened teeth connections embedded with soft layers
- Coupling design features of material surface treatment for ceramic products based on ResNet
- Optimizing superelastic shape-memory alloy fibers for enhancing the pullout performance in engineered cementitious composites
- Multi-scale finite element simulation of needle-punched quartz fiber reinforced composites
- Thermo-mechanical coupling behavior of needle-punched carbon/carbon composites
- Influence of composite material laying parameters on the load-carrying capacity of type IV hydrogen storage vessel
- Review Articles
- Effect of carbon nanotubes on mechanical properties of aluminum matrix composites: A review
- On in-house developed feedstock filament of polymer and polymeric composites and their recycling process – A comprehensive review
- Research progress on freeze–thaw constitutive model of concrete based on damage mechanics
- A bibliometric and content analysis of research trends in paver blocks: Mapping the scientific landscape
- Bibliometric analysis of stone column research trends: A Web of Science perspective